1. Introduction
Materials with a positive temperature coefficient of electrical resistance (PTCR) have been widely used as temperature switches or thermistors in overload protectors, self-regulating heaters, starter motors, and resettable fuses [
1,
2,
3]. Their resistances could grow exponentially at
Tc (Curie temperature) or in a narrow temperature span near the phase transformation temperature. Up to now, the switching temperatures of commercial PTCR thermistors are generally higher than 50 °C (which depends on the Curie temperature or the phase transformation temperature of the PTCR materials). However, the demand for low-switching-temperature PTCR materials (<10 °C and even lower) in science technologies and industries is increasing [
4]. For example, recently, in-battery heating systems and temperature control systems have been proposed to resist the dysfunctions of lithium-ion batteries that occur in low-temperature environments. As the most promising electrochemical energy storage system, lithium-ion batteries suffer from a series of performance degradations in low-temperature environments (<−10 °C and even lower), such as reduced power performance, significant decreases in charging and discharging efficiency, and reduced cycle life [
5,
6]. To maintain satisfactory performance for the battery, PTCR thermistors with a low switching temperature (typically −10 °C or −20 °C) are expected to serve as heaters and/or temperature switches [
7,
8,
9,
10]. In addition, in the aerospace industry, low-switching-temperature PTCR thermistors (<−10 °C) are also necessary for electronic equipment and thermal control systems applied in low-temperature environments [
11]. Accordingly, the research of PTCR materials with low switching temperatures has great potential application [
7,
10,
11,
12].
PTCR materials are mainly categorized into three classes: BaTiO
3 ceramics, V
2O
3 ceramics, and polymer composites. Polymer composites, as relatively new materials that are still in development, possess the advantages of low resistivity, large resistance jumps, and an adjustable switch temperature [
13]. The PTCR effect of polymer composites stems from the break in the conductive network due to volumetric expansion as the polymer matrix experiences a glassy transition, which leads to a rapid increase in the resistance of polymer composites [
14,
15,
16]. Regrettably, the practical application scenarios of polymer PTCR materials are somewhat restricted. For instance, the issue of PTC reproducibility caused by the irreversible self-aggregation of conductive fillers and the random reconstruction of conductive networks need to be addressed. In addition, most of the low-switching-temperature polymer PTCR materials that have been reported exhibit a strong negative temperature coefficient effect in the non-leap temperature region [
17].
The PTCR effect of V
2O
3 ceramics can be easily achieved by metal–semiconductor transition in Cr doping (V
1−xCr
x)
2O
3 ceramics. Lots of reported research suggests that (V
1−xCr
x)
2O
3 ceramics could be a potential option in those environments with temperatures below −30 °C. They show very small electric resistivity before the transition temperature due to their metal conductivity nature. Normally, the resistance jumps of (V
1−xCr
x)
2O
3 ceramics could reach to 2~3 orders of magnitude around their transition temperature from −40 °C to −30 °C. However, with the increase in the transition temperature, the resistance jump tends to decrease significantly [
18,
19]. Furthermore, the PTCR characteristics in (V
1−xCr
x)
2O
3 ceramics are always accompanied by large and insurmountable thermal hysteresis phenomena, owing to the residual stresses of the semiconductor phase [
18,
19].
The PTCR effect in BaTiO
3 ceramics originates from the ferroelectric–paraelectric phase transition. The resistivity of the semiconducting BaTiO
3 ceramics would show a remarkable jump during the phase transition. As traditional PTCR materials, BaTiO
3 ceramics show strong PTCR performance, stable working performance, and an easy adjustment of the
Tc ranging from 50 °C to 135 °C. Generally, the phase transition temperature (
Tc) of BaTiO
3 ceramics could be moved to low temperatures by doping Sr
2+, Zr
4+, and/or Sn
4+ [
20]. However, compared with those of
Tc higher than 50 °C, low-
Tc (<10 °C) PTCR BaTiO
3-based ceramics are seldom reported. A major obstacle is that the PTC performance would be weakened when the Curie temperature is shifted to low temperatures (<25 °C). For instance, the phase transition temperature span (
) would widen and the resistance jump would decrease. Encouragingly, some progress has been reported. Yu made significant progress on Ba
1−xSr
xTiO
3-based PTCR materials with a
Tc of 18 °C by Mn-Y co-doping [
21]. The ceramics exhibited a resistivity jump of more than four orders of magnitude, and the resistance temperature coefficient reached 10.7%/°C. Mn improved the surface acceptor state on the grain boundaries, while Y contributed to semiconducting the ceramic in the low-temperature region. Unfortunately, the phase transition temperature span (Δ
T) was almost 100 °C. For practical use, the value of Δ
T still needs to be narrowed.
Based on the research that La-doped BaTiO
3 ceramics show a pronounced PTCR effect [
22,
23,
24], and that a low content of Bi
0.5Na
0.5TiO
3 (BNT) could enhance the PTCR effect by increasing the acceptor density states [
25,
26,
27,
28,
29,
30], in this work, (Ba
0.55Sr
0.45)
1−xLa
xTi
1.01O
3-yBNT PTCR ceramics were designed and fabricated. The aim of this work was to achieve low-Curie-temperature (around −15 °C) PTCR ceramics which possess a large resistance jump, as well as a narrow resistance jump temperature span. The influence of the La
3+ content on the PTCR performance was investigated experimentally. Furthermore, trace amounts of BNT were introduced to enhance the PTCR performance of the system. Subsequently, the effects of BNT on the PTCR performance of ceramics were investigated systematically.
3. Results and Discussion
Figure 1a–e show the temperature-dependent resistivity curves of the prepared (Ba
0.55Sr
0.45)
(1−x)La
xTi
1.01O
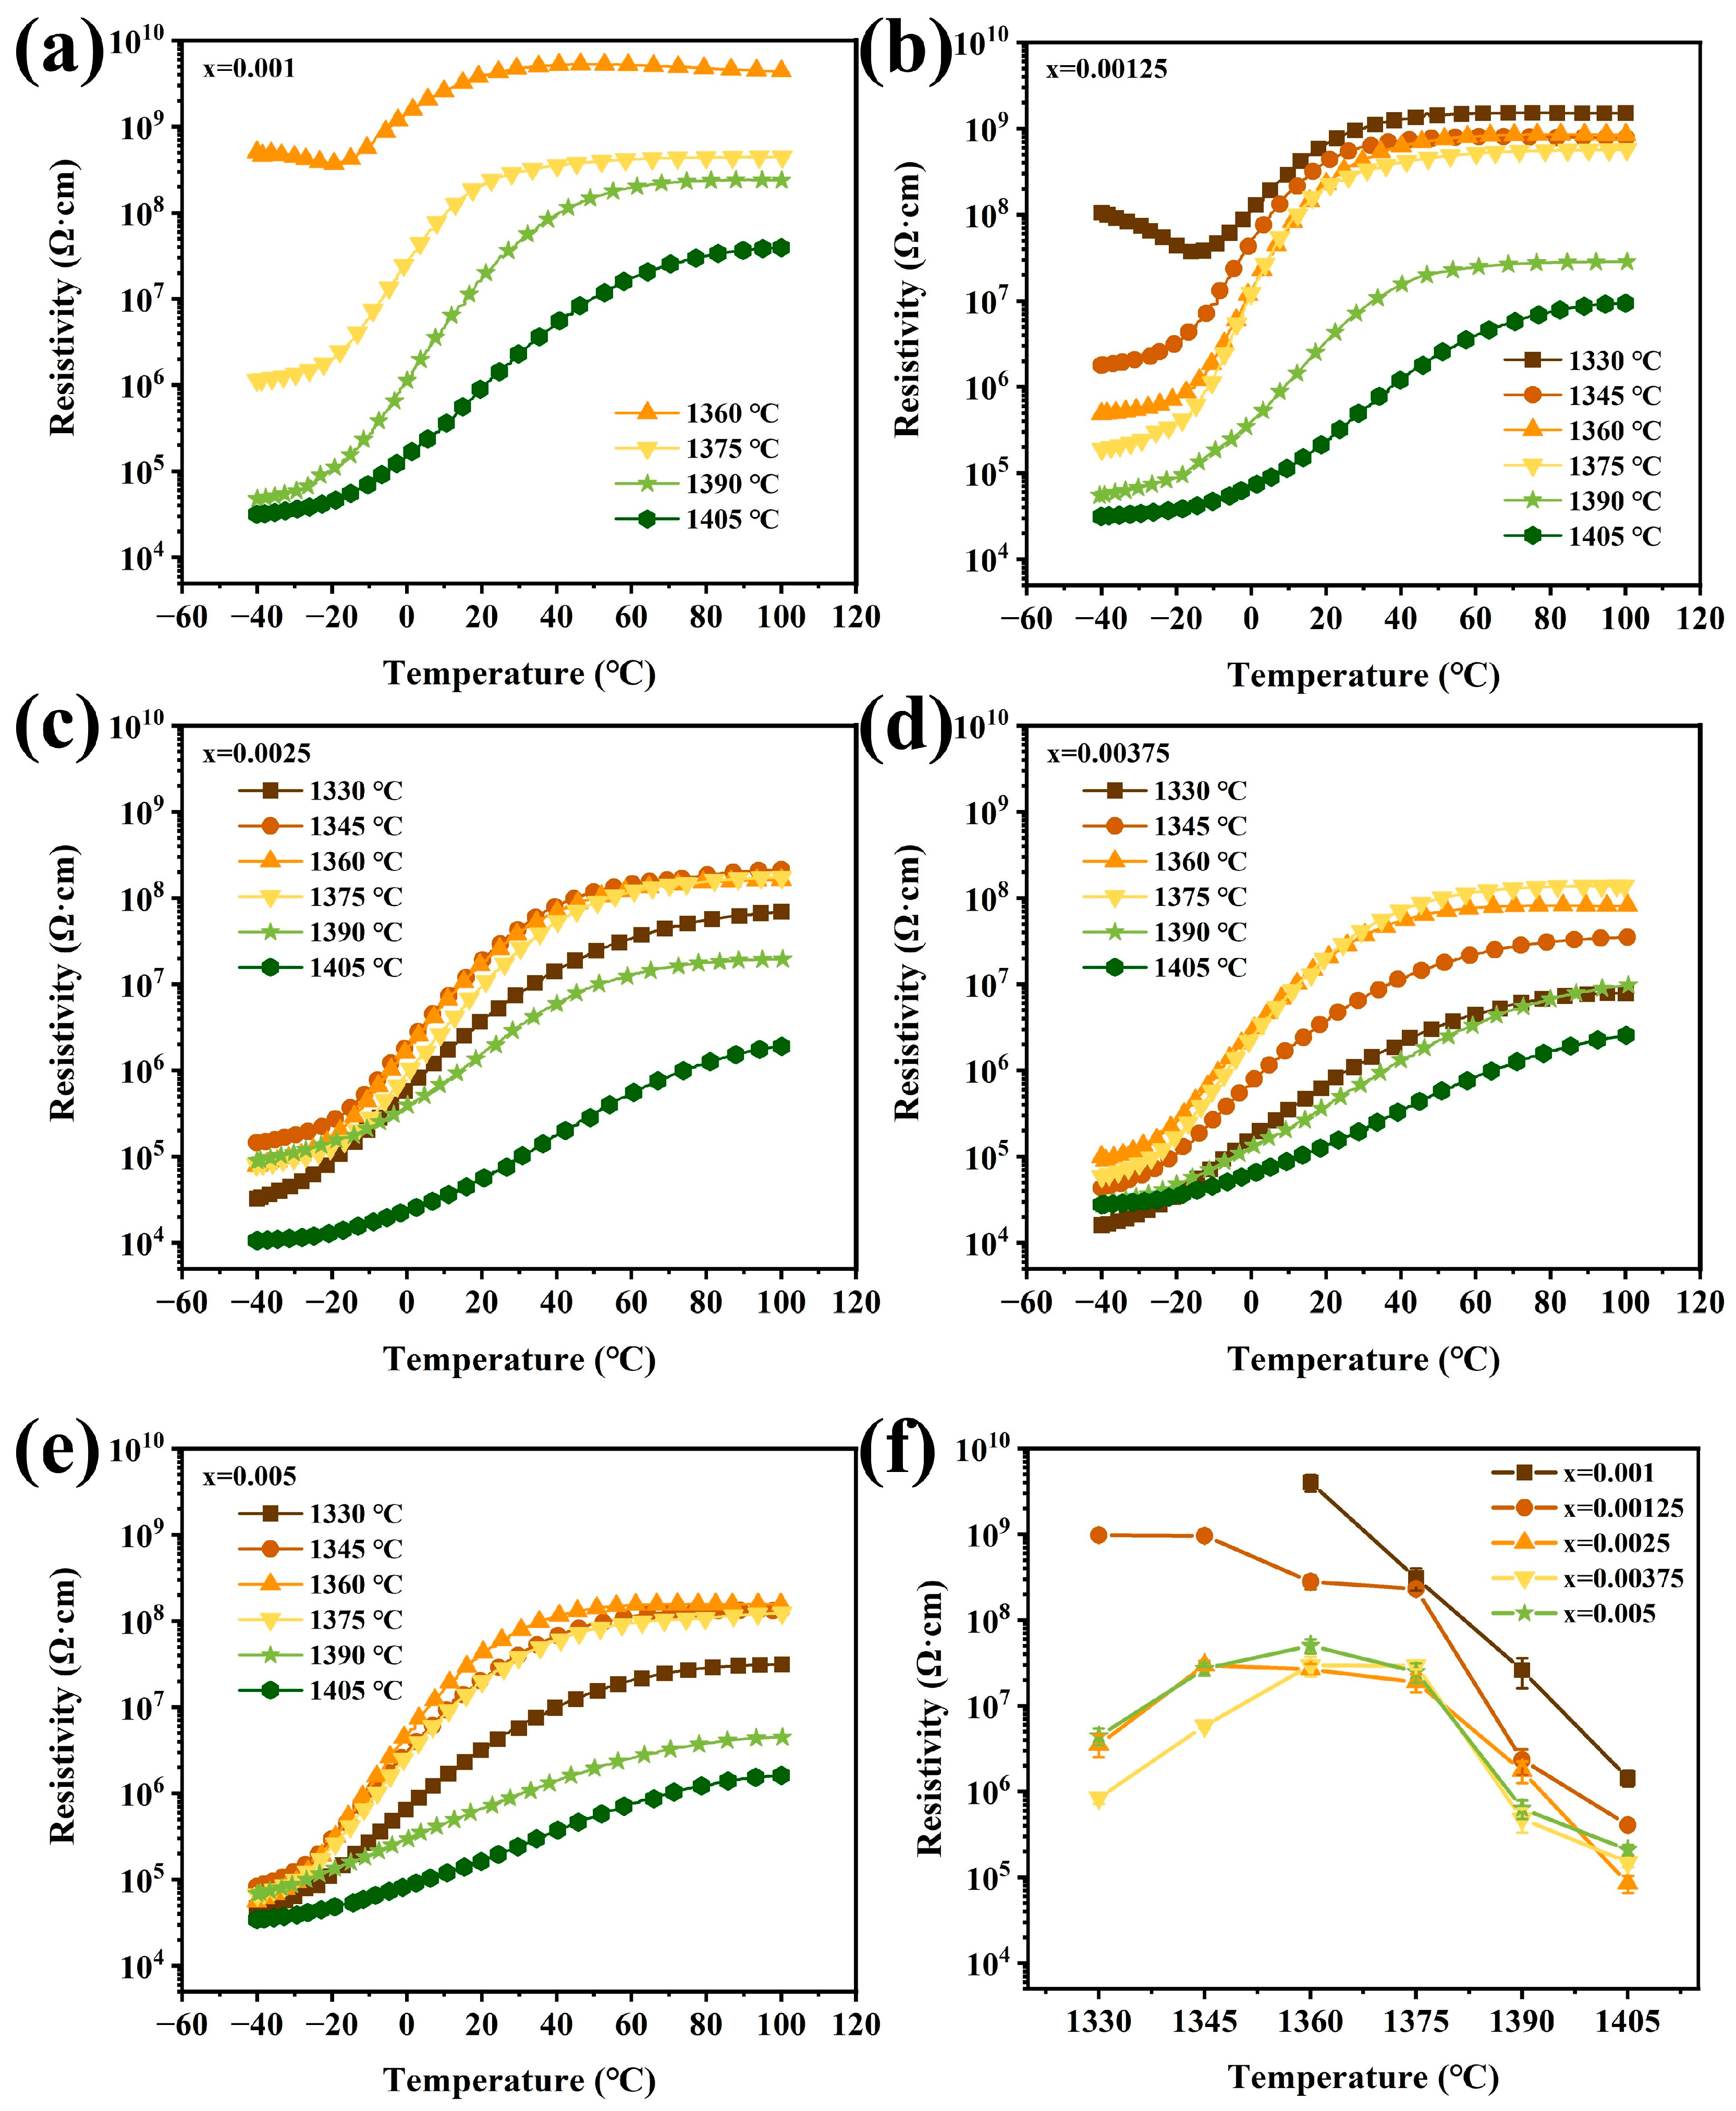
3 ceramics (x = 0.001, 0.00125, 0.0025, 0.00375, 0.005). The ceramic samples were sintered at different temperatures. All samples show a clear PTCR effect. For the samples with x = 0.001 and 0.00125 (see
Figure 1a,b), the resistivities decreased significantly with the increasing sintering temperature and the resistivity jumps were enhanced by increasing the sintering temperature. The largest resistivity jumps were achieved in approximately three orders of magnitude when the sintering temperature reached 1390 °C and 1375 °C, respectively. Then, the resistivity jump value dropped with the increasing sintering temperature. For those samples with x = 0.001 sintered at temperatures of 1330 °C and 1345 °C, there were no PTCR effects observed. They showed a white color after sintering, which suggested that higher sintering temperatures were necessary. Comparing the
ρ-
T curves shown in
Figure 1c–e, the resistivity jump increased with the increasing sintering temperature and then dropped with the further increase in the sintering temperature. The largest resistivity jumps happened in the samples sintered at temperatures of 1375 °C for the samples with x = 0.0025 and 0.00375, and 1360 °C for x = 0.005.
Figure 1f shows the relationship between the sintering temperature and room temperature resistivity of the prepared ceramics. The results indicate that the resistivity of the ceramics decreased notably with the increase in the La content at the same sintering temperature, especially for the samples with x ≤ 0.00375. It is also noticed that for those samples with x = 0.005, the resistivity is larger than that of the samples with 0.0025 and 0.00375 La doped. It is well known that the ionic radius of the La
3+ ion is 0.116 nm, close to that of the Ba
2+ ion (0.135 nm) and Sr
2+ (0.112 nm), and is much larger than that of the Ti
4+ ion (0.061 nm). As a result, La
3+ ions are more likely to substitute the A sites in ABO
3-type structures. Once La substitutes Ba or Sr, defective reactions that may occur, as shown in Equations (3)–(5) [
22,
23]:
When the content of La ions is small, the A-site substitution of La ions will release electrons, as shown in Equation (3); the conductivity is attributed to a change in doping mechanism, dominated by electronic compensation. Therefore, the resistivity of ceramics will be reduced. However, with the increase in the La3+ content, cation vacancies may be produced for the defect reactions, as shown in Equations (4) and (5). Ulteriorly, with the further increasing La content, the cation vacancy compensation gradually dominates the situation, which leads to an increase in resistivity.
Obviously, for the samples with different La contents, there are optimum sintering temperatures for better PTCR performance. These are 1390 °C for the samples with x = 0.001; 1375 °C for x = 0.00125, 0.0025, and 0.00375; and 1360 °C for x = 0.005. The optimum sintering temperature tends to be lower with the increase in the La content. This reveals that La
3+ can promote sintering and enhance the PTCR performance significantly. These results indicate that the PTCR performance of the samples is closely linked with the sintering temperature and La
3+ content. In addition, as Ba
1−xSr
xTiO
3 normally possesses higher resistivity than BaTiO
3 and its resistivity increases with the increase in the Sr content [
31], the La-doped Ba
0.55Sr
0.45TiO
3 ceramics show higher resistivity than the La-doped BaTiO
3. In our case, the resistivities of all the samples below
Tc are 10
4–10
5 Ω·cm. Similar results are reported in reference [
21].
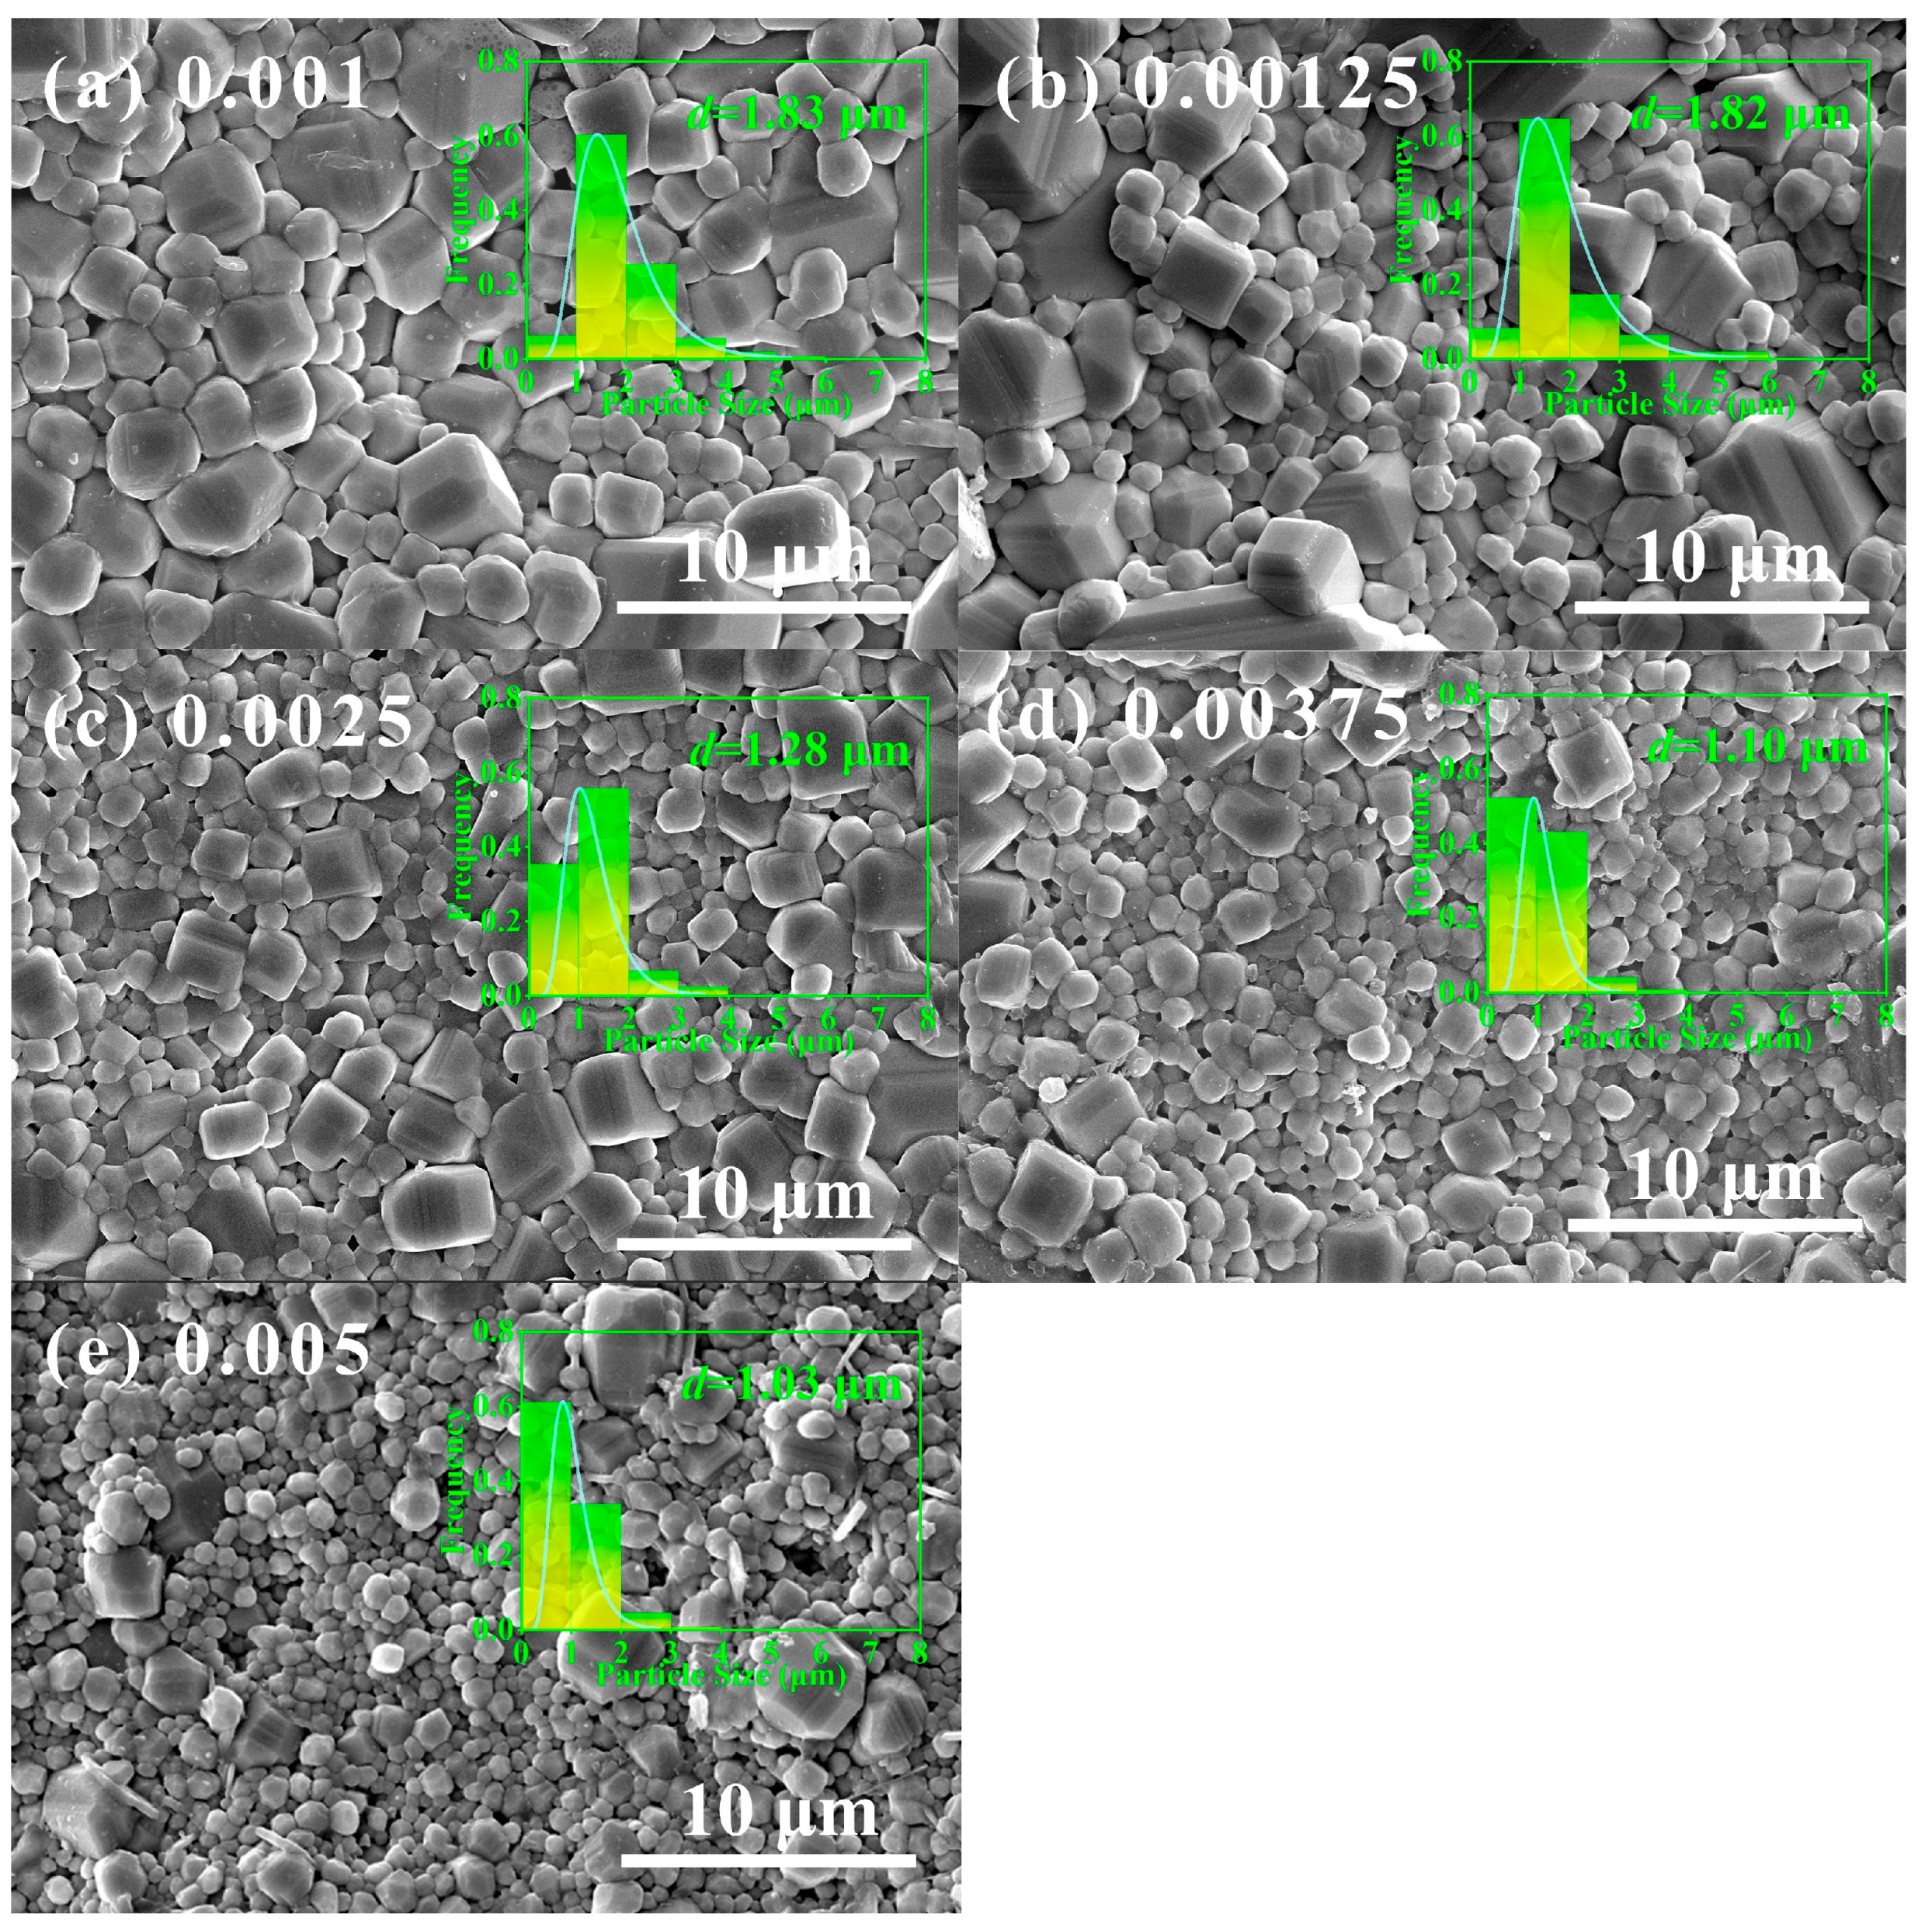
Figure 2 shows the SEM micrographs of the La-doped Ba
0.55Sr
0.45TiO
3 ceramic samples sintered at their optimum sintering temperatures. It reveals that the La content affected the grain growth of La-doped Ba
0.55Sr
0.45TiO
3 ceramics significantly. The grain size tends to be small with the increase in the La content. Generally, the small grain size would lead to a large resistivity of the ceramics due to a large amount of grain boundaries. As a result, the La content could increase the resistivity of Ba
0.55Sr
0.45TiO
3 ceramics by cation vacancy compensation and inhibiting the growth of grains.
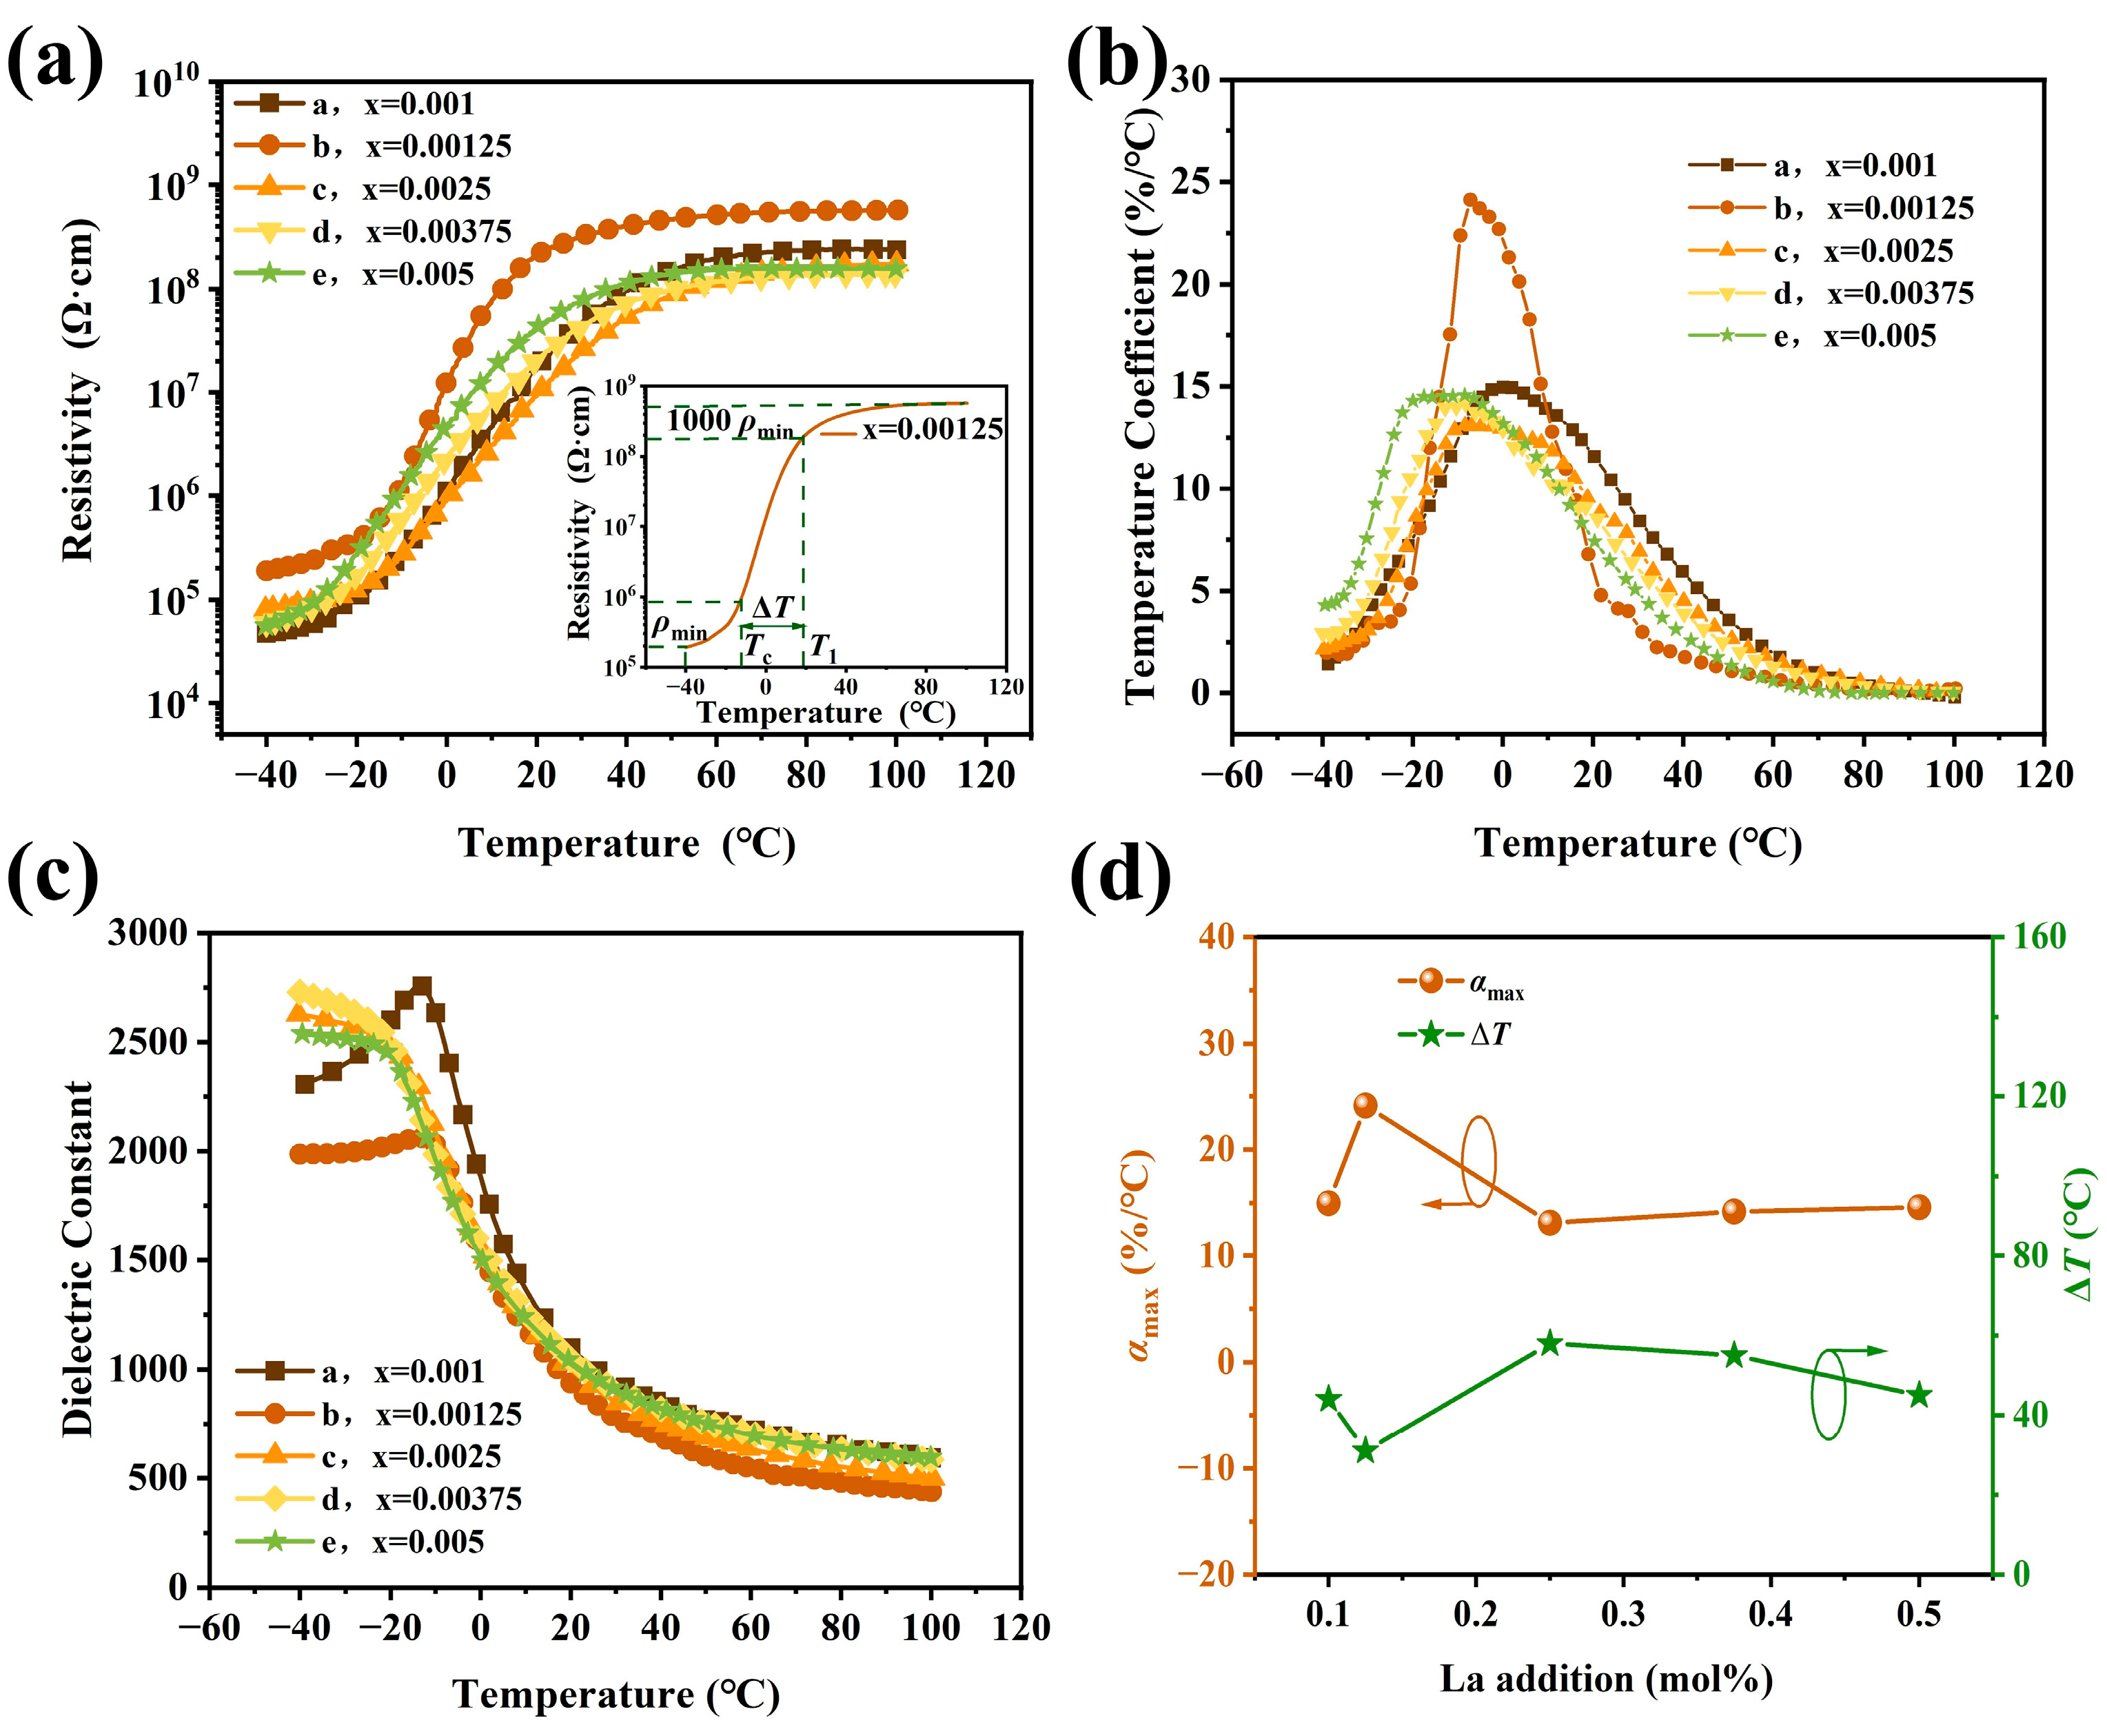
Figure 3a gives the resistivity temperature response of ceramic samples with different La contents. All the ceramics were sintered at their optimum sintering temperatures. In order to evaluate the PTCR performance clearly, here, the
ρ at −40 °C is defined as
ρmin (considering the facts that the resistivities increase monotonically with the increase in the temperature before the phase transition in our case); the
Tc of the ceramics is determined by a dielectric constant versus temperature curve of the ceramics in
Figure 3c; the phase transition temperature span, Δ
T, is defined as the temperature span in which resistivity rises from
ρTc to 1000
ρmin; and the PTC resistivity jump is defined as lg
ρmax/
ρmin.
The results in
Figure 3a reveal that the
Tc of the samples is located in the temperature range from −20.36 °C to −12.68 °C, and the resistivity jumps are around three for all samples. The room temperature resistivities of the prepared ceramics are around ~×10
8 Ω·cm. Furthermore, hardly any NTC phenomena appeared in the tested temperature range and a near-plateau is observed from 20 °C to 100 °C for all samples. Among them, the sample with x = 0.00125 shows the narrowest phase transition temperature span of Δ
T ~31 °C. As shown in the
Figure 3a inset, in the first stage, the resistivity rises mildly from −40 °C to −30 °C. An appreciable increase in electrical resistivity occurs from −30 °C to −13 °C. After that, a more dramatic change starts from −13 °C to 18 °C, when the electrical resistivity increases from 7.36 × 10
5 Ω·cm to 1.88 × 10
8 Ω·cm and then reaches the value of 2.53 × 10
8 Ω·cm at 25 °C. Then, the electrical resistivity increases from 2.53 × 10
8 Ω·cm to 5.7 × 10
8 Ω·cm slowly in the temperature range from 25 °C to 100 °C, and the curve almost displays a plateau, which should be helpful in practical applications, where it is expected that PTCR materials keep a constant resistivity or mild NTC effect in resistivity above switch temperature.
The resistivity temperature coefficient,
αT, was calculated from the
ρ-
T curve given in
Figure 3a as follows:
Here, RT is the resistance corresponding to the certain temperature of T.
The
αT-
T curves of all samples are shown in
Figure 3b. It reveals that all temperature coefficient maximum values of the samples are located between −20 °C and 10 °C. Among them, the sample with 0.00125 La content shows an outstanding high value of 24.12%/°C at −7.24 °C. The La content dependence of
αT and the phase transition temperature span, Δ
T, are shown in
Figure 3d. It suggests that a small proper amount of La doping will improve the resistance temperature response in the PTCR jump interval; however, an excessive amount of La doping will lead to a decrease in the temperature coefficient. The temperature dependence of the dielectric constant of the samples is shown in
Figure 3c. The results suggest that the ferroelectric–paraelectric phase transition of the ceramics tended toward relaxation when the La content was higher than 0.00125. As a result, an obvious large phase transition temperature span (Δ
T) happened in the case of x = 0.0025, 0.00375, and 0.005 (see
Figure 3d).
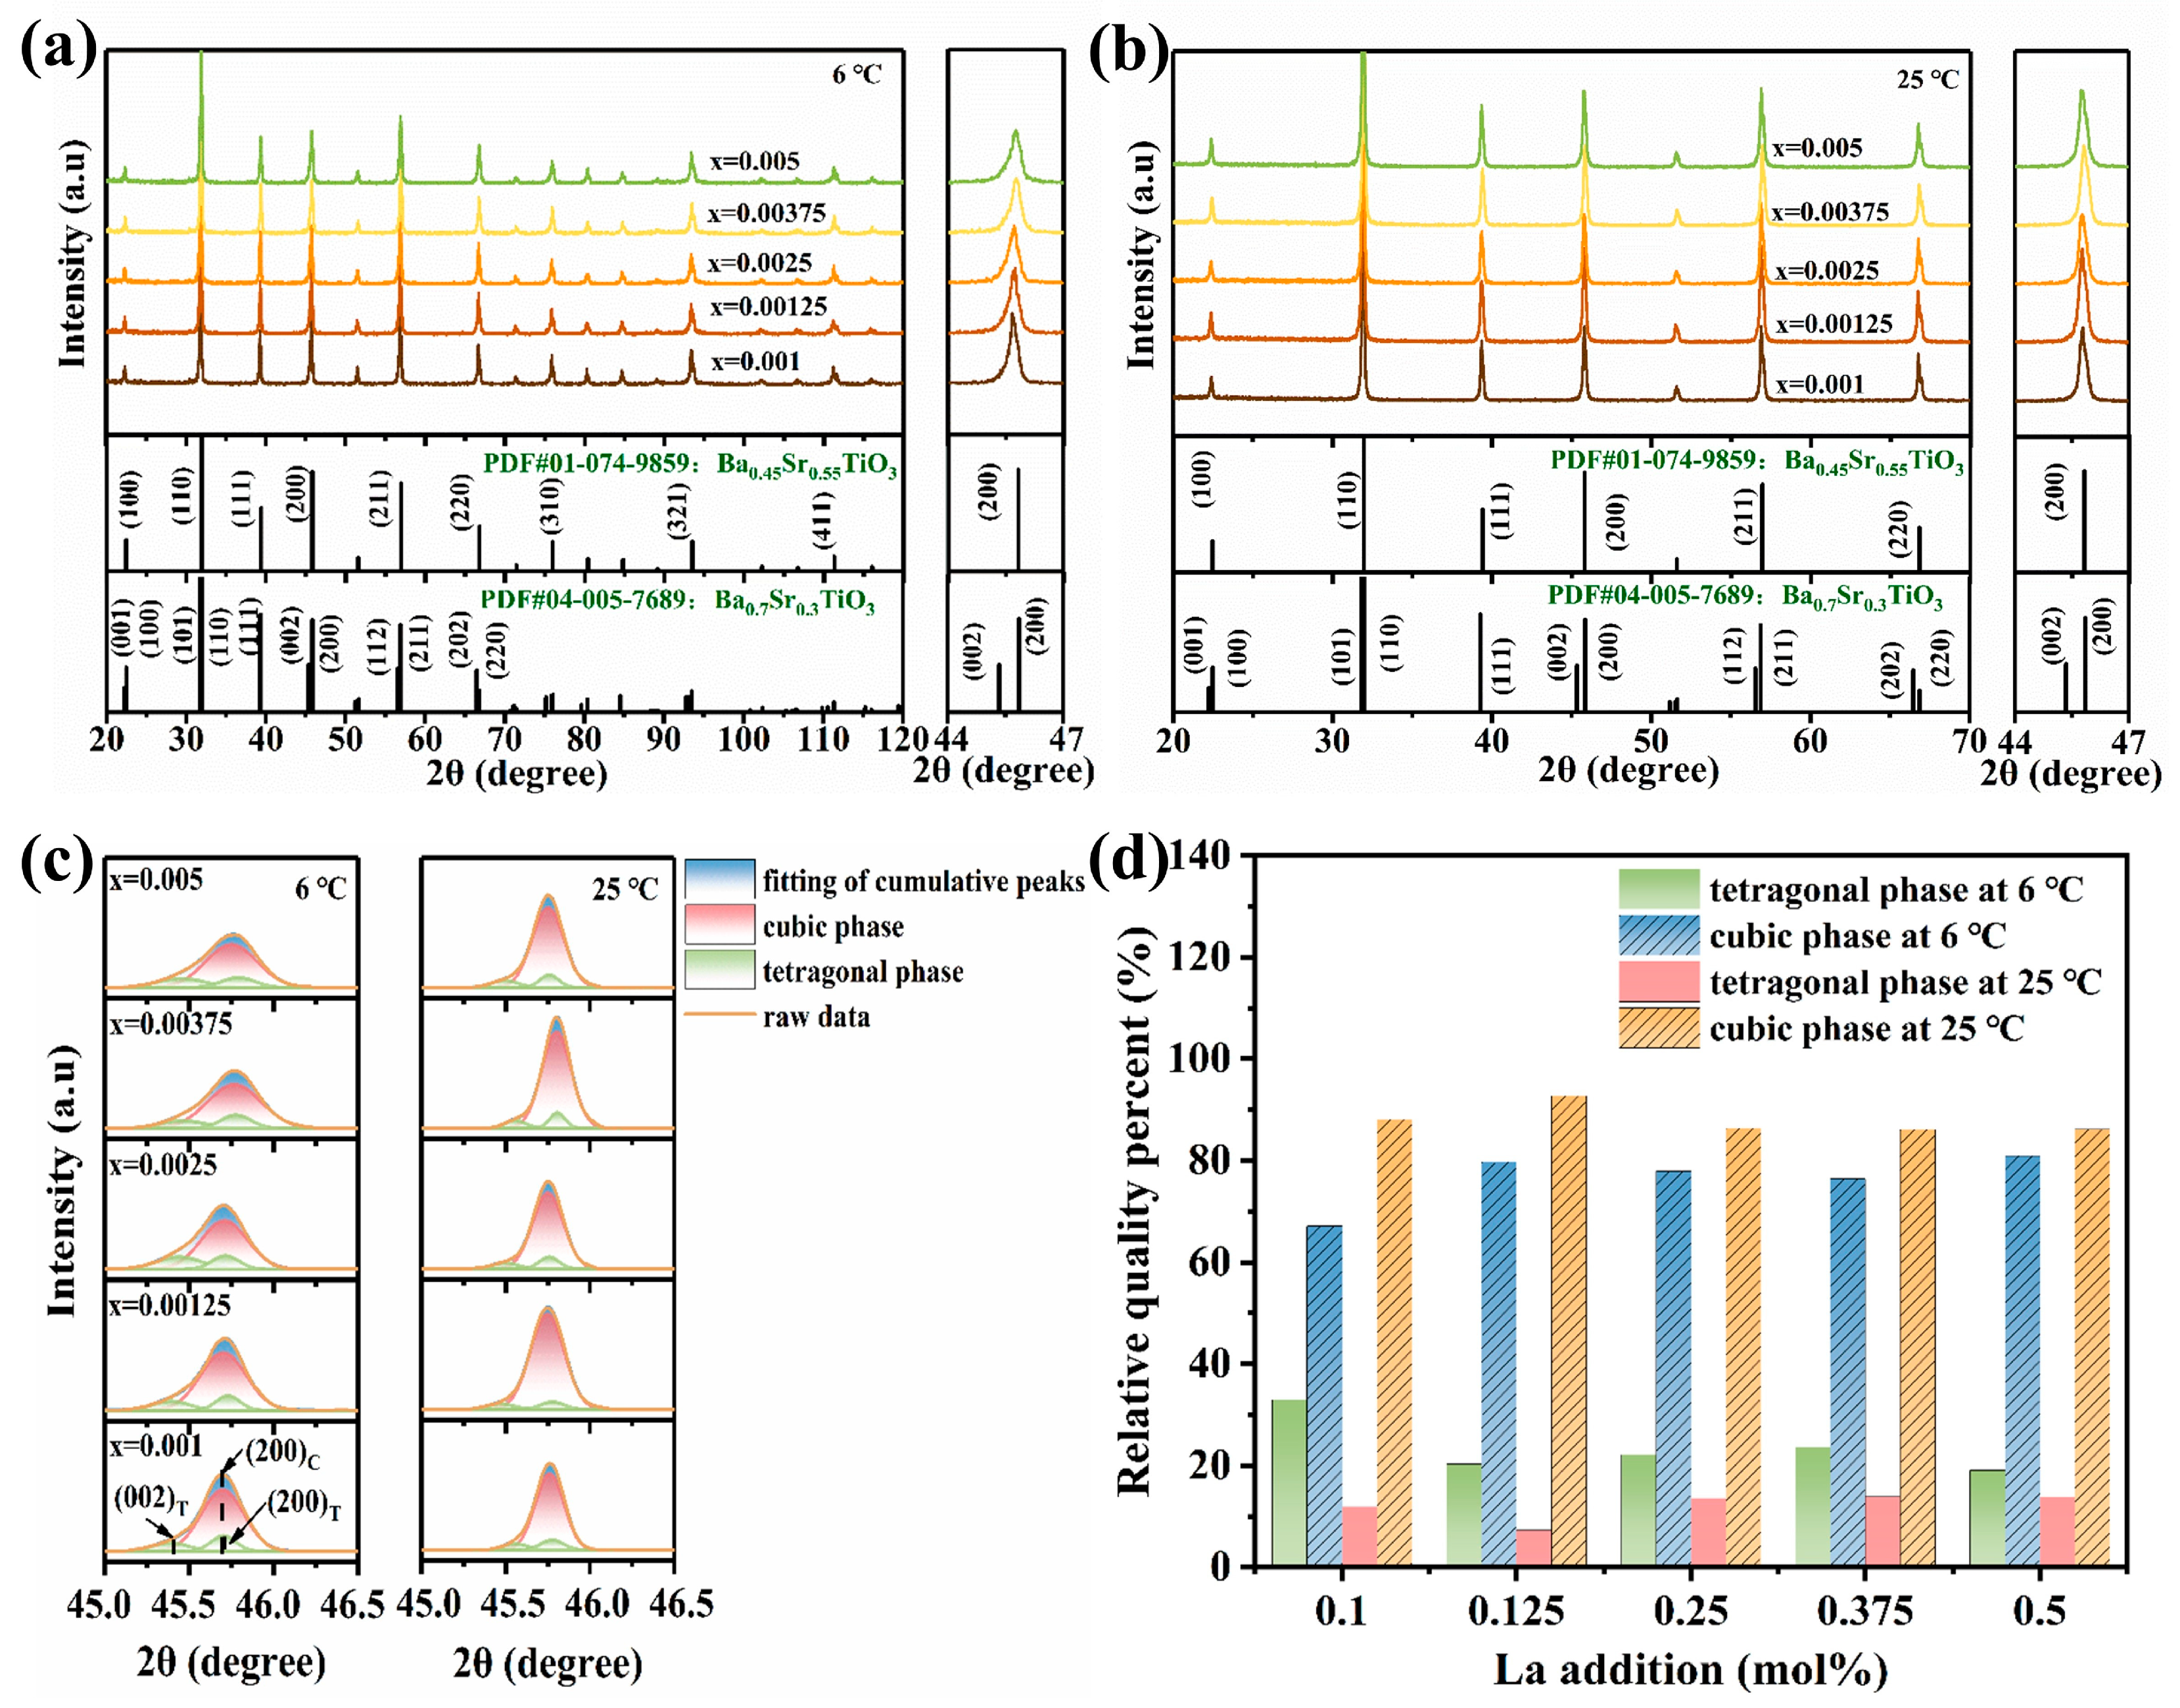
Figure 4 shows the XRD patterns of all samples tested at temperatures of 6 °C and 25 °C. Compared with PDF cards #01-074-9859 and #04-005-7689, all samples showed a single perovskite phase, and no second phase was detected in the tested range. In a close observation, it could be noticed that the diffraction peaks of all the samples showed mild left- shifting with the increase in the La content, as shown in
Figure 4a,b. This indicates the slight enlargement of the lattice due to the La entering the Ba
0.55Sr
0.45TiO
3 lattice. Furthermore, the asymmetry of the diffraction peaks (~45°) suggest that the cubic and tetragonal phases coexist in all samples, especially for the samples at 6 °C. They could be fitted by the characteristic peaks of a tetragonal structure and a cubic structure (see
Figure 4c). The results reveal that the cubic and tetragonal phases coexisted in all samples at 6 °C, and the tetragonal phase reduced significantly when the temperature reached 25 °C. The phase composition of the samples at the tested temperatures were analyzed by RIR methods. The results are listed in
Table 1. It suggests that the ferroelectric–paraelectric phase transition would be near completion at 25 °C. The results are consistent with that of the resistivity–temperature curves in
Figure 3a and the dielectric constant–temperature curves in
Figure 3c.
To evaluate the performance of the samples clearly, the PTCR performance parameters of the samples in
Figure 3a are listed in
Table 1. Among them, sample
b possesses the large resistance jump of ~3.48, the narrowest transition temperature span of ~31 °C, and the largest resistivity at 25 °C.
Under the consideration that a resistivity as low as possible before the phase transition is expected in practical use, as it would reduce the power consumption of the PTC thermistors, trace Bi0.5Na0.5TiO3 (BNT) was employed to modulate the resistivity of the (Ba0.55Sr0.45)(1−x)LaxTi1.01O3 ceramics (x = 0.00125) in this work.
(Ba
0.55Sr
0.45)
0.99875La
0.00125Ti
1.01O
3-yBNT ceramics (y = 0, 0.001, 0.0025, 0.005, and 0.01) were prepared.
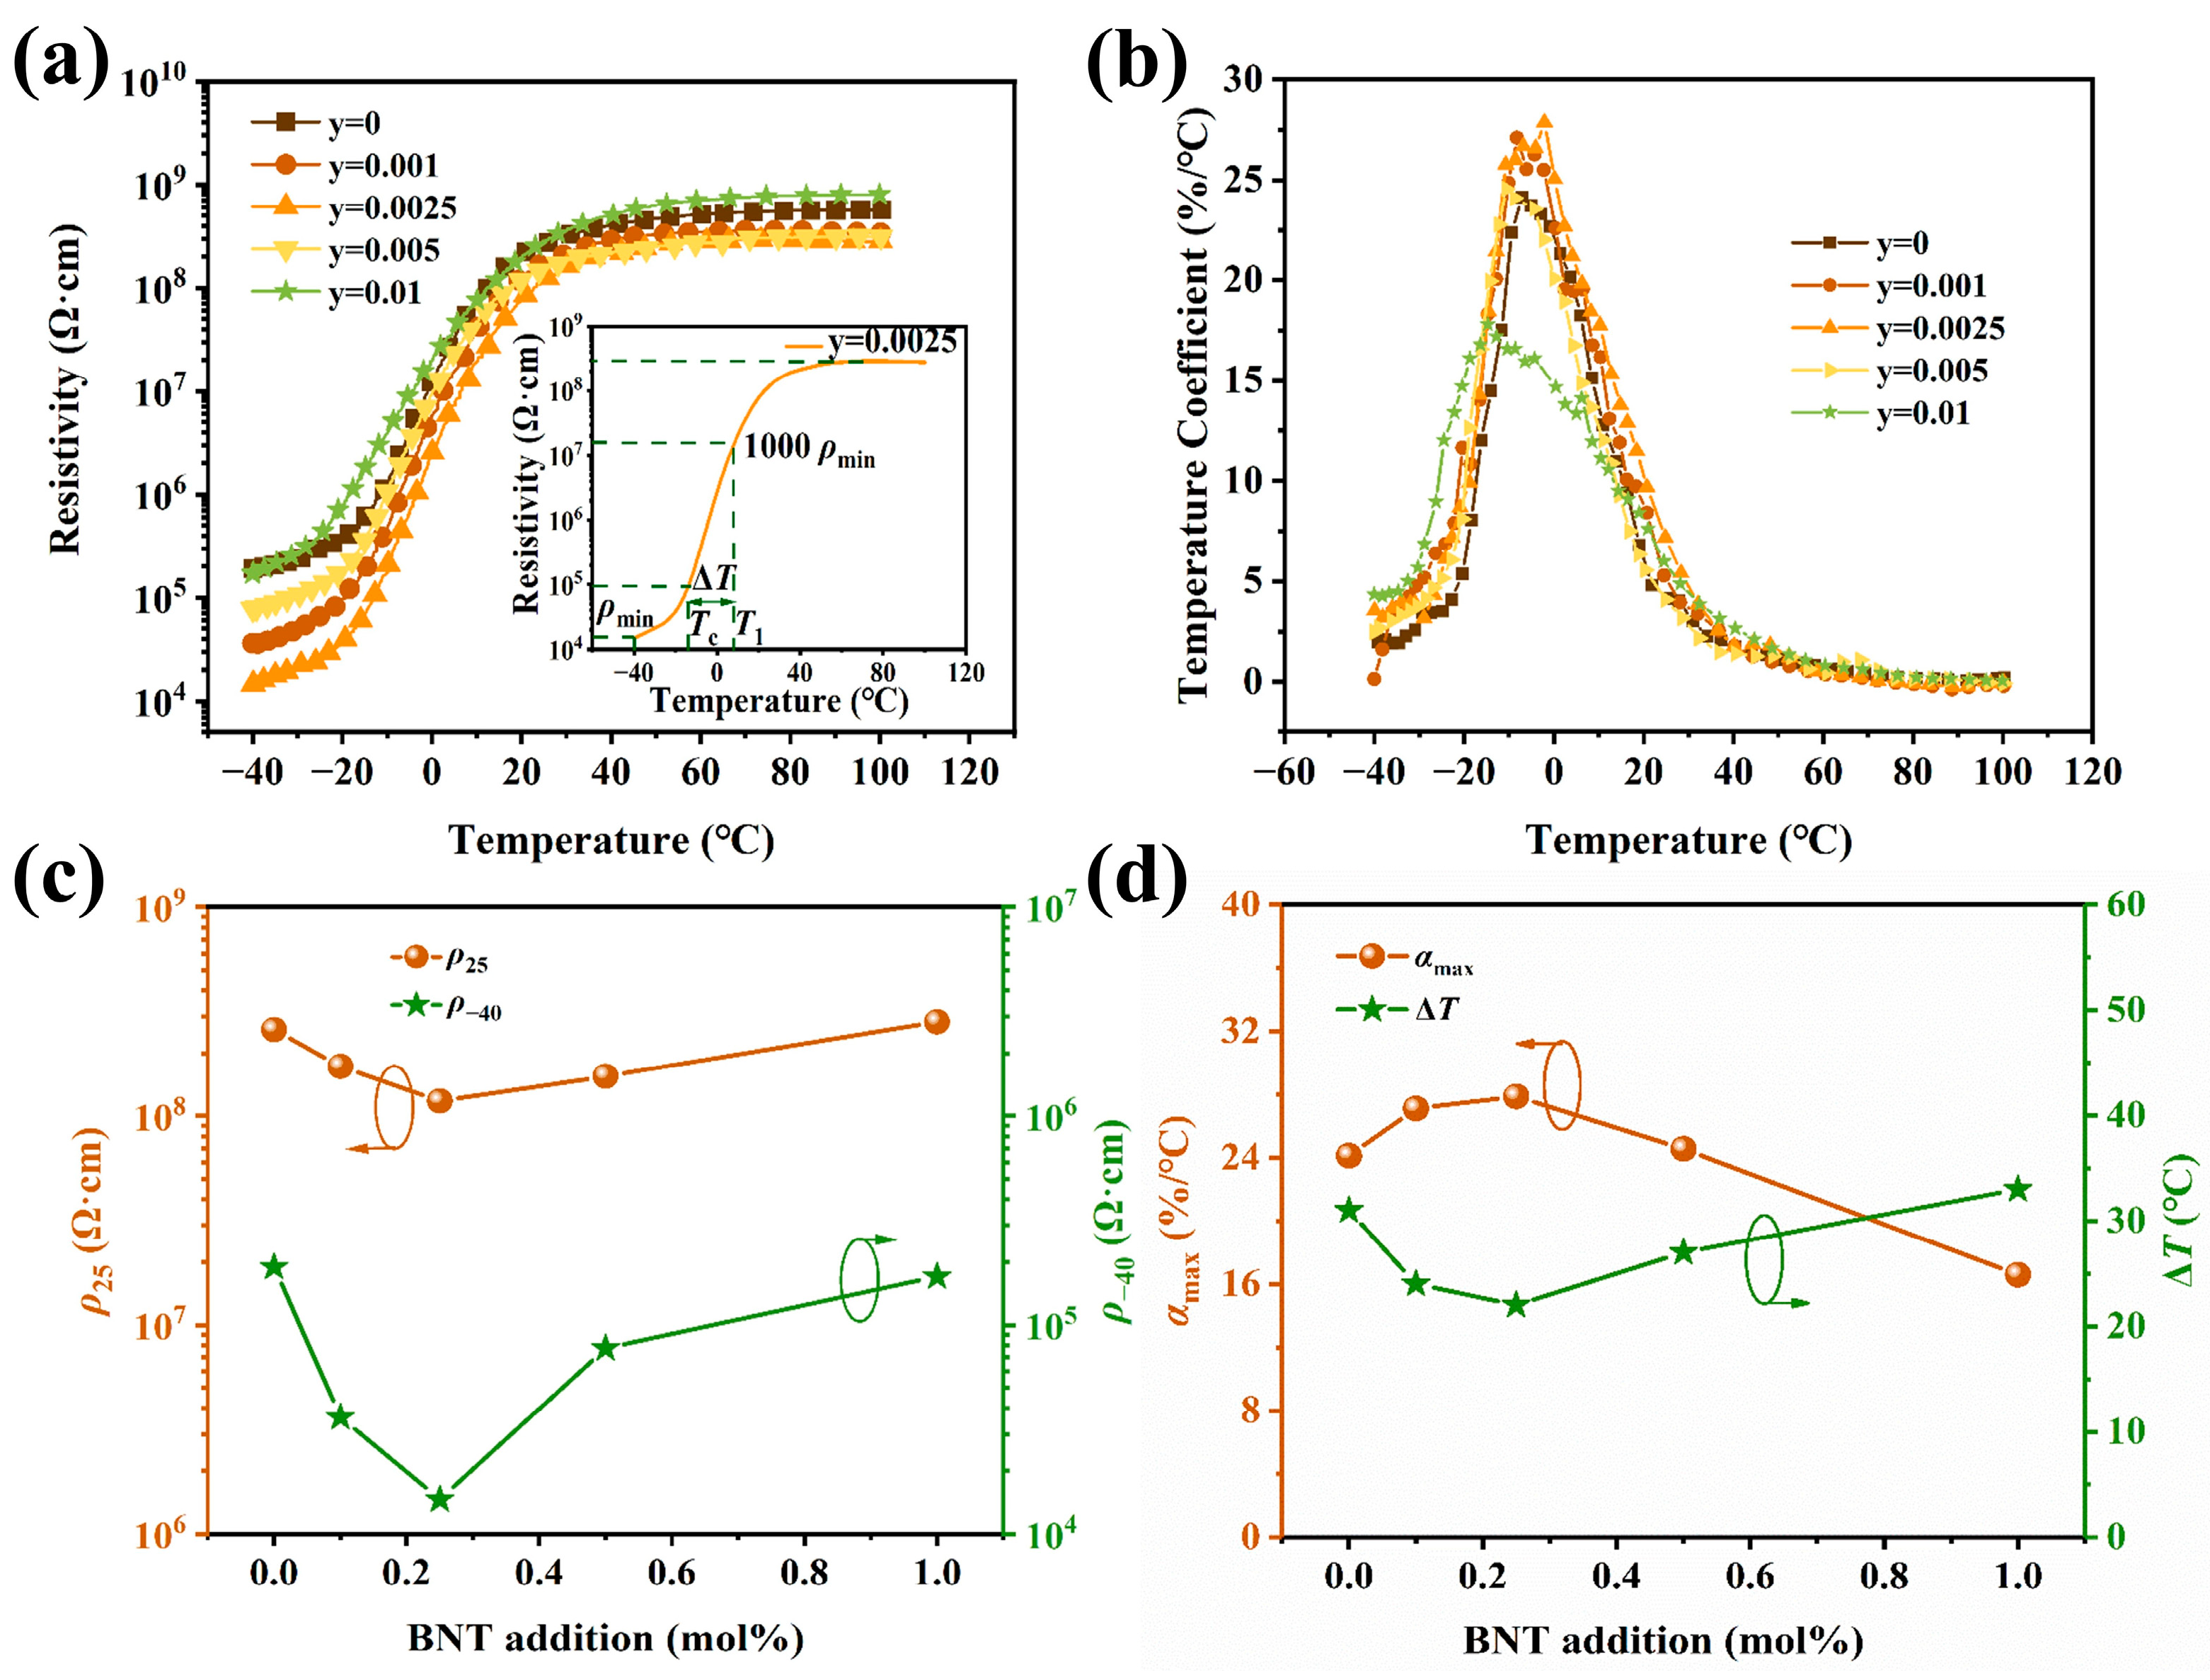
Figure 5 shows the resistivity temperature response of the samples sintered at their optimum sintering temperatures. All samples show a similar resistivity temperature response to that in
Figure 3a (see
Figure 5a).
Overall, the resistivities are reduced by introducing BNT; in particular, the changes in the resistivity before the phase transition are notably larger than that after phase transition, except for samples with y = 0.005 (see
Figure 5c). As a result, the PTC jumps of all samples are enhanced. Compared with the curves in
Figure 3b, the
αT values of all samples (see
Figure 5b) are improved by introducing BNT. The samples with 0.0025 BNT content show the highest value of 27.86%/°C at −2.14 °C.
Figure 5d shows the BNT content dependence of
αT and Δ
T. The results indicate that proper doping of BNT could increase the temperature coefficient of resistance. The change in
Tc is mild due to the trace BNT amount, even though BNT possess a much higher
Tc. As a result, a proper amount of BNT would strengthen the PTC performance of (Ba
0.55Sr
0.45)
0.99875La
0.00125Ti
1.01O
3 ceramics. Similar results are reported in research on high-
Tc (>120 °C) BaTiO
3-based materials [
26,
27,
28,
29,
30,
32,
33,
34]. The detailed PTCR performance parameters of the samples are listed in
Table 2.
Impedance spectra are very useful in separating the contribution of different electrical components from whole bulk ceramics, such as grains, grain boundaries, and other regions [
32]. Since impedance spectra can usually be analyzed from capacitance data using equivalent circuits for grain boundaries and grain effects, each of these components can be represented by a parallel RC [
35,
36,
37]. In order to understand the influence of BNT on the resistivity of (Ba
0.55Sr
0.45)
(1−x)La
xTi
1.01O
3 ceramics, the complex impedance spectra of the samples were measured at different temperatures.
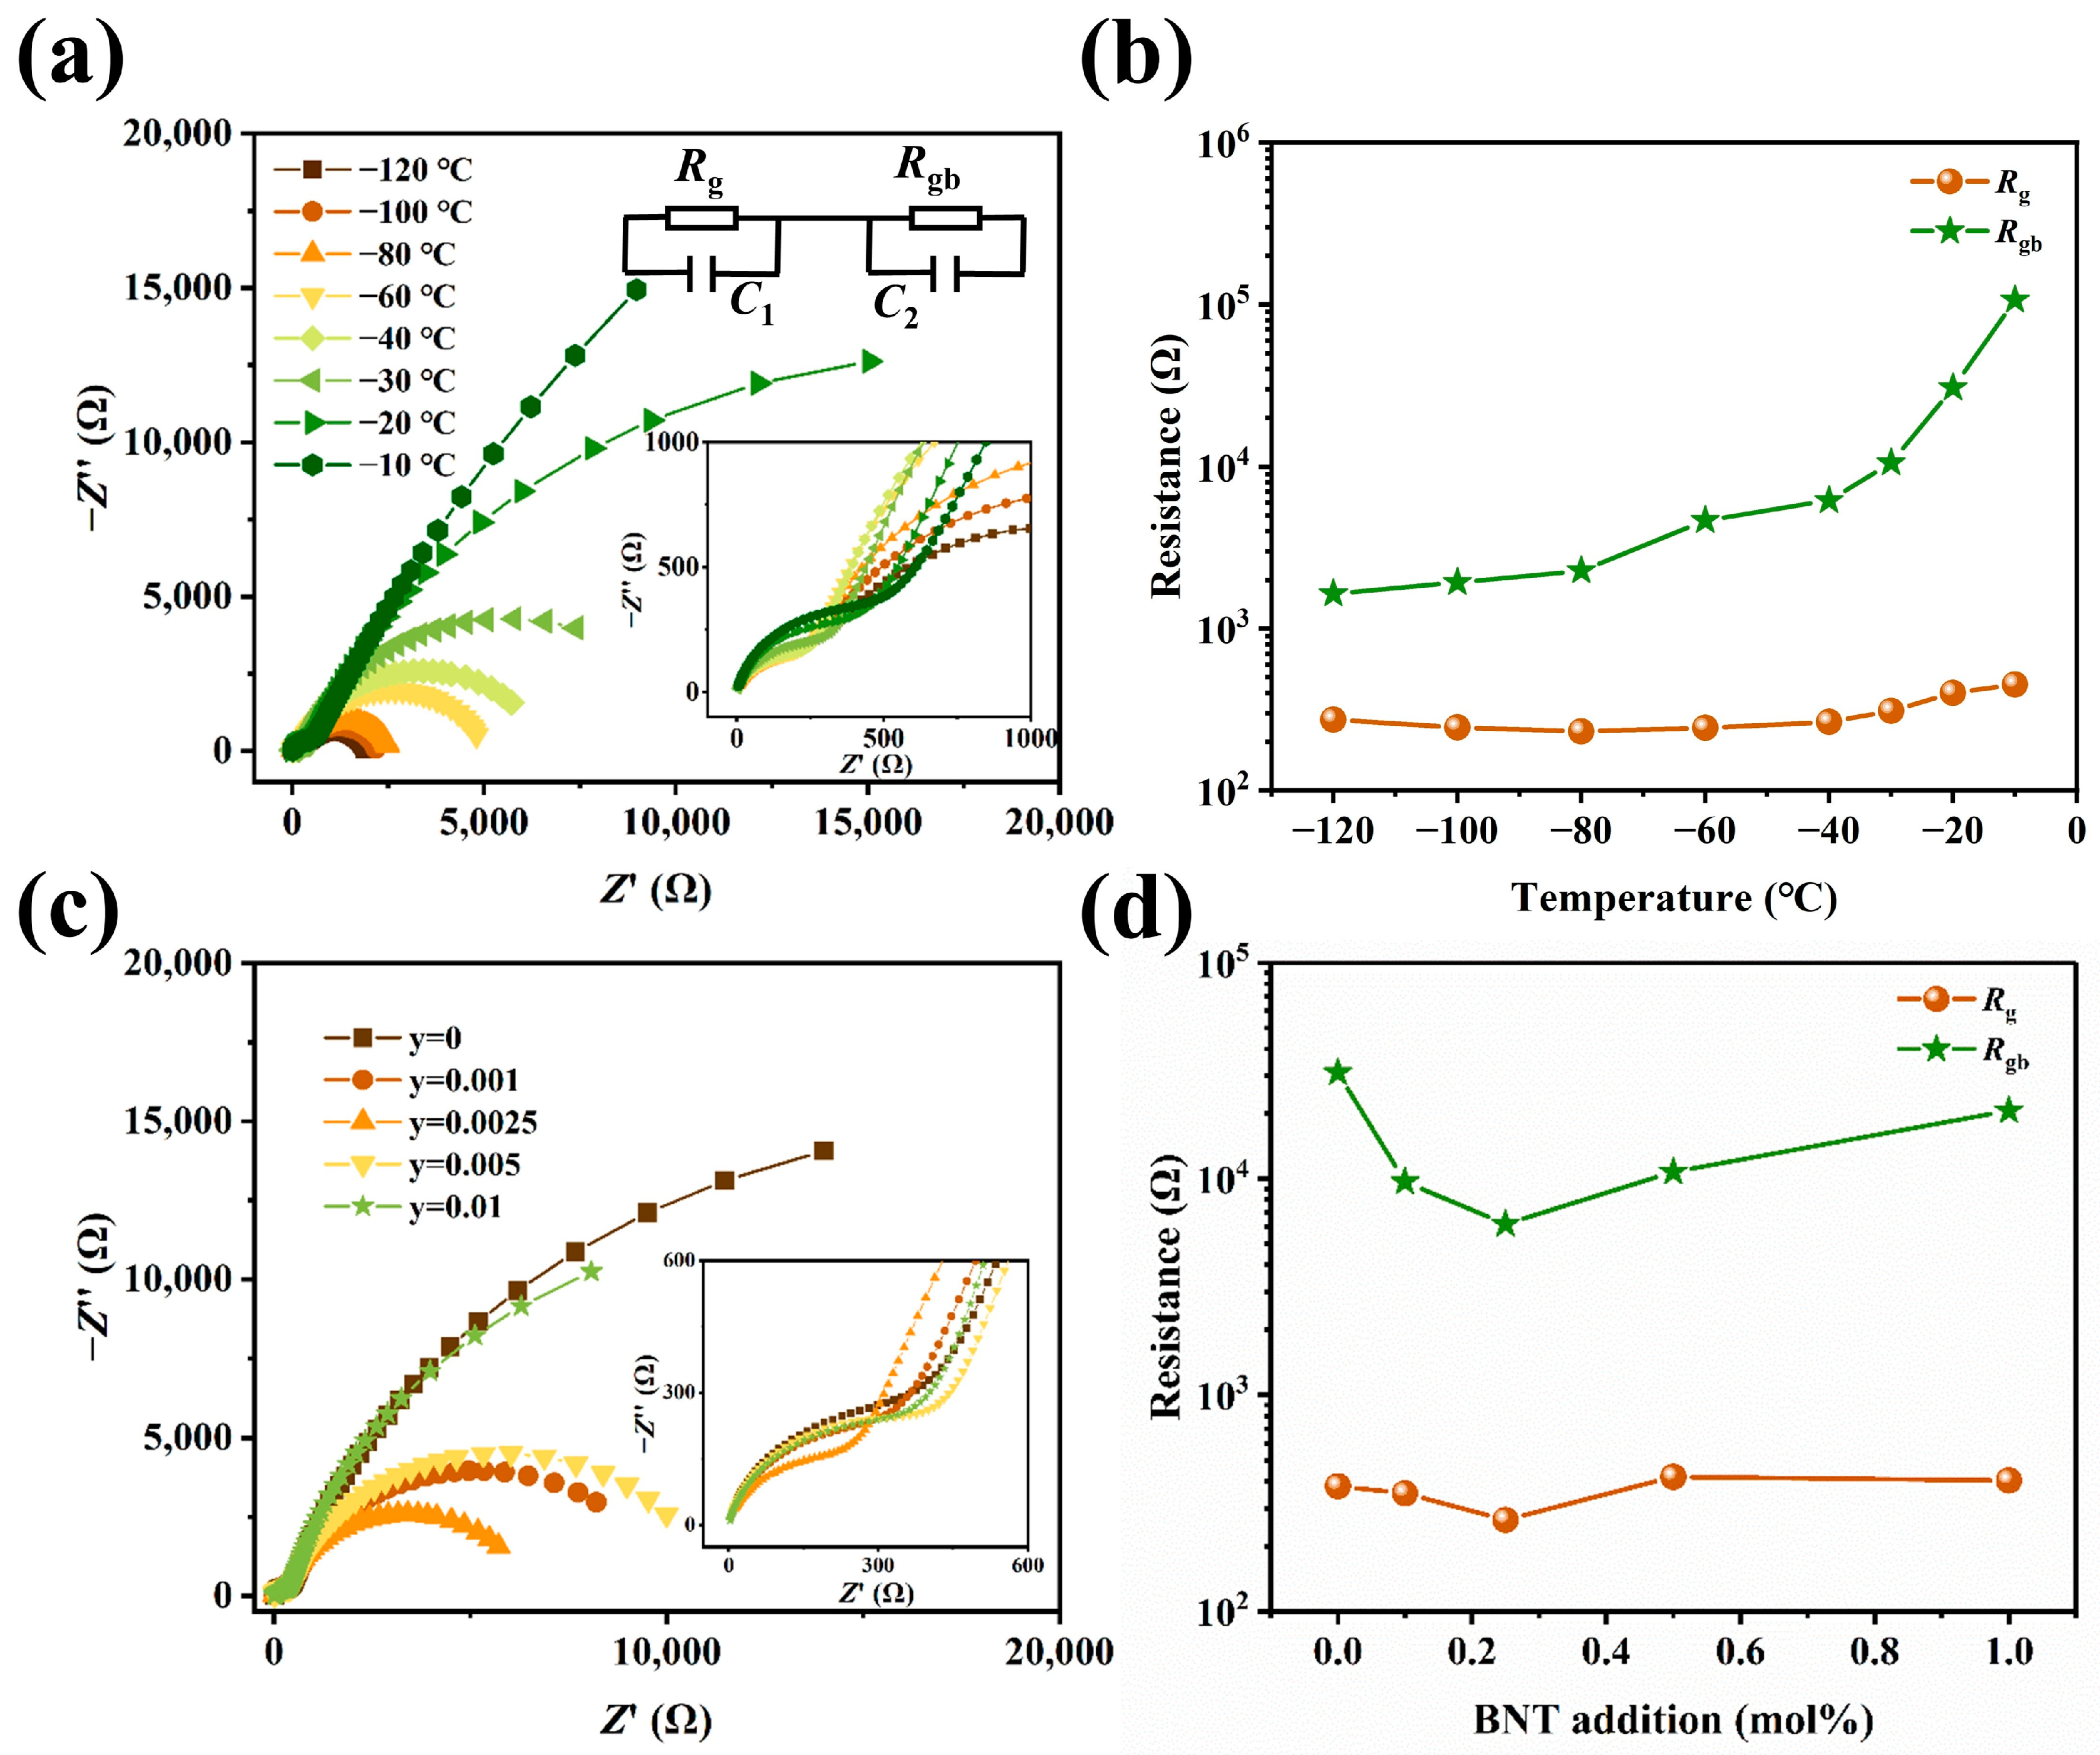
Figure 6 gives the impedance spectra of the samples. An equivalent circuit diagram for each ceramic grain could be fitted by the impedance spectra, where
Rg and
Rgb denote grain resistance and grain boundary resistance, respectively [
38].
Figure 6a shows the impedance spectra of sample No. 3 in
Table 2 measured at different temperatures. As shown in
Figure 6a, the impedance spectra are all able to fit two semicircular arcs, and the
Rg and
Rgb were estimated from the equivalent circuit diagram. The calculated values of grain and grain boundary resistance versus temperature from
Figure 6a is shown in
Figure 6b. For impedance (Z’’) and modulus (M’’) spectroscopic plots at different temperatures for ceramic samples, see
Figure S1.
Compared with the ceramics without BNT, the
Rgb was reduced by nearly two orders of magnitude. Also, the
Rgb was more than one order of magnitude greater than the
Rg. The
Rg changed mildly in the investigated temperature region. Different from
Rg,
Rgb has a significant growth rate from −20 °C, which is consistent with the resistivity change in
Figure 5a. It suggests that the anomalous increase in resistance is mainly related to the change in
Rgb values. Clearly,
Rgb plays an important role in the PTCR phenomenon.
Figure 6c shows the impedance profiles of different contents of BNT at −40 °C. The results reveal that the trace BNT could affect both
Rg and
Rgb (see
Figure 6d), and, like the results of
Figure 6b, the resistivity of the ceramics was determined by the
Rgb due to it being more than one order of magnitude greater than the
Rg.
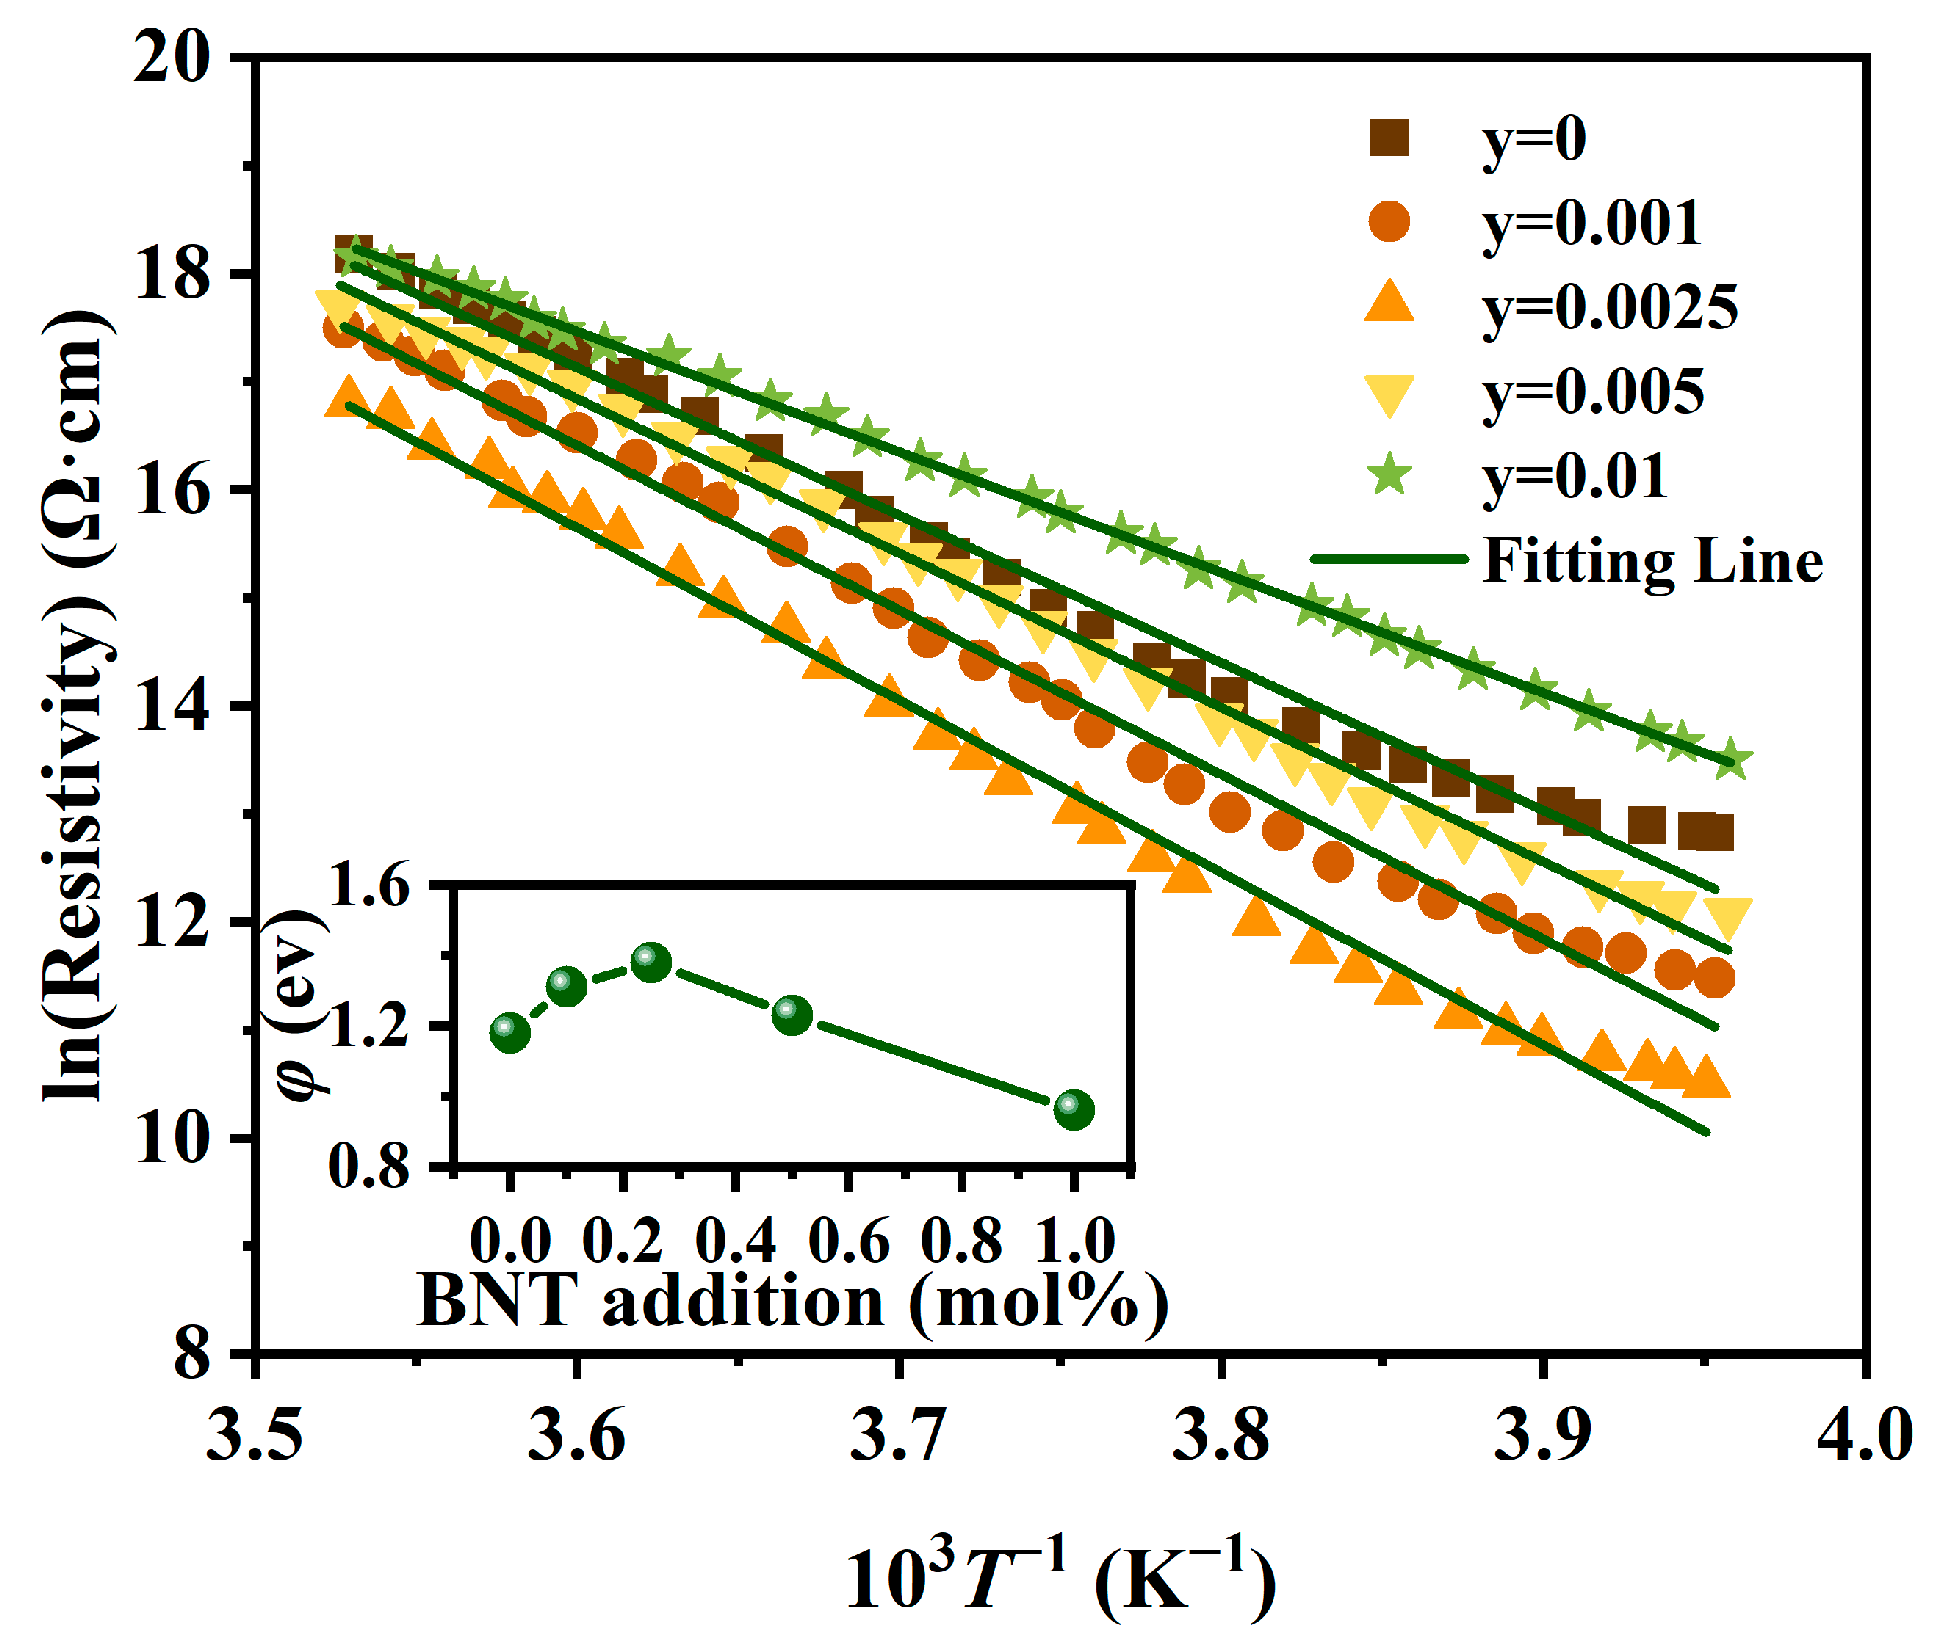
According to the Heywang model, polycrystalline ceramic materials would have a two-dimensional surface host state on the grain surface which traps electrons from the vicinity and induces the creation of a depletion layer, which is the origin of the grain boundary resistance. The height of the potential barrier in the depletion layer can determine the magnitude of the PTCR effect.
The height of the potential barrier (
) of ceramics can be calculated according to the following equation [
38]:
where
is a factor of geometrical configuration,
e is the electric charge, and
k is the Boltzmann constant. Equation (7) can be further calculated to give the following equation:
In this equation,
and
T−1 lead to an approximate linear relationship near the Curie temperature; thus, we plot
lnρgb versus 1000/
T to calculate the height of the potential barrier from −20 °C to 10 °C for different BNT concentrations, as shown in
Figure 7.
The calculated results indicate that the potential barrier height increased to the highest value of 1.4 eV at 0.0025 BNT, and then dropped with the increasing BNT content. This implies that the proper trace BNT content could increase the potential barrier height by modulating the density of acceptors and the donor concentration of ceramic grains. The addition of BNT to (Ba
0.55Sr
0.45)
0.99875La
0.00125Ti
1.01O
3 ceramics tends to produce two main new defects:
and
(in the case of Ba, Sr can replace Ba equally). During the sintering process of (Ba
0.55Sr
0.45)
0.99875La
0.00125Ti
1.01O
3-yBNT ceramics, the acceptor defects tend to segregate to grain boundaries, and donor defects are often not considered to segregate to grain boundaries [
34]. Also, Na displays the preferred evaporation compared to Bi [
33]. Therefore, the BNT in (Ba
0.55Sr
0.45)
0.99875La
0.00125Ti
1.01O
3 ceramics mainly affects the potential barrier height through the volatilization of the element and the adjustment of the Ba/Ti ratio at the grain boundary.
Additionally, the easy volatilization characteristics of Bi
3+ and Na
+ as well as ionic vacancy migration could promote the more even Sr distribution in (Ba
0.55Sr
0.45)
0.99875La
0.00125Ti
1.01O
3-yBNT ceramics [
39]. As a result, the trace addition of BNT mitigated the phenomenon of diffused phase transition resulting from heavily doped Sr
2+ in (Ba
0.55Sr
0.45)
(1−x)La
xTi
1.01O
3 ceramics. This leads to the acceleration of the phase transition and the increase in the resistance temperature coefficient.
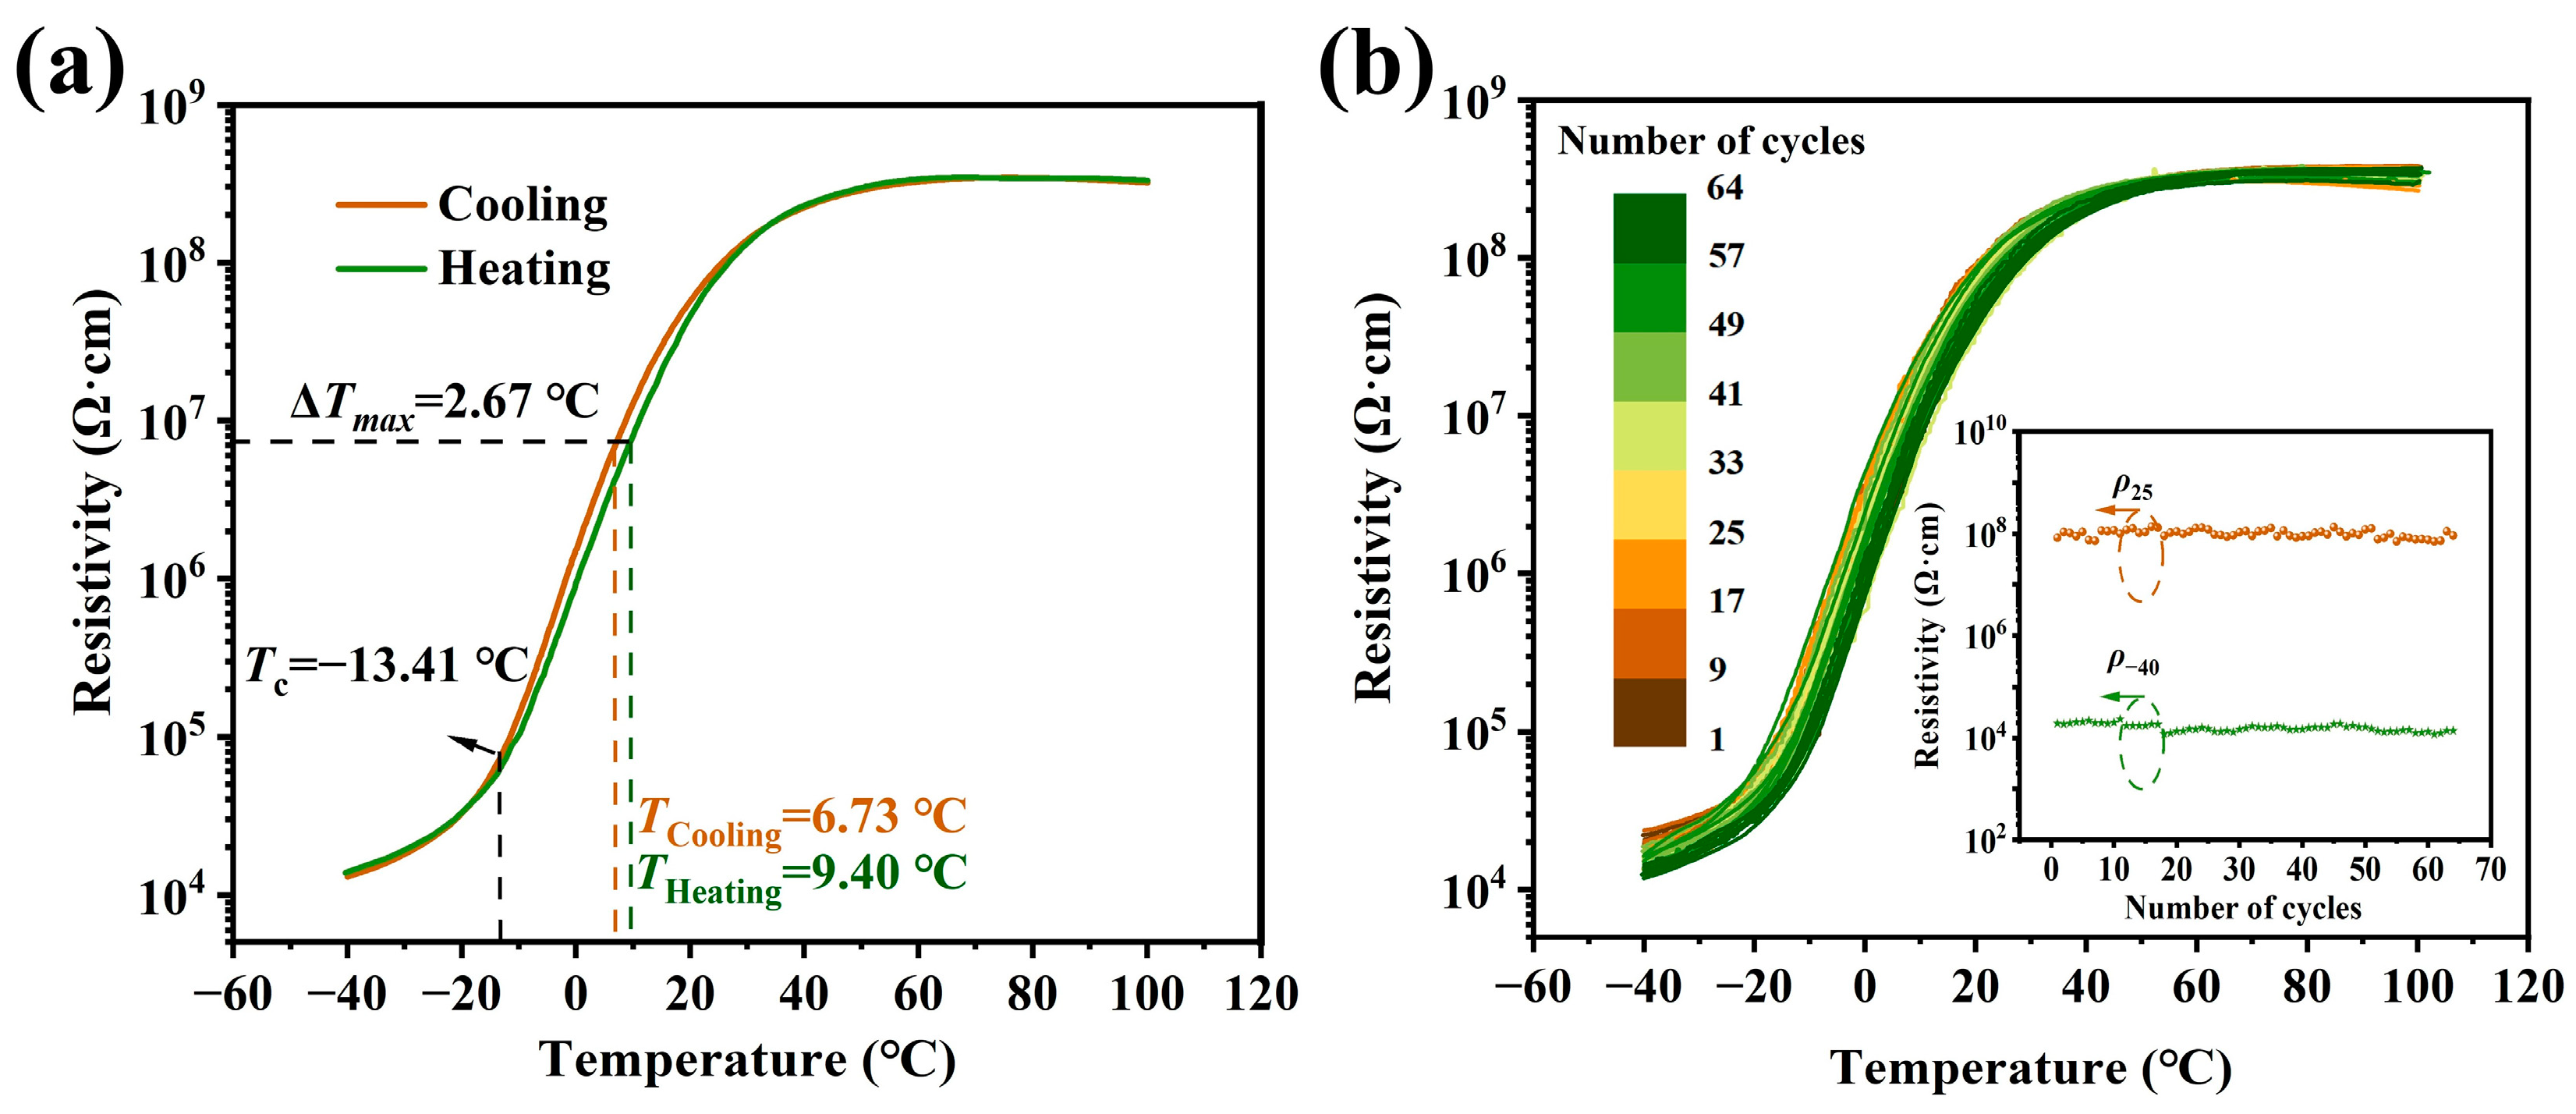
Figure 8 shows the cooling and heating resistivity temperature responses and the reproducibility of the PTCR performance of the (Ba
0.55Sr
0.45)
0.99875La
0.00125Ti
1.01O
3-0.0025BNT ceramic. The PTCR jumps are almost 4.30 and the thermal hysteresis,
Tmax, is around −2.67 °C, resulting from the inevitable thermal hysteresis in the phase transition of the ceramic (see
Figure 8a). For a practical case, a small thermal hysteresis value is expected.
Figure 8b shows that after 64 continuous rounds of testing for more than 30 days, the
Tc and the PTCR jump keep values of −13.41 °C and ~4.30 stably. The room temperature resistivity’s changing ratio is less than 15% in the first 10 days and then tends to stabilize as time passes. This suggests that the PTCR characteristics of the sample show good stability, which is the prerequisite of temperature-controlling switch applications.


