
Study of Corrosion of Portland Cement Embedded Steel with Addition of Multi-Wall Carbon Nanotubes

 ,
, 
Abstract
:1. Introduction
2. Methodology
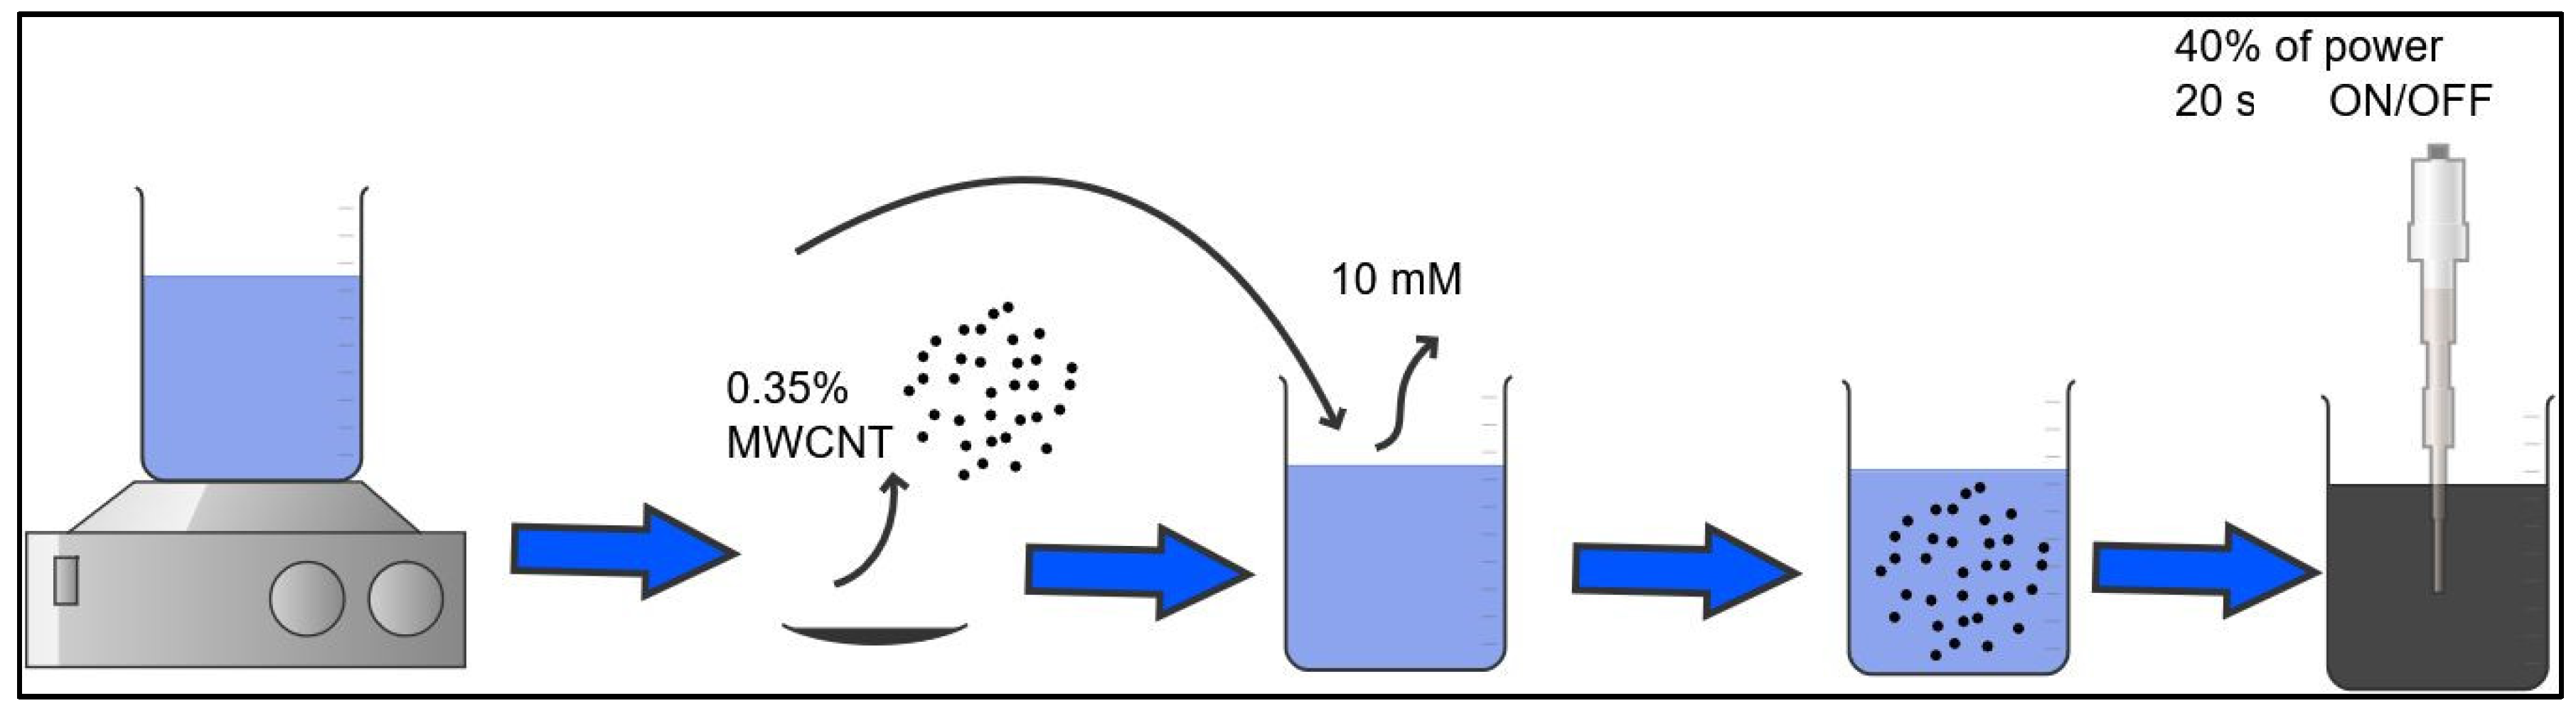
2.1. Dispersion of MWCNTs
Dispersion Characterization
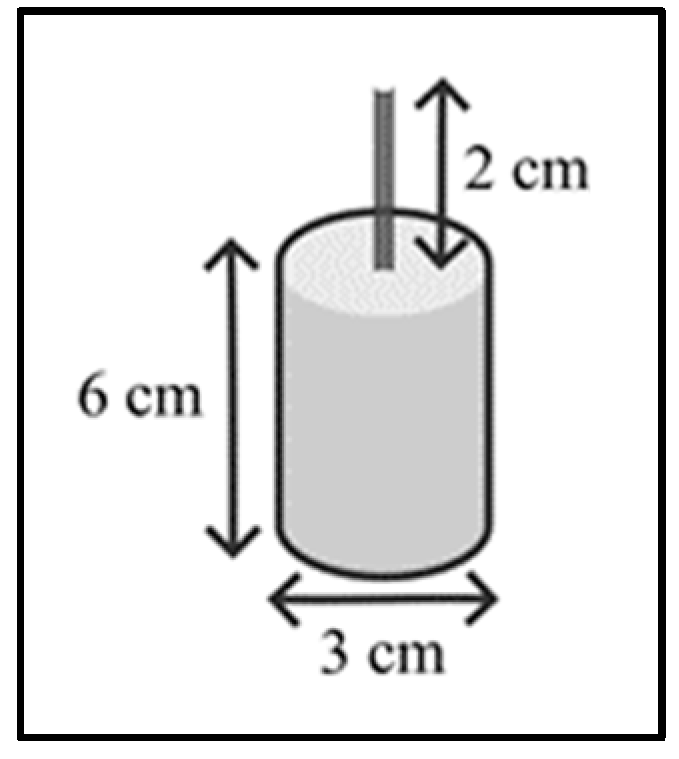
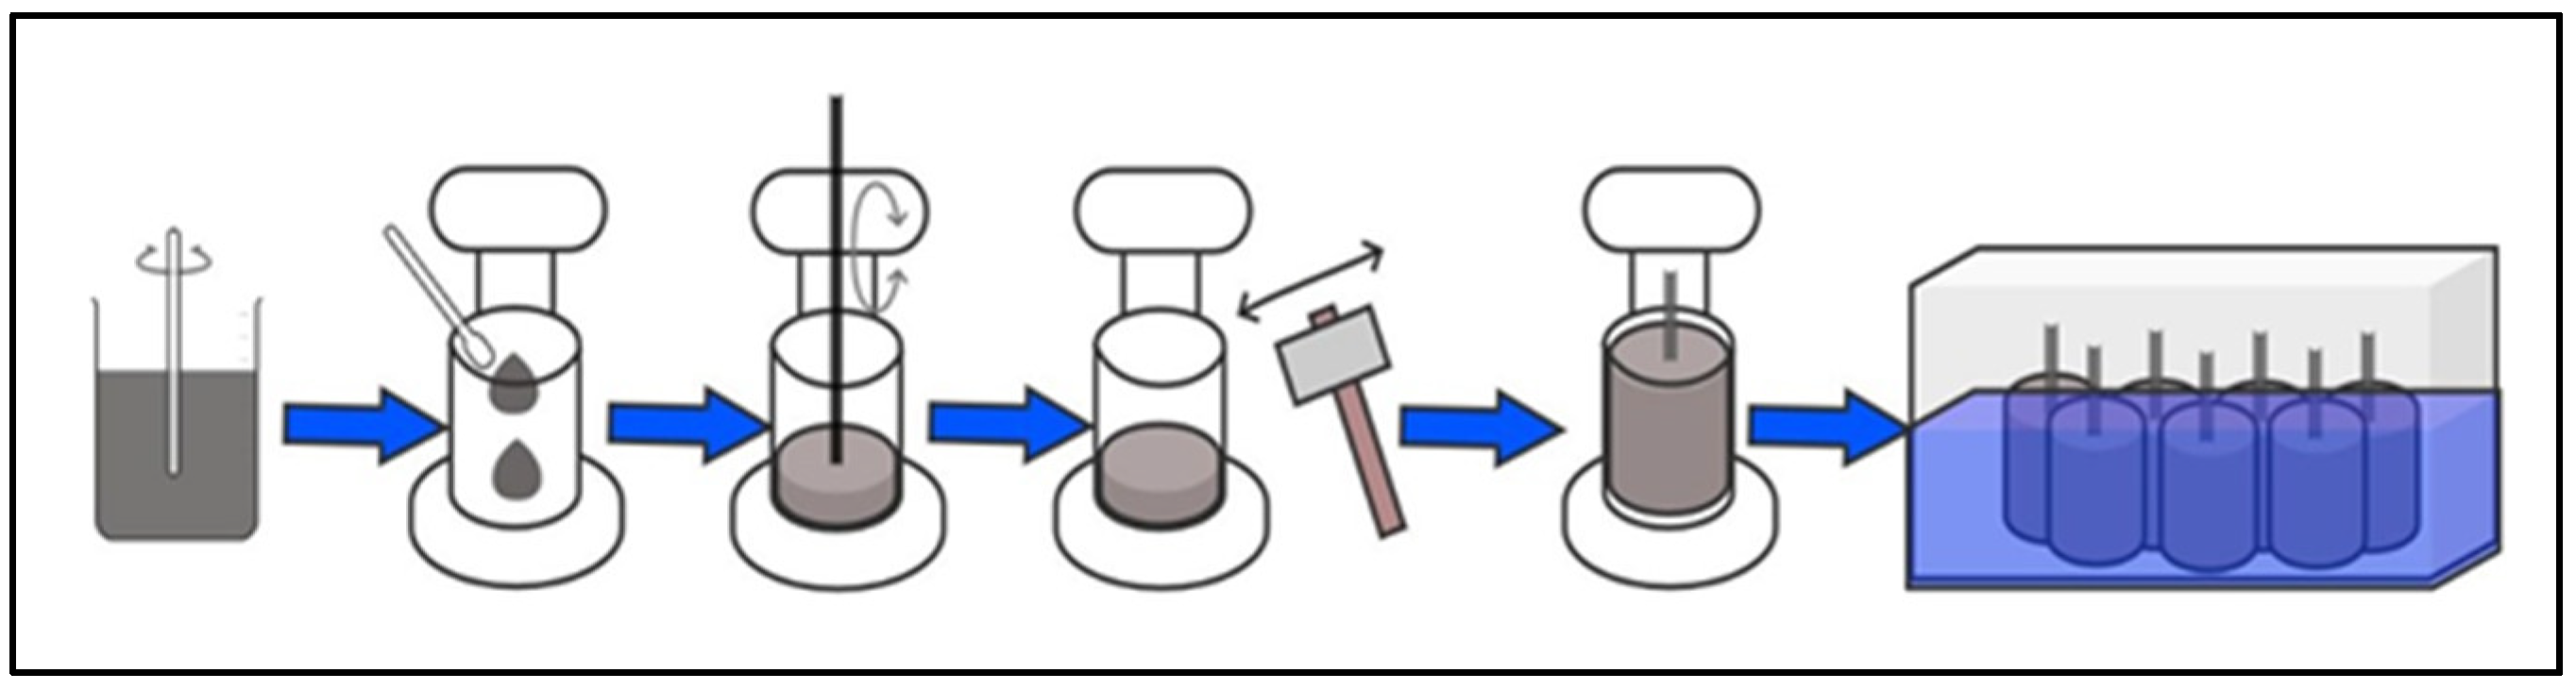
2.2. Preparation of Test Tubes
2.2.1. Characterization of the Test Specimens
2.2.2. Induction of Deterioration
2.2.3. Evaluation
3. Results and Discussion
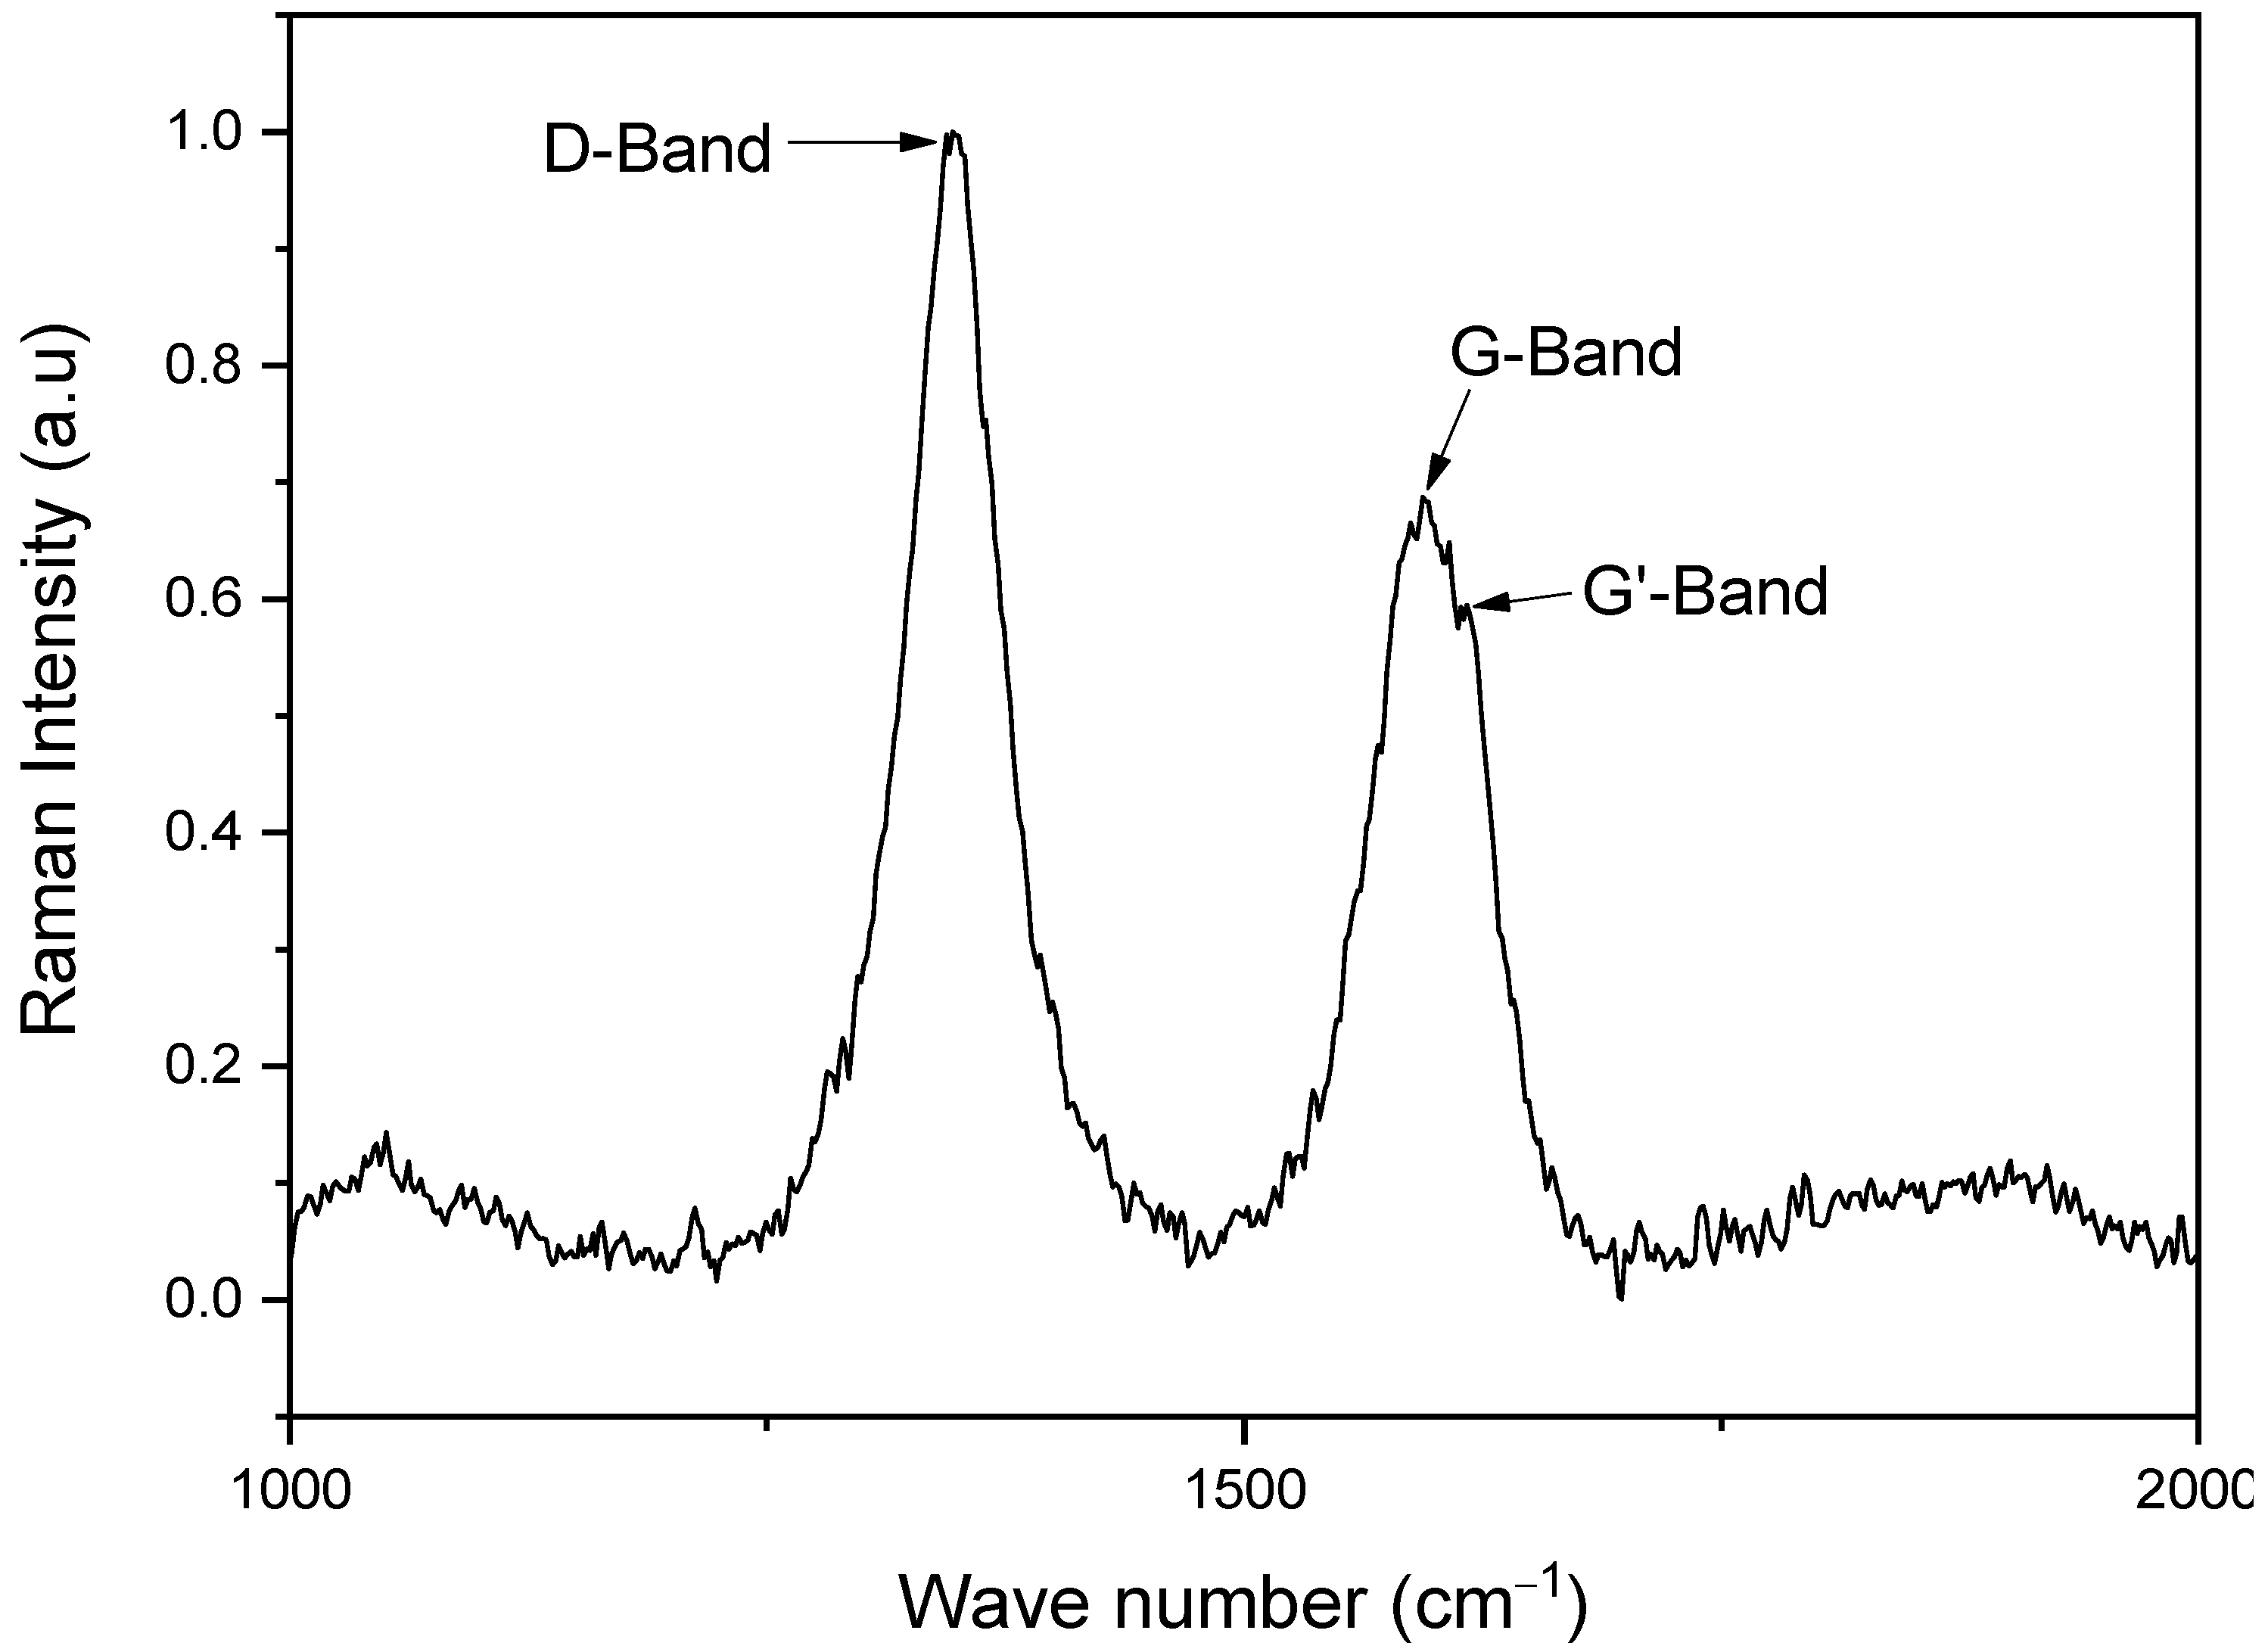
3.1. Raman Spectroscopy
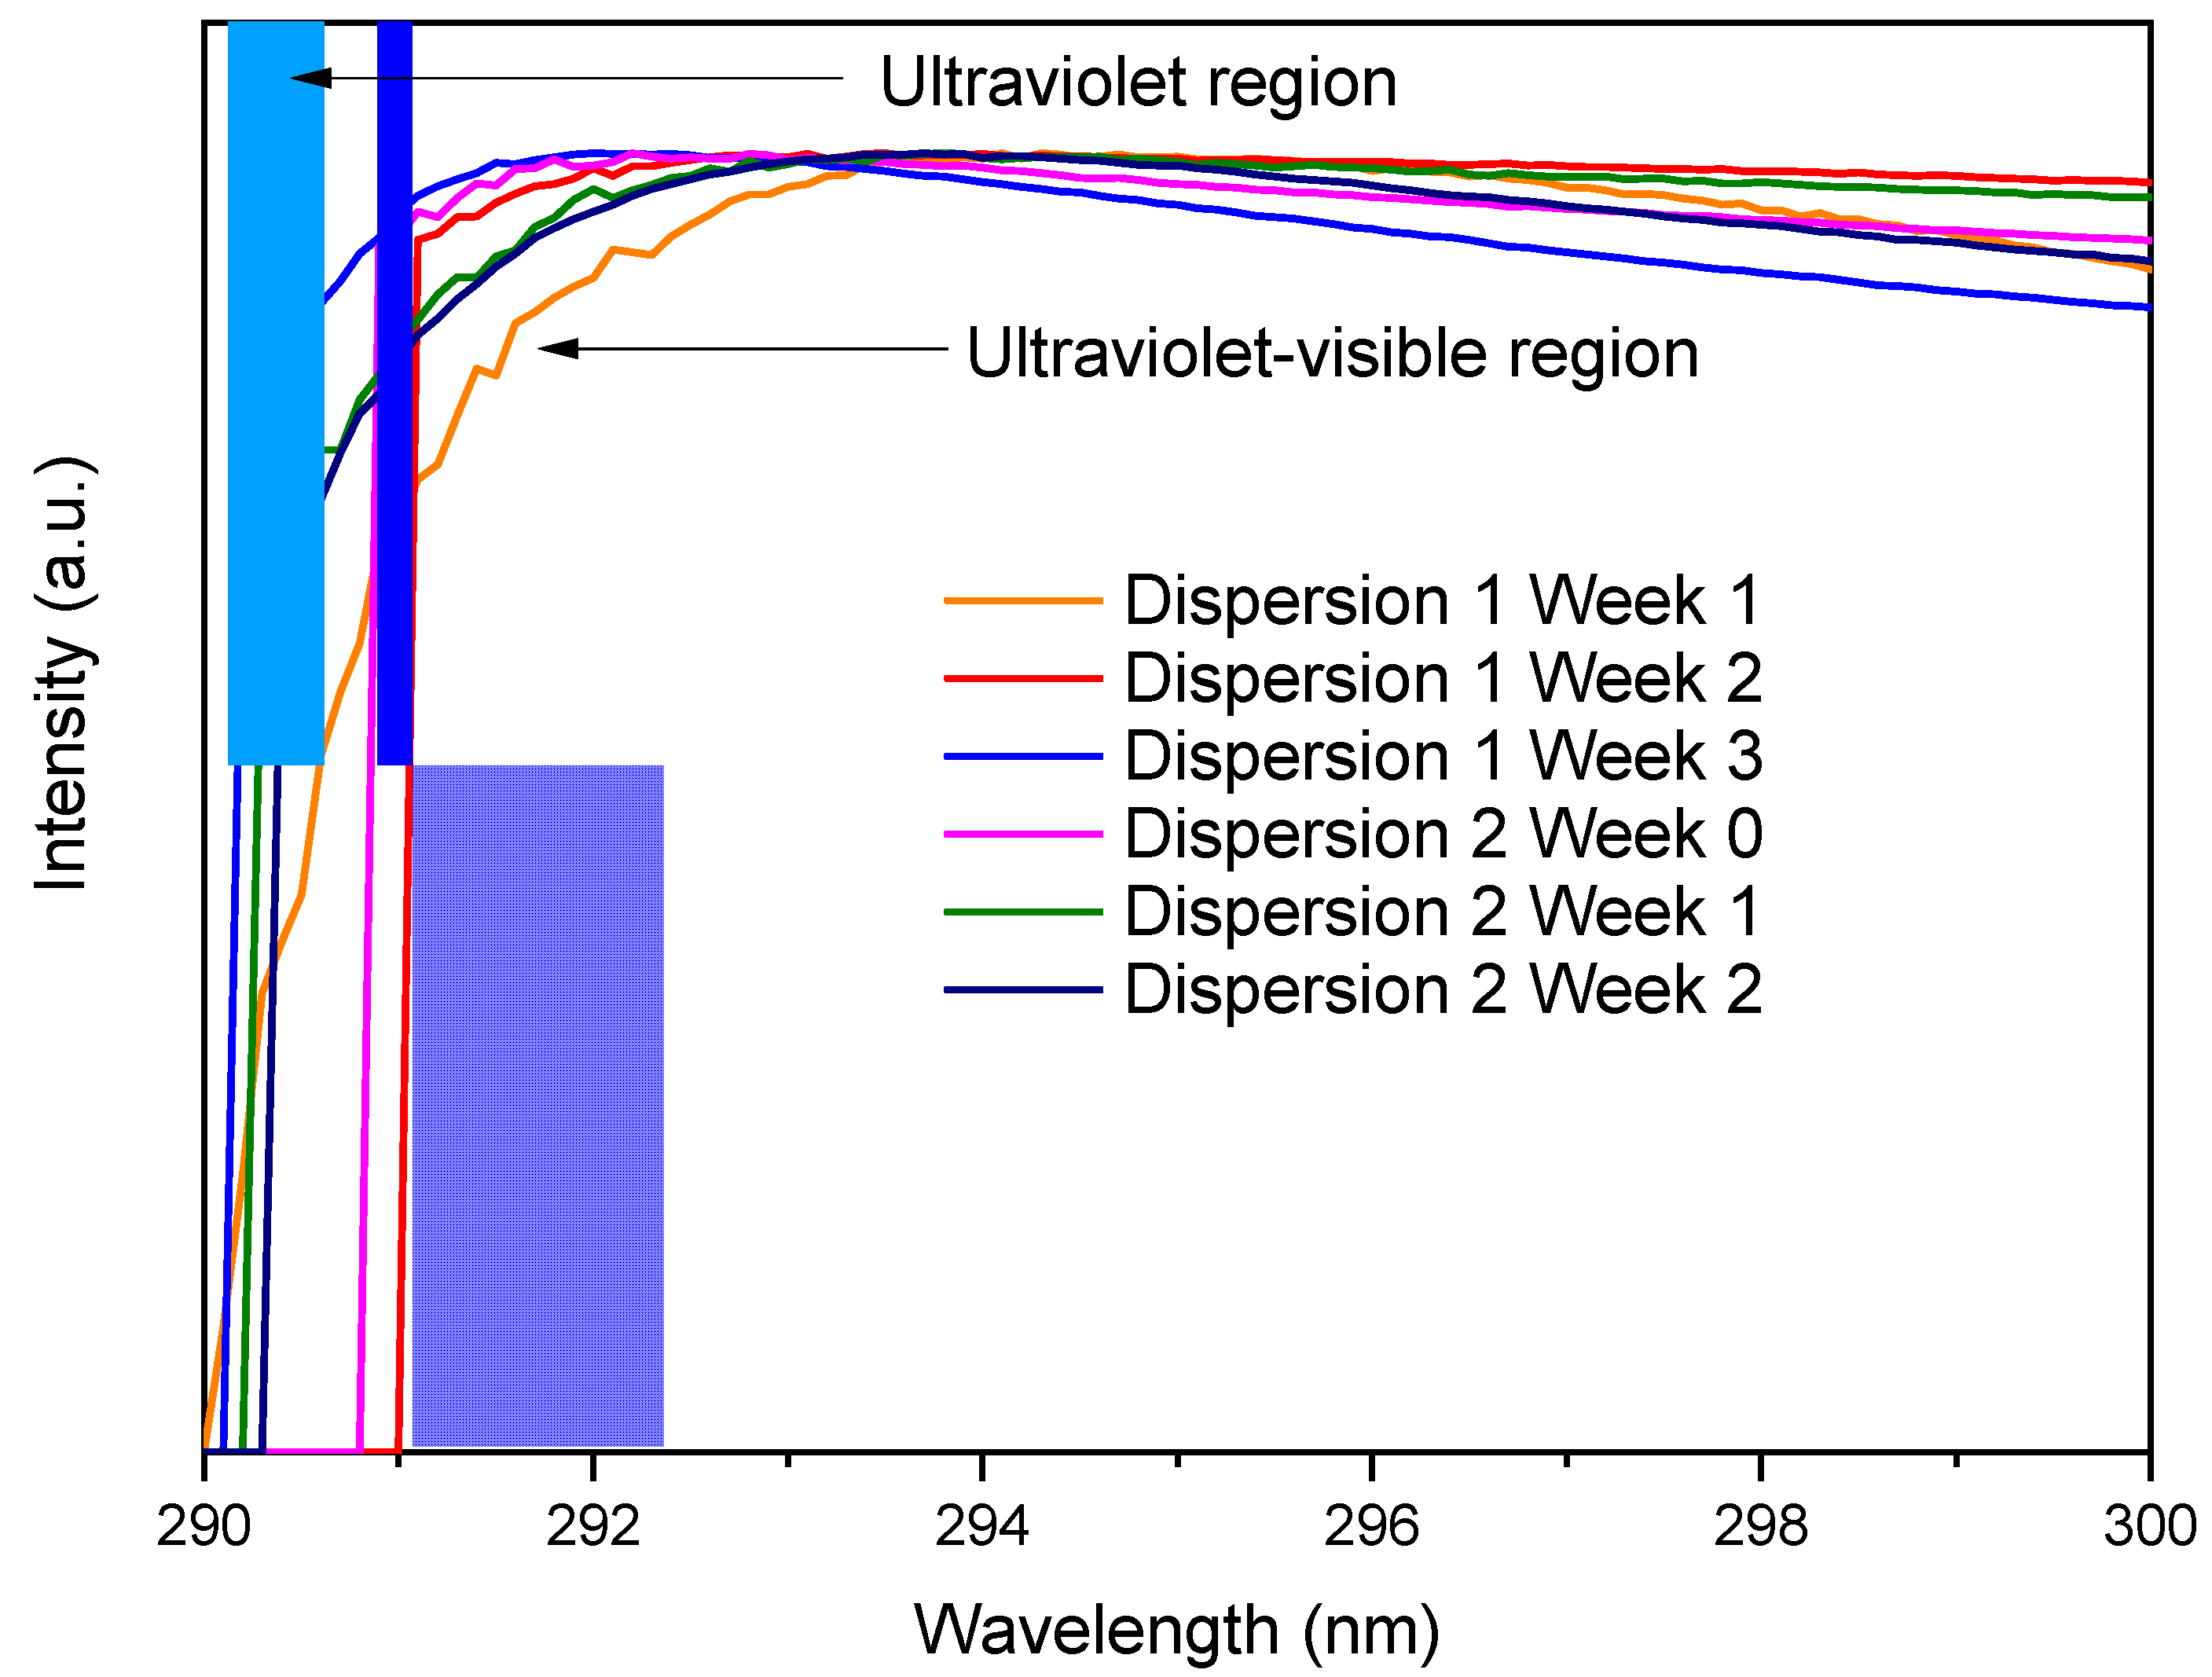
3.2. UV-Vis Spectroscopy
3.3. Zeta Potential
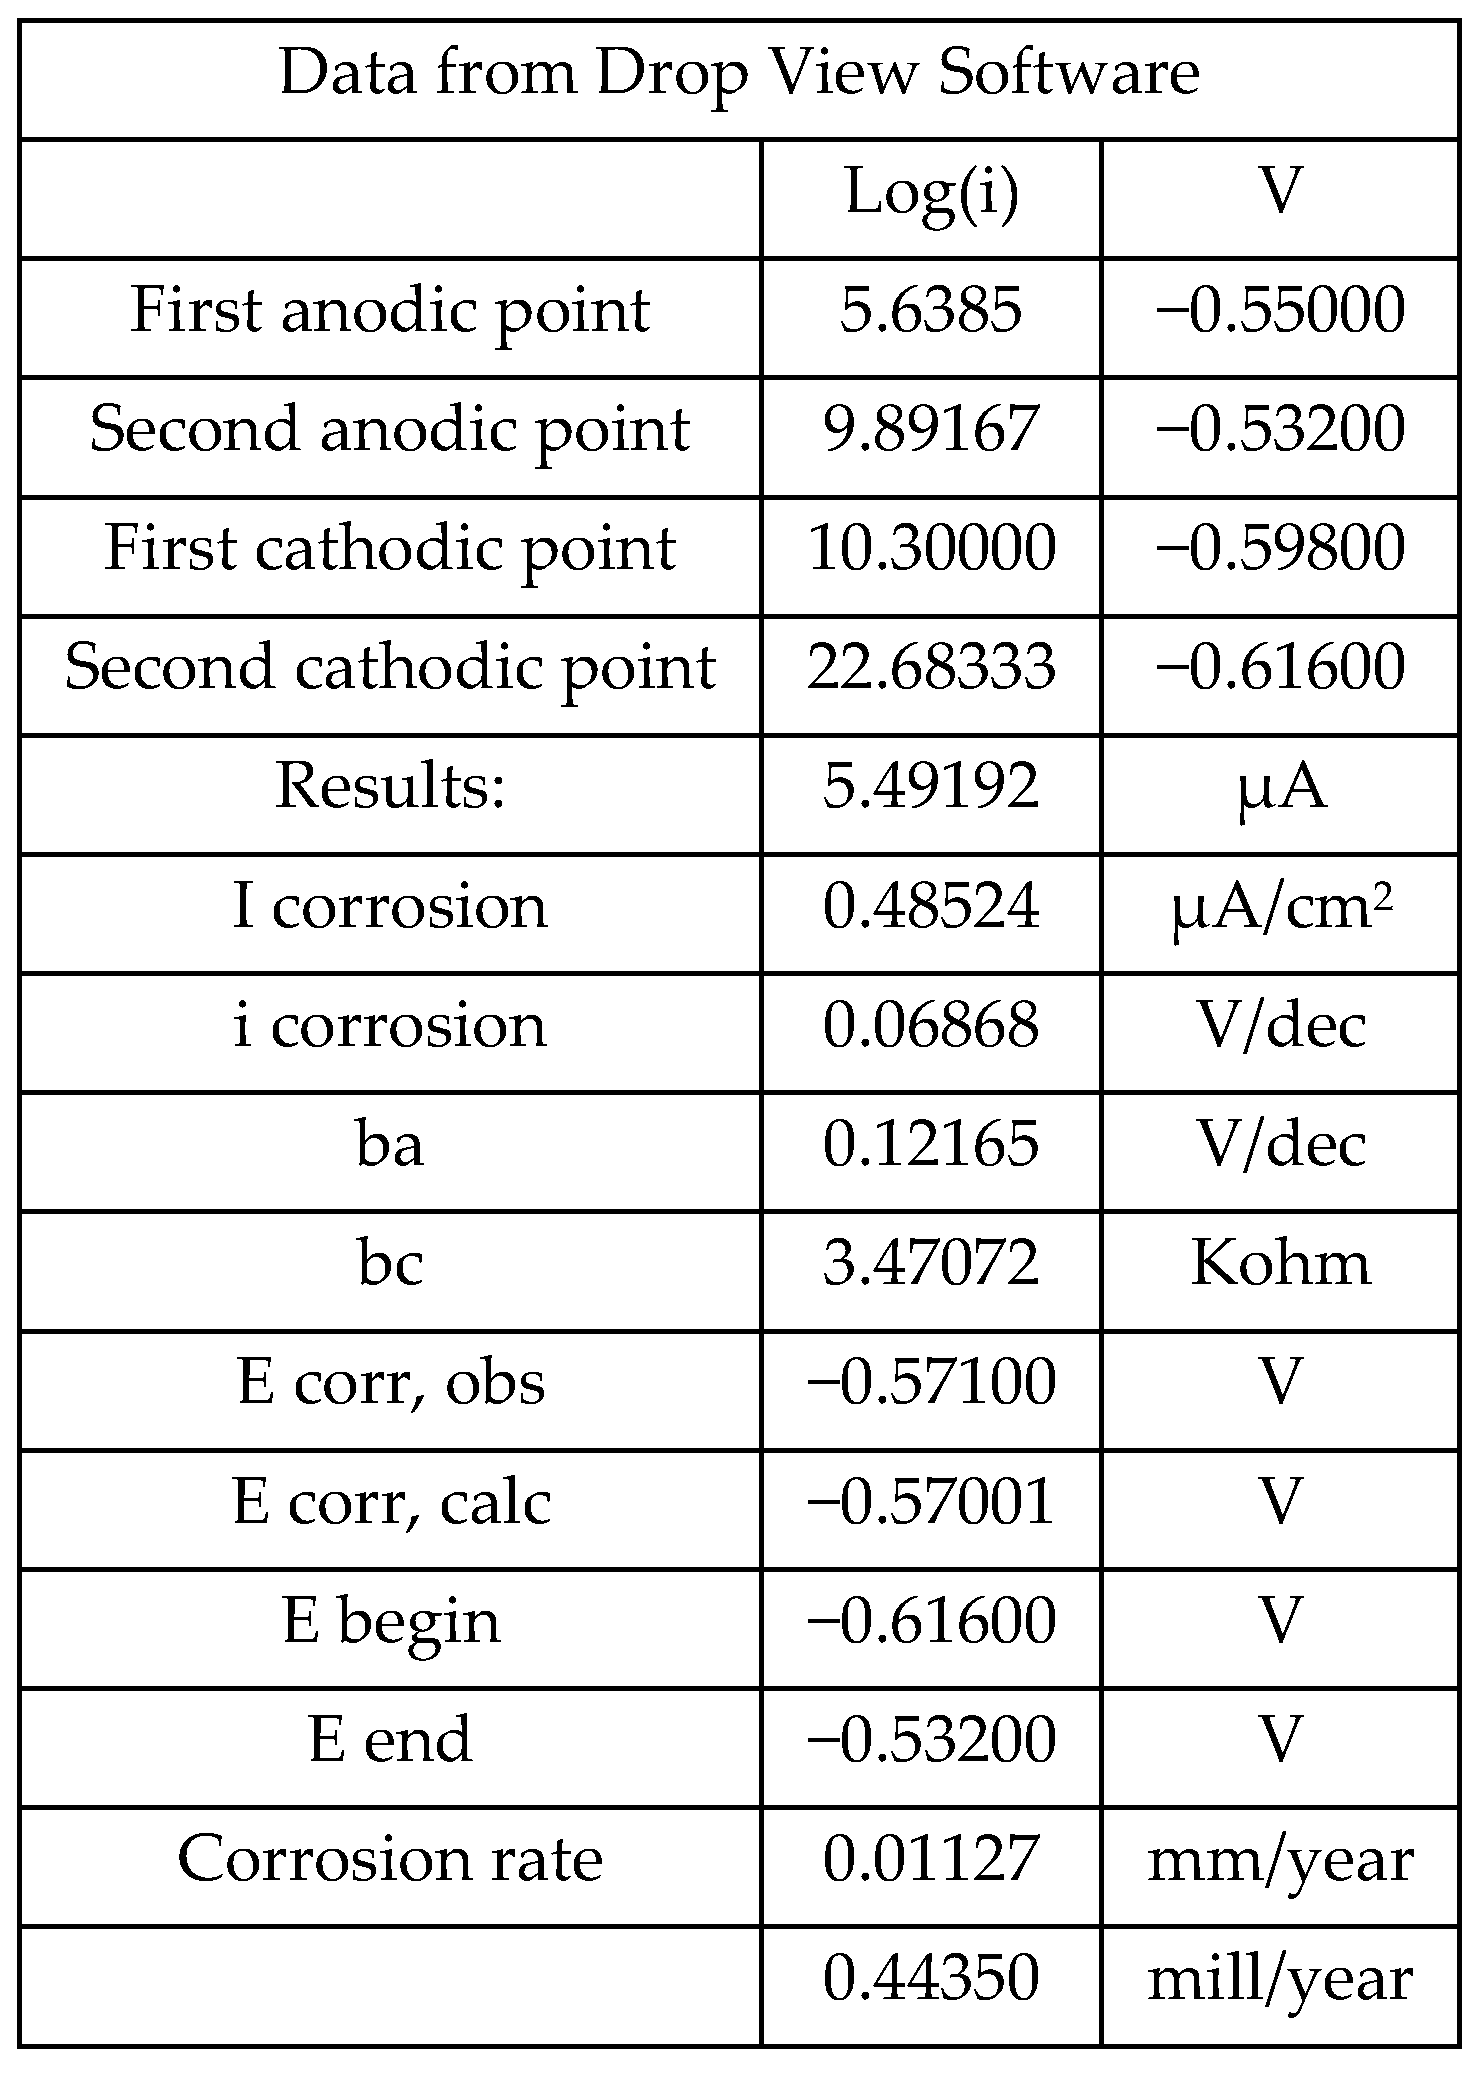
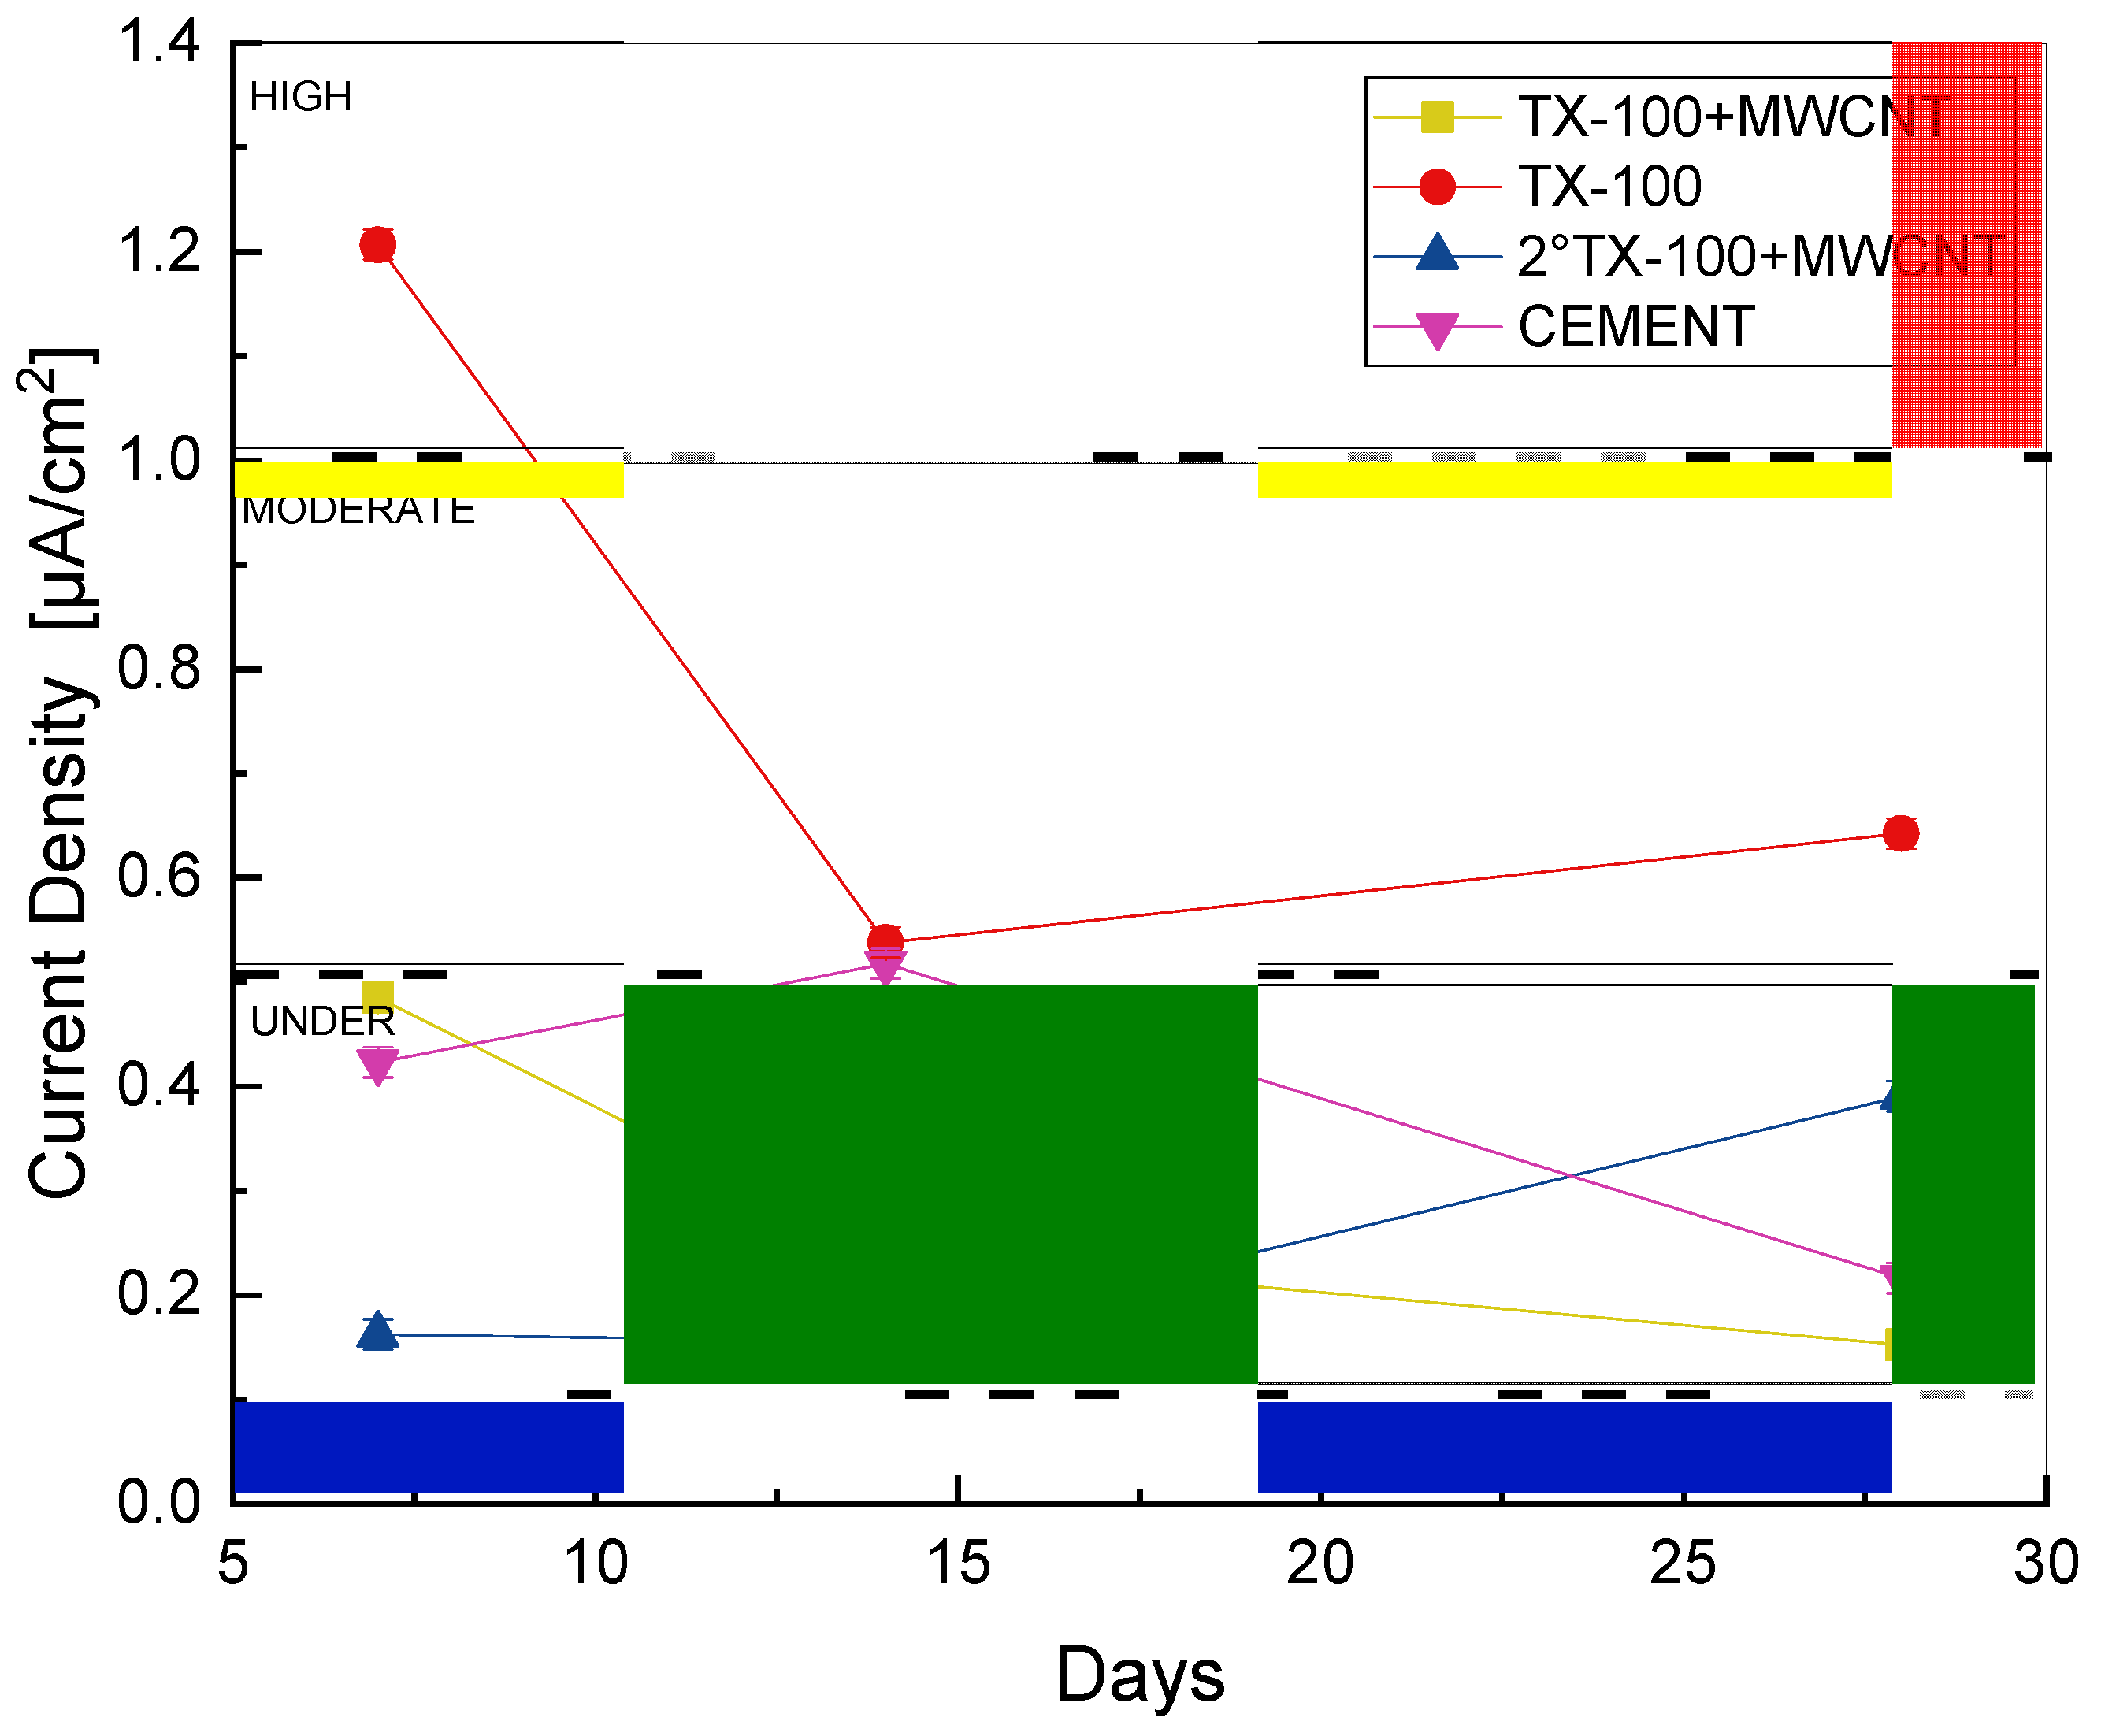
3.4. Linear Polarization Resistance (LPR)

| icorr µA/cm2 | Vcorr mm/year | Corrosion Level |
|---|---|---|
| ≤0.1 | ≤0.001 | Despicable |
| 0.1–0.5 | 0.001–0.005 | Low |
| 0.5–1 | 0.005–0.01 | Moderate |
| >1 | >0.01 | High |
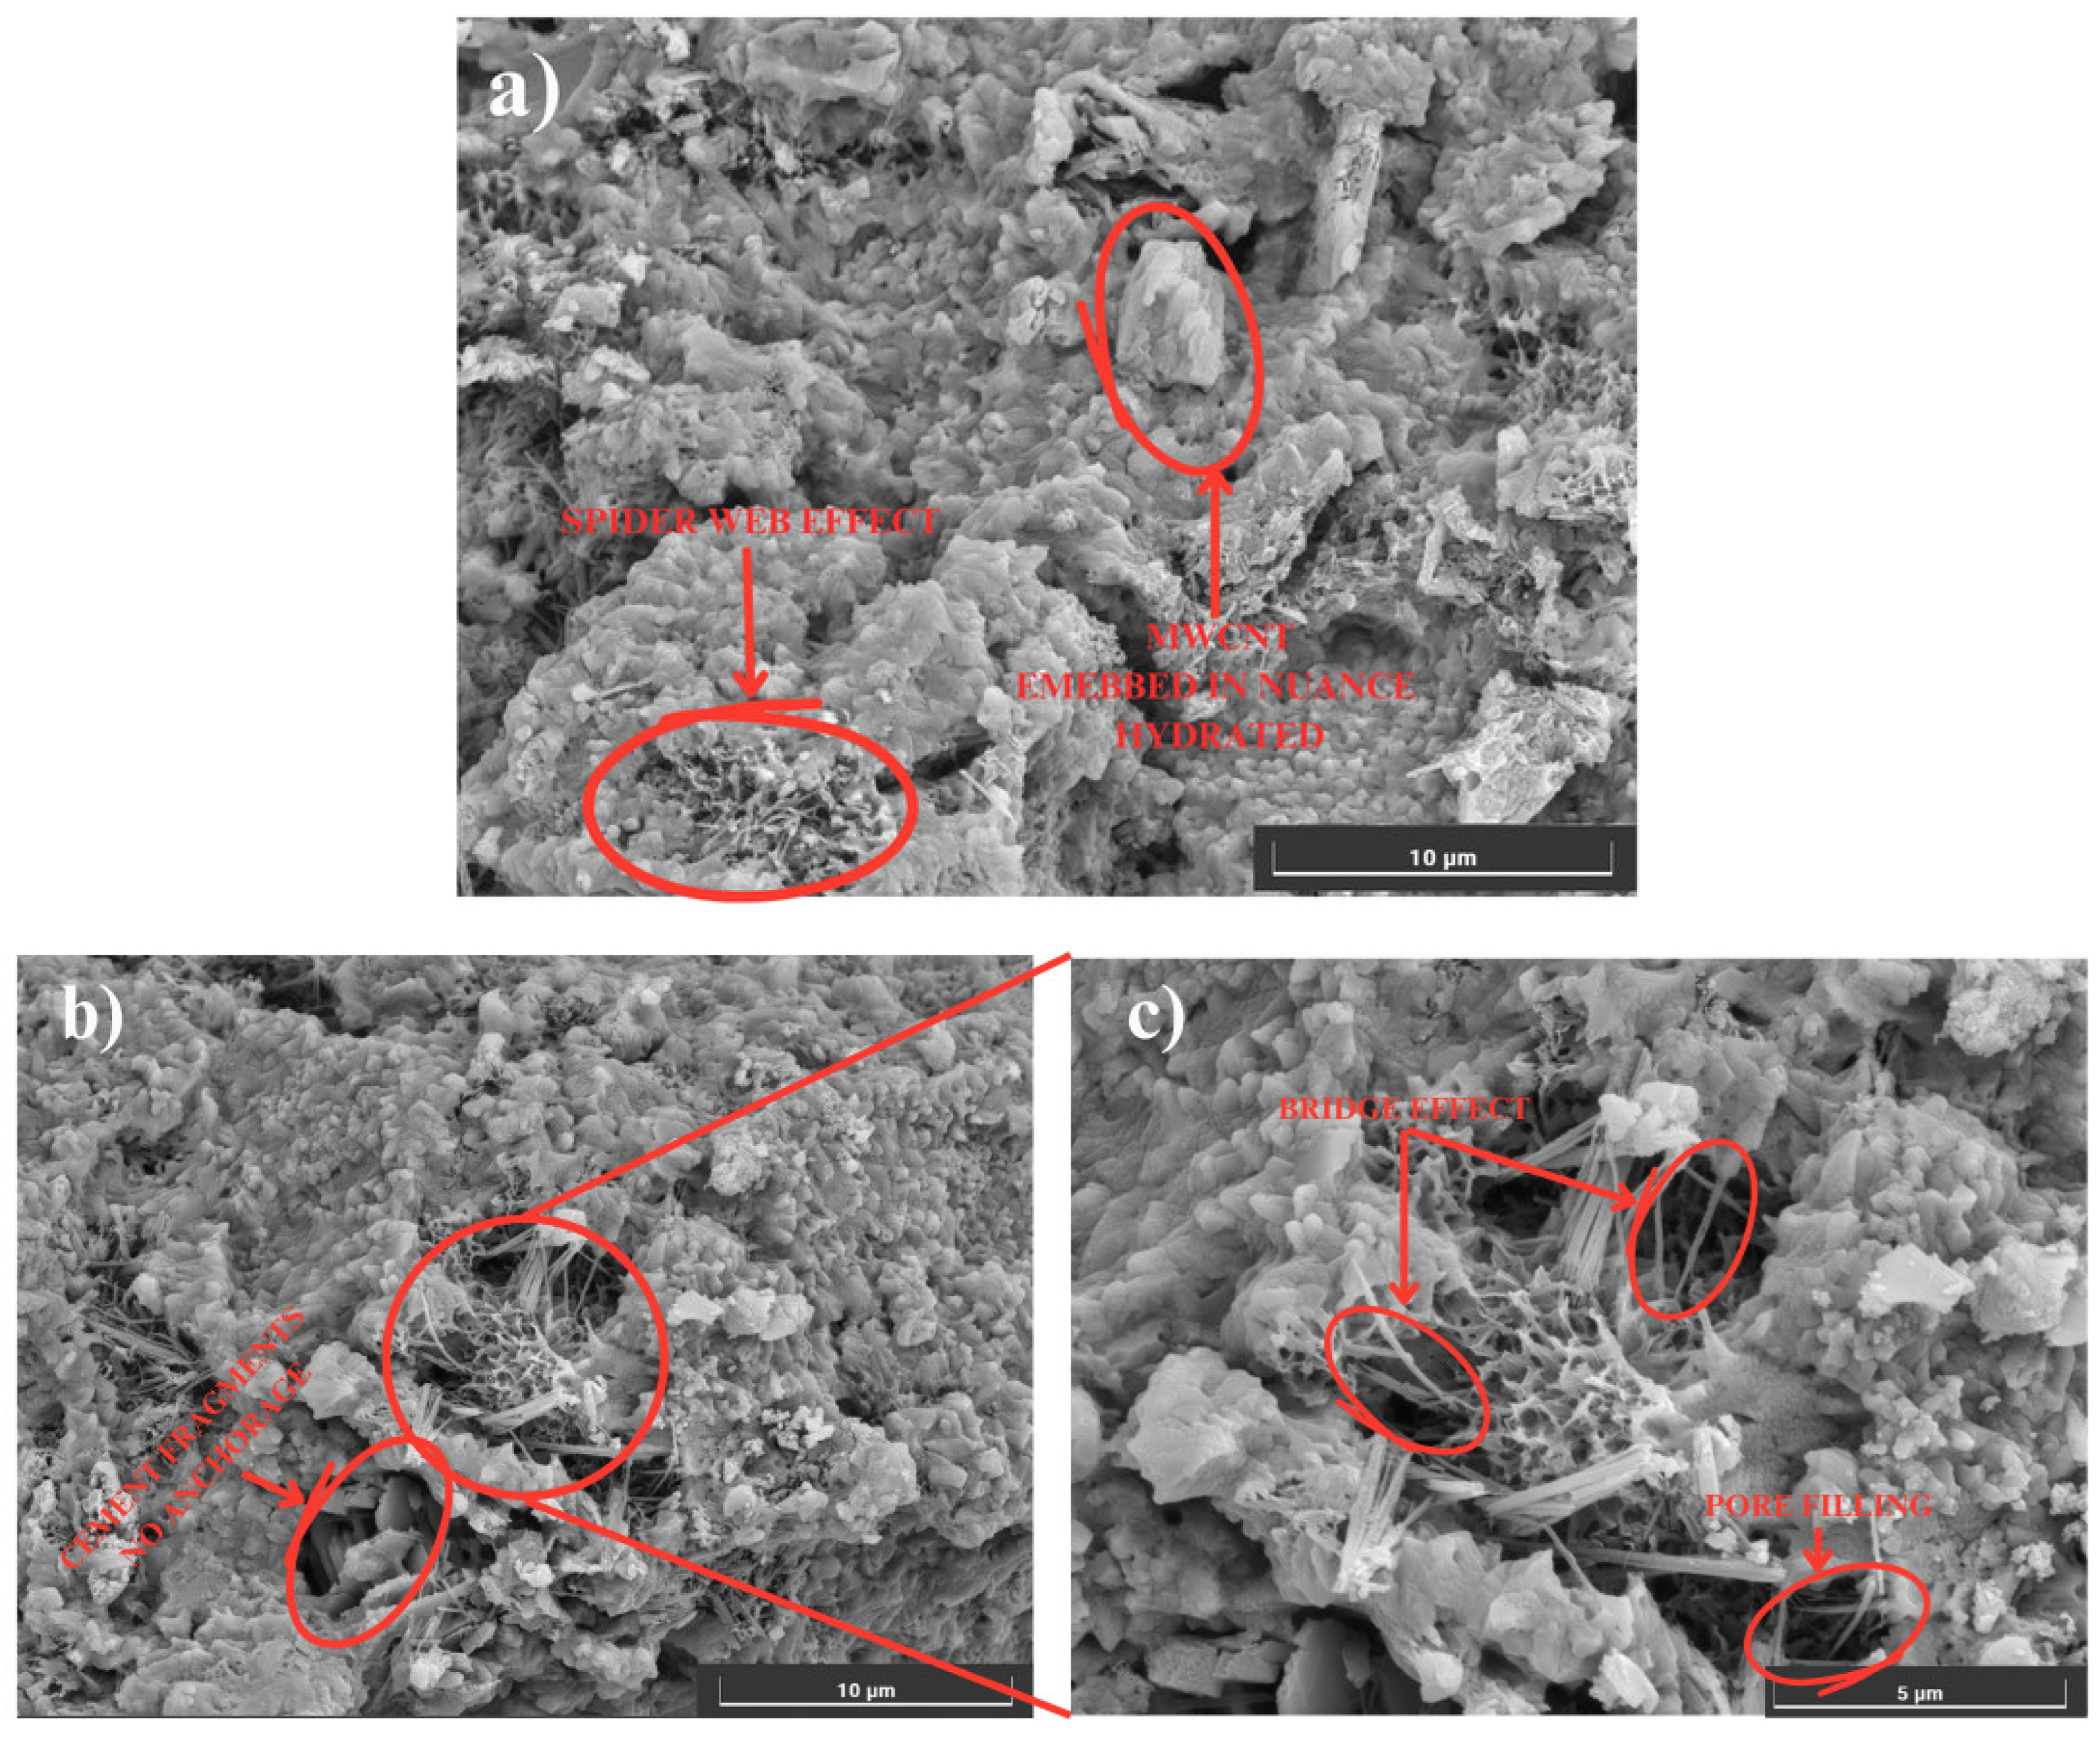
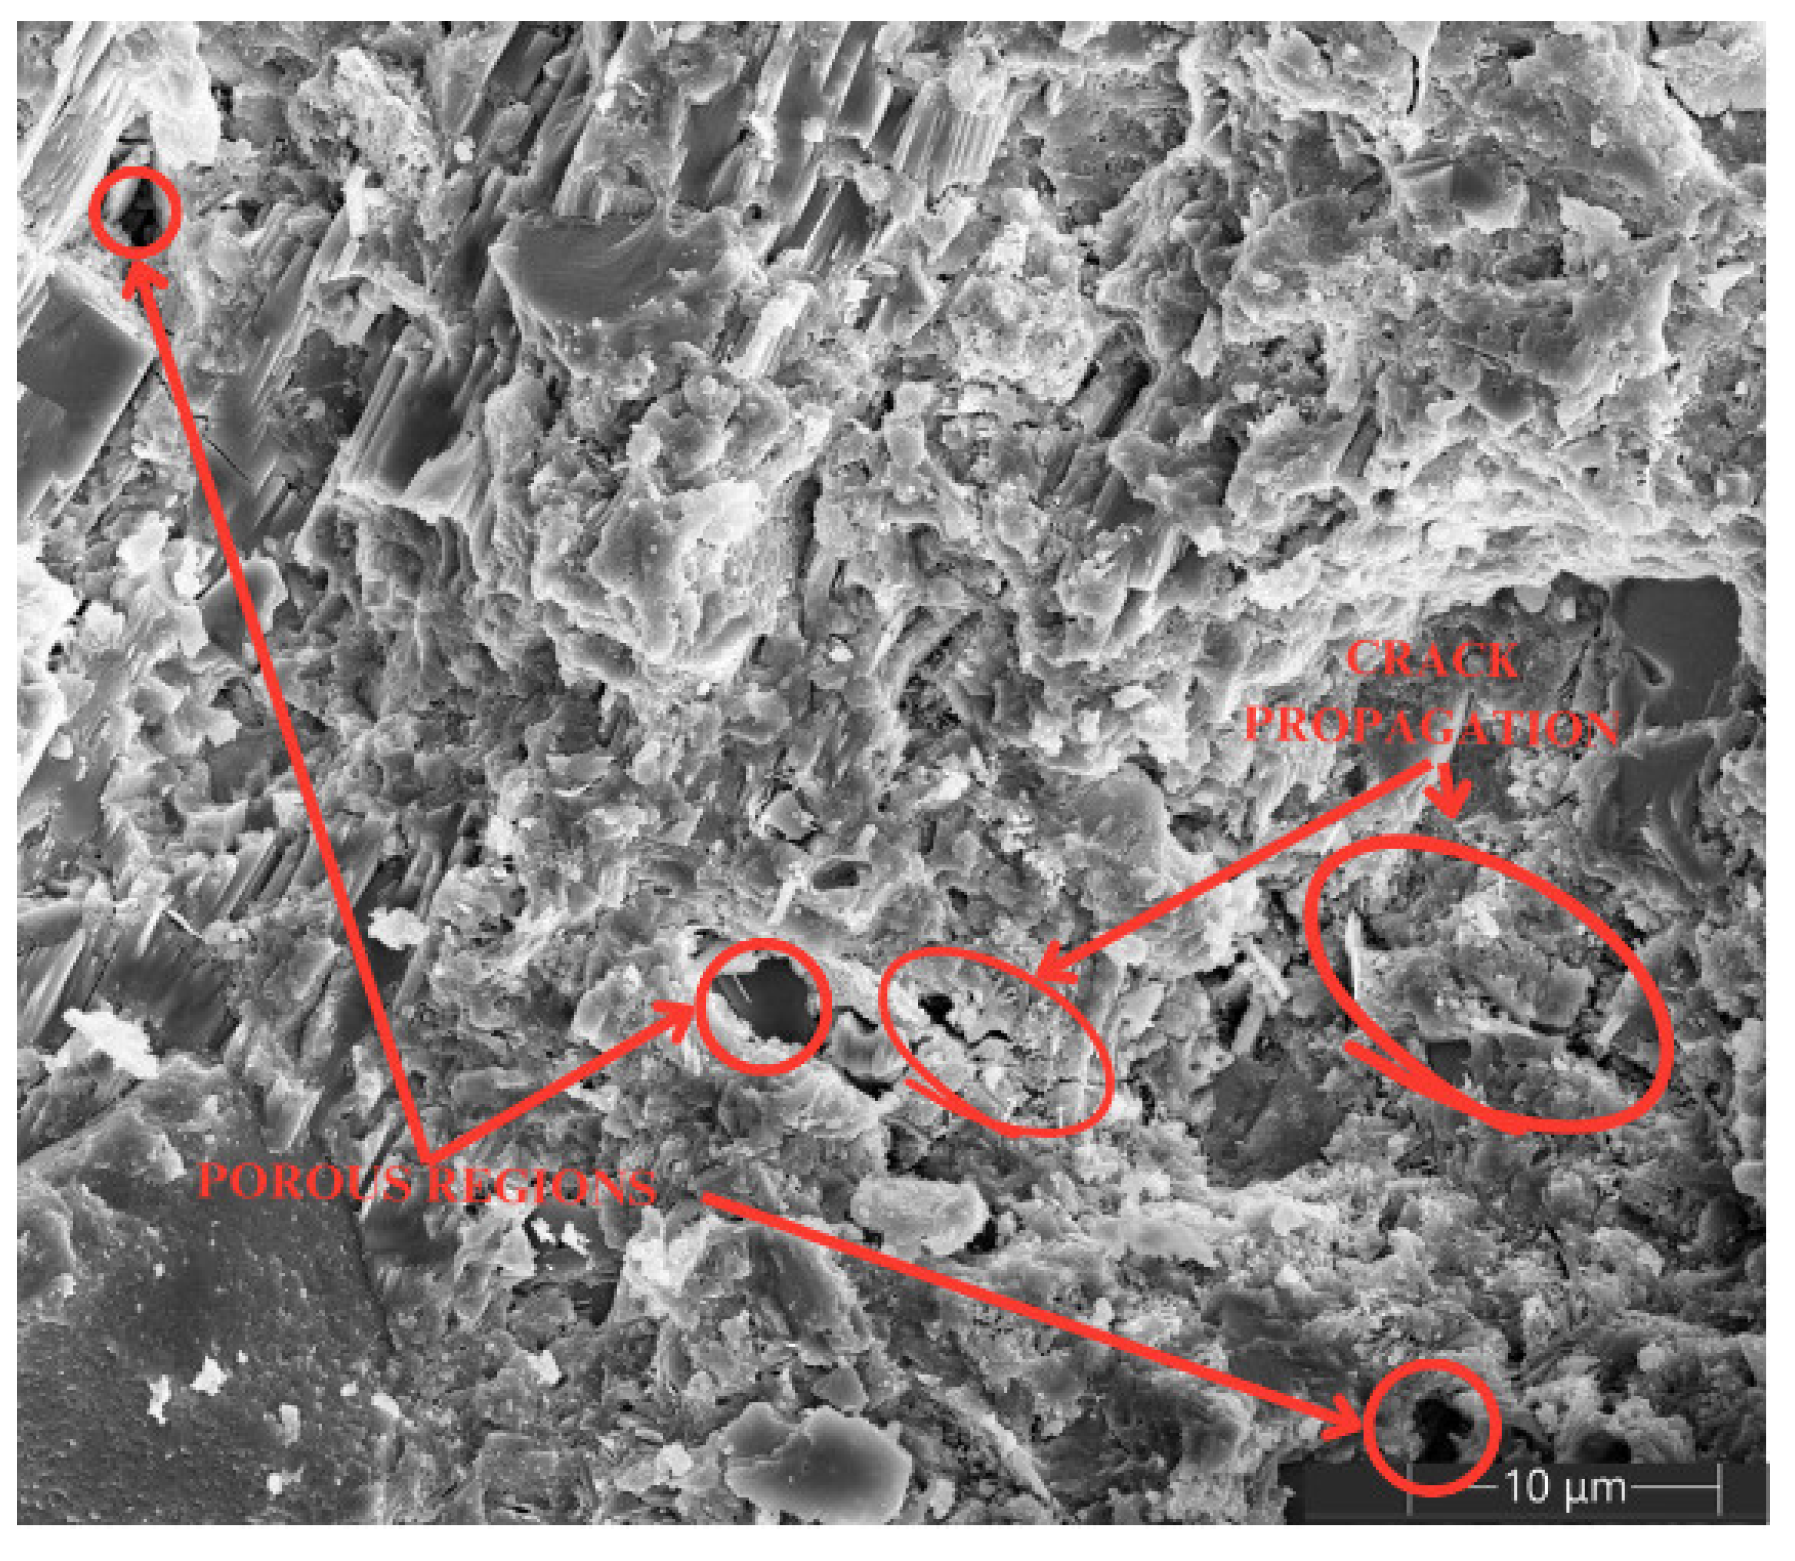
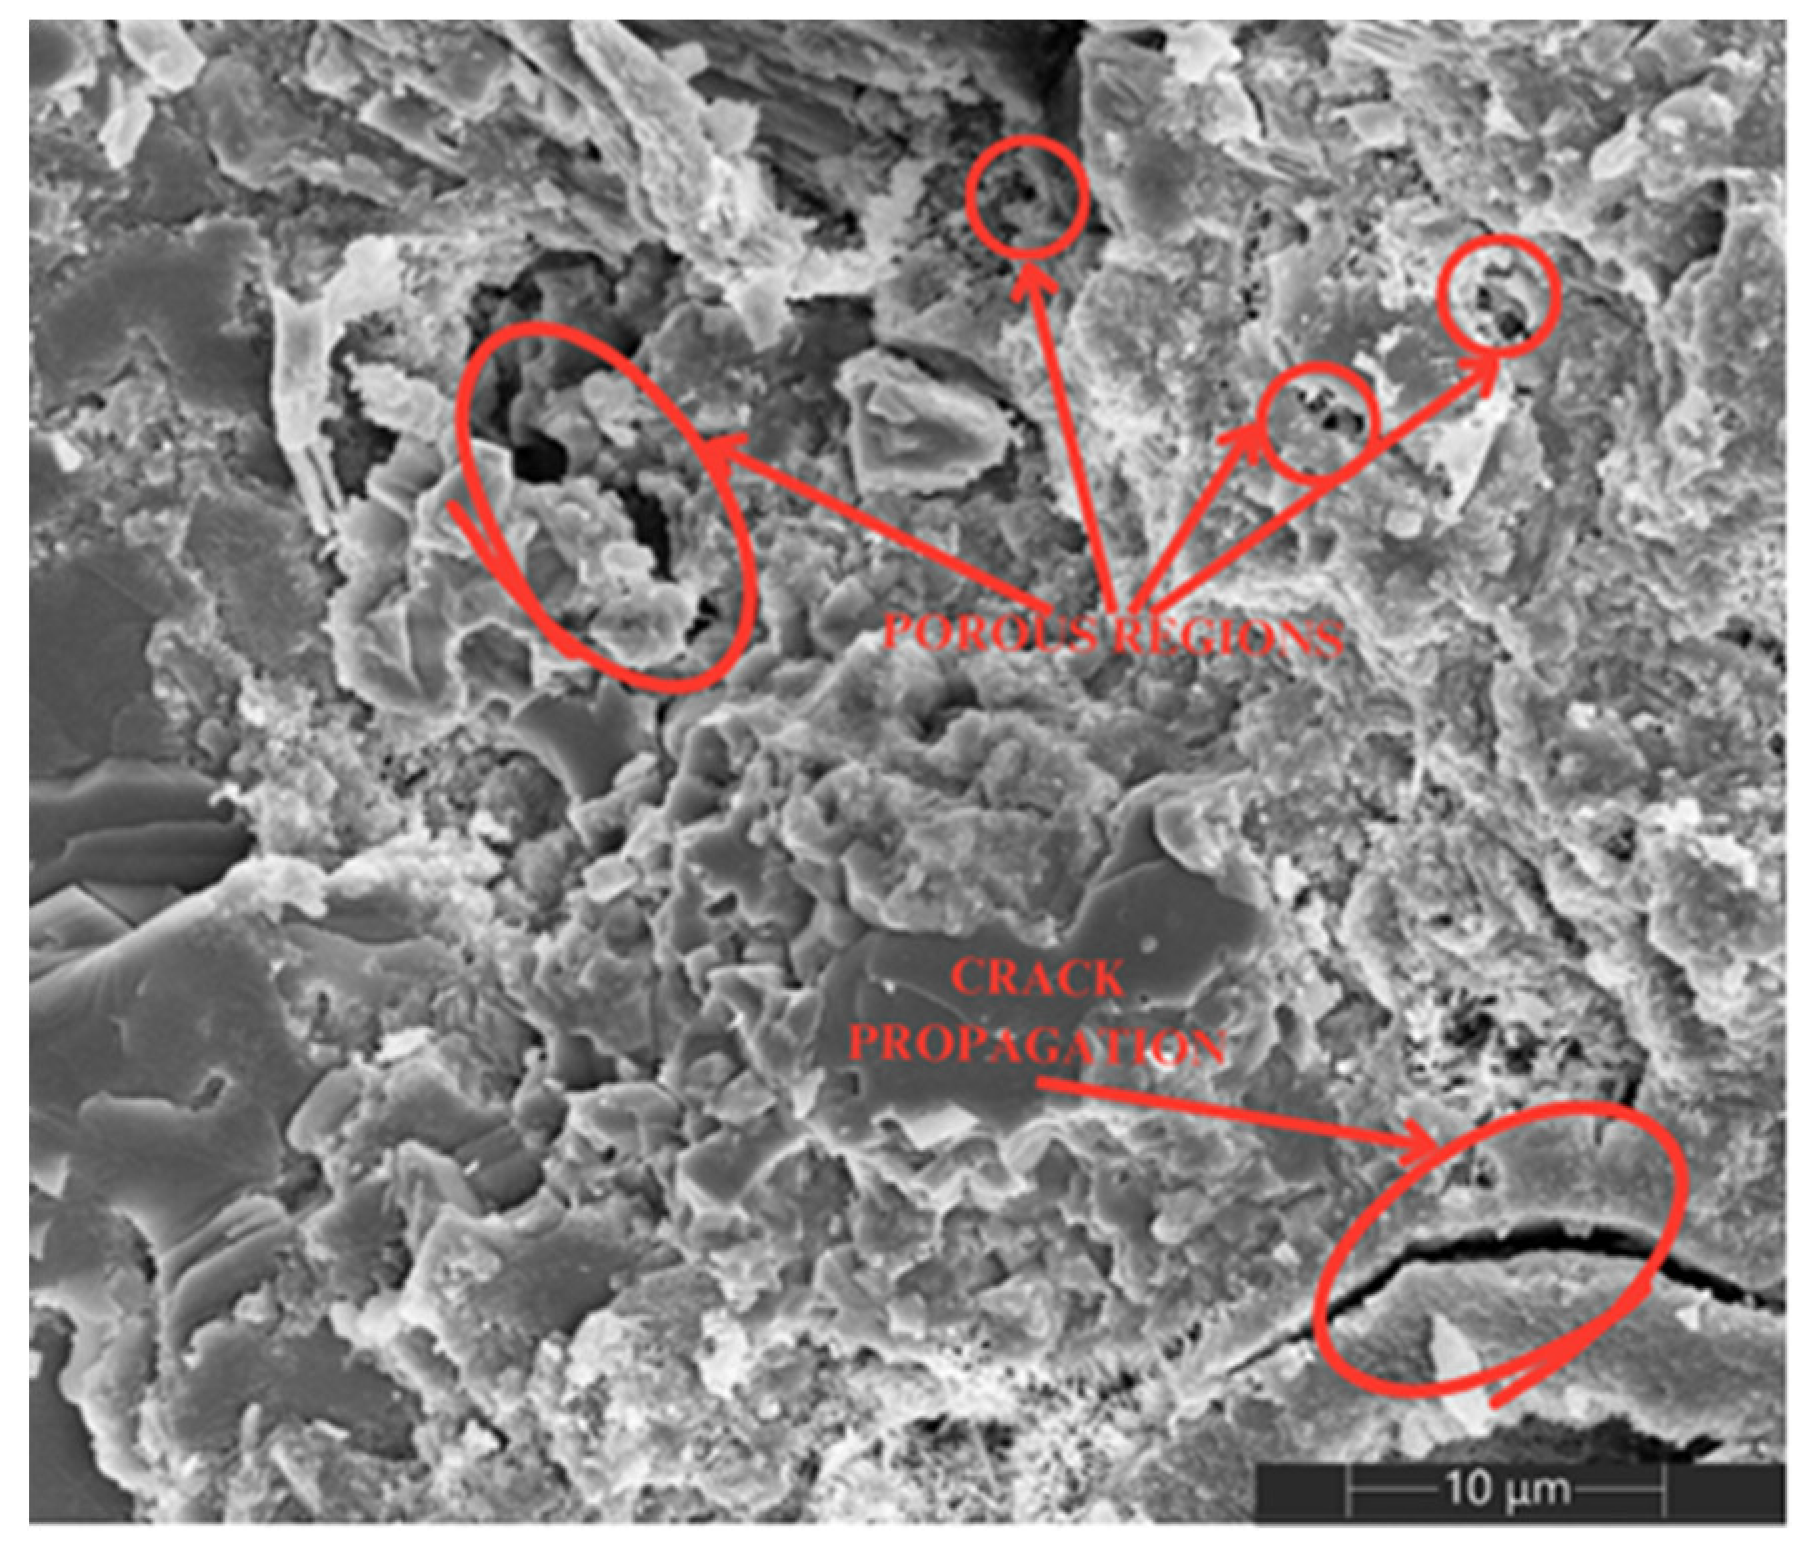
3.5. SEM
4. Conclusions
Author Contributions
Funding
Institutional Review Board Statement
Informed Consent Statement
Data Availability Statement
Acknowledgments
Conflicts of Interest
References
- Gómez, E.; Aldrhy, M. Evaluación Electroquímica de la Interacción Acero-Concreto Debido a la Introducción de Nanopartículas Base Silicio a Través de un Tratamiento Superficial. Master’s Thesis, Universidad Autónoma de Nuevo León, San Nicolás de los Garza, Nuevo León, Mexico, 2019. [Google Scholar]
- Luján, F.; Alberto, V. Efecto de la Corrosión por Ión Cloruro en las Propiedades Mecánicas de Acero de Refuerzo Embebido en Concretos Ternarios CP-CV-CBC; Instituto Politécnico Nacional, Centro Interdisciplinario de Investigación para el Desarrollo Integral Regional, Unidad Oaxaca (CIIDIR Oaxaca): Santa Cruz Xoxocotlán, México, 2020. [Google Scholar]
- Técnicas Aceleradas para Evaluar la Susceptibilidad a Corrosión de Aceros Embebidos en Morteros con Adiciones Minerales Expuestos a Cloruros. Informador Técnico. 2020. Available online: https://revistas.sena.edu.co/index.php/inf_tec/article/view/158 (accessed on 11 September 2024).
- Song, H.W.; Jung, M.S.; Lee, C.H.; Kim, S.H.; Ann, K.Y. Influence of Chemistry of Chloride Ions in Cement Matrix on Corrosion of Steel. ACI Mater. J. 2010, 107. Available online: https://www.concrete.org/publications/internationalconcreteabstractsportal.aspx?m=details&ID=51663858 (accessed on 11 September 2024).
- Cárdenas, M.A. La Carbonatación del Concreto… Un Problema en un Mundo Industrializado. LinkedIn. Available online: https://es.linkedin.com/pulse/la-carbonataci%C3%B3n-del-concreto-un-problema-en-mundo-alvarez-cardenas (accessed on 14 September 2024).
- Xu, J.; Jiang, L.; Wang, J. Influence of Detection Methods on Chloride Threshold Value for the Corrosion of Steel Reinforcement. In Construction and Building Materials; Elsevier: Amsterdam, The Netherlands, 2009; pp. 1902–1908. [Google Scholar]
- Sagoe-Crentsil, K.K.; Glasser, F.P. “Green rust”, iron solubility and the role of chloride in the corrosion of steel at high pH. Cem. Concr. Res. 1993, 23, 785–791. [Google Scholar] [CrossRef]
- Konsta-Gdoutos, M.S.; Metaxa, Z.S.; Shah, S.P. Highly dispersed carbon nanotube reinforced cement-based materials. Cem. Concr. Res. 2010, 40, 1052–1059. [Google Scholar] [CrossRef]
- Giraldo, J. Efecto de la Introducción de Nanopartículas Sobre la Microestructura de Matrices Endurecidas Base Cemento Portland. Master’s Thesis, Universidad Autónoma de Nuevo León, San Nicolás de los Garza, Nuevo León, Mexico, 2015. [Google Scholar]
- Torres, R.; Aperador, W.; Vera, E.; Mejía, R.; Ortiz, C. Estudio de la Corrosión del Acero Embebido en Concreto AAS Sometido a Cloruros; Universidad Pedagógica y Tecnológica de Colombia, Universidad del Valle, Escuela de Física; Dyna: Medellín, Colombia, 2010; pp. 52–59. [Google Scholar]
- Holland, R.B.; Kurtis, K.E.; Kahn, L.F. Effect of different concrete materials on the corrosion of the embedded reinforcing steel. In En Corrosion of Steel in Concrete Structures; Elsevier: Amsterdam, The Netherlands, 2016; pp. 131–147. [Google Scholar]
- Flores, A.; Uruchurtu, J. Efecto de la Corrosión del Concreto Reforzado con Adición de Polvo de Grafito y su Evaluación en sus Propiedades Físicoelectroquímicas; Centro de Investigación en Ingeniería y Ciencias Aplicadas (CIICAp), Universidad Autónoma del Estado de Morelos: Cuernavaca, Mexico, 2021. [Google Scholar]
- Marcondes, C.G.N.; Medeiros, M.H.F. Análisis de la dispersión de soluciones conteniendo nanotubos de carbono para su uso en concretos de cemento Portland. Rev. Alconpat. 2016, 6, 84–100. [Google Scholar] [CrossRef]
- Hielscher. Nano Particles. Hielscher Ultrasonics. Available online: https://www.hielscher.com/es/nano_03.htm (accessed on 18 September 2024).
- Echeverry, L. Energías de Dispersión y Surfactantes en una Solución de Nanotubos de Carbono en Agua: Aplicaciones en Pastas de Cemento Portland. Master’s Thesis, Universidad Nacional de Colombia, Sede Manizales, Manizales, Colombia, 2020. [Google Scholar]
- Parveen, S.; Rana, S.; Fangueiro, R. A Review on Nanomaterial Dispersion, Microstructure, and Mechanical Properties of Carbon Nanotube and Nanofiber Reinforced Cementitious Composites. J. Nanomater. 2013, 2013, 710175. [Google Scholar] [CrossRef]
- García González, M.A.; Sánchez Mendonza, E.; Waksman Minsky, N.; Saucedo, A.L. Fundamentos y analogías para entender mejor la espectroscopía de RMN. Educ. Química 2022, 33, 3–13. [Google Scholar] [CrossRef]
- Concepción, D.; Gonzalo, S. Title of Chapter. In Espectroscopía Raman de Nanotubos de Carbono; Instituto de Estructura de la Materia, CSIC: Madrid, Spain, 2007. [Google Scholar]
- Alberto, R.R.M. Caracterización Estructural y Óptica de Nanotubos de Carbón Funcionalizados con NI y AG. Available online: http://zaloamati.azc.uam.mx/handle/11191/5750 (accessed on 27 September 2024).
- Hanako, R.S. Microscopía Electrónica de Barrido y Microanálisis de Elementos del Clúster Científico y Tecnológico BioMimic. INECOL. Available online: https://www.mexicoambiental.com/microscopia-electronica-de-barrido-y-microanalisis-de-elementos-del-cluster-cientifico-y-tecnologico-biomimic/ (accessed on 10 October 2024).
- Pérez, J.B. Diseño y Construcción de un Prototipo de Potenciostato Galvanostato para el Laboratorio de Corrosión de la Escuela de Ingeniería Metalúrgica. Dialnet. Available online: https://dialnet.unirioja.es/servlet/articulo?codigo=6299760 (accessed on 1 October 2024).
- Terán, J.; Arroyo, M.; Teresa, M.V.; Vázquez, D. Desarrollo de un Sistema Galvanostático para la Corrosión Acelerada en Varillas de Refuerzo; Instituto Mexicano del Transporte: Pedro Escobedo, Querétaro, México, 2022. [Google Scholar]
- Chousidis, N.; Zacharopoulou, A.; Zeris, C.; Batis, G. Corrosion resistance and physical-mechanical properties of reinforced mortars with and without carbon nanotubes. J. Mater. Sci. Chem. Eng. 2022, 10, 1–23. [Google Scholar] [CrossRef]
- Icontec. Norma Técnica Colombiana NTC 1377: Ingeniería Civil y Arquitectura. In Elaboración y Curado de Especímenes de Concreto para Ensayos de Laboratorio; Icontec: Bogotá, Colombia, 2021; Available online: https://www.academia.edu/32426842/NORMA_T%C3%89CNICA_NTC_COLOMBIANA_1377_INGENIER%C3%8DA_CIVIL_Y_ARQUITECTURA_ELABORACI%C3%93N_Y_CURADO_DE_ESPEC%C3%8DMENES_DE_CONCRETO_PARA_ENSAYOS_DE_LABORATORIO (accessed on 7 October 2024).
- Icontec. Norma Técnica Colombiana NTC 550: Concretos. In Elaboración y Curado de Especímenes de Concreto en el Sitio de Trabajo; Icontec: Bogotá, Colombia, 2020; Available online: https://www.studocu.com/co/document/universidad-central-colombia/practica-de-ingenieria-3/norma-tecnica-colombiana-ntc-550/9946424 (accessed on 7 October 2024).
- Ferrari, A.C.; Robertson, J. Interpretation of Raman spectra of disordered and amorphous carbon. Phys. Rev. B Condens. Matter 2000, 61, 14095–14107. [Google Scholar] [CrossRef]
- Ryabenko, A.G.; Dorofeeva, T.V.; Zvereva, G.I. UV–VIS–NIR spectroscopy study of sensitivity of single-wall carbon nanotubes to chemical processing and Van-der-Waals SWNT/SWNT interaction. Carbon 2004, 42, 1523–1535. [Google Scholar] [CrossRef]
- Li, H.; Qiu, Y. Dispersion, sedimentation and aggregation of multi-walled carbon nanotubes as affected by single and binary mixed surfactants. R. Soc. Open Sci. 2019, 6, 190241. [Google Scholar] [CrossRef] [PubMed]
- Di Crescenzo, A.; Di Profio, P.; Siani, G.; Zappacosta, R.; Fontana, A. Optimizing the interactions of surfactants with graphitic surfaces and clathrate hydrates. Langmuir ACS J. Surf. Colloids 2016, 32, 6559–6570. [Google Scholar] [CrossRef] [PubMed]
- Alsharef, J.M.A.; Taha, M.R.; Al-Mansob, R.A.; Govindasamy, P. Evaluation of the Dispersion Stability of Nanocarbons Using Zeta Potential in Distilled Water. Nano Hybrids Compos. 2019, 26, 8–19. [Google Scholar] [CrossRef]
- Rocchini, G. The determination of tafel slopes by an integral method. Corros. Sci. 1994, 36, 113–125. [Google Scholar] [CrossRef]
- Estrada, A.; López, A.; Chavarría, M.; Rojas, Z. Velocidad de Corrosión en el Sistema Acero-Concreto: Enfoque al Método de Curado; Universidad Autónoma de Ciudad Juárez, Cultura Científica y Tecnológica: Chihuahua, México, 2014. [Google Scholar]
- Díaz, A.; Arganis, C.; Torres, A.; Rodriguez, A.; Valle, A.; Robles, E.; Pérez, J.; Rincón, O. Determinación de la Velocidad de Corrosión de Varillas en Probetas de Concreto Armado; Proyecto DURACON: Estación Toluca; XX Congreso Internacional de Ingeniería de Materiales: Ciudad de México, Mexico, 2019. [Google Scholar]
- Pedraza, P.A. Estudio Preliminar del Comportamiento Frente a la Corrosión de Varillas de Acero Embebido en Concreto de Escoria Activada Alcalinamente. Master’s Thesis, Universidad del Valle, Cali, Colombia, 2007. [Google Scholar]


Disclaimer/Publisher’s Note: The statements, opinions and data contained in all publications are solely those of the individual author(s) and contributor(s) and not of MDPI and/or the editor(s). MDPI and/or the editor(s) disclaim responsibility for any injury to people or property resulting from any ideas, methods, instructions or products referred to in the content. |
© 2025 by the authors. Licensee MDPI, Basel, Switzerland. This article is an open access article distributed under the terms and conditions of the Creative Commons Attribution (CC BY) license (https://creativecommons.org/licenses/by/4.0/).
Share and Cite
Gómez-Aristizabal, M.A.; Moreno-Vargas, J.M.; Echeverry-Cardona, L.M.; Restrepo-Parra, E. Study of Corrosion of Portland Cement Embedded Steel with Addition of Multi-Wall Carbon Nanotubes. Materials 2025, 18, 210. https://doi.org/10.3390/ma18010210
Gómez-Aristizabal MA, Moreno-Vargas JM, Echeverry-Cardona LM, Restrepo-Parra E. Study of Corrosion of Portland Cement Embedded Steel with Addition of Multi-Wall Carbon Nanotubes. Materials. 2025; 18(1):210. https://doi.org/10.3390/ma18010210
Chicago/Turabian StyleGómez-Aristizabal, Miguel Angel, Jhoan Mauricio Moreno-Vargas, Laura María Echeverry-Cardona, and Elisabeth Restrepo-Parra. 2025. "Study of Corrosion of Portland Cement Embedded Steel with Addition of Multi-Wall Carbon Nanotubes" Materials 18, no. 1: 210. https://doi.org/10.3390/ma18010210
APA StyleGómez-Aristizabal, M. A., Moreno-Vargas, J. M., Echeverry-Cardona, L. M., & Restrepo-Parra, E. (2025). Study of Corrosion of Portland Cement Embedded Steel with Addition of Multi-Wall Carbon Nanotubes. Materials, 18(1), 210. https://doi.org/10.3390/ma18010210