
Effect of Annealing Time on Corrosion Behaviours of Zr56Cu19Ni11Al9Nb5 in Hank Solution

 ,
,
Abstract
:1. Introduction
2. Materials and Methods
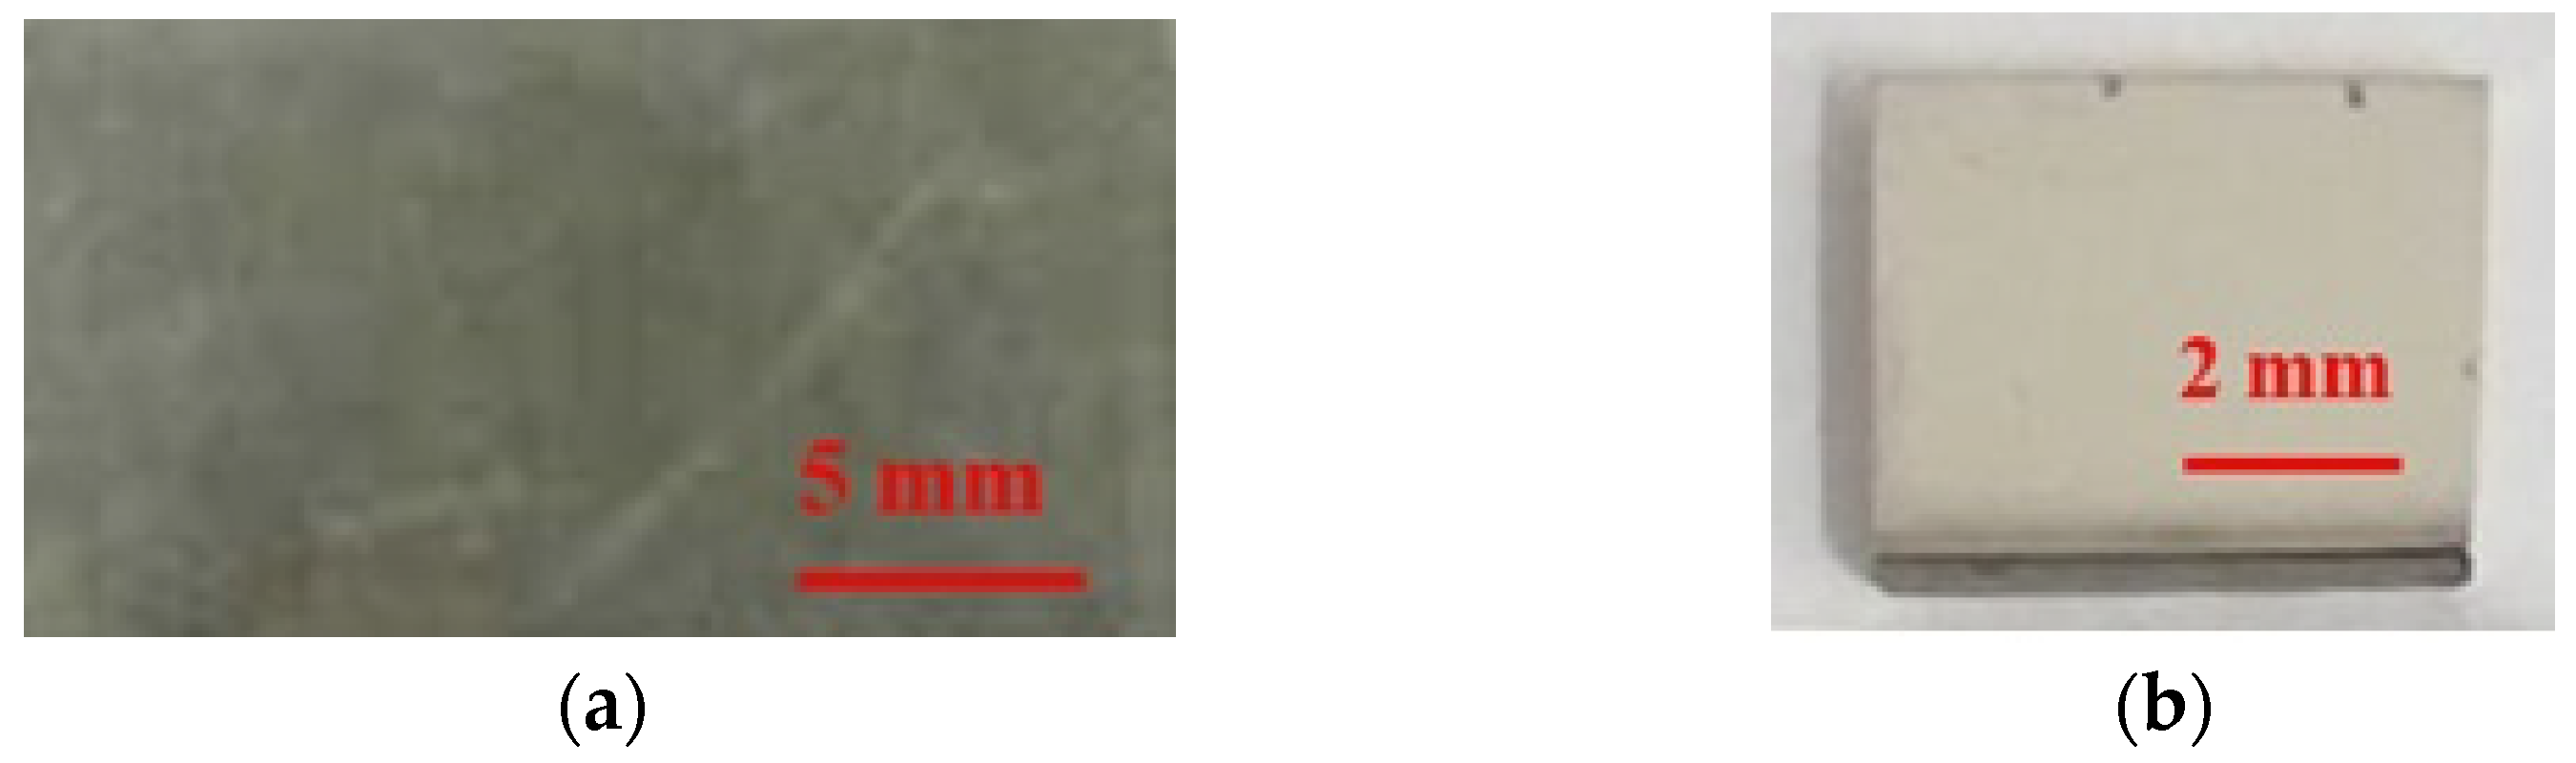
2.1. Material Preparation
2.2. Tests
3. Results and Discussion
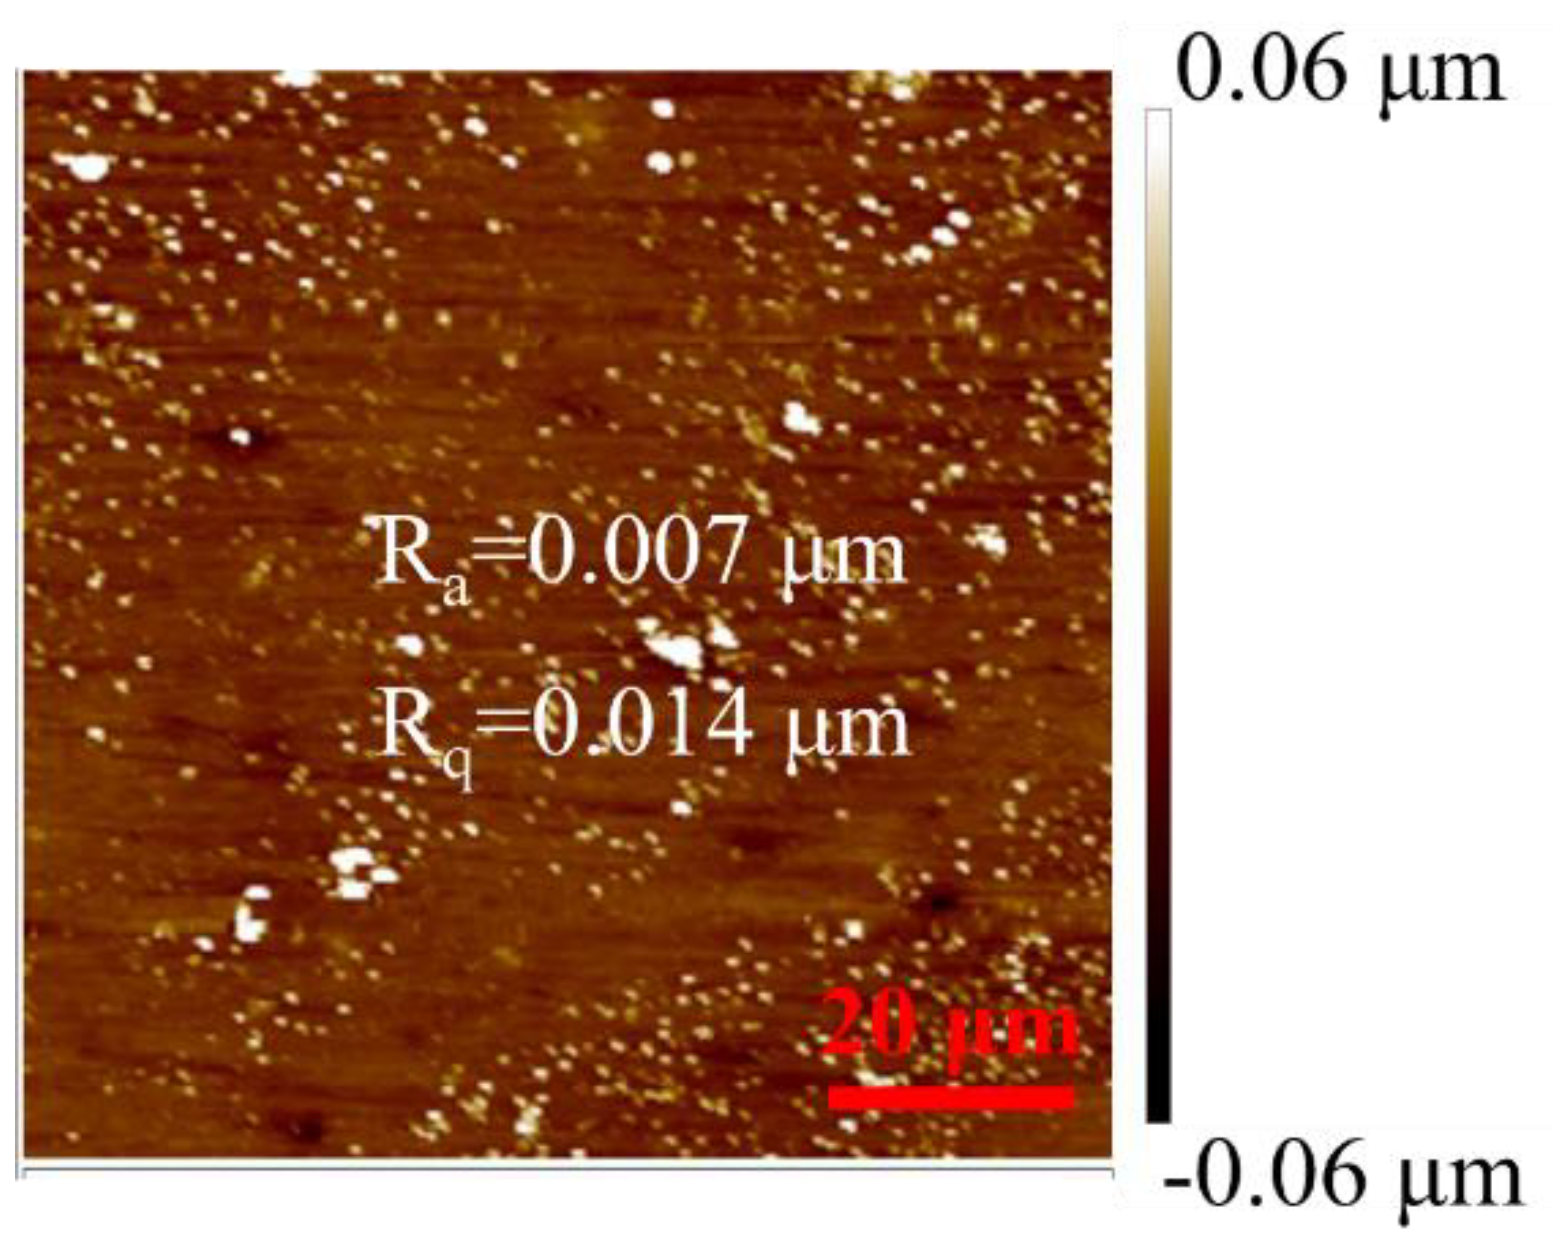
3.1. Microstructure Analysis
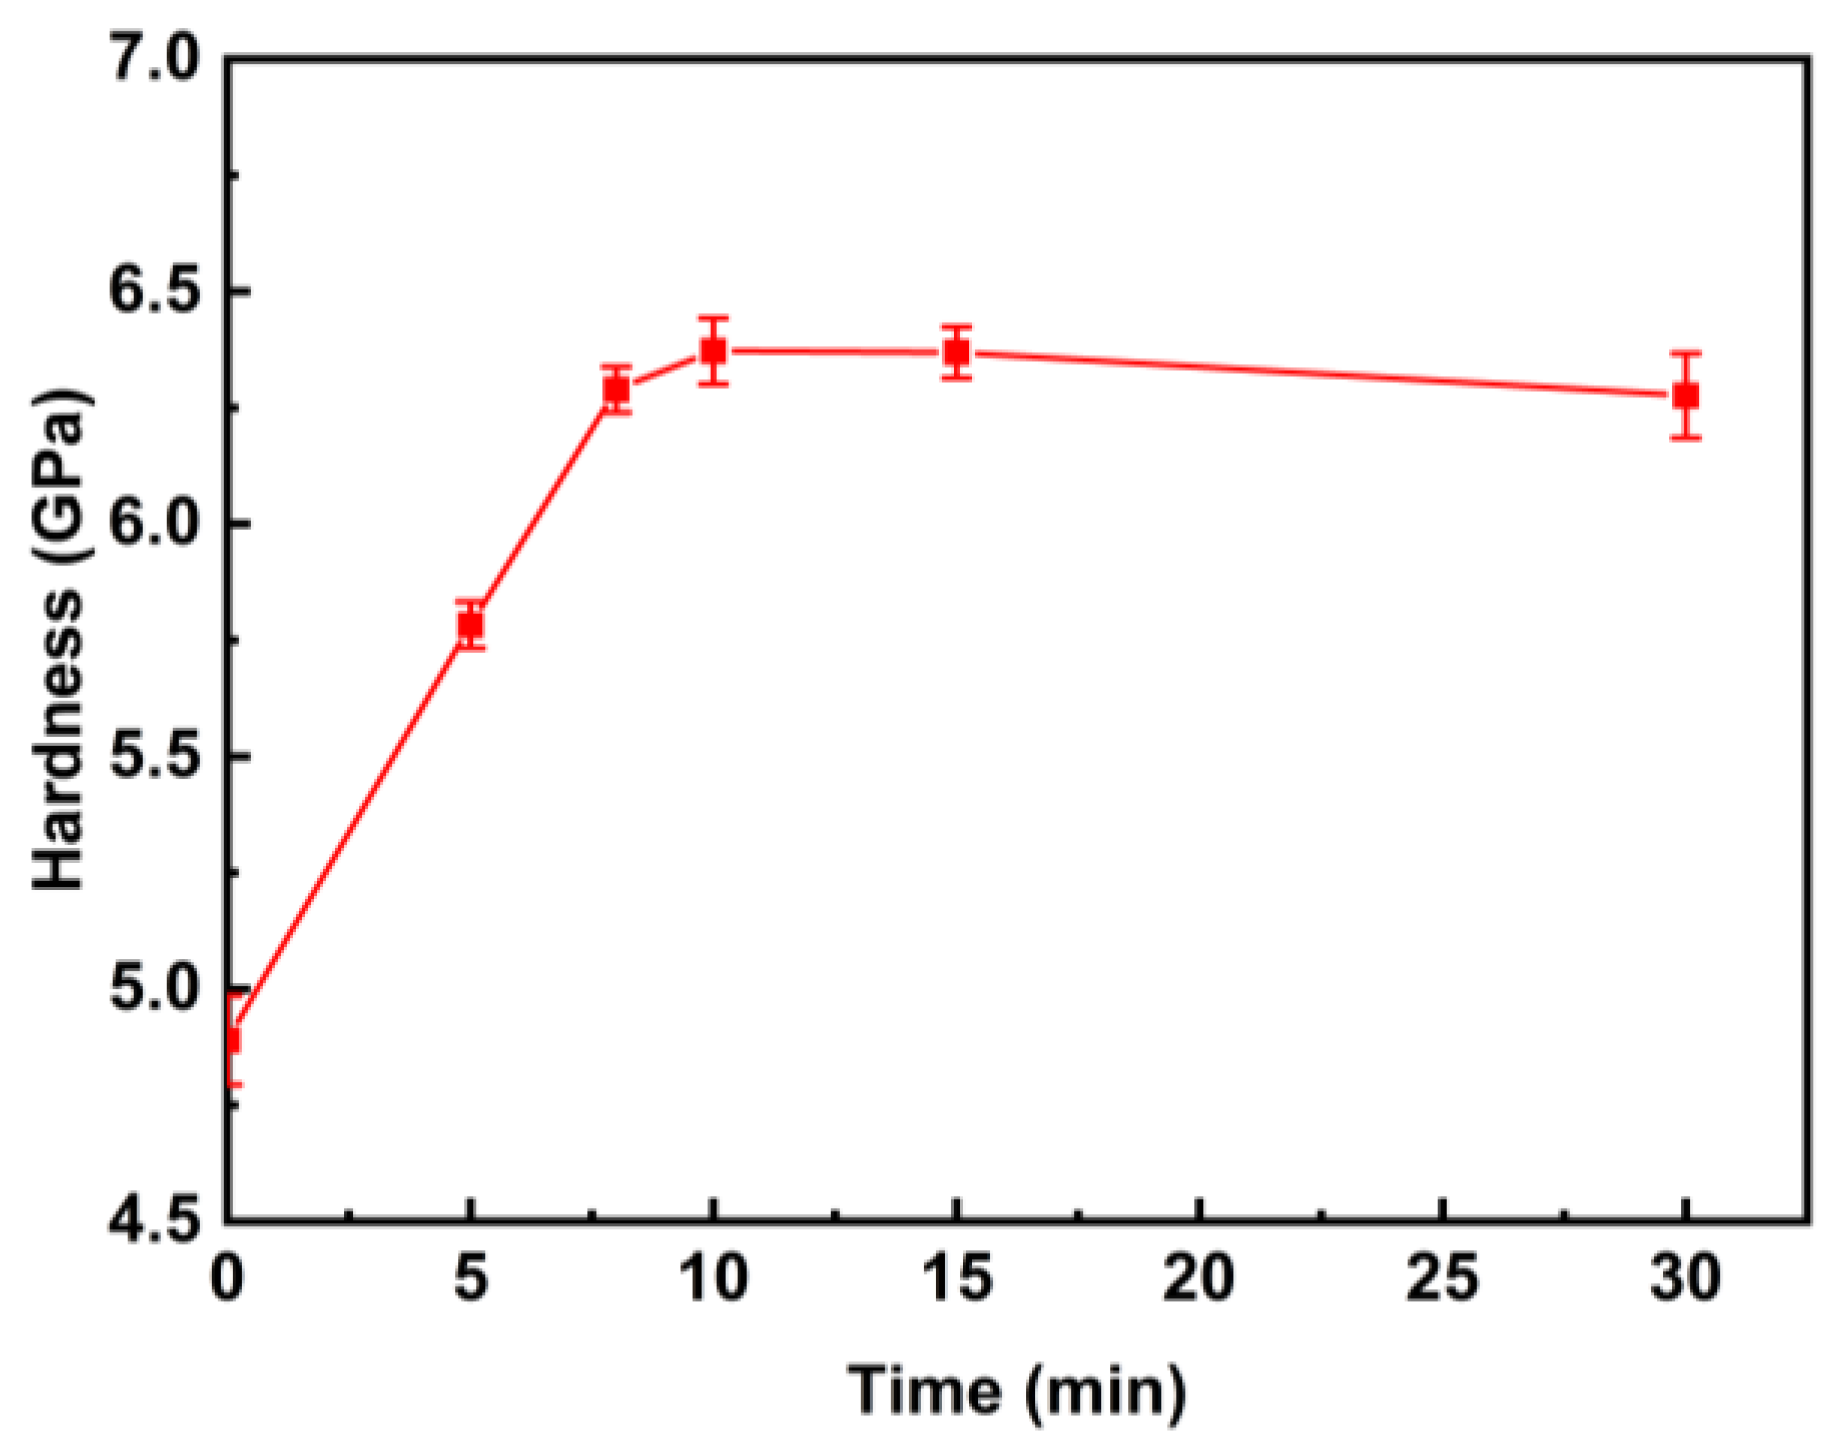
3.2. Microhardness
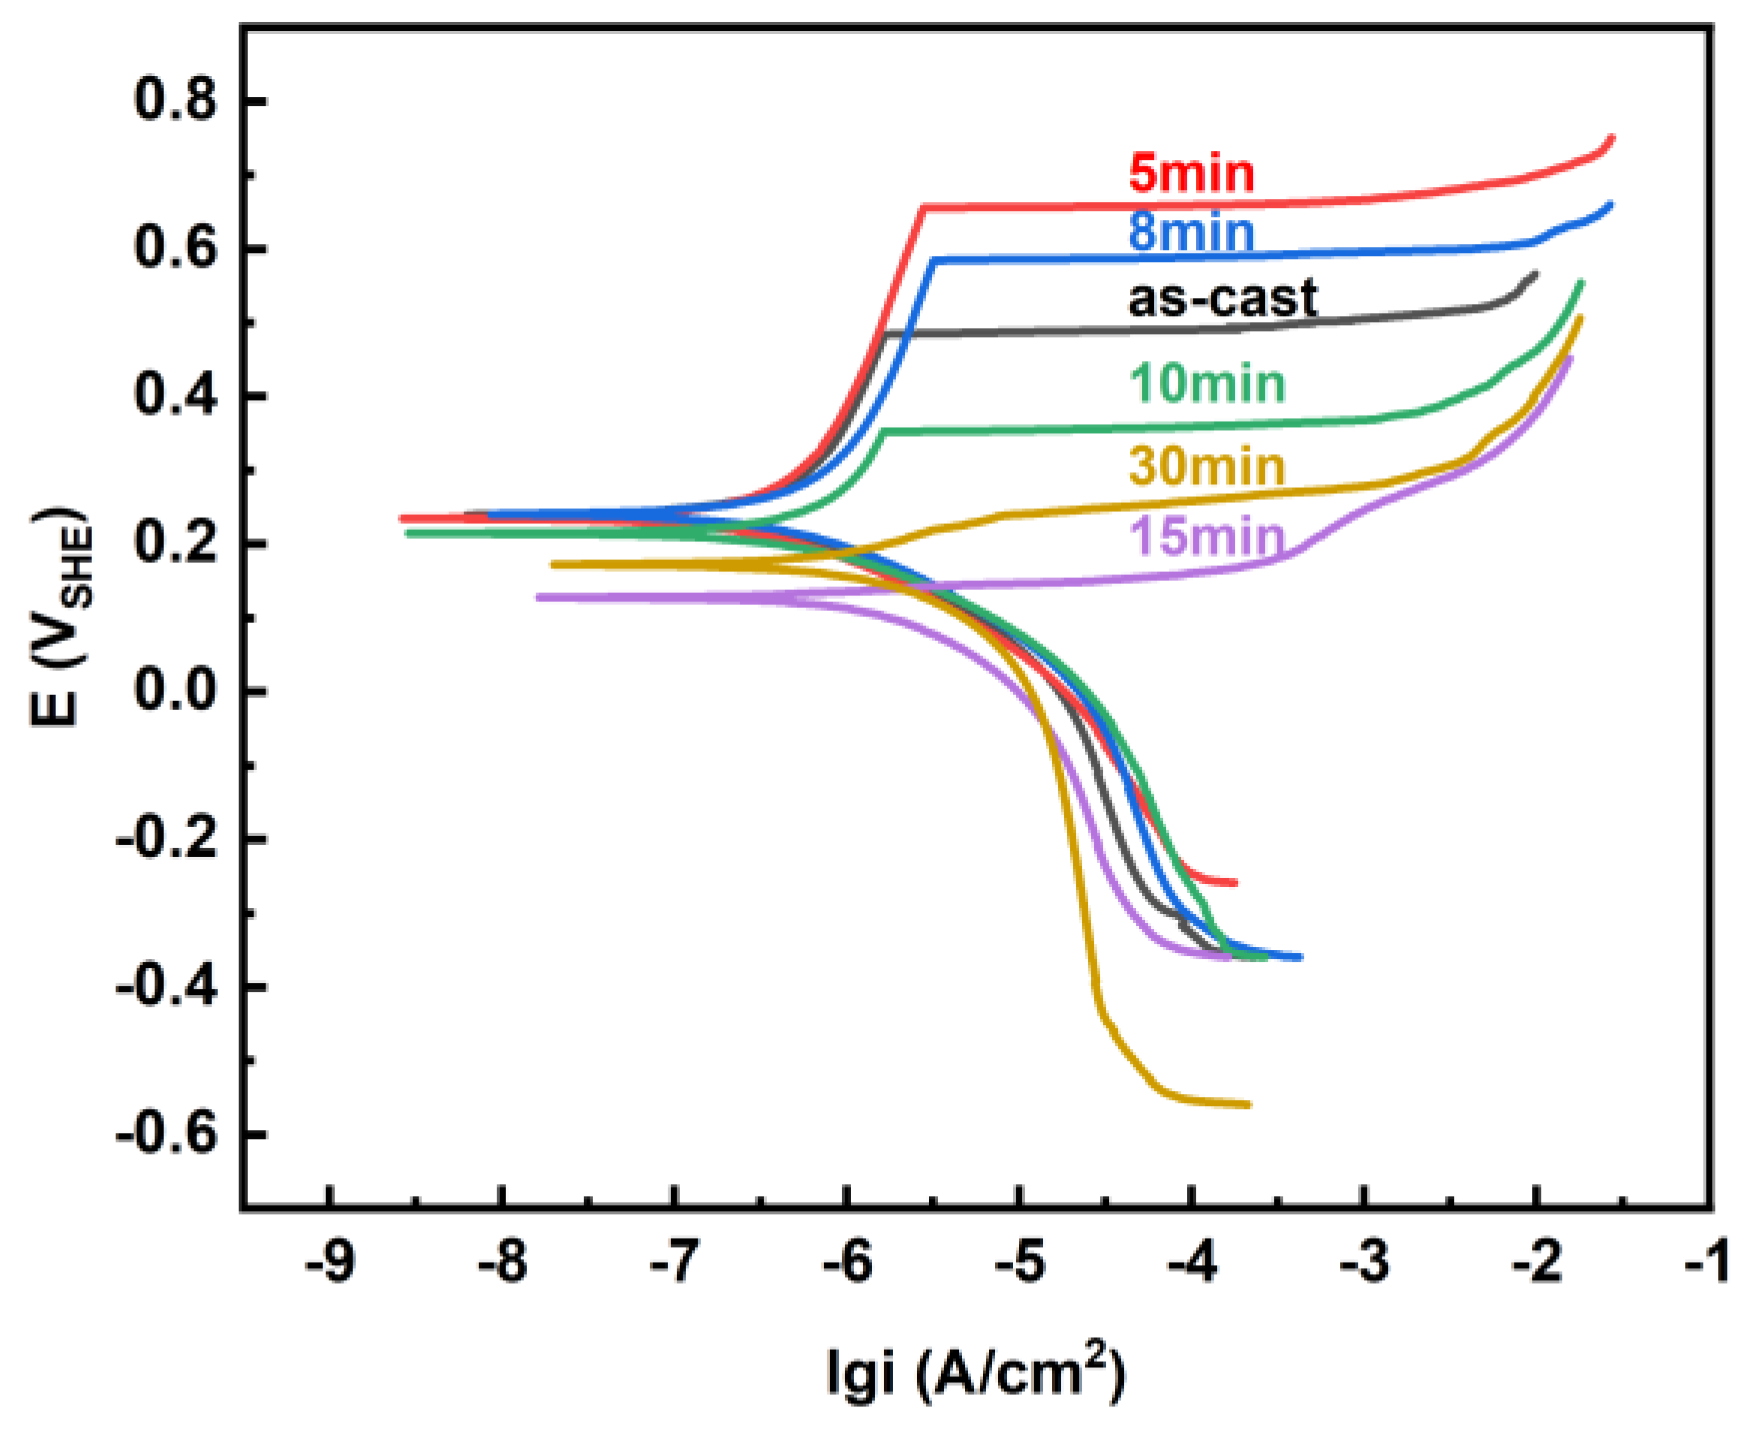
3.3. Corrosion Behaviours
4. Conclusions
Author Contributions
Funding
Institutional Review Board Statement
Informed Consent Statement
Data Availability Statement
Acknowledgments
Conflicts of Interest
Abbreviations
| Nomenclature | |
| ABP | artificial blood plasma solution |
| ASS | artificial saliva solution |
| BMGs | Bulk metallic glasses |
| BMGCs | bulk metallic glass composites |
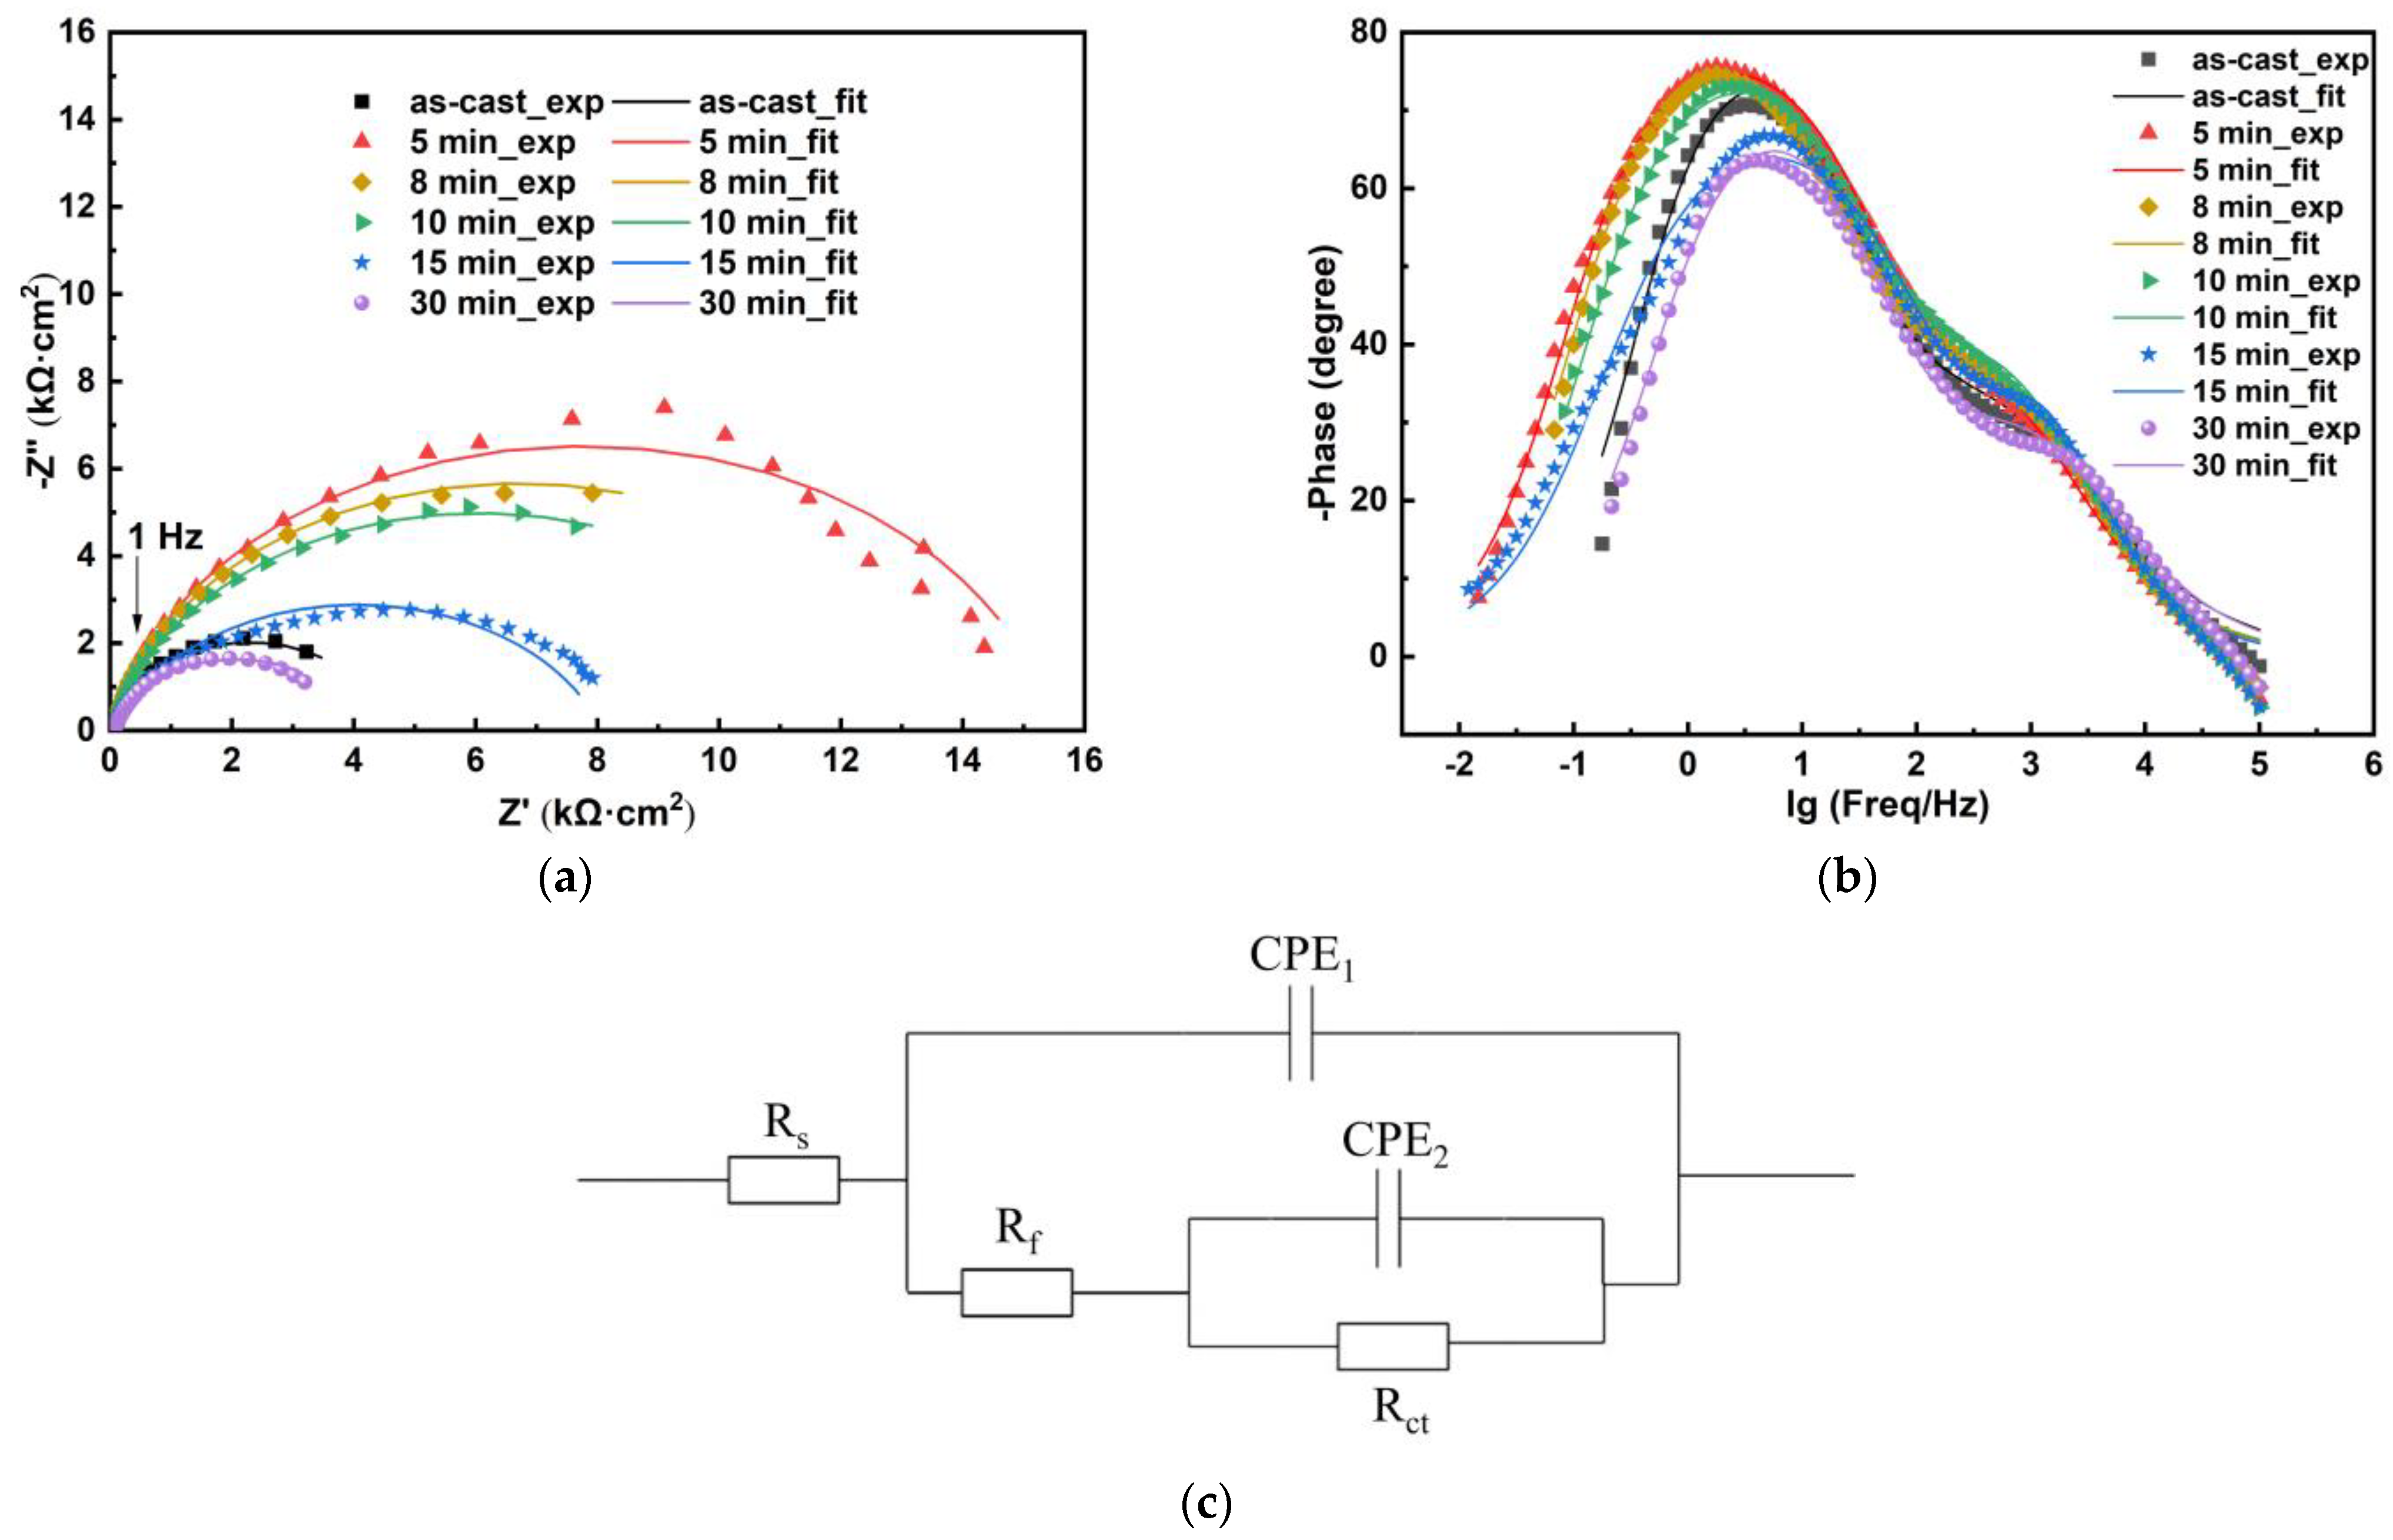
| CPE | constant phase element |
| EC | equivalent circuit |
| EDS | energy dispersive X-ray spectroscopy |
| EIS | electrochemical impedance spectroscopy |
| OCP | open circuit potential |
| PBS | phosphate-buffered saline |
| PP | Potentiodynamic polarisation |
| XPS | X-ray photoelectron spectroscopy |
| SCE | Saturated calomel electrode |
| SEM | scanning electron microscopy |
| XRD | X-ray diffraction |
| Ecorr | corrosion potential |
| Epit | pitting potential |
| Epit − Ecorr | passivation region |
| ipit | pitting current density |
| icorr | corrosion current density |
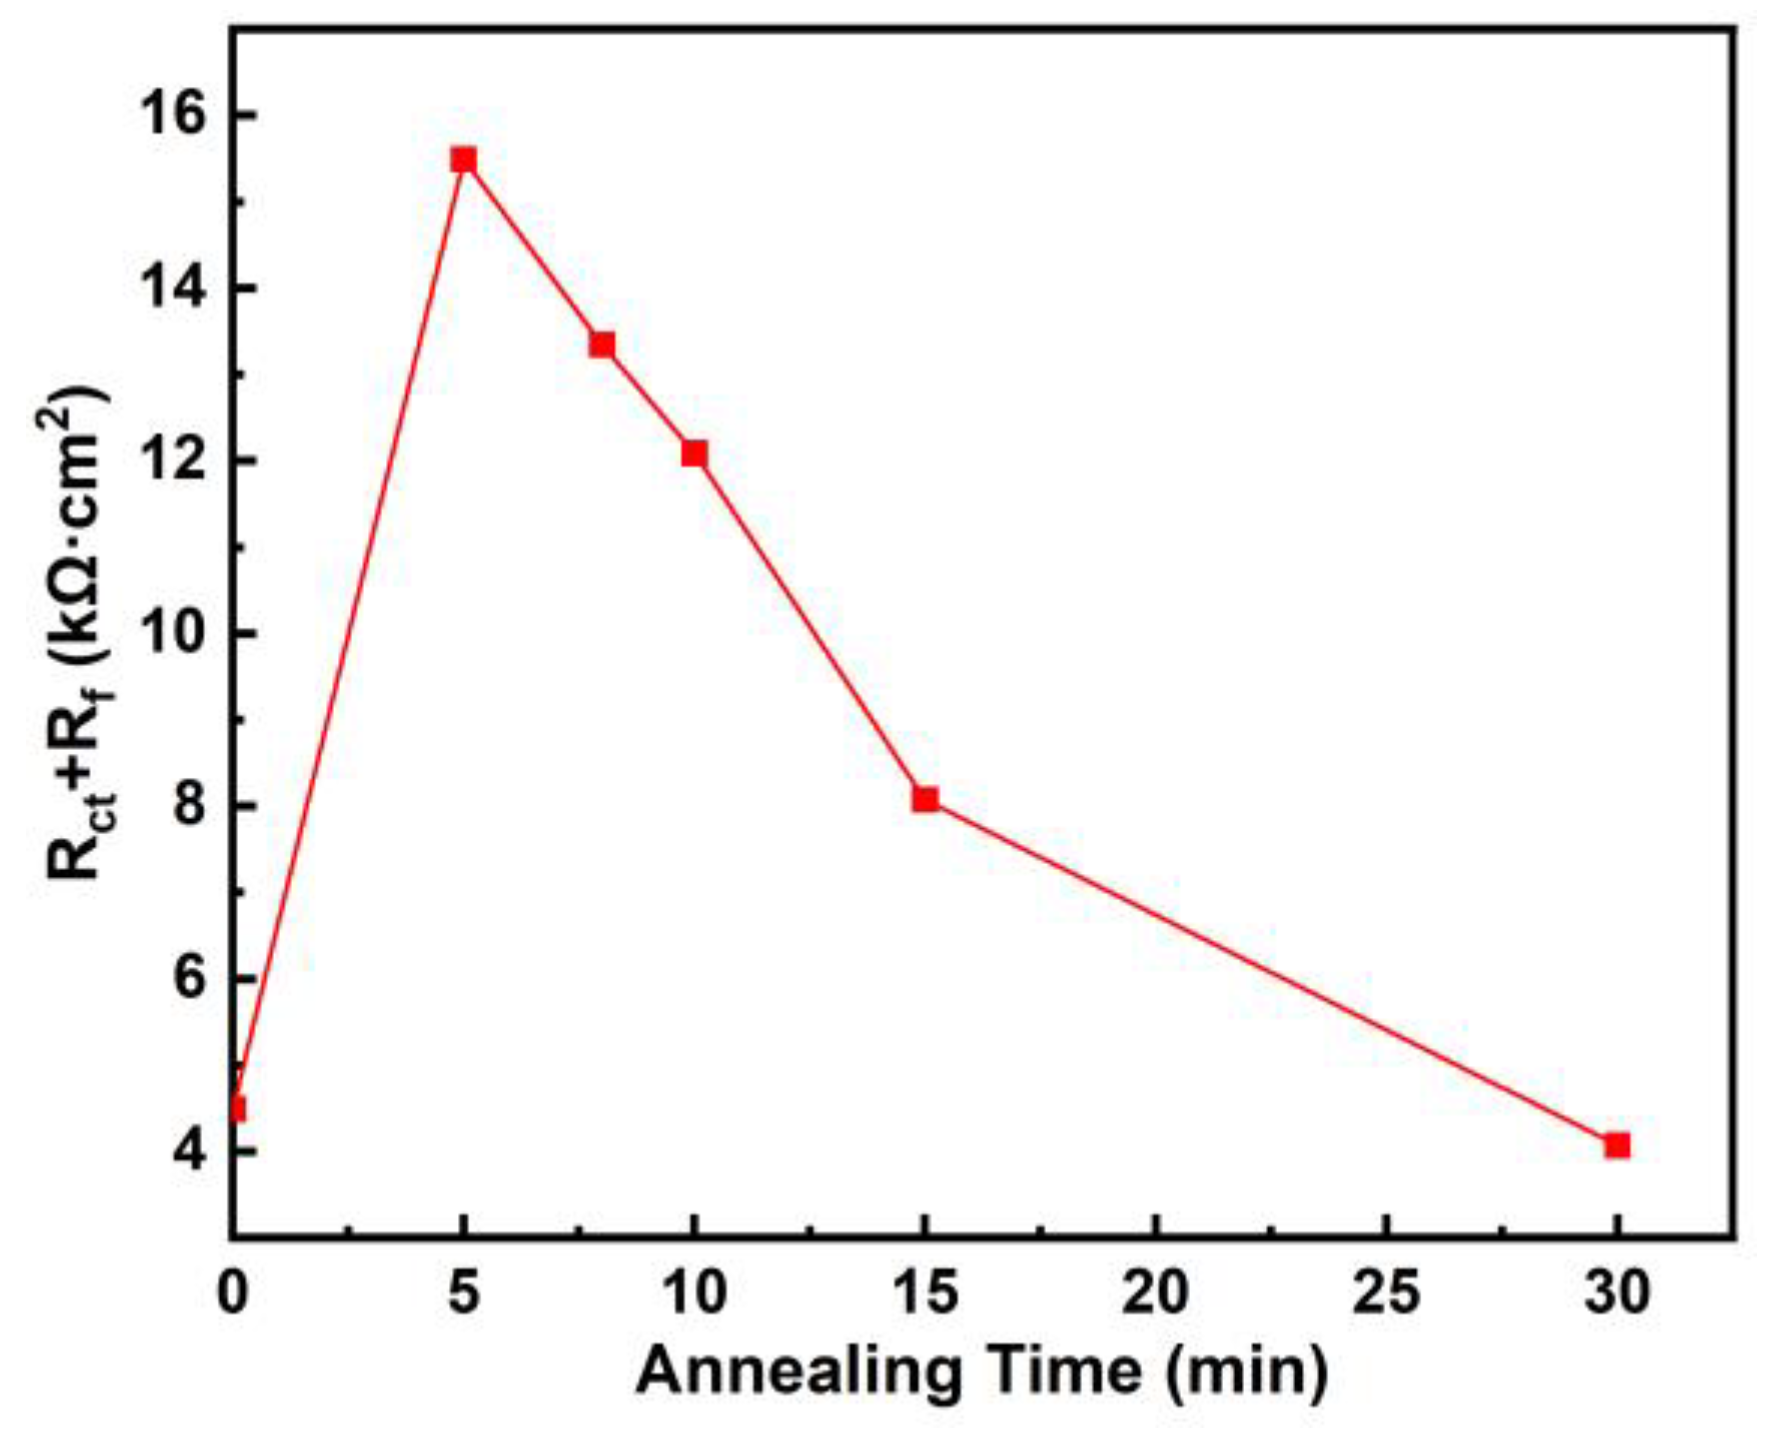
| Rct | charge transfer resistance |
| Rf | film resistance |
| Rs | the solution resistance between the working electrode and the reference electrode |
| ω | angular frequency |
References
- Lin, J.G.; Xu, J.; Wang, W.W.; Li, W. Electrochemical behavior of partially crystallized amorphous Al86Ni9La5 alloys. Mater. Sci. Eng. B 2011, 176, 49–52. [Google Scholar] [CrossRef]
- Saha, S.K.; Maria, K.H.; Hossain, E.; Bhuiyan, M.A.; Saha, D.K.; Choudhury, S. Impact of annealing time on the formation of nanocrystal in amorphous Fe75.5Si3.5Cu1Nb1B9 alloy and their ultra-soft magnetic properties. J. Bangladesh Acad. Sci. 2016, 40, 137–145. [Google Scholar] [CrossRef]
- Yang, Y.J.; Fan, X.D.; Wang, F.L.; Qi, H.N.; Ma, M.Z.; Zhang, X.Y.; Li, G.; Liu, R.P. Effect of Nb content on corrosion behavior of Ti-based bulk metallic glass composites in different solutions. Appl. Surf. Sci. 2019, 471, 108–117. [Google Scholar] [CrossRef]
- Imai, K.; Zhou, X.; Liu, X. Application of Zr and Ti-based bulk metallic glasses for orthopaedic and dental device materials. Metals 2020, 10, 203. [Google Scholar] [CrossRef]
- Sun, K.; Fu, R.; Liu, X.W.; Xu, L.M.; Wang, G.; Chen, S.Y.; Zhai, Q.J.; Pauly, S. Osteogenesis and angiogenesis of a bulk metallic glass for biomedical implants. Bioact. Mater. 2022, 8, 253–266. [Google Scholar] [CrossRef] [PubMed]
- Lin, C.H.; Huang, C.H.; Chuang, J.F.; Lee, H.C.; Liu, M.C.; Du, X.H.; Huang, J.C.; Jang, J.S.C.; Chen, C.H. Simulated body-fluid tests and electrochemical investigations on biocompatibility of metalic glasses. Mater. Sci. Eng. C 2012, 32, 2578–2582. [Google Scholar] [CrossRef]
- Lu, X.Y.; Huang, L.; Pang, S.J.; Zhang, T. Formation and biocorrosion behavior of Zr-Al-Co-Nb bulk metallic glasses. Chin. Sci. Bull. 2012, 57, 1723–1727. [Google Scholar] [CrossRef]
- Shi, H.; Zhao, W.; Wei, X.; Ding, Y.; Shen, X.; Liu, W. Effect of Ti addition on mechanical properties and corrosion resistance of Ni-free Zr-based bulk metallic glasses for potential biomedical applications. J. Alloys Compd. 2020, 815, 152636. [Google Scholar] [CrossRef]
- Hua, N.B.; Huang, L.; Chen, W.Z.; He, W.; Zhang, T. Biocompatibility Ni-free Zr-based bulk metallic glasses with high-Zr-content: Compositional optimization for potential biomedical applications. Mater. Sci. Eng. C 2014, 44, 400–410. [Google Scholar] [CrossRef]
- Sun, Y.; Huang, Y.J.; Fan, H.B.; Wang, Y.M.; Ning, Z.L.; Liu, F.Y.; Feng, D.F.; Jin, X.X.; Shen, J.; Sun, J.F.; et al. In vitro and in vivo biocompability of an Ag-bearing Zr-based bulk metallic glass for potential medical use. J. Non-Cryst. Solids 2015, 419, 82–91. [Google Scholar] [CrossRef]
- Hua, N.; Liao, Z.; Chen, W.; Huang, Y.; Zhang, T. Effects of noble elements on the glass-forming ability, mechanical property, electrochemical behavior and tribocorrosion resistance of Ni- and Cu-free Zr-Al-Co bulk metallic glass. J. Alloys Compd. 2017, 725, 403–414. [Google Scholar] [CrossRef]
- Han, K.; Qiang, J.; Wang, Y.; Zhao, B.; Haussler, P. Zr55.8Al19.4(Co1−xCux)24.8 (x = 0 − 0.8 at.%) bulk metallic glasses for surgical devices applications. J. Iron Steel Res. Int. 2018, 25, 644–649. [Google Scholar] [CrossRef]
- Han, K.; Wang, Y.; Qiang, J.; Jiang, H.; Gu, L. Low-cost Zr-based bulk metallic glasses for biomedical devices applications. J. Non-Cryst. Solids 2019, 520, 119442. [Google Scholar] [CrossRef]
- Han, K.; Jiang, H.; Wang, Y.; Qiang, J.; Yu, C. Antimicrobial Zr-based bulk metallic glasses for surgical devices applications. J. Non-Cryst. Solids 2021, 564, 120827. [Google Scholar] [CrossRef]
- Jabed, A.; Rahman, Z.U.; Khan, M.M.; Haider, W.; Shabib, I. Combinatorial development and in-vitro characterization of the quaternary Zr-Ti-X-Y (X-Y = Cu-Ag/Co-Ni) metallic glass for prospective bio-implants. Adv. Eng. Mater. 2019, 21, 1900726. [Google Scholar] [CrossRef]
- Jabed, A.; Khan, M.M.; Camiller, J.; Greenlee-Wacker, M.; Haider, W.; Shabib, I. Property optimization of Zr-Ti-X (X = Ag, Al) metallic glass via combinatorial development aimed at prospective biodemidcal application. Surf. Coat. Technol. 2019, 372, 278–287. [Google Scholar] [CrossRef]
- Khan, M.M.; Shabib, I.; Haider, W. A combinatorially developed Zr-Ti-Fe-Al metallic glass with outstanding corrosion resistance for implantable medical devices. Scr. Mater. 2019, 162, 223–229. [Google Scholar] [CrossRef]
- Zhao, G.H.; Aune, R.E.; Mao, H.H.; Espallargas, N. Degradation of Zr-based bulk metallic glasses used in load-bearing implants: A tribocorrosion appraisal. J. Mech. Behav. Biomed. Mater. 2016, 60, 56–67. [Google Scholar] [CrossRef]
- Jain, A.; Prabhu, Y.; Gunderov, D.; Narayan, R.L.; Saini, P.; Vincent, S.; Sundha, P.; Bagde, A.D.; Bhatt, J. Structural characterization, biocorrosion and in-vitro investigation on Zr62Cu22Al10Fe5Dy1 metallic glass for bio-implant applications. J. Non-Cryst. Solids 2022, 598, 121928. [Google Scholar] [CrossRef]
- Prabhu, Y.; Jain, A.; Vincent, S.; Ryu, W.H.; Park, E.S.; Kumar, R.; Bagde, A.D.; Bhatt, J. Compositional design and in vitro investigation on novel Zr-Co-Cu-Ti metallic glass for biomedical applications. Intermetallics 2022, 150, 107692. [Google Scholar] [CrossRef]
- Wang, R.R.; Wang, Y.Y.; Yang, J.; Sun, J.M.; Xiong, L.Y. Influence of heat treatment on the mechanical properties, corrosion behavior, and biocompatibility of Zr56Al16Co28 bulk metallic glass. J. Non-Cryst. Solids 2015, 411, 45–52. [Google Scholar] [CrossRef]
- Tang, J.; Yu, L.; Qiao, J.; Wang, Y.; Wang, H.; Duan, M.; Chamas, M. Effect of atomic mobility on the electrochemical properties of a Zr58Nb3Cu16Ni13Al10 bulk metallic glass. Electrochim. Acta 2018, 267, 222–233. [Google Scholar] [CrossRef]
- Tang, J.; Wang, Y.; Zhu, Q.; Chamas, M.; Wang, H.; Qiao, J.; Zhu, Y.; Normand, B. Passivation behavior of a Zr60Cu20Ni8Al7Hf3Ti2 bulk metallic glass in sulfuric acid solutions. Int. J. Electrochem. Sci. 2018, 13, 6913–6929. [Google Scholar] [CrossRef]
- Ge, W.; Li, B.; Axinte, E.; Zhang, Z.; Shang, C.; Wang, Y. Crystallization and corrosion resistance in different aqueous solutions of Zr50.7Ni28Cu9Al12.3 amorphous alloy and its crystallization counterparts. JOM 2017, 69, 776–783. [Google Scholar] [CrossRef]
- Aditya, A.; Wu, H.F.; Arora, H.; Mukherjee, S. Amorphous metallic alloys: Pathways for enhanced wear and corrosion resistance. JOM 2017, 69, 2150–2155. [Google Scholar] [CrossRef]
- Hua, N.; Liao, Z.; Wang, Q.; Zhang, L.; Ye, Y.; Brechtl, J.; Liaw, P.K. Effects of crystallization on mechanical behavior and corrosion performance of a ductile Zr68Al8Ni8Cu16 bulk metallic glass. J. Non-Cryst. Solids 2020, 529, 119782. [Google Scholar] [CrossRef]
- Zhao, X.; Sun, J.; Yu, M.; Zhang, M.; Liu, F.; Zhang, Y. Effects of heat treatment on the thermal, mechanical and corrosion properties of deformed Zr-based bulk metallic glasses. Mater. Chem. Phys. 2020, 256, 123705. [Google Scholar] [CrossRef]
- Han, X.; Kaban, I.; Orava, J.; Das, S.M.; Shtefan, V.; Zimmermann, M.V.; Song, K.; Eckert, J.; Nielsch, K.; Herbig, M. Tailoring microstructure and properties of CuZrAl(Nb) metallic-glass-crystal composites and nanocrystalline alloys obtained by flash-annealing. J. Mater. Sci. Technol. 2024, 193, 253–266. [Google Scholar] [CrossRef]
- Zhang, Z.; Zhong, X.; Teng, X.; Huang, Y.; Han, H.; Chen, T.; Zhang, Q.; Yang, X.; Gong, Y. Effect of annealing temperature on electrochemical properties of Zr56Cu19Ni11Al9Nb5 in PBS solution. Materials 2023, 16, 3389. [Google Scholar] [CrossRef]
- Gonzalez, S.; Pellicer, E.; Surinach, S.; Baro, M.D.; Sort, J. Mechanical and corrosion behaviour of as-cast and annealed Zr60Cu20Al10Fe5Ti5 bulk metallic glass. Intermetallics 2012, 28, 149–155. [Google Scholar] [CrossRef]
- Zhou, M.; Hagos, K.; Huang, H.; Yang, M.; Ma, L. Improved mechanical properties and pitting corrosion resistance of Zr65Cu17.5Fe10Al7.5 bulk metallic glass by isothermal annealing. J. Non-Cryst. Solids 2016, 452, 50–56. [Google Scholar] [CrossRef]
- Jabed, A.; Kumar, G. Effect of cryogenic cycling and above-Tg annealing on the corrosion behavior of Zr-Cu-Ti-Be metallic glass. J. Non-Cryst. Solids 2023, 608, 122260. [Google Scholar] [CrossRef]
- Zhang, L.; Liu, J.; Huang, Y.J.; Ning, Z.; Fan, H.; Sun, J.F. Enhanced corrosion resistance of a ZrCuNiAl bulk metallic glass in simulated groundwater by minor crystallization. Mater. Charact. 2022, 194, 112317. [Google Scholar] [CrossRef]
- Shi, H.; Tang, C.; Zhao, X.; Ding, Y.; Ma, L.; Shen, X. Effect of isothermal annealing on mechanical performance and corrosion resistance of Ni-free Zr59Ti6Cu17.5Fe10Al7.5 bulk metallic glass. J. Non-Cryst. Solids 2020, 537, 120013. [Google Scholar] [CrossRef]
- Qiu, Z.; Li, Z.; Fu, H.; Zhang, H.; Zhu, Z.; Wang, A.; Li, H.; Zhang, L.; Zhang, H. Corrosion mechanisms of Zr-based bulk metallic glass in NaF and NaCl solutions. J. Mater. Sci. Technol. 2020, 46, 33–43. [Google Scholar] [CrossRef]
- Zhang, L.M.; Zhang, S.D.; Ma, A.L.; Hu, H.X.; Zheng, Y.G.; Yang, B.J.; Wang, J.Q. Thermally induced structural evolution on the corrosion behavior of Al-Ni-Y amorphous alloys. Corros. Sci. 2018, 144, 172–183. [Google Scholar] [CrossRef]
- Cao, Q.P.; Peng, S.; Zhao, X.N.; Wang, X.D.; Zhang, D.X.; Jiang, J.Z. Effect of Nb substituion for Cu on glass formation and corrosion behavior of Zr-Cu-Ag-Al-Be bulk metallic glass. J. Alloys Compd. 2016, 683, 22–31. [Google Scholar] [CrossRef]
- Larsson, L.; Marattukalam, J.J.; Paschalidou, E.M.; Hjorvarsson, B.; Ferraz, N.; Persson, C. Biocompatibility of a Zr-based metallic glass enabled by additive manufacturing. ACS Appl. Bio Mater. 2022, 5, 5741–5753. [Google Scholar] [CrossRef]
- Li, T.H.; Wong, P.C.; Chang, S.F.; Tsai, P.H.; Jang, J.S.C.; Huang, J.C. Biocompatibility study on Ni-free Ti-based and Zr-based bulk metallic glasses. Mater. Sci. Eng. C 2017, 75, 1–6. [Google Scholar] [CrossRef]
- Zhang, C.; Li, X.M.; Liu, S.Q.; Liu, H.; Yu, L.J.; Liu, L. 3D printing of Zr-based bulk metallic glasses and components for potential biomedical applications. J. Alloys Compd. 2019, 790, 963–973. [Google Scholar] [CrossRef]
- Houghton, O.S.; Schmitt, L.Y.; Klotz, U.E.; Costa, M.B.; Greer, A.L. Pd- and Zr-based bulk metallic glasses for jewellery applications: Scracth, wear and tarnish behaviour. Mater. Sci. Eng. A 2025, 924, 147791. [Google Scholar] [CrossRef]


| Equipment | Model | Parameter | Accuracy |
|---|---|---|---|
| X-ray diffractor | D8 Advance | angle | 10−2° |
| Electrochemical workstation | CHI 660E | potential | 10−4 V |
| Electrochemical workstation | CHI 660E | current | 10−8 A |
| Microhardness tester | MICRO-586 | microhardness | 10−1 MPa |
| Annealing Time (min) | Ecorr (VSHE) | icorr (A·cm−2) | Epit (VSHE) | ipit (A/cm2) | Epit − Ecorr (VSHE) |
|---|---|---|---|---|---|
| 0 | 0.239 | 3.14 × 10⁻⁷ | 0.484 | 1.67 × 10⁻⁶ | 0.245 |
| 5 | 0.234 | 2.20 × 10⁻⁷ | 0.656 | 2.81 × 10⁻⁶ | 0.421 |
| 8 | 0.240 | 4.40 × 10⁻⁷ | 0.584 | 3.25 × 10⁻⁷ | 0.344 |
| 10 | 0.215 | 5.75 × 10⁻⁷ | 0.352 | 1.64 × 10⁻⁶ | 0.138 |
| 15 | 0.128 | 1.05 × 10⁻⁶ | 0.145 | 5.11 × 10⁻⁶ | 0.017 |
| 30 | 0.172 | 1.32 × 10⁻⁶ | 0.240 | 8.09 × 10⁻⁶ | 0.068 |
| Annealing Time (min) | EIS Fitting Results | |||||||
|---|---|---|---|---|---|---|---|---|
| Rs (Ω·cm2) | Y01 (Ω−1·sn·/cm2) | n1 | Rf (Ω·cm2) | Y02 (Ω−1·sn·/cm2) | n2 | Rct (Ω·cm2) | Rct + Rf (Ω·cm2) | |
| 0 | 11 | 1.05 × 10⁻⁴ | 0.94 | 4444 | 2.68 × 10⁻⁴ | 0.64 | 46 | 4490 |
| 5 | 11 | 1.19 × 10⁻⁴ | 0.89 | 15,460 | 1.92 × 10⁻⁴ | 0.71 | 29 | 15,489 |
| 8 | 11 | 1.19 × 10⁻⁴ | 0.90 | 13,300 | 1.55 × 10⁻⁴ | 0.72 | 44 | 13,344 |
| 10 | 12 | 1.02 × 10⁻⁴ | 0.88 | 12,050 | 1.21 × 10⁻⁴ | 0.75 | 37 | 12,087 |
| 15 | 16 | 1.15 × 10⁻⁴ | 0.79 | 8053 | 2.60 × 10⁻⁵ | 0.89 | 23 | 8076 |
| 30 | 17 | 9.17 × 10⁻⁵ | 0.69 | 47 | 9.24 × 10⁻⁵ | 0.87 | 4023 | 4070 |
Disclaimer/Publisher’s Note: The statements, opinions and data contained in all publications are solely those of the individual author(s) and contributor(s) and not of MDPI and/or the editor(s). MDPI and/or the editor(s) disclaim responsibility for any injury to people or property resulting from any ideas, methods, instructions or products referred to in the content. |
© 2025 by the authors. Licensee MDPI, Basel, Switzerland. This article is an open access article distributed under the terms and conditions of the Creative Commons Attribution (CC BY) license (https://creativecommons.org/licenses/by/4.0/).
Share and Cite
Zhang, Z.; Zhou, J.; Wang, K.; Gao, J.; Zhang, Q.; Jiang, X.; Yu, C.; Zhou, Z.; Liu, H. Effect of Annealing Time on Corrosion Behaviours of Zr56Cu19Ni11Al9Nb5 in Hank Solution. Materials 2025, 18, 1132. https://doi.org/10.3390/ma18051132
Zhang Z, Zhou J, Wang K, Gao J, Zhang Q, Jiang X, Yu C, Zhou Z, Liu H. Effect of Annealing Time on Corrosion Behaviours of Zr56Cu19Ni11Al9Nb5 in Hank Solution. Materials. 2025; 18(5):1132. https://doi.org/10.3390/ma18051132
Chicago/Turabian StyleZhang, Zhiying, Jianling Zhou, Kun Wang, Jinguo Gao, Qinyi Zhang, Xinlei Jiang, Chenhao Yu, Zikai Zhou, and Haonan Liu. 2025. "Effect of Annealing Time on Corrosion Behaviours of Zr56Cu19Ni11Al9Nb5 in Hank Solution" Materials 18, no. 5: 1132. https://doi.org/10.3390/ma18051132
APA StyleZhang, Z., Zhou, J., Wang, K., Gao, J., Zhang, Q., Jiang, X., Yu, C., Zhou, Z., & Liu, H. (2025). Effect of Annealing Time on Corrosion Behaviours of Zr56Cu19Ni11Al9Nb5 in Hank Solution. Materials, 18(5), 1132. https://doi.org/10.3390/ma18051132