
Experimental Study on the Compression Characteristics of Sand–Silt–Clay Mixtures

Abstract
1. Introduction
2. Overview of the Experiments
3. Experimental Plan
4. Test Results and Discussion
4.1. The Impact of Fines Content on the Compressibility Characteristics of Sand–Silt–Clay Mixtures
4.2. The Impact of Clay–Silt Ratio on the Compressibility Characteristics of Sand–Silt–Clay Mixtures
4.3. Mechanism Analysis of the Compressibility Characteristics of Sand–Silt–Clay Mixtures
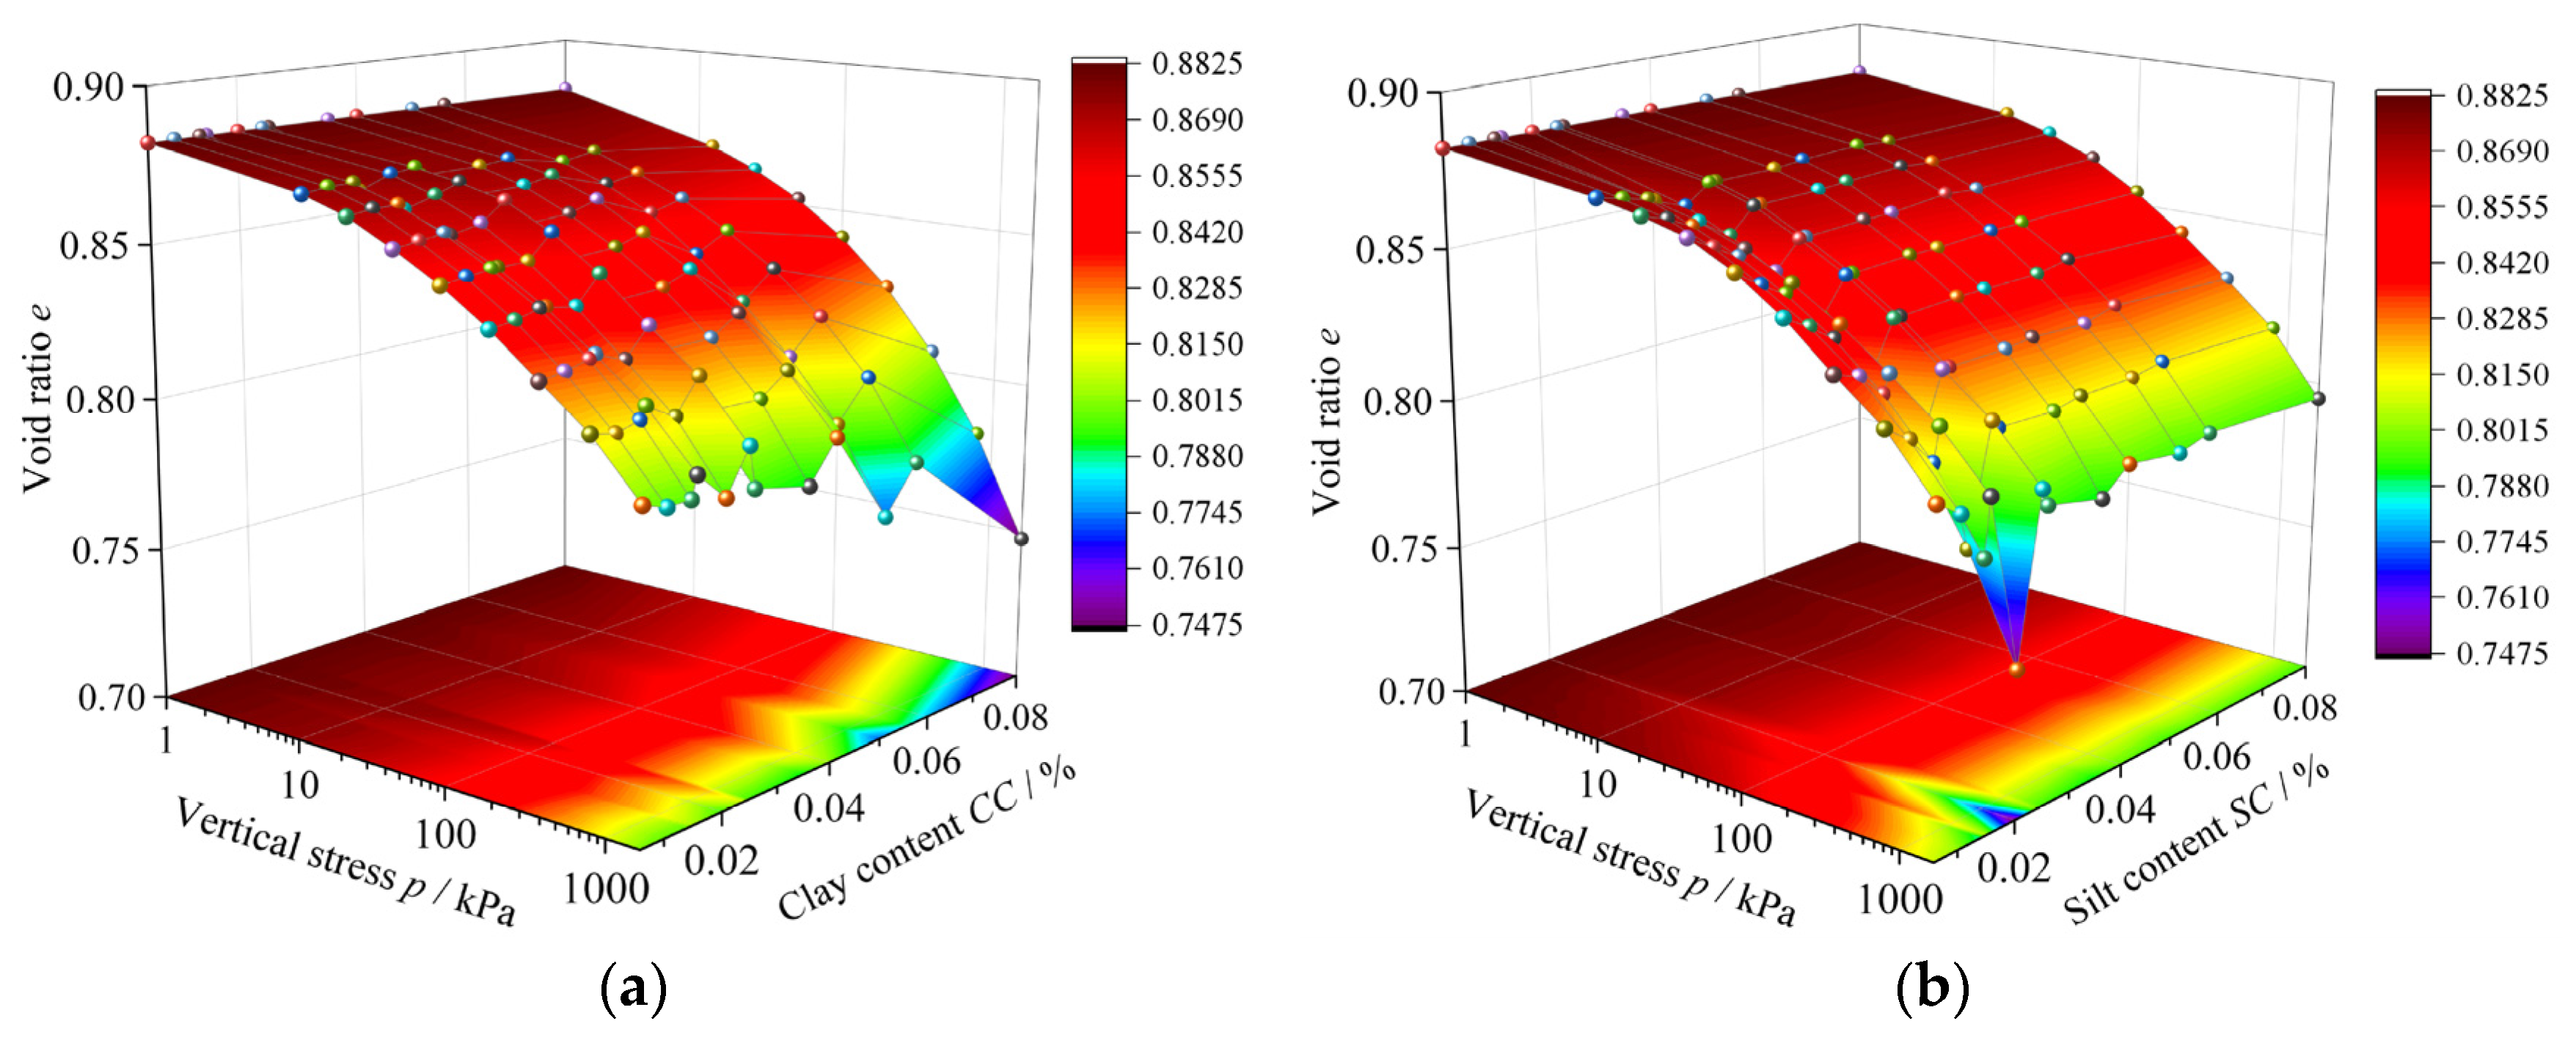
5. Establishment and Validation of the Compression Model for Sand–Silt–Clay Mixtures
5.1. Establishment of the Compression Model for Sand–Silt–Clay Mixtures
- (1)
- When FC = 3%, 5%, based on Equations (7), (8), and (10), the proposed and established model (11) is as follows:
- (2)
- When FC = 7%, 10%, based on Equations (7), (9), and (10), the proposed and established model (12) is as follows:
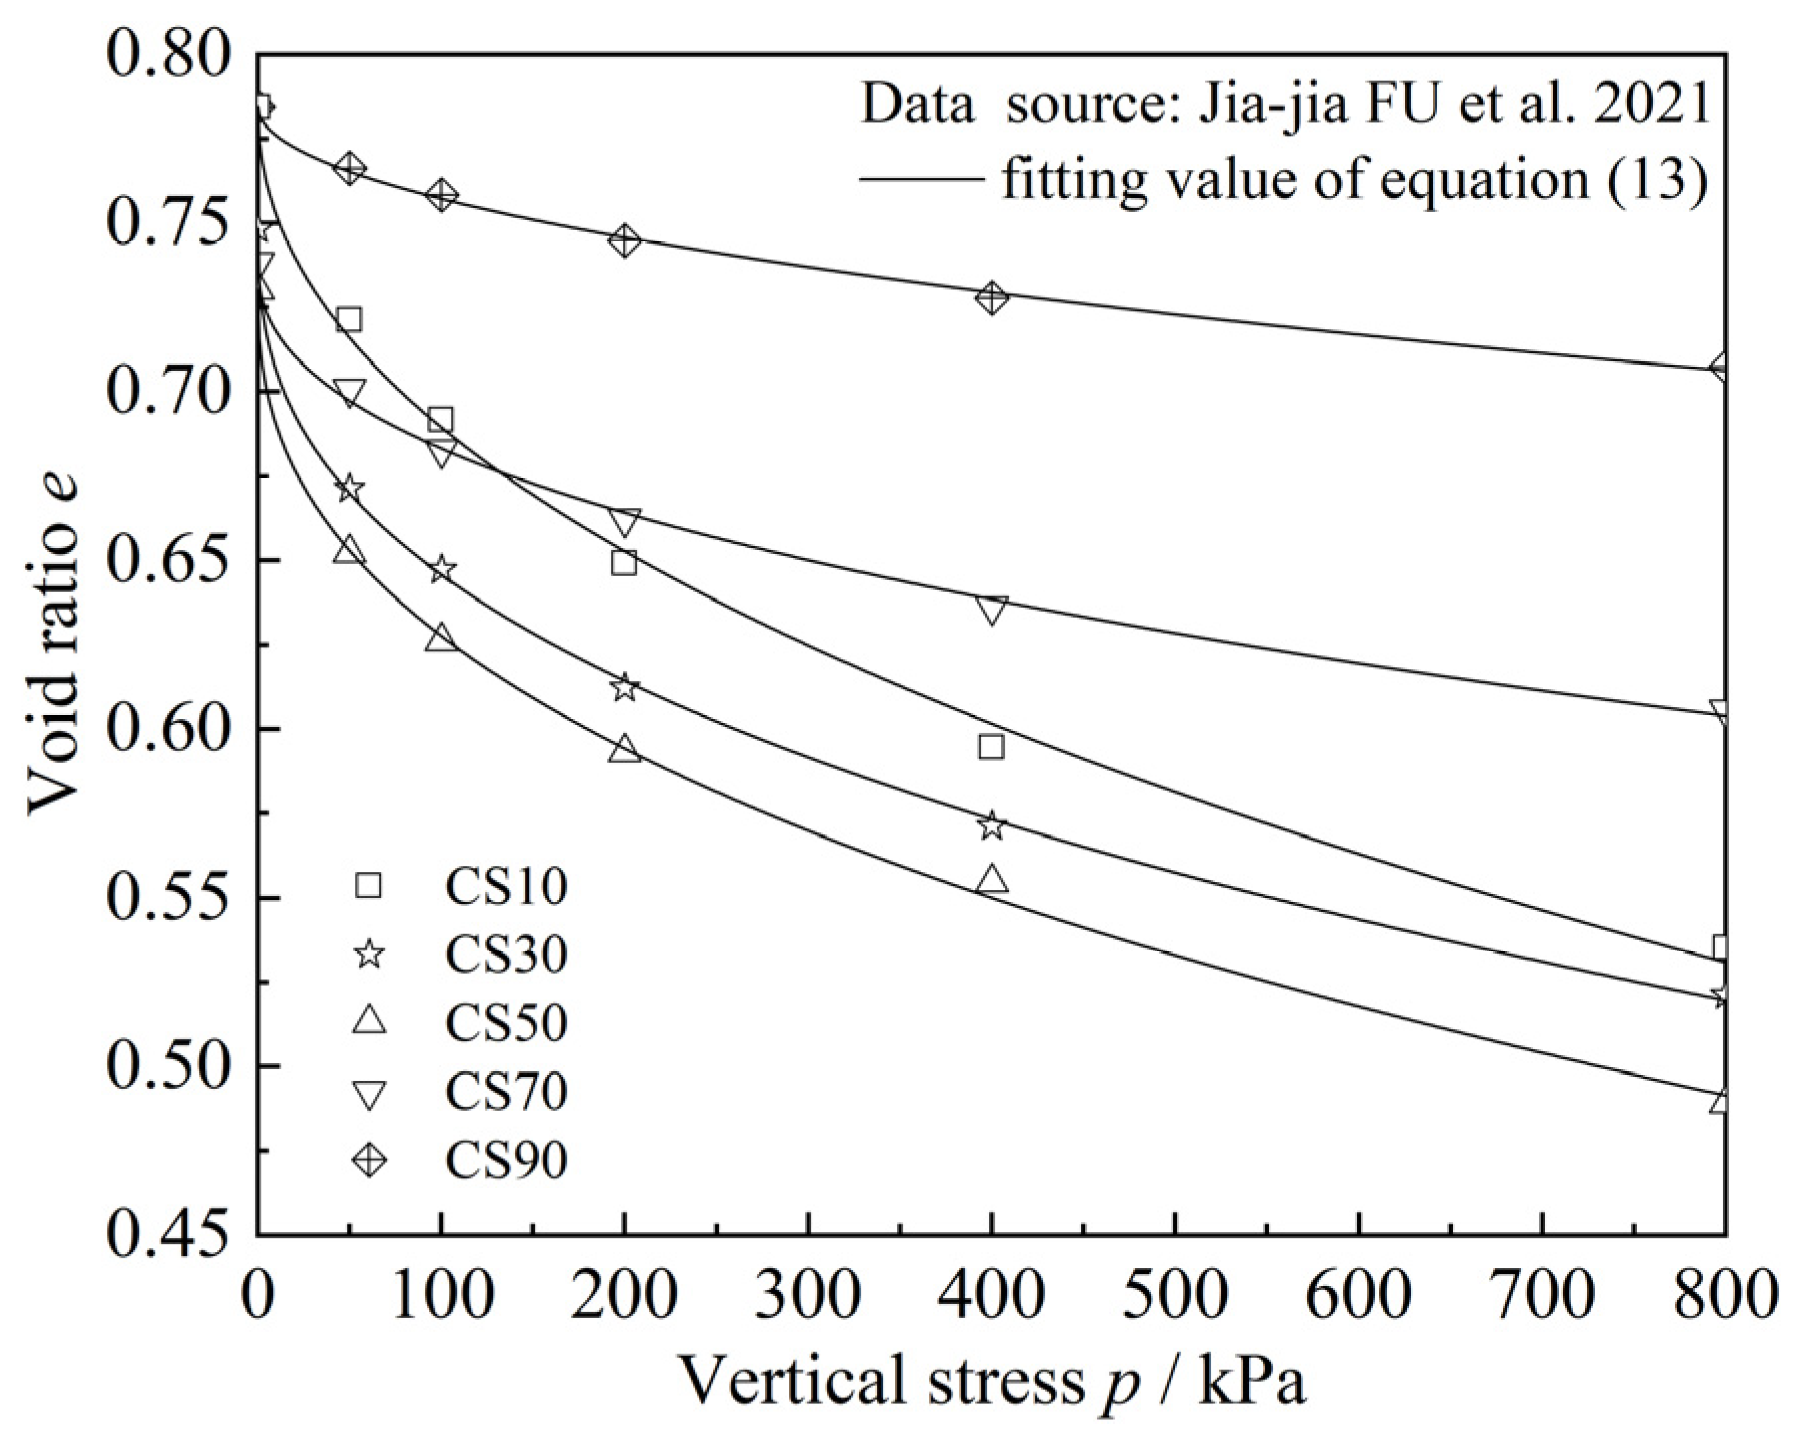
5.2. Validation of the Compression Model for Sand–Silt–Clay Mixtures
6. Conclusions
- (1)
- When CS is constant and FC varies, as FC increases, the compressibility of the specimens increases continuously, and the compressibility coefficient also increases. At the same time, as CS increases, the differences in the e–lgp curves and compressibility coefficients between different specimens gradually expand.
- (2)
- When FC varies, the effect of CS on the e–lgp curve and compressibility coefficient is not consistent. As CS increases, for specimens with FC = 3%, the compressibility weakens continuously (the compressibility coefficient decreases); for specimens with FC = 7% and 10%, the compressibility strengthens continuously (the compressibility coefficient increases); for specimens with FC = 5%, there is no clear trend observed in the changes in compressibility and compressibility coefficient.
- (3)
- The distribution state of clay and silt particles in the mixed soil varies under different FC. When FC = 3%, the silt particles primarily influence the compressive properties of the mixed soil. However, when FC = 7% and 10%, the influence of clay particles on the compressive properties becomes more dominant and diversified. In this case, the compressibility of the mixed soil is mainly controlled by the clay particles.
- (4)
- Based on the one-dimensional compression consolidation test results in this study, a compression model for mixed soil considering the effects of FC and CS was established. This model can effectively reflect the compressive properties of sand–silt–clay mixtures in this study, sand–clay mixtures and sand–silt mixtures from the related literature. The results demonstrate that the model possesses good validity and applicability for sand mixed with two different properties of fines particles (clay and silt) or single property fines particle (clay or silt).
Author Contributions
Funding
Institutional Review Board Statement
Informed Consent Statement
Data Availability Statement
Conflicts of Interest
References
- Yang, S.Y.; Lim, D.I.; Jung, H.S.; Oh, B.C. Geochemical composition and provenance discrimination of coastal sediments around Cheju Island in the southeastern Yellow Sea. Mar. Geol. 2004, 206, 41–53. [Google Scholar] [CrossRef]
- Pang, Z.Z. The moisture seepage and utilization of coastal sandy soil in southwestern Hainan island. Trop. Geogr. 1985, 5, 15–21. [Google Scholar]
- Lee, C.; Hong, S.-J.; Kim, D.; Lee, W. Assessment of compression index of Busan and Incheon clays with sedimentation state. Mar. Georesour. Geotechnol. 2015, 33, 23–32. [Google Scholar] [CrossRef]
- Hong, Z.-S.; Yin, J.; Cui, Y.-J. Compression behaviour of reconstituted soils at high initial water contents. Géotechnique 2010, 60, 691–700. [Google Scholar] [CrossRef]
- Hu, F.; Fang, X.; Yao, Z.; Wu, H.; Shen, C.; Zhang, Y. Experiment and discrete element modeling of particle breakage in coral sand under triaxial compression conditions. Mar. Georesour. Geotechnol. 2023, 41, 142–151. [Google Scholar] [CrossRef]
- Zhao, Y.H.; Zhu, J.G.; Zhang, Z.L.; Liu, X. A compression model for cohesionless soils. Rock Soil Mech. 2011, 32, 3033–3037+3042. [Google Scholar] [CrossRef]
- Li, M.; Yang, E.; Li, P.; Bao, H.; Li, L.; Shen, Z.; Jiao, P. Characteristics of sediment deposition in check dam in small watershed in Loess Hilly Area. Trans. Chin. Soc. Agric. Eng. 2017, 33, 161–167. [Google Scholar]
- Derkaoui, M.; Missoum, H.; Bendani, K.; Belhouari, F. Shear behavior of sand-silt mixtures: A laboratory investigation of coastal silty sand soils of Mostaganem. Mar. Georesour. Geotechnol. 2016, 34, 668–680. [Google Scholar] [CrossRef]
- Monkul, M.M.; Ozden, G. Compressional behavior of clayey sand and transition fines content. Eng. Geol. 2007, 89, 195–205. [Google Scholar] [CrossRef]
- Wu, Z.L.; Zhu, X.Y.; Deng, Y.F.; Liu, H.S. Compression behavior of sand-clay mixtures and formation mechanism of coarse granulesand skeleton. China Civ. Eng. J. 2016, 49, 121–128. [Google Scholar] [CrossRef]
- Fu, J.J.; Wang, L.; You, S.N.; Wang, X.D. Relation between compression characteristics and microstructure of clay-sand mixtures. J. Yangtze River Sci. Res. Inst. 2021, 38, 115–122. [Google Scholar] [CrossRef]
- Fukue, M.; Okusa, S.; Nakamura, T. Consolidation of sand-clay mixtures. ASTM Spec. Tech. Publ. 1986, 892, 627–641. [Google Scholar] [CrossRef]
- Huang, Y.-T.; Huang, A.-B.; Kuo, Y.-C.; Tsai, M.-D. A laboratory study on the undrained strength of a silty sand from Central Western Taiwan. Soil Dyn. Earthq. Eng. 2004, 24, 733–743. [Google Scholar] [CrossRef]
- GB/T 50123-2019; Standard for Geotechnical Testing Method. Planning Press: Beijing, China, 2019.
- Li, T.; Tang, X.W. Influences of low fines content and fines mixing ratio on the undrained static shear strength of sand-silt-clay mixtures. Eur. J. Environ. Civ. Eng. 2022, 26, 3706–3728. [Google Scholar] [CrossRef]
- Yamamuro, J.A.; Lade, P.V. Experiments and modelling of silty sands susceptible to static liquefaction. Mech. Cohesive-Frict. Mater. 1999, 4, 545–564. [Google Scholar] [CrossRef]
- Fan, J.; Rowe, R.K.; Brachman, R.W.I. Compressibility and permeability of sand-silt tailings mixtures. Can. Geotech. J. 2022, 59, 1348–1357. [Google Scholar] [CrossRef]
- Fiès, J.C.; Bruand, A. Particle packing and organization of the textural porosity in clay-silt-sand mixtures. Eur. J. Soil Sci. 1998, 49, 557–567. [Google Scholar] [CrossRef]
- Watabe, Y.; Yamada, K.; Saitoh, K. Hydraulic conductivity and compressibility of mixtures of Nagoya clay with sand or bentonite. Géotechnique 2011, 61, 211–219. [Google Scholar] [CrossRef]
- Elkamhawy, E.; Zhou, B.; Wang, H. Transitional behavior in well-graded soils: An example of completely decomposed granite. Eng. Geol. 2019, 253, 240–250. [Google Scholar] [CrossRef]
- Dash, H.K.; Sitharam, T.G. Undrained monotonic response of sand-silt mixtures: Effect of nonplastic fines. Geomech. Geoengin. 2011, 6, 47–58. [Google Scholar] [CrossRef]
- Cabalar, A.F. Applications of the oedometer, triaxial and resonant column tests to the study of micaceous sands. Eng. Geol. 2010, 112, 21–28. [Google Scholar] [CrossRef]
- Shen, Z.J. A stress-strain model for soils with three yield surfaces. Acta Mech. Solida Sin. 1984, 5, 163–174. [Google Scholar] [CrossRef]


| Materials | Effective Grain Diameter (d10)/mm | Median Grain Diameter (d30)/mm | Coefficient of Curvature (Cc) | Coefficient of Non-Uniformity (Cu) | Liquid Limit (wL)/% | Plastic Limit (wp)/% |
|---|---|---|---|---|---|---|
| Sand particle | 0.110 | 0.132 | 0.920 | 1.570 | - | - |
| Silt particle | 0.041 | 0.051 | 1.020 | 1.510 | - | - |
| Clay particle | 0.003 | 0.006 | 0.920 | 4.330 | 104 | 52 |
| Fines Content (FC)/% | Fines Particle Ratio | Initial Void Ratio (e0) | Specimen | ||
|---|---|---|---|---|---|
| Clay Content (CC)/% | Silt Content (SC)/% | Clay–Silt Ratio (CS) | |||
| 3 | 20 | 80 | 0.25 | 0.8823 | FC = 3%–CS = 0.25 |
| 50 | 50 | 1 | FC = 3%–CS = 1 | ||
| 80 | 20 | 4 | FC = 3%–CS = 4 | ||
| 5 | 20 | 80 | 0.25 | FC = 5%–CS = 0.25 | |
| 50 | 50 | 1 | FC = 5%–CS = 1 | ||
| 80 | 20 | 4 | FC = 5%–CS = 4 | ||
| 7 | 20 | 80 | 0.25 | FC = 7%–CS = 025 | |
| 50 | 50 | 1 | FC = 7%–CS = 1 | ||
| 80 | 20 | 4 | FC = 7%–CS = 4 | ||
| 10 | 20 | 80 | 0.25 | FC = 10%–CS = 0.25 | |
| 50 | 50 | 1 | FC = 10%–CS = 1 | ||
| 80 | 20 | 4 | FC = 10%–CS = 4 | ||
| Fines Content (FC)/% | Clay–Silt Ratio (CS) | Fitting Parameter (k) | Fitting Parameter (λ) |
|---|---|---|---|
| 3 | 0.25 | 0.02873 | 0.38921 |
| 1 | 0.02750 | 0.38320 | |
| 4 | 0.02131 | 0.46116 | |
| 5 | 0.25 | 0.02788 | 0.41152 |
| 1 | 0.02804 | 0.41902 | |
| 4 | 0.02521 | 0.42506 | |
| 7 | 0.25 | 0.02679 | 0.42209 |
| 1 | 0.02803 | 0.43341 | |
| 4 | 0.02982 | 0.42412 | |
| 10 | 0.25 | 0.02713 | 0.43161 |
| 1 | 0.03519 | 0.41714 | |
| 4 | 0.04087 | 0.43412 |
| Specimen | Fitting Parameter (η1) or (η2) | Fitting Parameter (λ) | R-Squared (R2) |
|---|---|---|---|
| FC = 3%–CS = 0.25 | −7.61292 | 2.09450 | 0.9995 |
| FC = 3%–CS = 1 | −6.60320 | 2.05533 | 0.9964 |
| FC = 3%–CS = 4 | −53.99436 | 2.60268 | 0.9980 |
| FC = 5%–CS = 0.25 | −5.27461 | 2.24656 | 0.9995 |
| FC = 5%–CS = 1 | −5.20440 | 2.22979 | 0.9984 |
| FC = 5%–CS = 4 | −7.65558 | 2.34118 | 0.9983 |
| FC = 7%–CS = 025 | −183.13191 | 2.31626 | 0.9980 |
| FC = 7%–CS = 1 | 4523.40726 | 2.39394 | 0.9961 |
| FC = 7%–CS = 4 | 190.31555 | 2.32657 | 0.9941 |
| FC = 10%–CS = 0.25 | −247.63203 | 2.38420 | 0.9993 |
| FC = 10%–CS = 1 | 2518.96513 | 2.28276 | 0.9971 |
| FC = 10%–CS = 4 | 342.37367 | 2.40386 | 0.9943 |
| Specimen | Fitting Parameter (η) | Fitting Parameter (λ) | R-Squared (R2) |
|---|---|---|---|
| CS10 | 0.01586 | 0.50865 | 0.9977 |
| CS30 | 0.08618 | 0.38574 | 0.9994 |
| CS50 | 0.13690 | 0.40597 | 0.9989 |
| CS70 | 0.14133 | 0.42850 | 0.9974 |
| CS90 | 0.86301 | 0.47239 | 0.9965 |
| Fines Content (FC)/% | Relative Density (Dro)/% | Fitting Parameter (η) | Fitting Parameter (λ) | R-Squared (R2) |
|---|---|---|---|---|
| 15 | 30 | 520,026.42535 | 3.77810 | 0.9903 |
| 50 | 2,071,235.63296 | 4.24299 | 0.9997 | |
| 70 | 893,172.52201 | 4.16253 | 0.9940 | |
| 85 | 5485.43228 | 2.84228 | 0.9933 | |
| 30 | 50 | 37,750,400.00000 | 5.20503 | 0.9896 |
| 70 | 9,655,145.79934 | 4.82729 | 0.9993 | |
| 50 | 50 | 12,084.05851 | 3.14643 | 0.9950 |
| 70 | 582.08511 | 2.29371 | 0.9780 |
Disclaimer/Publisher’s Note: The statements, opinions and data contained in all publications are solely those of the individual author(s) and contributor(s) and not of MDPI and/or the editor(s). MDPI and/or the editor(s) disclaim responsibility for any injury to people or property resulting from any ideas, methods, instructions or products referred to in the content. |
© 2025 by the authors. Licensee MDPI, Basel, Switzerland. This article is an open access article distributed under the terms and conditions of the Creative Commons Attribution (CC BY) license (https://creativecommons.org/licenses/by/4.0/).
Share and Cite
Li, T.; Li, J.; Li, B.; Yu, G. Experimental Study on the Compression Characteristics of Sand–Silt–Clay Mixtures. Materials 2025, 18, 996. https://doi.org/10.3390/ma18050996
Li T, Li J, Li B, Yu G. Experimental Study on the Compression Characteristics of Sand–Silt–Clay Mixtures. Materials. 2025; 18(5):996. https://doi.org/10.3390/ma18050996
Chicago/Turabian StyleLi, Tao, Jixiao Li, Bingyang Li, and Guangtao Yu. 2025. "Experimental Study on the Compression Characteristics of Sand–Silt–Clay Mixtures" Materials 18, no. 5: 996. https://doi.org/10.3390/ma18050996
APA StyleLi, T., Li, J., Li, B., & Yu, G. (2025). Experimental Study on the Compression Characteristics of Sand–Silt–Clay Mixtures. Materials, 18(5), 996. https://doi.org/10.3390/ma18050996