
Fracture Modeling of QP980 Steel: Evaluating the Rice–Tracey and DF2016 Criteria Under Diverse Loading States


 ,
, 
Abstract
:1. Introduction
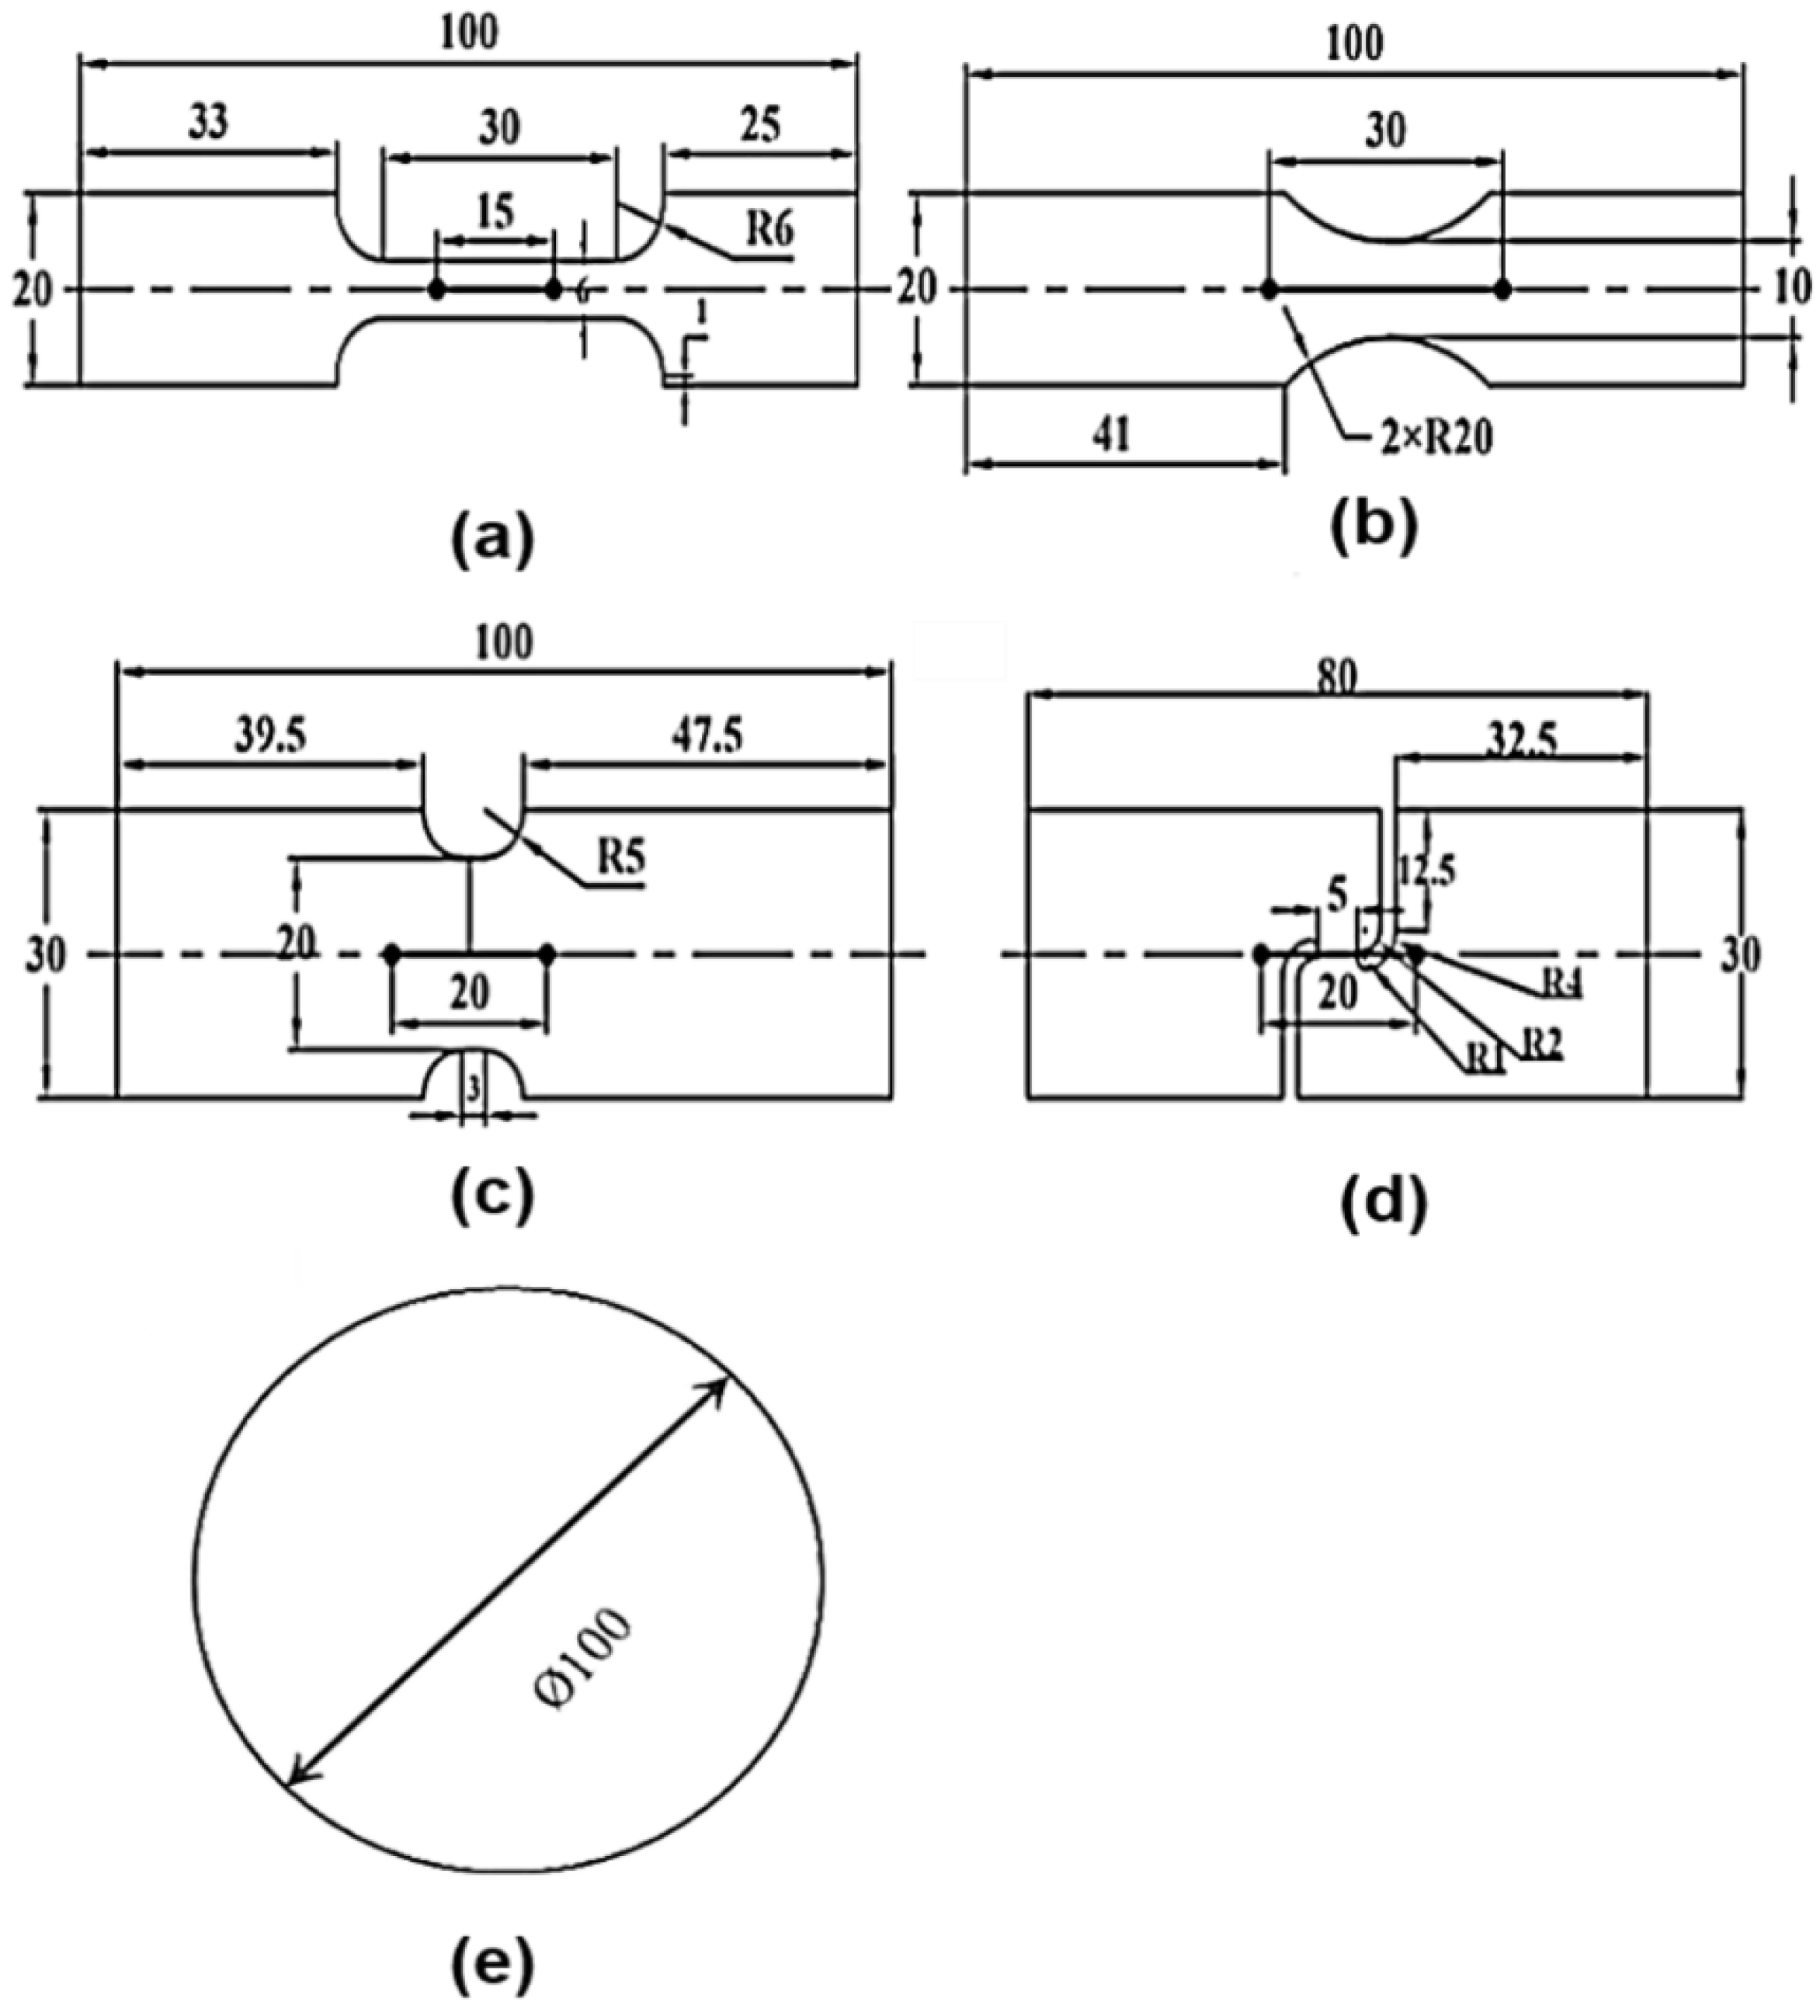
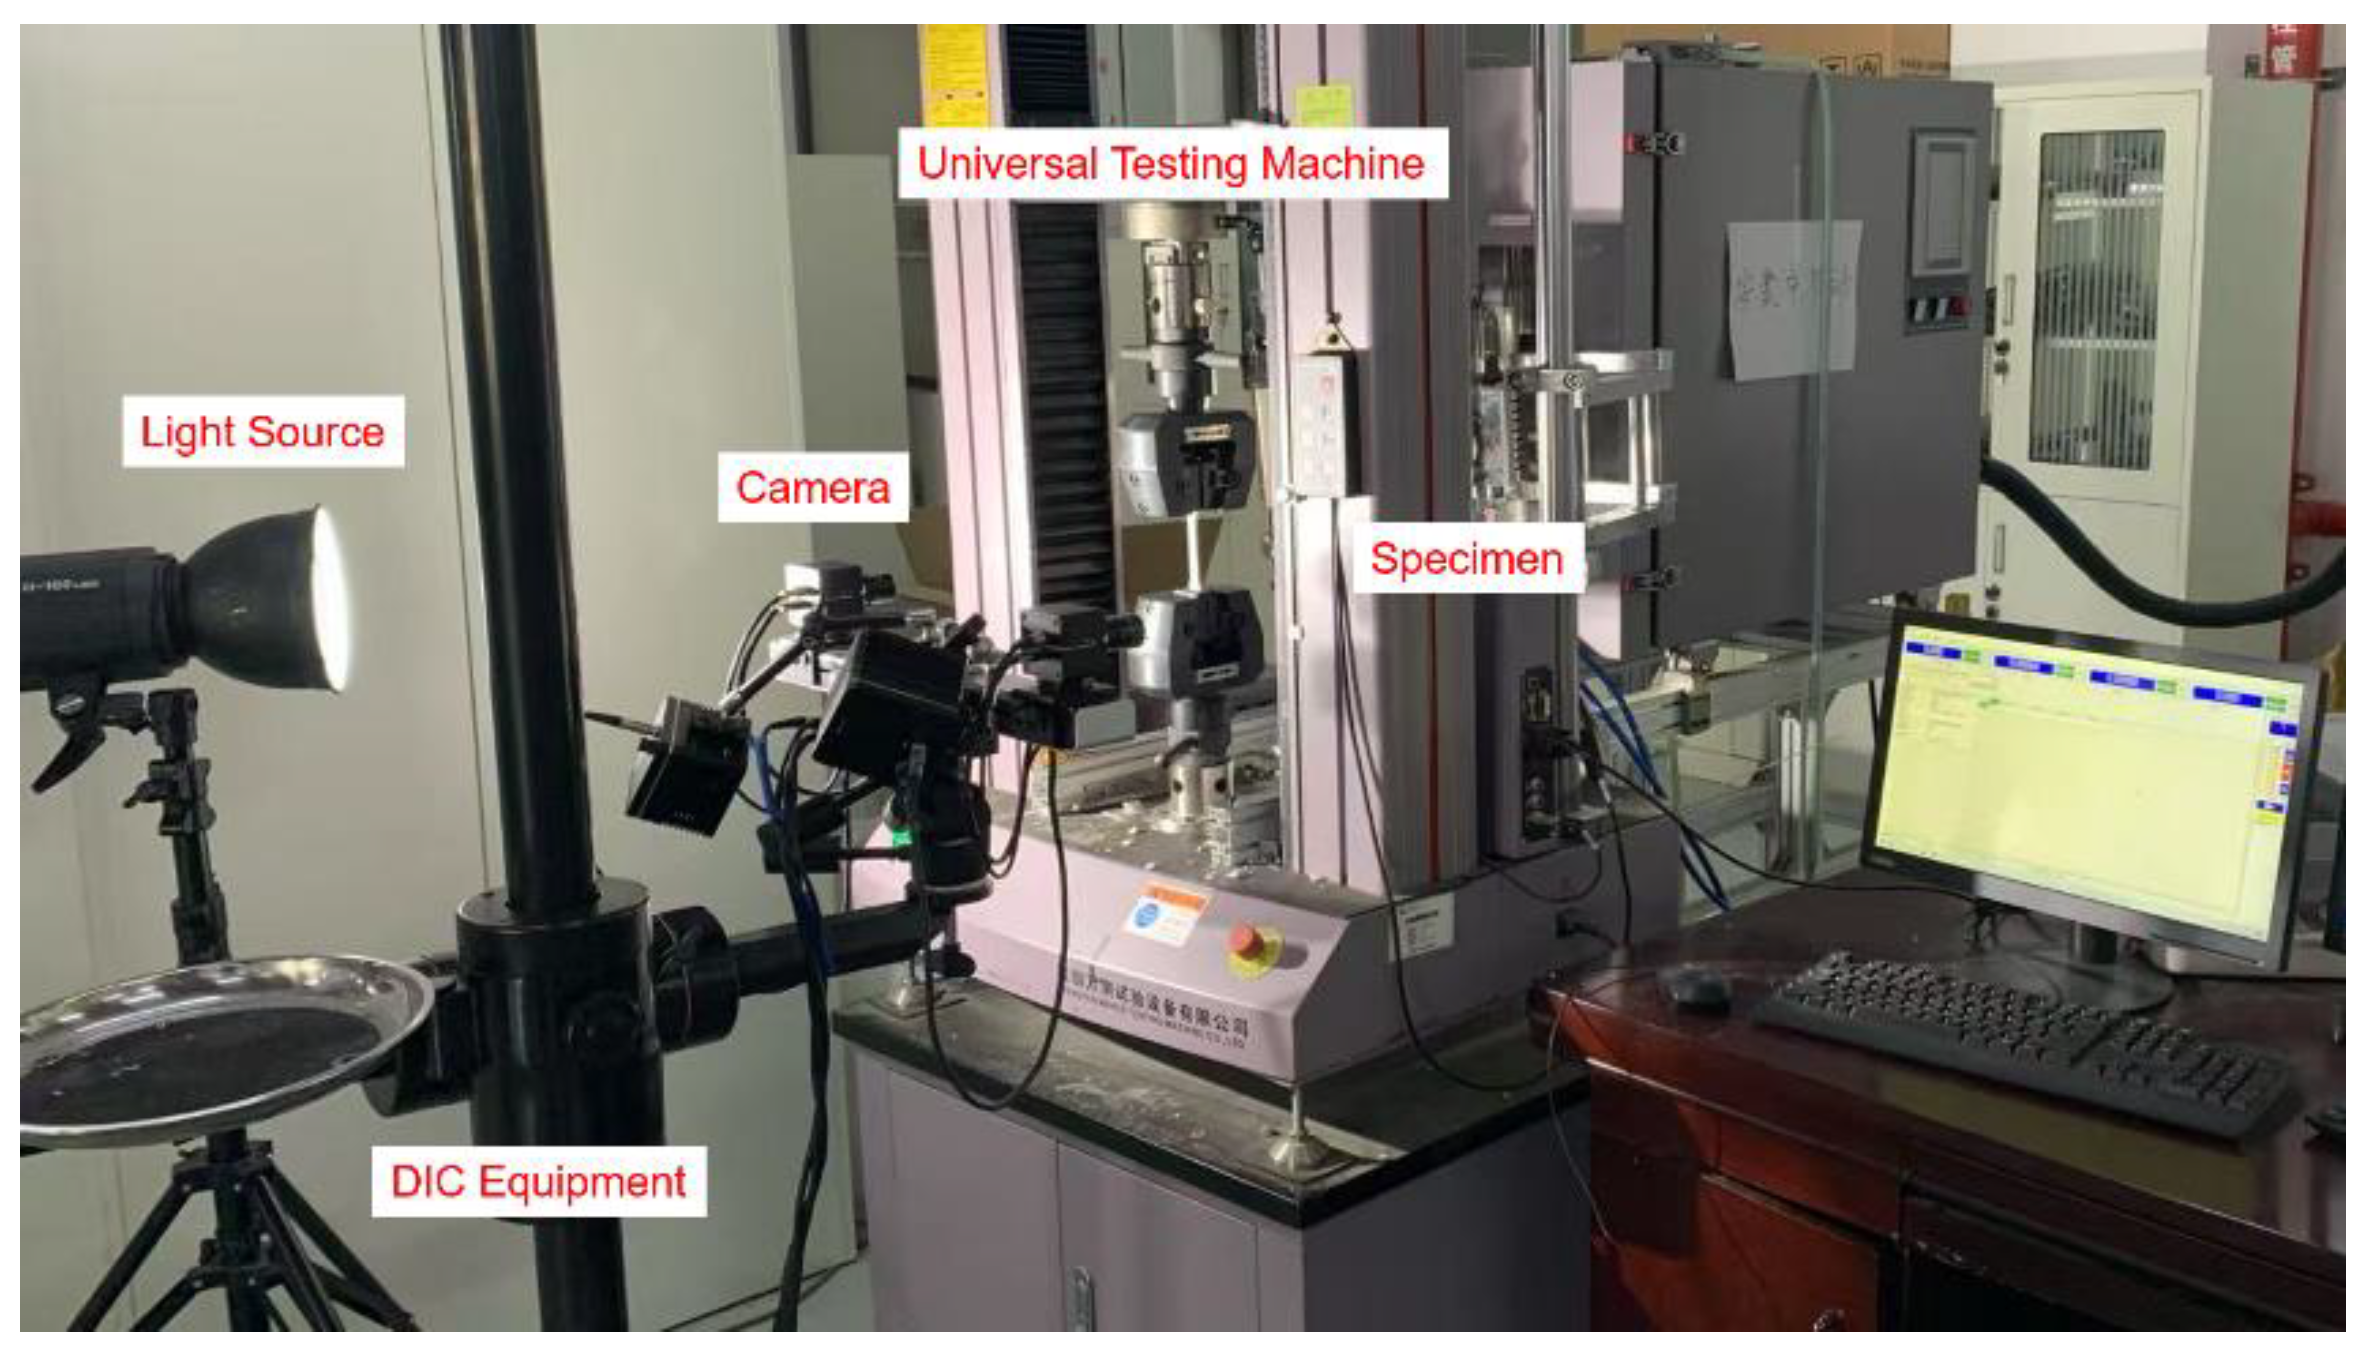
2. Experiments
3. Ductile Fracture Criteria
3.1. DF2016 Fracture Criterion
3.2. The Rice–Tracey Criterion
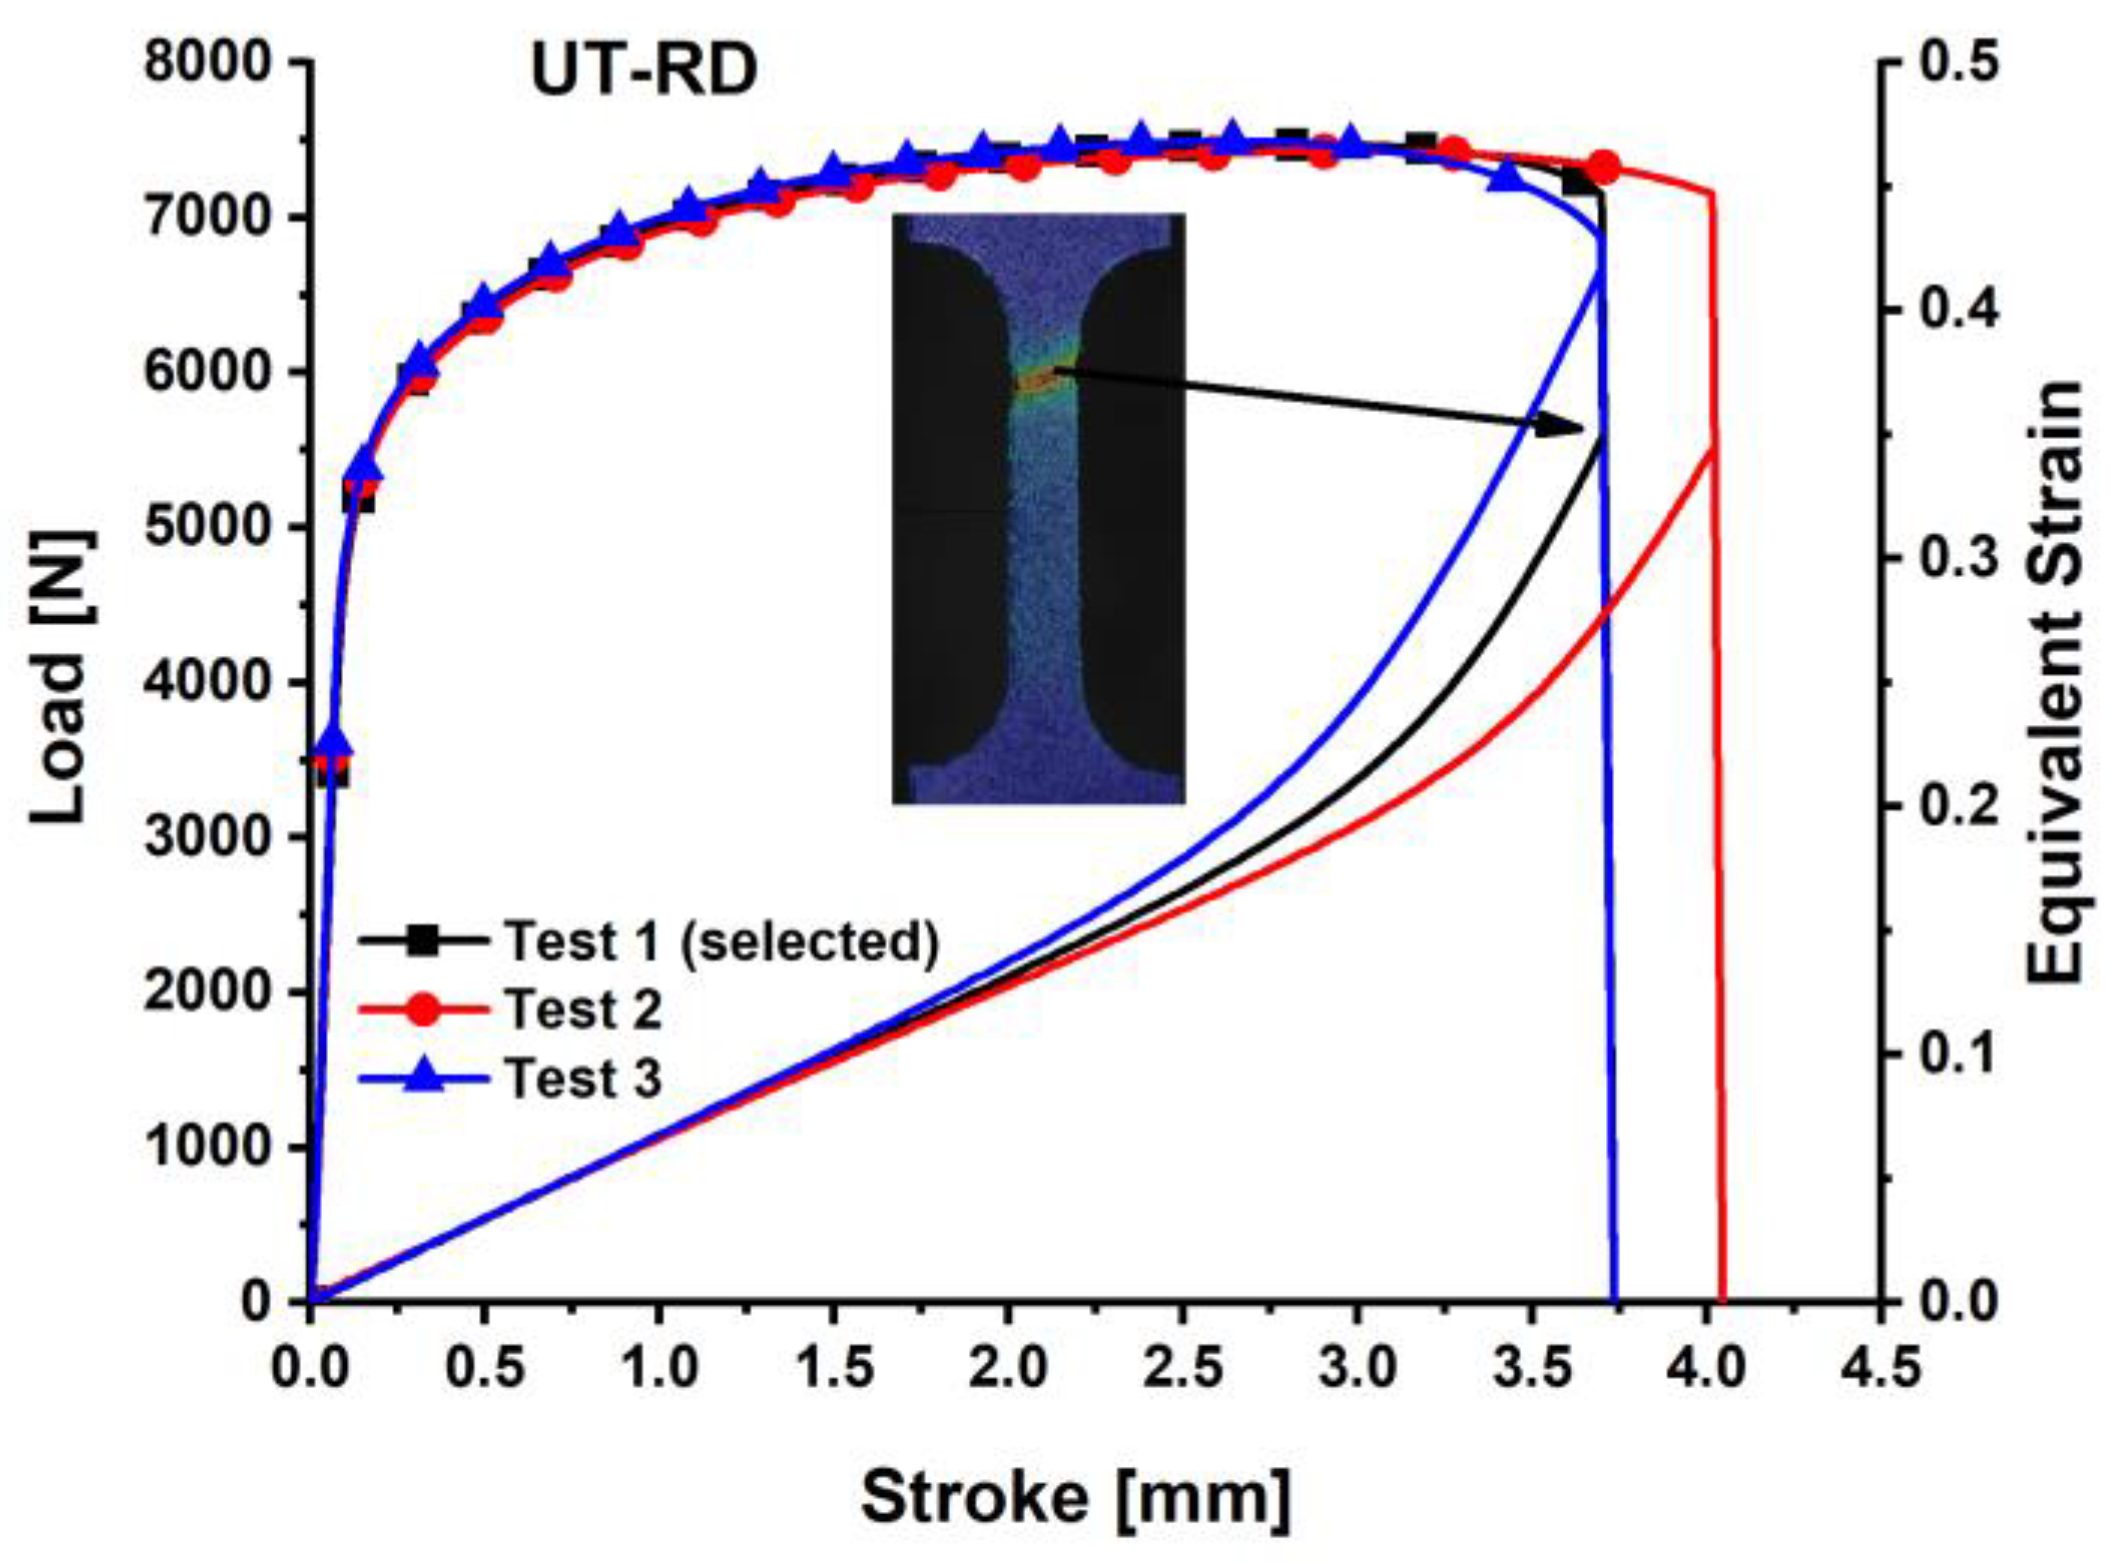
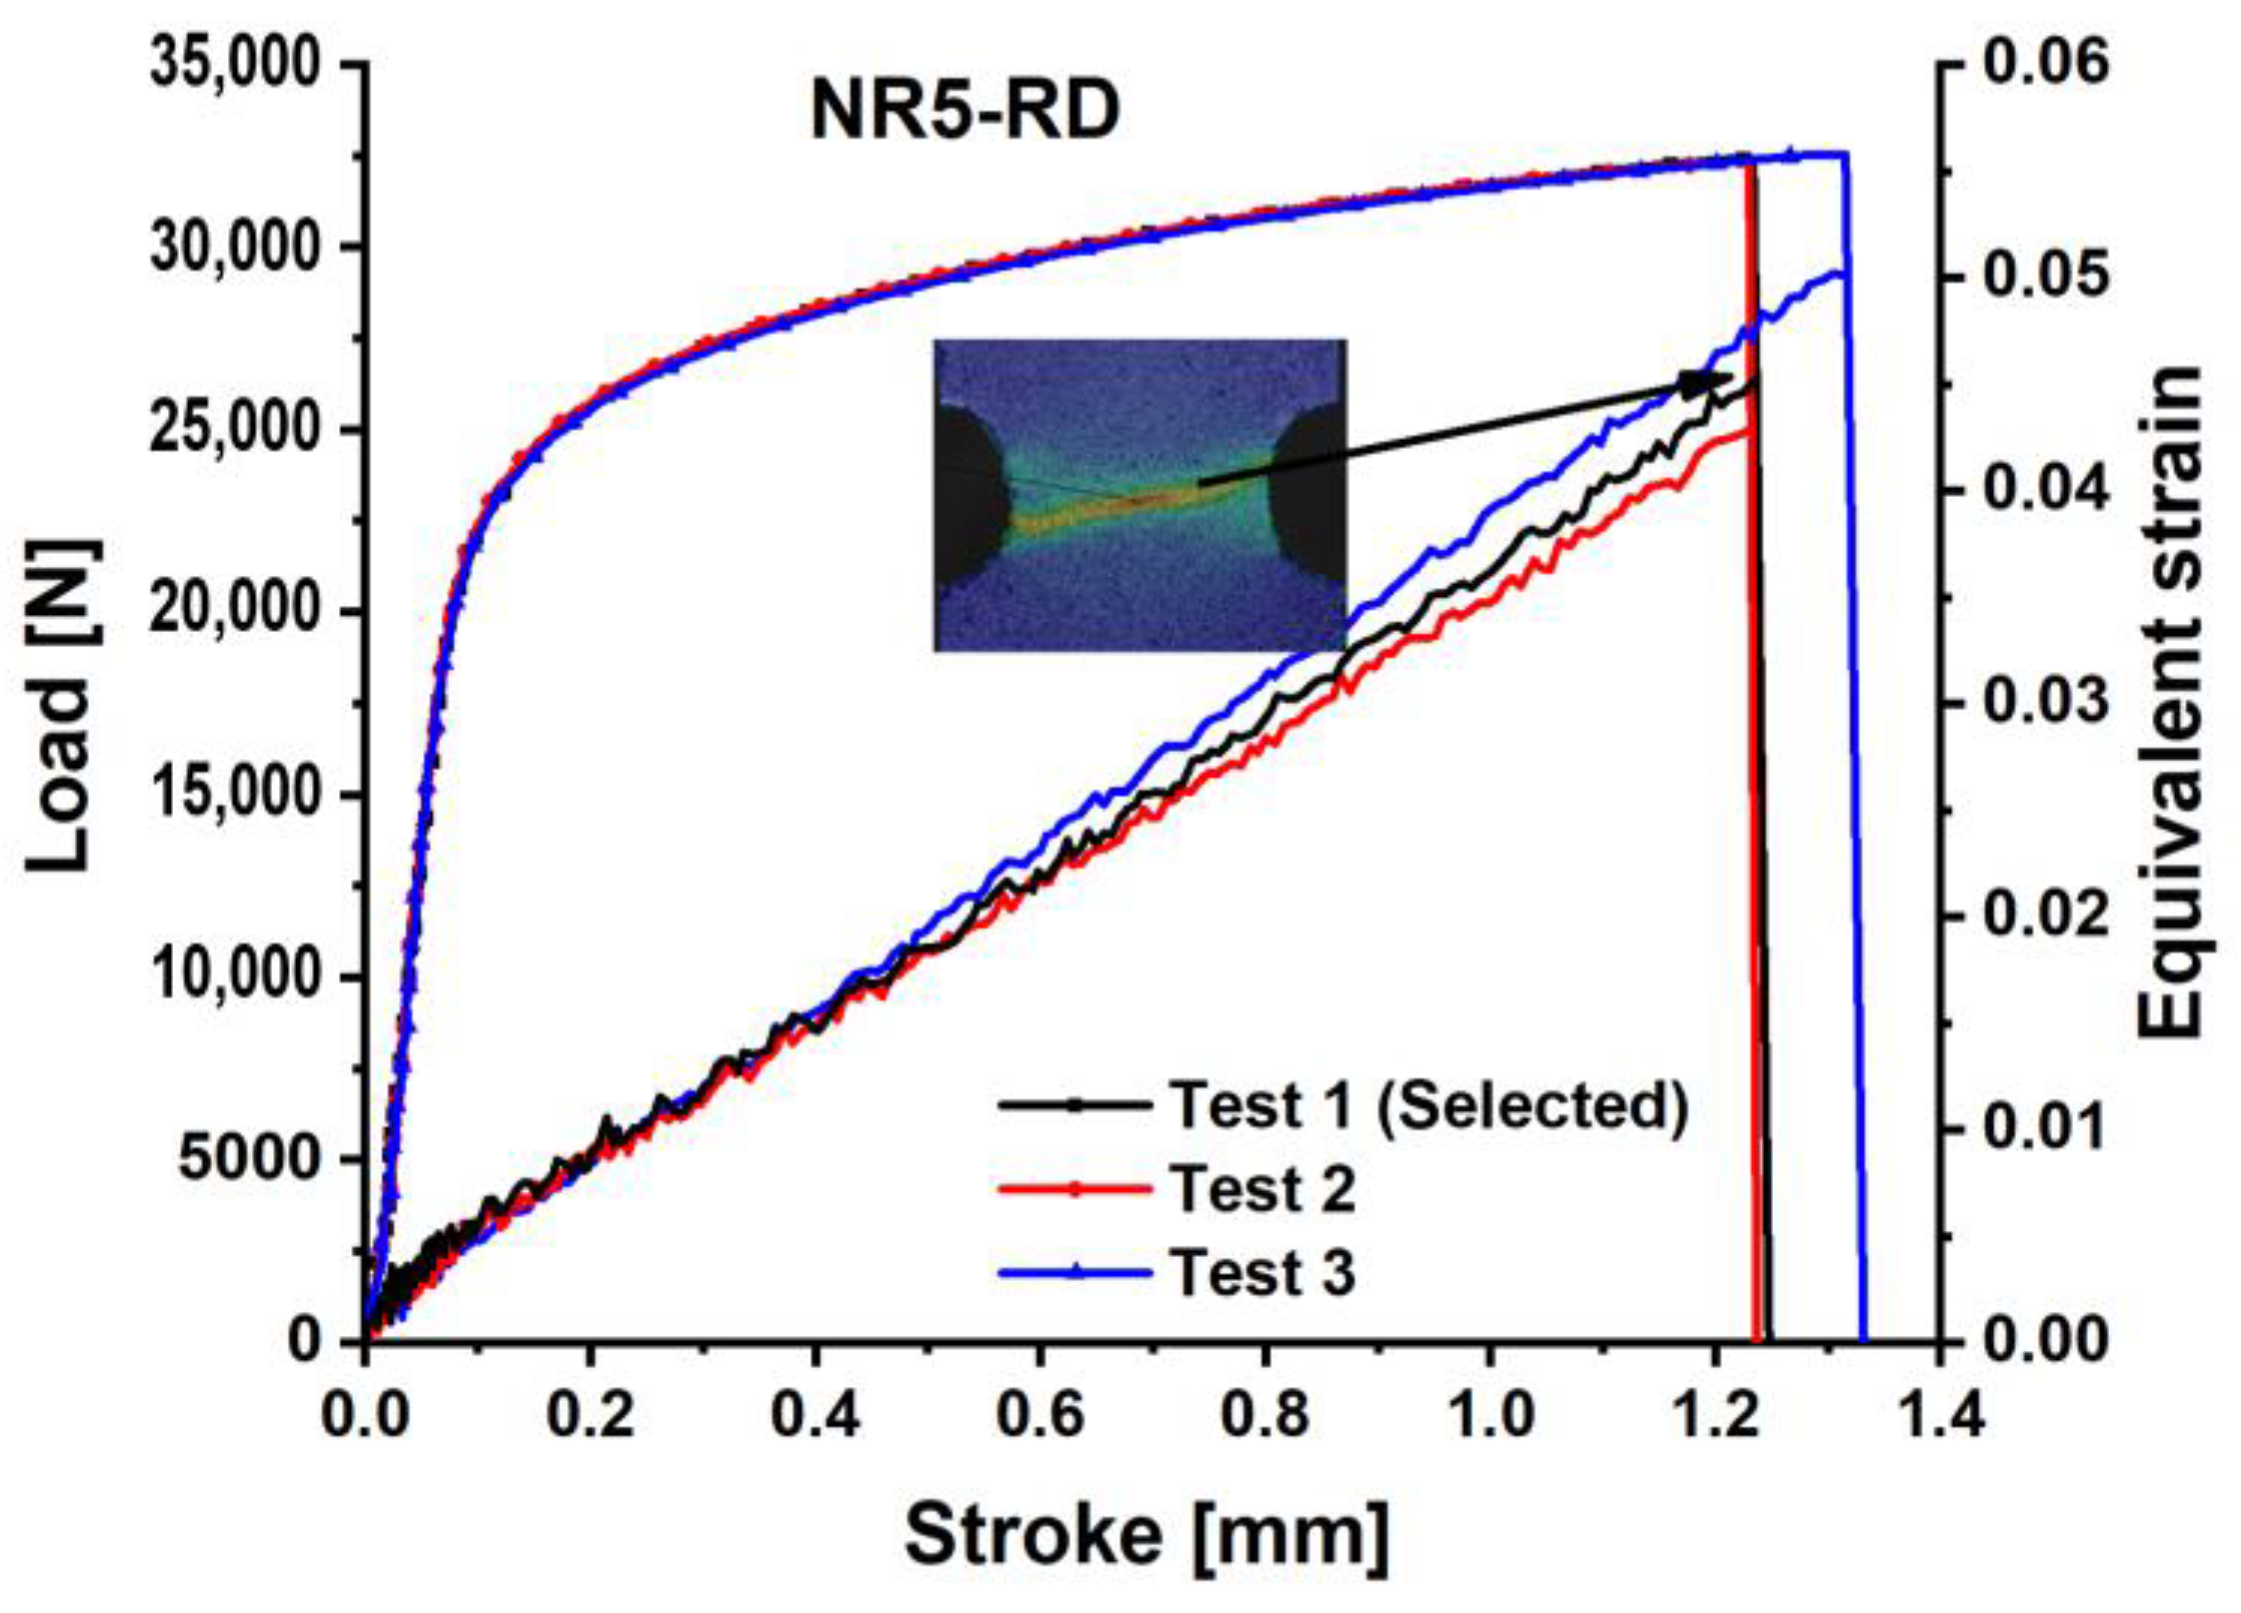
4. Results and Discussion
5. Conclusions
Author Contributions
Funding
Institutional Review Board Statement
Informed Consent Statement
Data Availability Statement
Conflicts of Interest
References
- Lian, C.; Niu, C.; Han, F. Applicability of the Formability Evaluation Method for Advanced High Strength Steels. IOP Conf. Ser. Mater. Sci. Eng. 2024, 1307, 012014. [Google Scholar] [CrossRef]
- Chang, Y.; Li, J.; Li, X.; Wang, B.; Yu, S.; Wang, C. Microstructural Evolution and Mechanical Behaviors of the Third–Generation Automobile QP980 Steel under Continuous Tension and Compression Loads. Mater. Sci. Eng. A 2023, 883, 145533. [Google Scholar] [CrossRef]
- Mao, J.X.; Xian, Z.F.; Wang, X.; Hu, D.Y.; Pan, J.C.; Wang, R.Q.; Zou, S.K.; Gao, Y. Fatigue Life Prediction of Cold Expansion Hole Using Physics-Enhanced Data-Driven Method. Int. J. Fatigue 2025, 190, 108634. [Google Scholar] [CrossRef]
- Hill, R. A Theory of the Yielding and Plastic Flow of Anisotropic Metals. Proc. R. Soc. Lond. 1984, 193, 281–297. [Google Scholar]
- Barlat, F.; Lege, D.J.; Brem, J.C. A Six-Component Yield Function for Anisotropic Materials. Int. J. Plast. 1991, 7, 693–712. [Google Scholar] [CrossRef]
- Barlat, F.; Brem, J.C.; Yoon, J.W.; Chung, K.; Dick, R.E.; Lege, D.J.; Pourboghrat, F.; Choi, S.H.; Chu, E. Plane Stress Yield Function for Aluminum Alloy Sheets-Part 1: Theory. Int. J. Plast. 2003, 19, 1297–1319. [Google Scholar] [CrossRef]
- Barlat, F.; Aretz, H.; Yoon, J.W.; Karabin, M.E.; Brem, J.C.; Dick, R.E. Linear Transfomation-Based Anisotropic Yield Functions. Int. J. Plast. 2005, 21, 1009–1039. [Google Scholar] [CrossRef]
- Banabic, D.; Aretz, H.; Comsa, D.S.; Paraianu, L. An Improved Analytical Description of Orthotropy in Metallic Sheets. Int. J. Plast. 2005, 21, 493–512. [Google Scholar] [CrossRef]
- Aretz, H.; Barlat, F. New Convex Yield Functions for Orthotropic Metal Plasticity. Int. J. Non-Linear Mech. 2013, 51, 97–111. [Google Scholar] [CrossRef]
- Cazacu, O.; Plunkett, B.; Barlat, F. Orthotropic Yield Criterion for Hexagonal Closed Packed Metals. Int. J. Plast. 2006, 22, 1171–1194. [Google Scholar] [CrossRef]
- Yoshida, F.; Hamasaki, H.; Uemori, T. A User-Friendly 3D Yield Function to Describe Anisotropy of Steel Sheets. Int. J. Plast. 2013, 45, 119–139. [Google Scholar] [CrossRef]
- Lou, Y.; Yoon, J.W. Anisotropic Yield Function Based on Stress Invariants for BCC and FCC Metals and Its Extension to Ductile Fracture Criterion. Int. J. Plast. 2018, 101, 125–155. [Google Scholar] [CrossRef]
- Stoughton, T.B.; Yoon, J.W. Anisotropic Hardening and Non-Associated Flow in Proportional Loading of Sheet Metals. Int. J. Plast. 2009, 25, 1777–1817. [Google Scholar] [CrossRef]
- Lee, E.H.; Stoughton, T.B.; Yoon, J.W. A Yield Criterion through Coupling of Quadratic and Non-Quadratic Functions for Anisotropic Hardening with Non-Associated Flow Rule. Int. J. Plast. 2017, 99, 120–143. [Google Scholar] [CrossRef]
- Hu, Q.; Yoon, J.W. Analytical Description of an Asymmetric Yield Function (Yoon2014) by Considering Anisotropic Hardening under Non-Associated Flow Rule. Int. J. Plast. 2021, 140, 102978. [Google Scholar] [CrossRef]
- Hou, Y.; Min, J.; Stoughton, T.B.; Lin, J.; Carsley, J.E.; Carlson, B.E. A Non-Quadratic Pressure-Sensitive Constitutive Model under Non-Associated Flow Rule with Anisotropic Hardening: Modeling and Validation. Int. J. Plast. 2020, 135, 102808. [Google Scholar] [CrossRef]
- Hou, Y.; Min, J.; Guo, N.; Shen, Y.; Lin, J. Evolving Asymmetric Yield Surfaces of Quenching and Partitioning Steels: Characterization and Modeling. J. Mater. Process. Technol. 2021, 290, 116979. [Google Scholar] [CrossRef]
- Hou, Y.; Du, K.; El-Aty, A.A.; Lee, M.G.; Min, J. Plastic Anisotropy of Sheet Metals under Plane Strain Loading: A Novel Non-Associated Constitutive Model Based on Fourth-Order Polynomial Functions. Mater. Des. 2022, 223, 111187. [Google Scholar] [CrossRef]
- Hou, Y.; Min, J.; Lin, J.; Lee, M.G. Modeling Stress Anisotropy, Strength Differential, and Anisotropic Hardening by Coupling Quadratic and Stress-Invariant-Based Yield Functions under Non-Associated Flow Rule. Mech. Mater. 2022, 174, 104458. [Google Scholar] [CrossRef]
- Hu, Q.; Yoon, J.W.; Chen, J. Analytically Described Polynomial Yield Criterion by Considering Both Plane Strain and Pure Shear States. Int. J. Plast. 2023, 162, 103514. [Google Scholar] [CrossRef]
- Hu, Q.; Chen, J.; Yoon, J.W. A New Asymmetric Yield Criterion Based on Yld 2000-2d under Both Associated and Non-Associated Flow Rules: Modeling and Validation. Mech. Mater. 2022, 167, 104245. [Google Scholar] [CrossRef]
- Hu, Q.; Yoon, J.W.; Stoughton, T.B. Analytical Determination of Anisotropic Parameters for Poly6 Yield Function. Int. J. Mech. Sci. 2021, 201, 106467. [Google Scholar] [CrossRef]
- Hu, Q.; Yoon, J.W.; Manopulo, N.; Hora, P. A Coupled Yield Criterion for Anisotropic Hardening with Analytical Description under Associated Flow Rule: Modeling and Validation. Int. J. Plast. 2021, 136, 102882. [Google Scholar] [CrossRef]
- Du, K.; Huang, S.; Hou, Y.; Wang, H.; Wang, Y.; Zheng, W.; Yuan, X. Characterization of the Asymmetric Evolving Yield and Flow of 6016-T4 Aluminum Alloy and DP490 Steel. J. Mater. Sci. Technol. 2023, 133, 209–229. [Google Scholar] [CrossRef]
- Lou, Y.; Yoon, J.W. Lode-Dependent Anisotropic-Asymmetric Yield Function for Isotropic and Anisotropic Hardening of Pressure-Insensitive Materials. Part I: Quadratic Function under Non-Associated Flow Rule. Int. J. Plast. 2023, 166, 103647. [Google Scholar] [CrossRef]
- Lou, Y.; Zhang, C.; Zhang, S.; Yoon, J.W. A General Yield Function with Differential and Anisotropic Hardening for Strength Modelling under Various Stress States with Non-Associated Flow Rule. Int. J. Plast. 2022, 158, 103414. [Google Scholar] [CrossRef]
- Hu, D.; Zhao, M.; Pan, J.; Chen, R.; Zhang, J.; Gao, Y.; Wang, R. A Novel LCF Lifetime Model for PM Superalloys Considering Crack Energy Differences Induced by Surface Underconstraint. Int. J. Fatigue 2025, 190, 108648. [Google Scholar] [CrossRef]
- Bai, Y.; Wierzbicki, T. Application of Extended Mohr-Coulomb Criterion to Ductile Fracture. Int. J. Fract. 2010, 161, 1–20. [Google Scholar] [CrossRef]
- Li, F.F.; Fang, G. Establishment and Verification of Two-Component Ductile Fracture Criteria with High Estimation Accuracy. Eng. Fract. Mech. 2018, 204, 221–234. [Google Scholar] [CrossRef]
- Xu, X.; Yan, R.; Fang, X. A Modified DF2016 Criterion for the Fracture Modeling from Shear to Equibiaxial Tension. Materials 2024, 17, 958. [Google Scholar] [CrossRef]
- Wu, P.F.; Zhang, C.; Lou, Y.S.; Chen, Q.; Ning, H.Q. Constitutive Relationship and Characterization of Fracture Behavior for WE43 Alloy under Various Stress States. Trans. Nonferrous Met. Soc. China 2023, 33, 438–453. [Google Scholar] [CrossRef]
- Mu, L.; Jia, Z.; Ma, Z.; Shen, F.; Sun, Y.; Zang, Y. A Theoretical Prediction Framework for the Construction of a Fracture Forming Limit Curve Accounting for Fracture Pattern Transition. Int. J. Plast. 2020, 129, 102706. [Google Scholar] [CrossRef]
- Ganjiani, M.; Homayounfard, M. Development of a Ductile Failure Model Sensitive to Stress Triaxiality and Lode Angle. Int. J. Solids Struct. 2021, 225, 111066. [Google Scholar] [CrossRef]
- Hu, Q.; Li, X.; Han, X.; Chen, J. A New Shear and Tension Based Ductile Fracture Criterion: Modeling and Validation. Eur. J. Mech. A/Solids 2017, 66, 370–386. [Google Scholar] [CrossRef]
- Zheng, L.; Wang, K.; Jiang, Y.; Wan, M.; Meng, B. A New Ductile Failure Criterion for Micro/Meso Scale Forming Limit Prediction of Metal Foils Considering Size Effect and Free Surface Roughening. Int. J. Plast. 2022, 157, 103406. [Google Scholar] [CrossRef]
- Zhang, T.; Yuan, H.; Yang, S. Fracture Energy and Tensile Strength Depending on Stress Triaxiality along a Running Crack Front in Three-Dimensional Cohesive Modeling. Eng. Fract. Mech. 2020, 227, 106919. [Google Scholar] [CrossRef]
- Quach, H.; Kim, J.J.; Nguyen, D.T.; Kim, Y.S. Uncoupled Ductile Fracture Criterion Considering Secondary Void Band Behaviors for Failure Prediction in Sheet Metal Forming. Int. J. Mech. Sci. 2020, 169, 105297. [Google Scholar] [CrossRef]
- Shang, X.; Cui, Z.; Fu, M.W. A Ductile Fracture Model Considering Stress State and Zener–Hollomon Parameter for Hot Deformation of Metallic Materials. Int. J. Mech. Sci. 2018, 144, 800–812. [Google Scholar] [CrossRef]
- Weck, A.; Wilkinson, D.S. Experimental Investigation of Void Coalescence in Metallic Sheets Containing Laser Drilled Holes. Acta Mater. 2008, 56, 1774–1784. [Google Scholar] [CrossRef]
- Lou, Y.; Yoon, J.W.; Huh, H.; Chao, Q.; Song, J.H. Correlation of the Maximum Shear Stress with Micro-Mechanisms of Ductile Fracture for Metals with High Strength-to-Weight Ratio. Int. J. Mech. Sci. 2018, 146–147, 583–601. [Google Scholar] [CrossRef]
- Stoughton, T.B.; Yoon, J.W. A New Approach for Failure Criterion for Sheet Metals. Int. J. Plast. 2011, 27, 440–459. [Google Scholar] [CrossRef]
- Khan, A.S.; Liu, H. A New Approach for Ductile Fracture Prediction on Al 2024-T351 Alloy. Int. J. Plast. 2012, 35, 1–12. [Google Scholar] [CrossRef]
- Jia, Y.; Bai, Y. Ductile Fracture Prediction for Metal Sheets Using All-Strain-Based Anisotropic EMMC Model. Int. J. Mech. Sci. 2016, 115–116, 516–531. [Google Scholar] [CrossRef]
- Luo, M.; Dunand, M.; Mohr, D. Experiments and Modeling of Anisotropic Aluminum Extrusions under Multi-Axial Loading-Part II: Ductile Fracture. Int. J. Plast. 2012, 32–33, 36–58. [Google Scholar] [CrossRef]
- Beese, A.M.; Luo, M.; Li, Y.; Bai, Y.; Wierzbicki, T. Partially Coupled Anisotropic Fracture Model for Aluminum Sheets. Eng. Fract. Mech. 2010, 77, 1128–1152. [Google Scholar] [CrossRef]
- Lou, Y.; Huh, H. Evaluation of Ductile Fracture Criteria in a General Three-Dimensional Stress State Considering the Stress Triaxiality and the Lode Parameter. Acta Mech. Solida Sin. 2013, 26, 642–658. [Google Scholar] [CrossRef]
- Park, S.J.; Lee, K.; Nam, W.; Kim, K.; Park, B. Numerical Study on a Ductile Fracture Model in Pre-Cracked Tension Tests of SUS304L. Materials 2024, 17, 276. [Google Scholar] [CrossRef]
- Baral, M.; Ha, J.; Korkolis, Y.P. Plasticity and Ductile Fracture Modeling of an Al–Si–Mg Die-Cast Alloy. Int. J. Fract. 2019, 216, 101–121. [Google Scholar] [CrossRef]
- Lou, Y.; Wu, P.; Zhang, C.; Wang, J.; Li, X.; Chai, R.; Yoon, J.W. A Stress-Based Shear Fracture Criterion Considering the Effect of Stress Triaxiality and Lode Parameter. Int. J. Solids Struct. 2022, 256, 111993. [Google Scholar] [CrossRef]
- Mu, L.; Zang, Y.; Wang, Y.; Li, X.L.; Araujo Stemler, P.M. Phenomenological Uncoupled Ductile Fracture Model Considering Different Void Deformation Modes for Sheet Metal Forming. Int. J. Mech. Sci. 2018, 141, 408–423. [Google Scholar] [CrossRef]
- Zhang, C.; Lou, Y.; Zhang, S.; Clausmeyer, T.; Tekkaya, A.E.; Fu, L.; Chen, Q.; Zhang, Q. Large Strain Flow Curve Identification for Sheet Metals under Complex Stress States. Mech. Mater. 2021, 161, 103997. [Google Scholar] [CrossRef]
- Ha, J.; Baral, M.; Korkolis, Y.P. Ductile Fracture of an Aluminum Sheet under Proportional Loading. J. Mech. Phys. Solids 2019, 132, 103685. [Google Scholar] [CrossRef]
- Lou, Y.; Yoon, J.W.; Huh, H. Modeling of Shear Ductile Fracture Considering a Changeable Cut-off Value for Stress Triaxiality. Int. J. Plast. 2014, 54, 56–80. [Google Scholar] [CrossRef]
- Lou, Y.; Yoon, J.W. A User-Friendly Anisotropic Ductile Fracture Criterion for Sheet Metal under Proportional Loading. Int. J. Solids Struct. 2021, 217–218, 48–59. [Google Scholar] [CrossRef]
- Lou, Y.; Chen, L.; Clausmeyer, T.; Tekkaya, A.E.; Yoon, J.W. Modeling of Ductile Fracture from Shear to Balanced Biaxial Tension for Sheet Metals. Int. J. Solids Struct. 2017, 112, 169–184. [Google Scholar] [CrossRef]
- Rice, J.R.; Tracey, D.M. On the Ductile Enlargement of Voids in Triaxial Stress Fields*. J. Mech. Phys. Solids 1969, 17, 201–217. [Google Scholar] [CrossRef]


| C | Si | P | Mn | S | Al | Ti | N |
|---|---|---|---|---|---|---|---|
| 0.18% | 1.72% | 0.01% | 2.23% | 0.002% | 0.028% | ≤0.1% | 0.0033% |
| Specimens | |||
|---|---|---|---|
| EBT | 0.99993 | 0.29473 | 0.64685 |
| PST | −0.29995 | 0.12213 | 0.51275 |
| UT | −0.7305 | 0.43002 | 0.4091 |
| SS | −0.18434 | 0.55641 | 0.08003 |
Disclaimer/Publisher’s Note: The statements, opinions and data contained in all publications are solely those of the individual author(s) and contributor(s) and not of MDPI and/or the editor(s). MDPI and/or the editor(s) disclaim responsibility for any injury to people or property resulting from any ideas, methods, instructions or products referred to in the content. |
© 2025 by the authors. Licensee MDPI, Basel, Switzerland. This article is an open access article distributed under the terms and conditions of the Creative Commons Attribution (CC BY) license (https://creativecommons.org/licenses/by/4.0/).
Share and Cite
Akhtar, H.; Alhalaybeh, T.S.; Fang, X.; Asbah, S.U.D.; Chao, S.; Lou, Y. Fracture Modeling of QP980 Steel: Evaluating the Rice–Tracey and DF2016 Criteria Under Diverse Loading States. Materials 2025, 18, 1303. https://doi.org/10.3390/ma18061303
Akhtar H, Alhalaybeh TS, Fang X, Asbah SUD, Chao S, Lou Y. Fracture Modeling of QP980 Steel: Evaluating the Rice–Tracey and DF2016 Criteria Under Diverse Loading States. Materials. 2025; 18(6):1303. https://doi.org/10.3390/ma18061303
Chicago/Turabian StyleAkhtar, Hammad, Thamer Sami Alhalaybeh, Xucheng Fang, Salah Ud Din Asbah, Shuaijun Chao, and Yanshan Lou. 2025. "Fracture Modeling of QP980 Steel: Evaluating the Rice–Tracey and DF2016 Criteria Under Diverse Loading States" Materials 18, no. 6: 1303. https://doi.org/10.3390/ma18061303
APA StyleAkhtar, H., Alhalaybeh, T. S., Fang, X., Asbah, S. U. D., Chao, S., & Lou, Y. (2025). Fracture Modeling of QP980 Steel: Evaluating the Rice–Tracey and DF2016 Criteria Under Diverse Loading States. Materials, 18(6), 1303. https://doi.org/10.3390/ma18061303