
Mechanical Characteristics of Soft Clay Solidified by Incorporating Granulated Blast Furnace Slag, Magnesium Oxide, and Building Gypsum

Abstract
1. Introduction
2. Materials and Methods
2.1. Materials
2.2. Design of Binder Materials and Sample Preparation
2.3. Testing Procedures
2.3.1. Test Method for Unconfined Compressive Strength
2.3.2. Test Method for Splitting Tensile Strength
2.3.3. Dry and Wet Cycle Test
2.3.4. Sodium Sulfate Solution Soaking Test
2.3.5. pH Measurements
2.3.6. Mineral and Microstructural Analyses
3. Results and Discussion
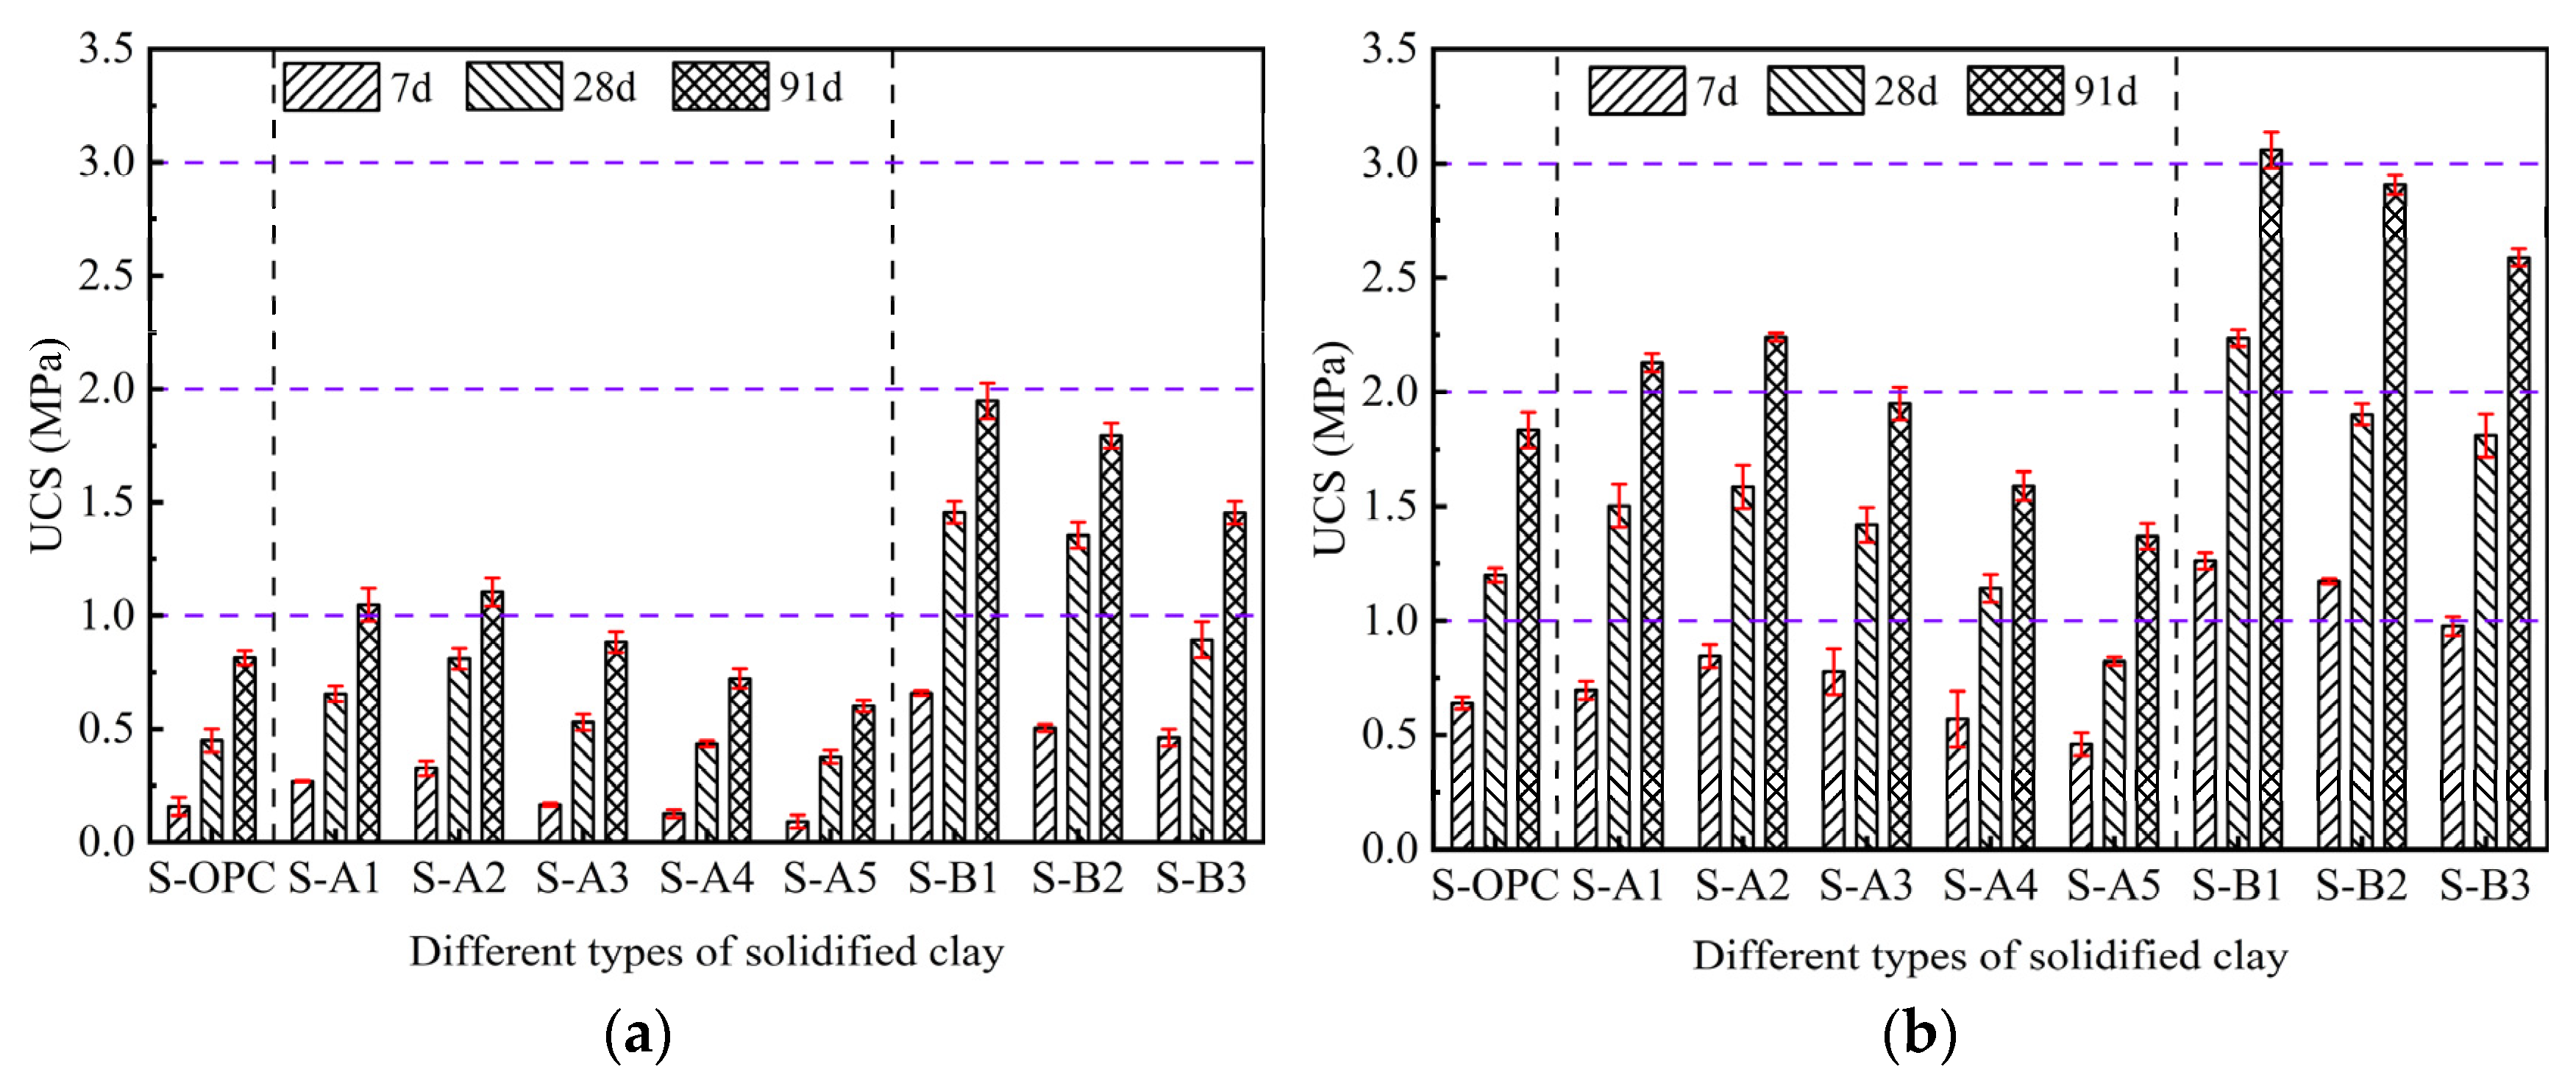
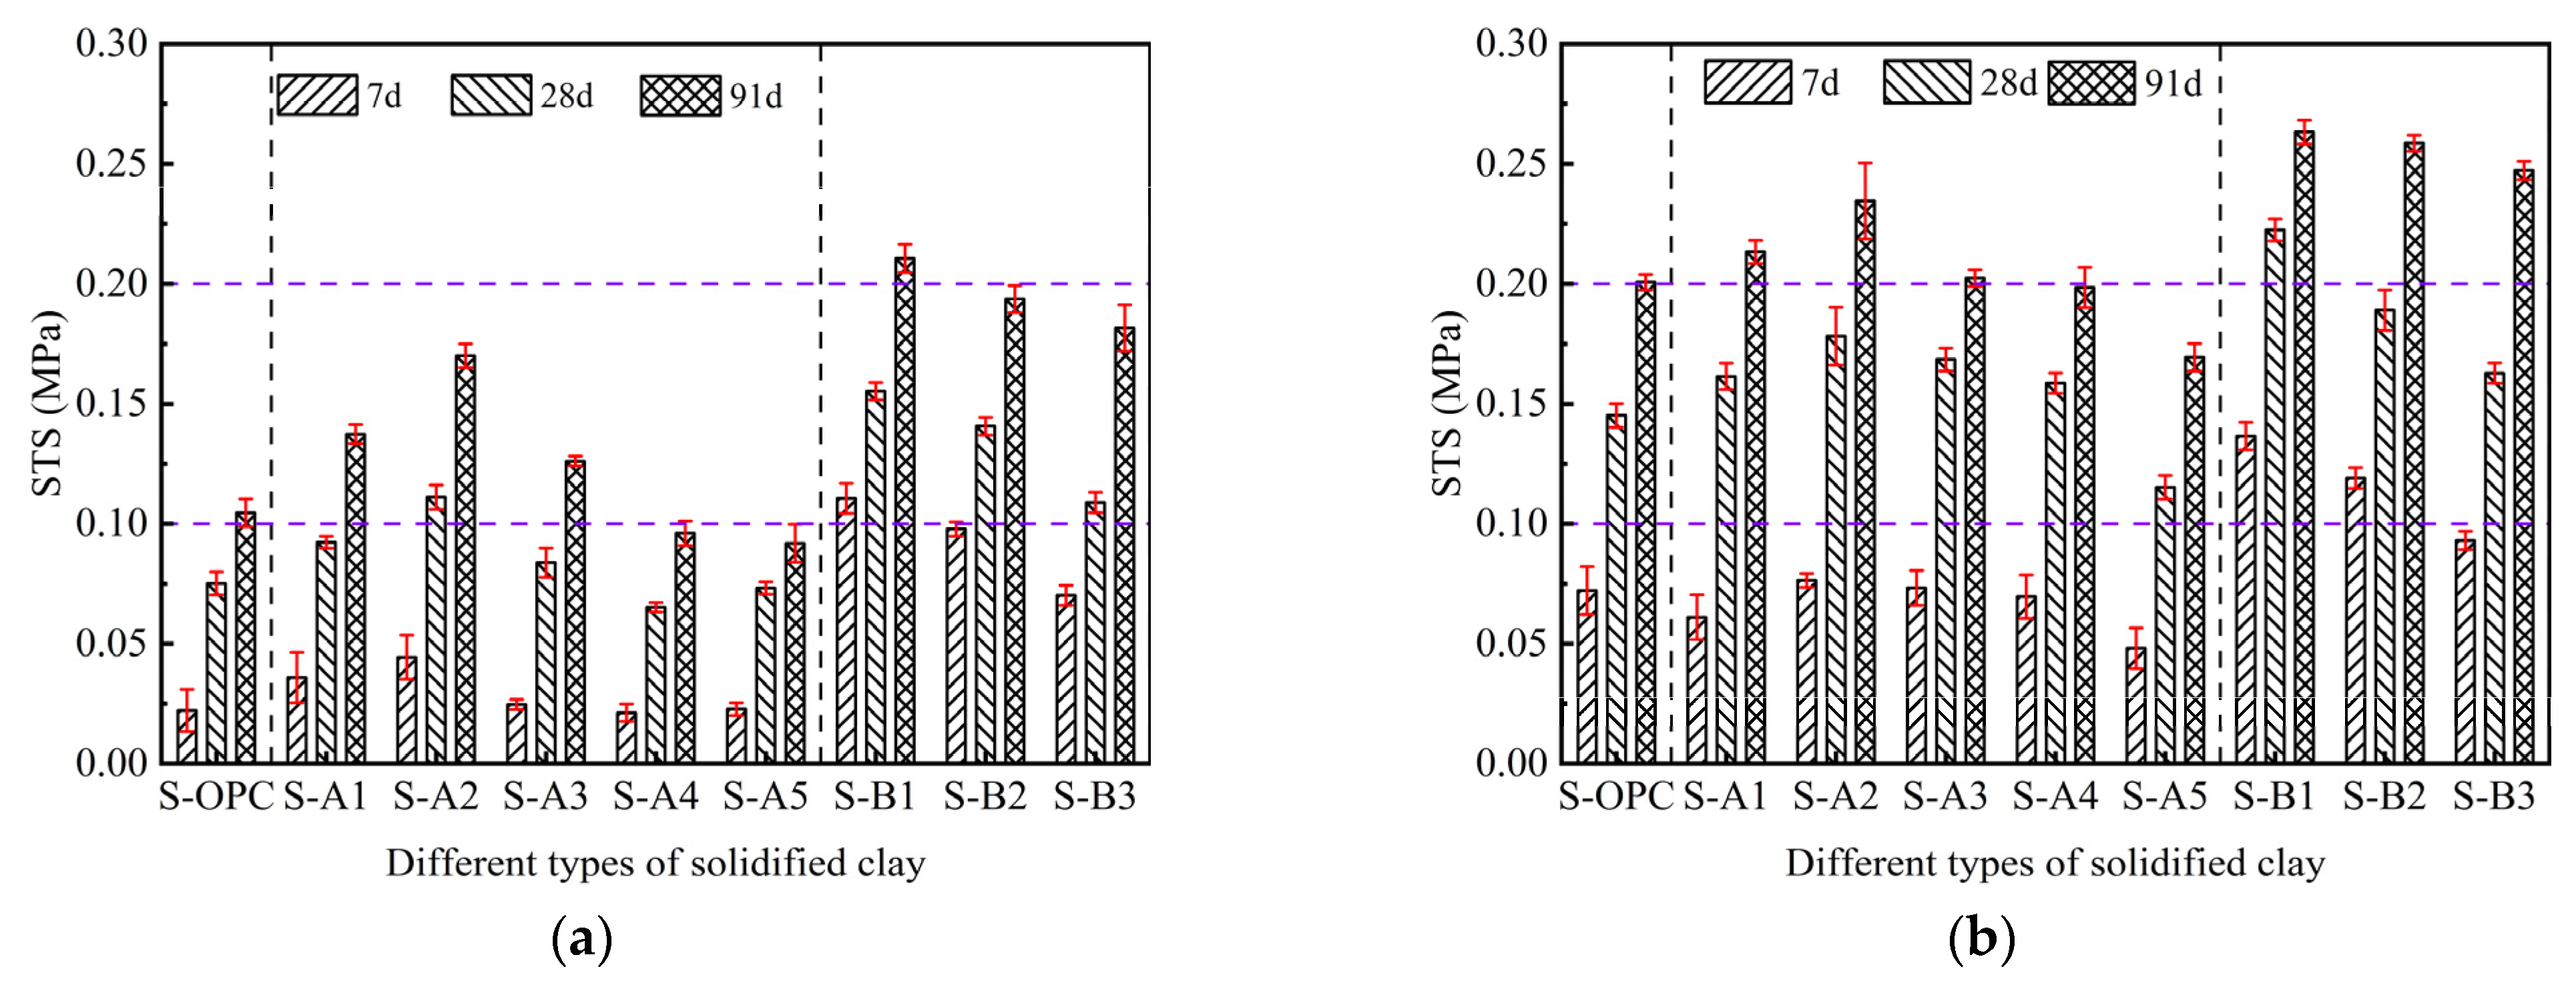
3.1. UCS and STS of Solidified Clay
3.2. Durability of Solidified Clay
3.2.1. Dry–Wet Cycle of Solidified Clay
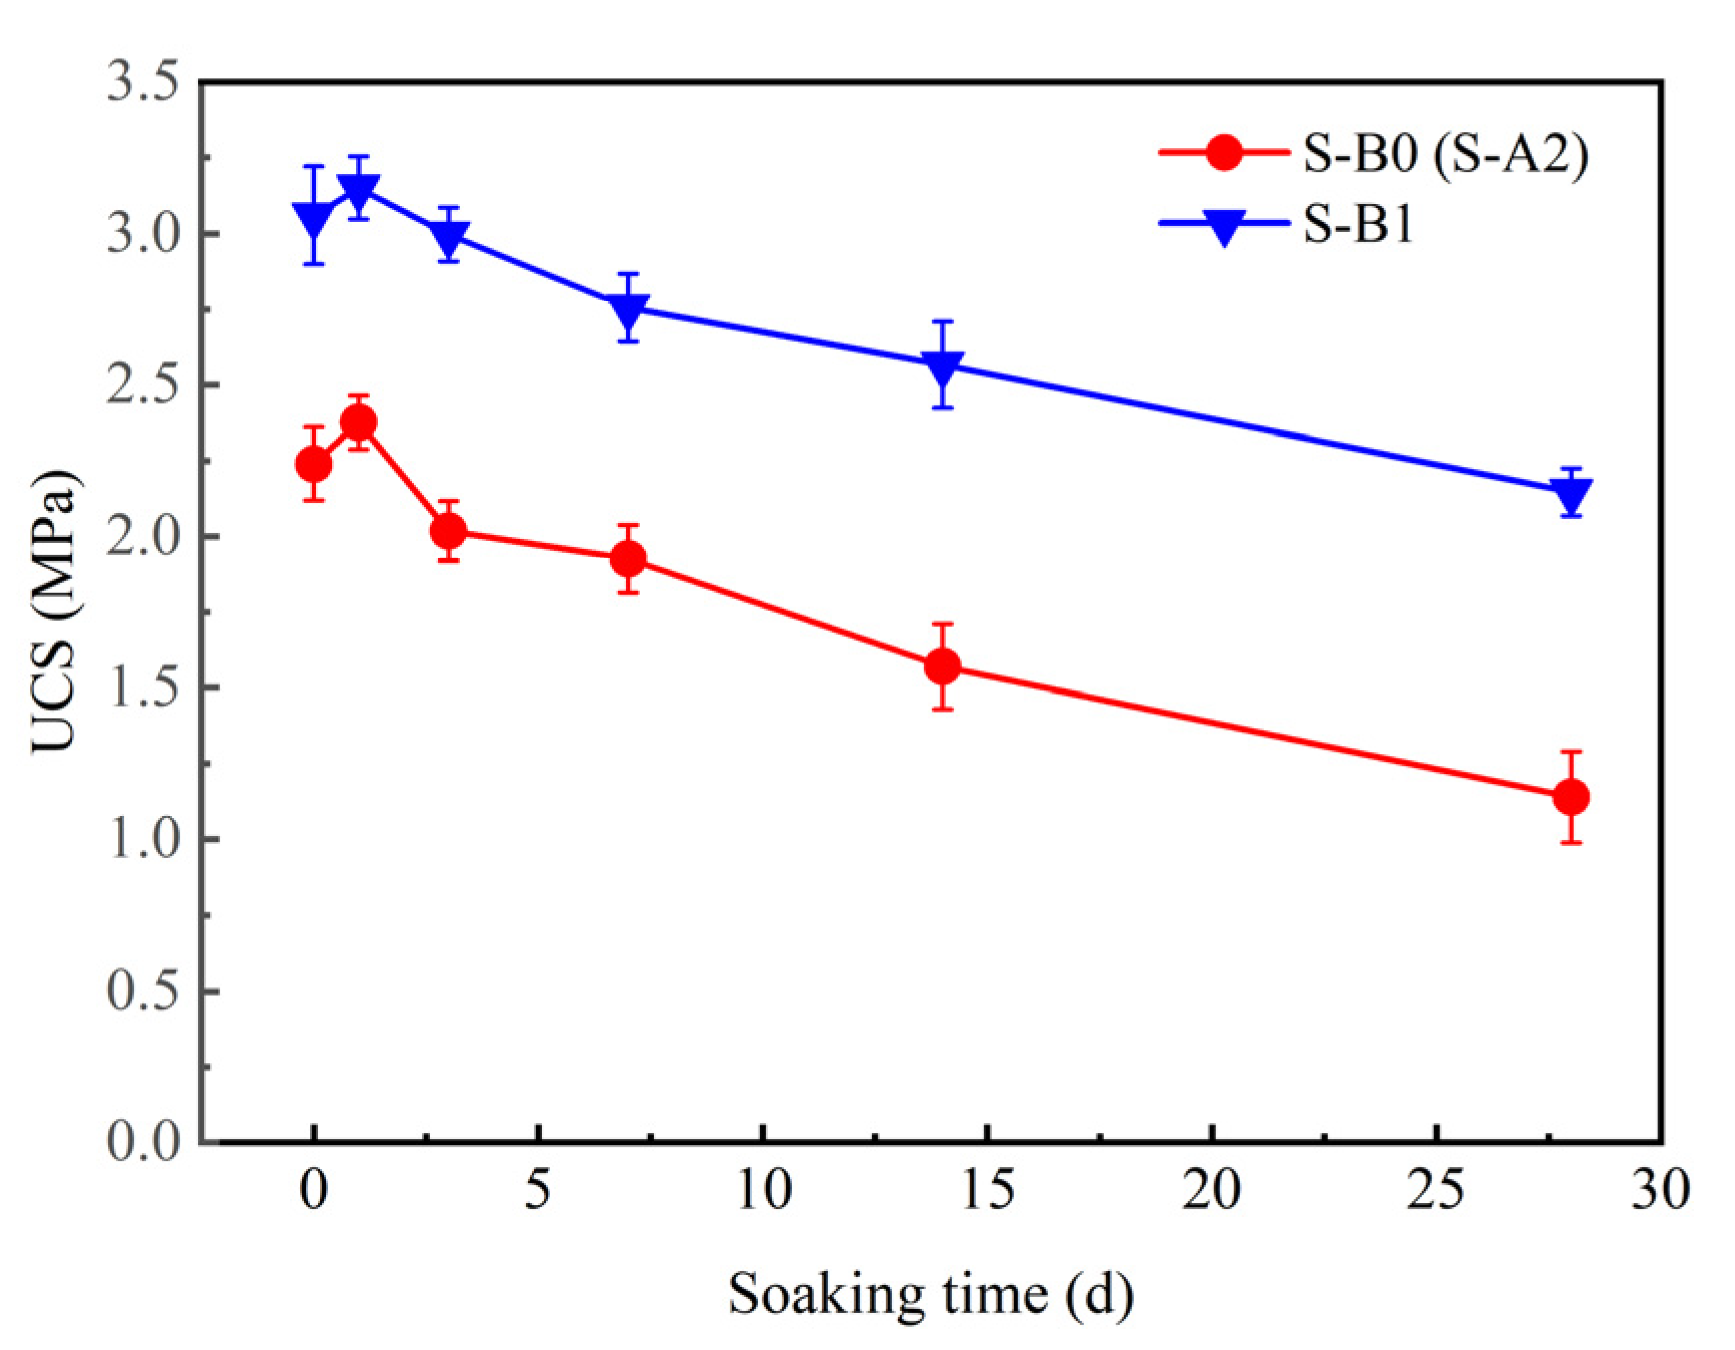
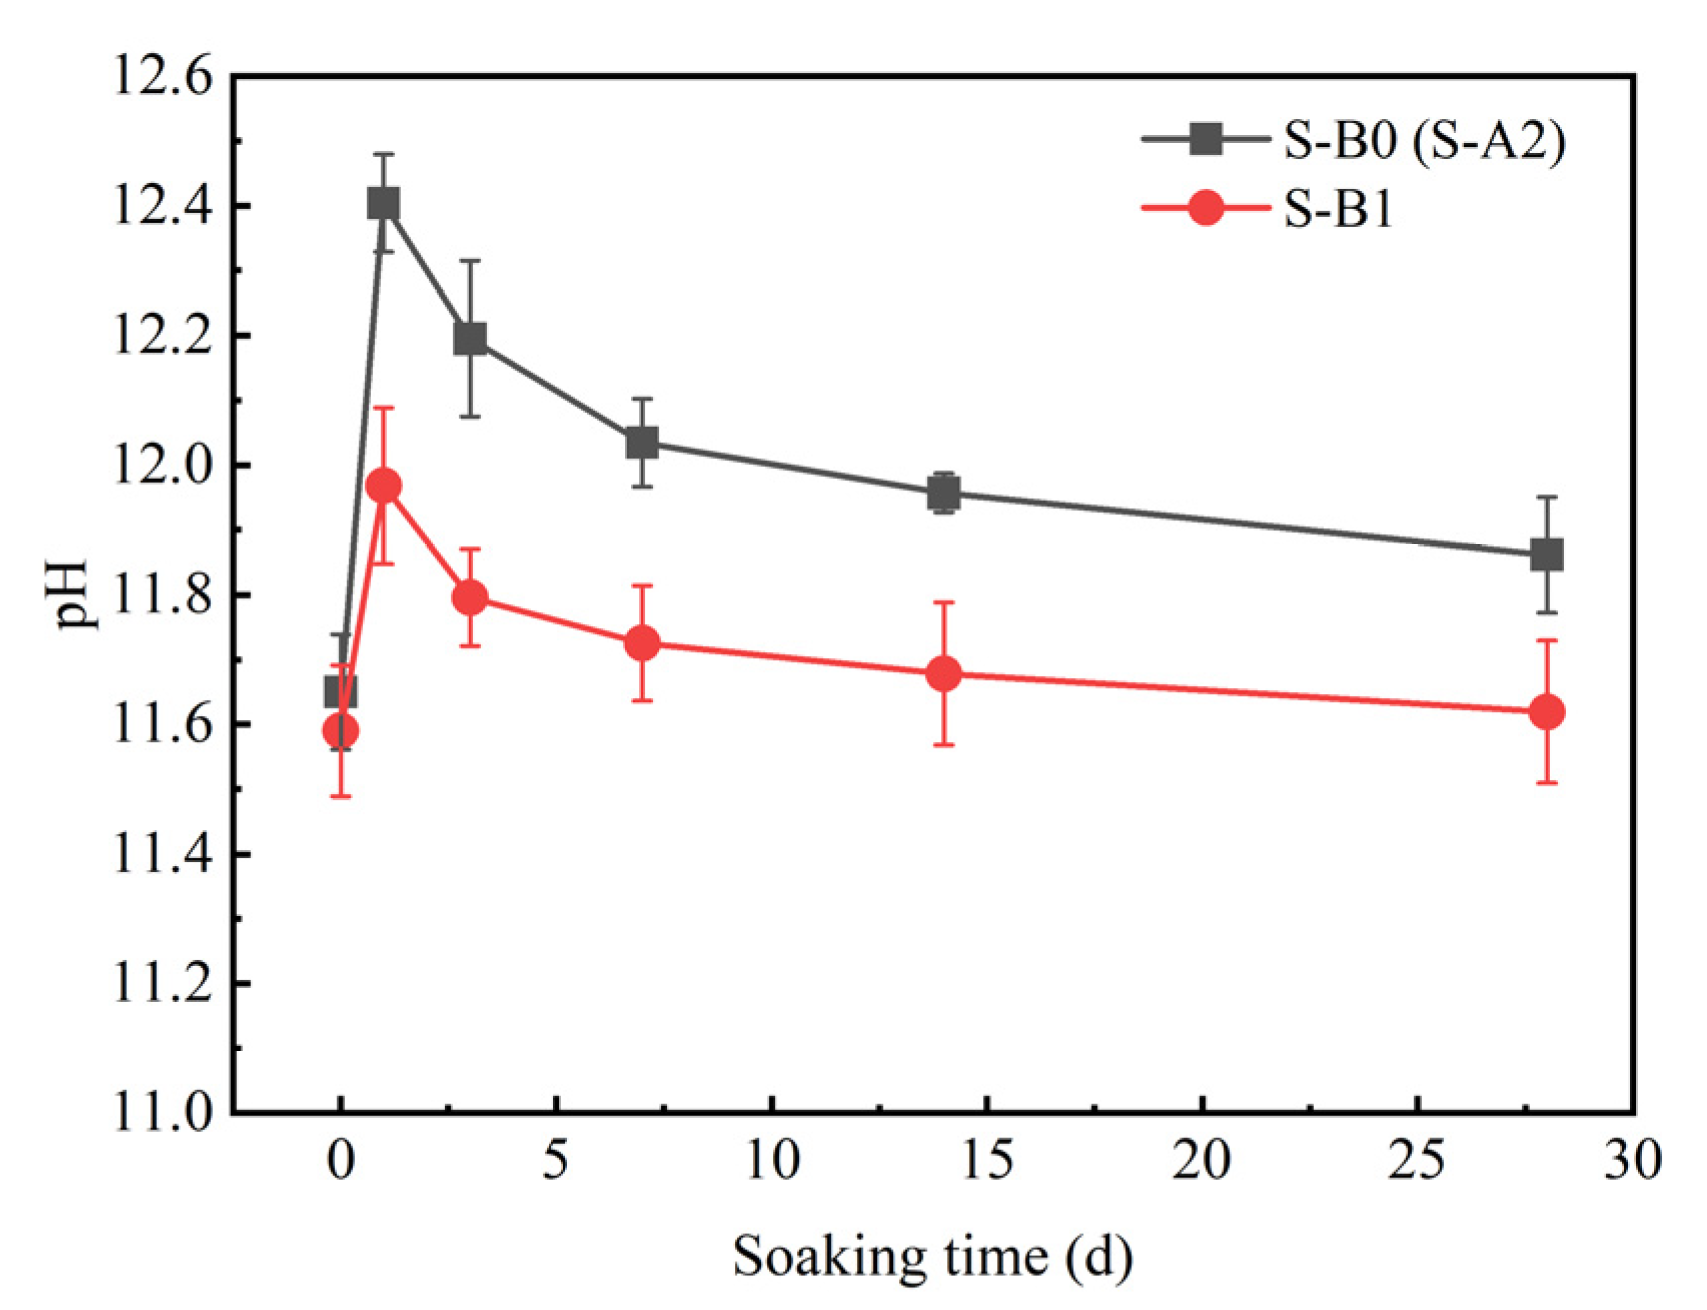
3.2.2. Sulfate Attack Resistance of Solidified Clay
4. Microscopic Results
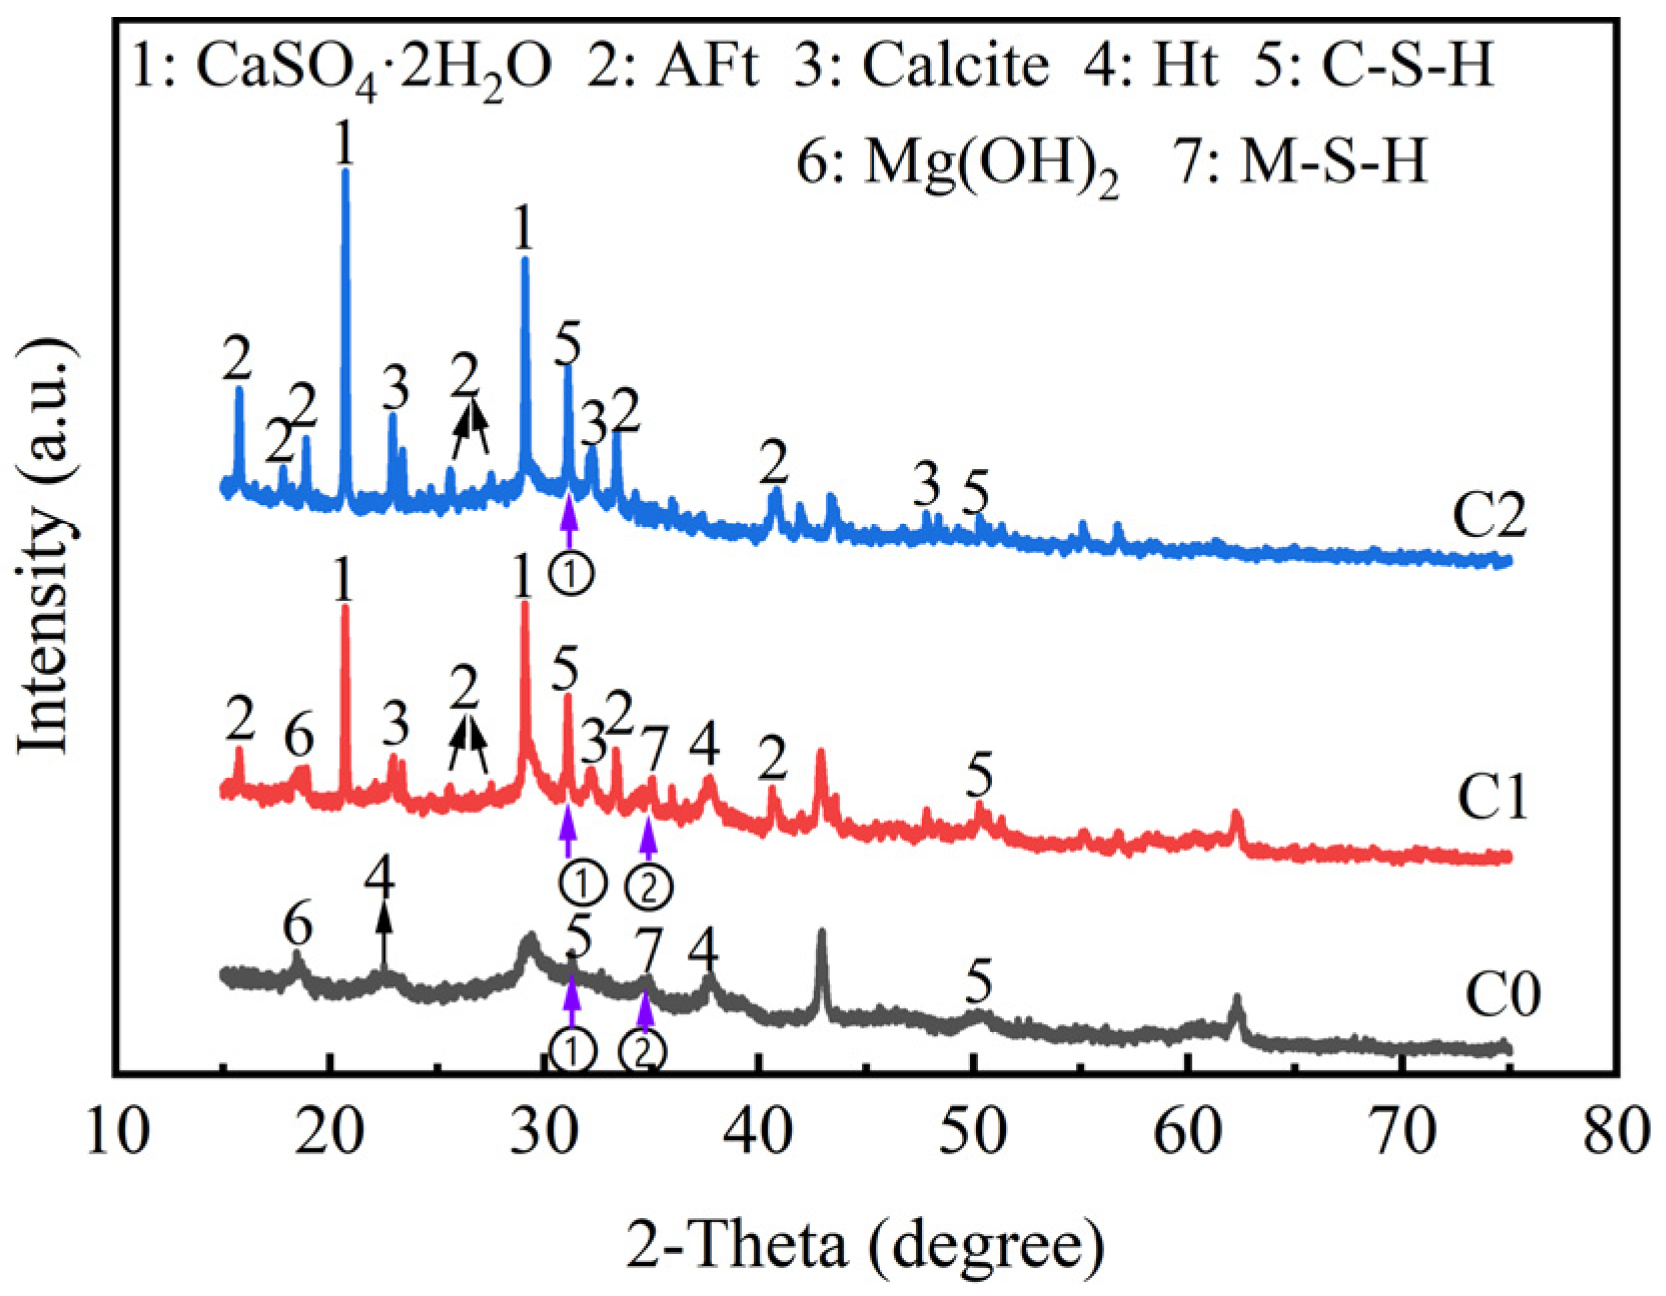
4.1. XRD of Binder Materials
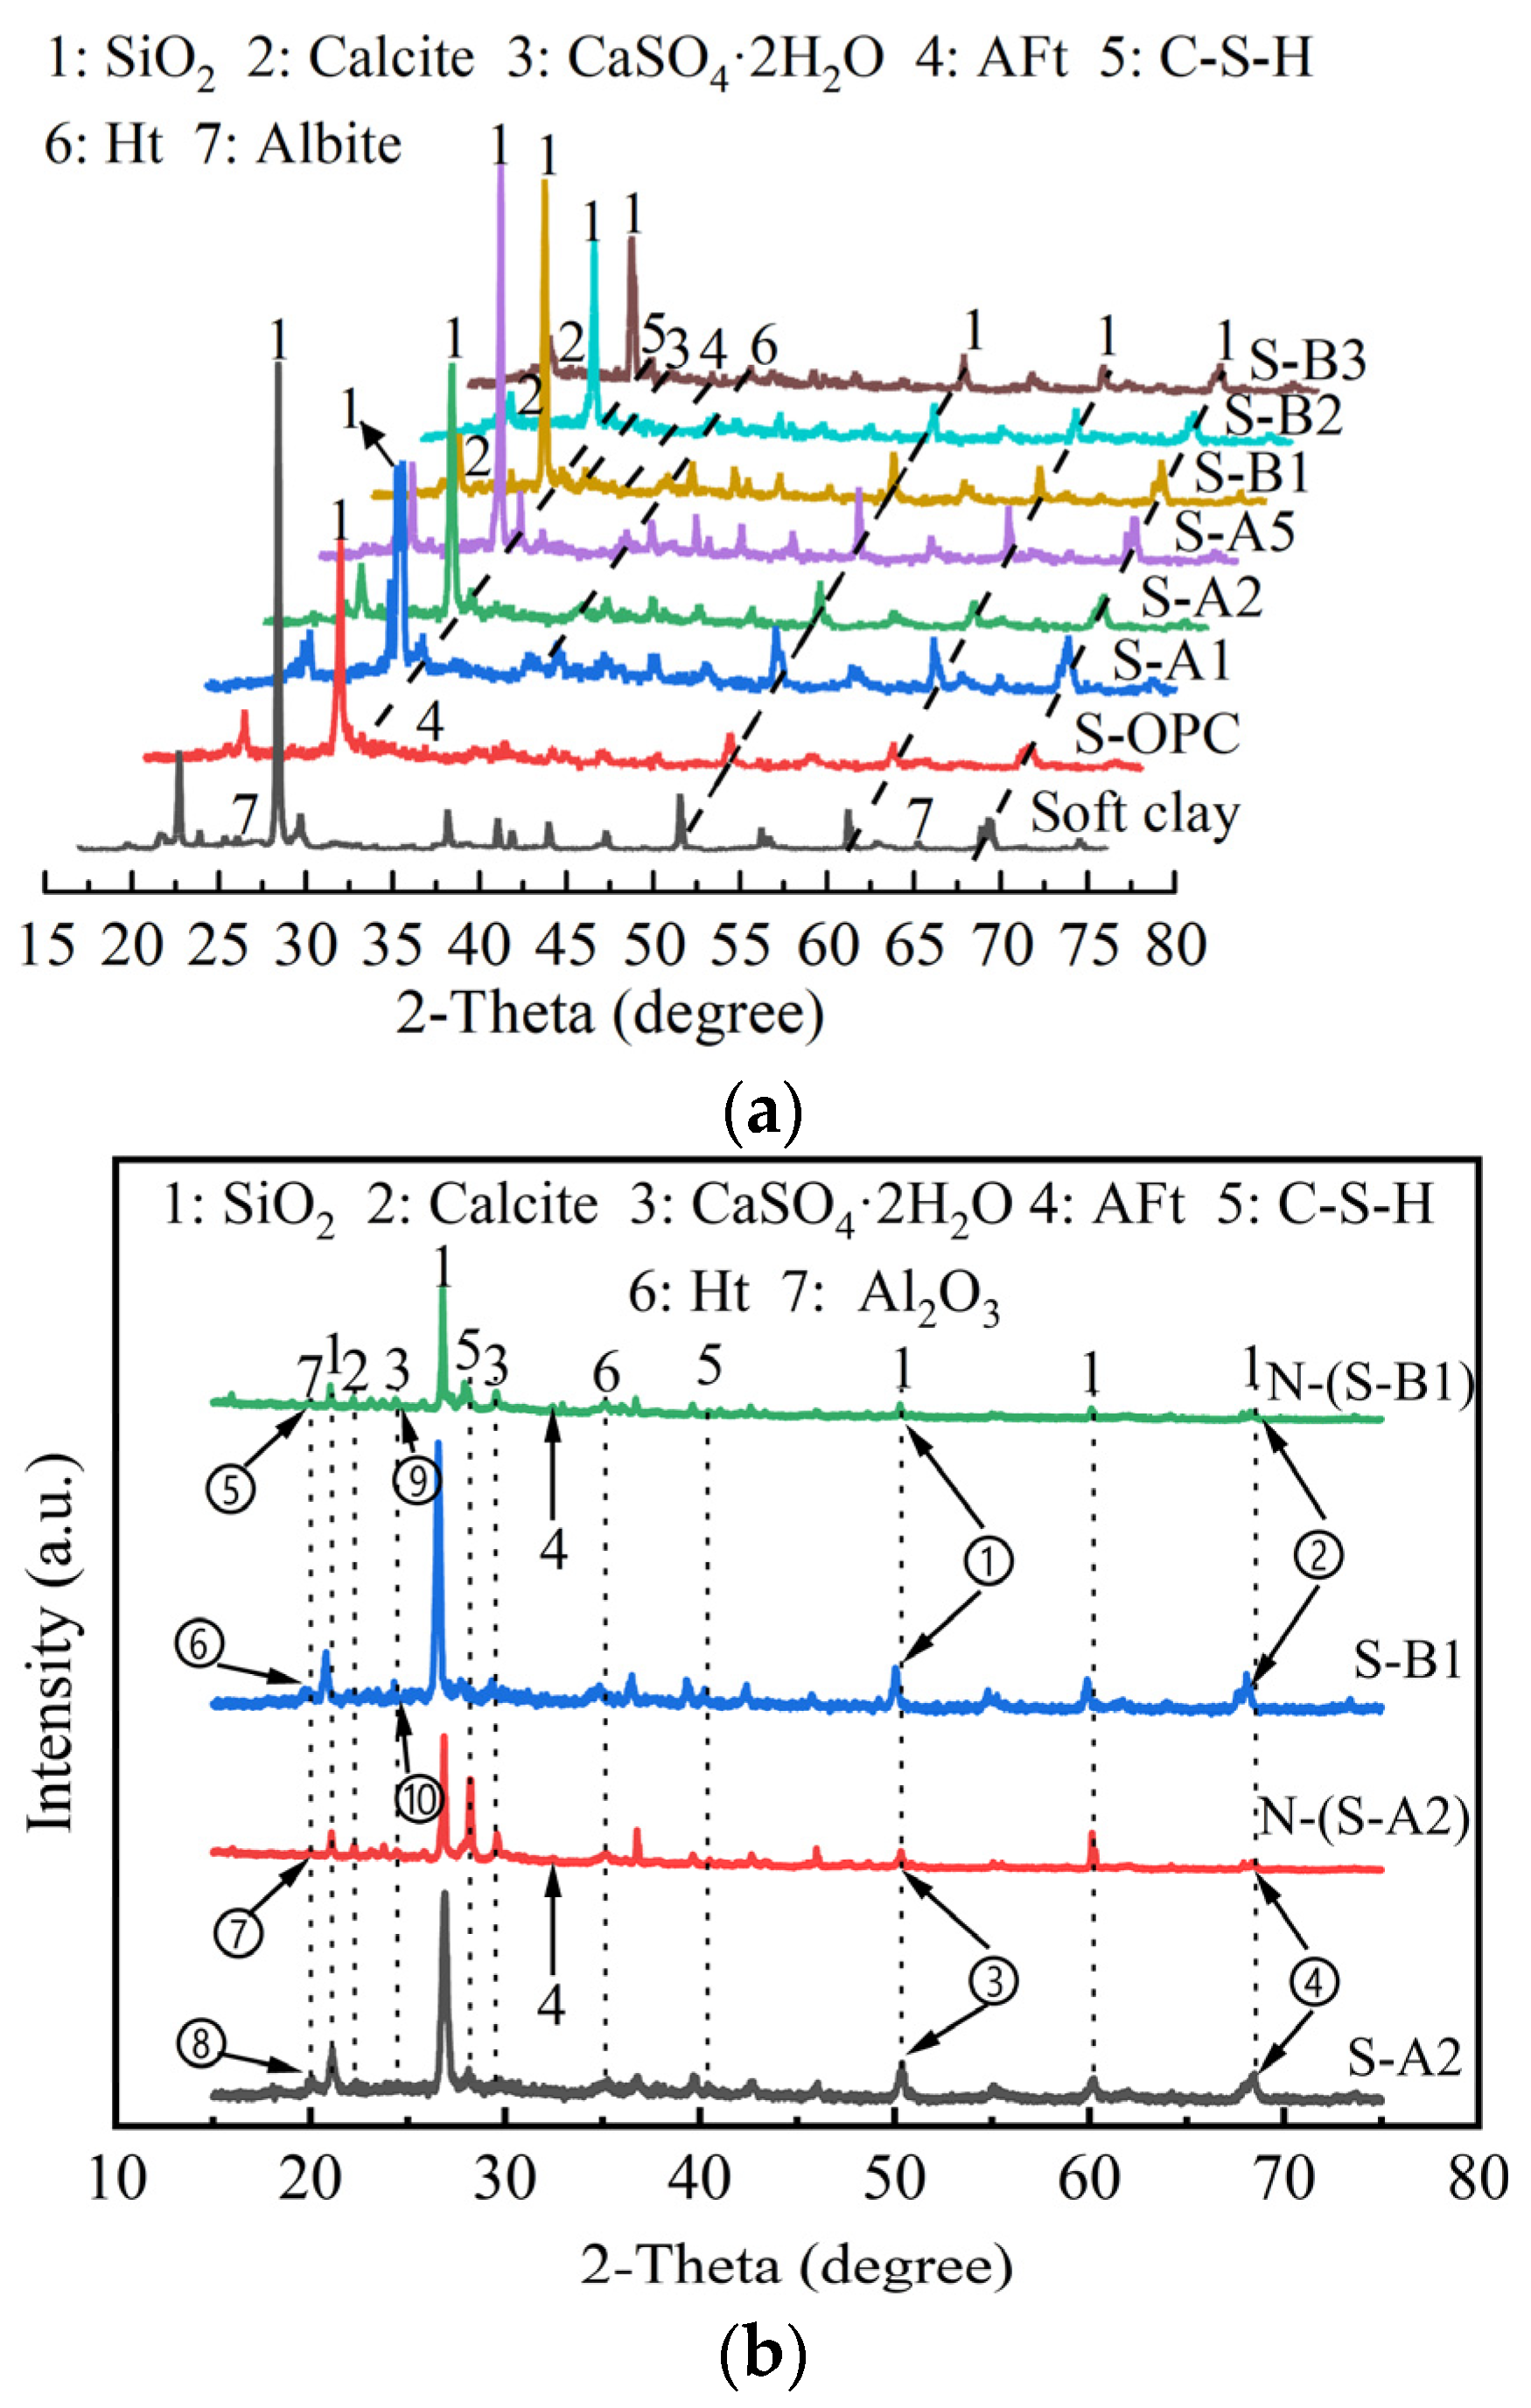
4.2. XRD of Solidified Clay
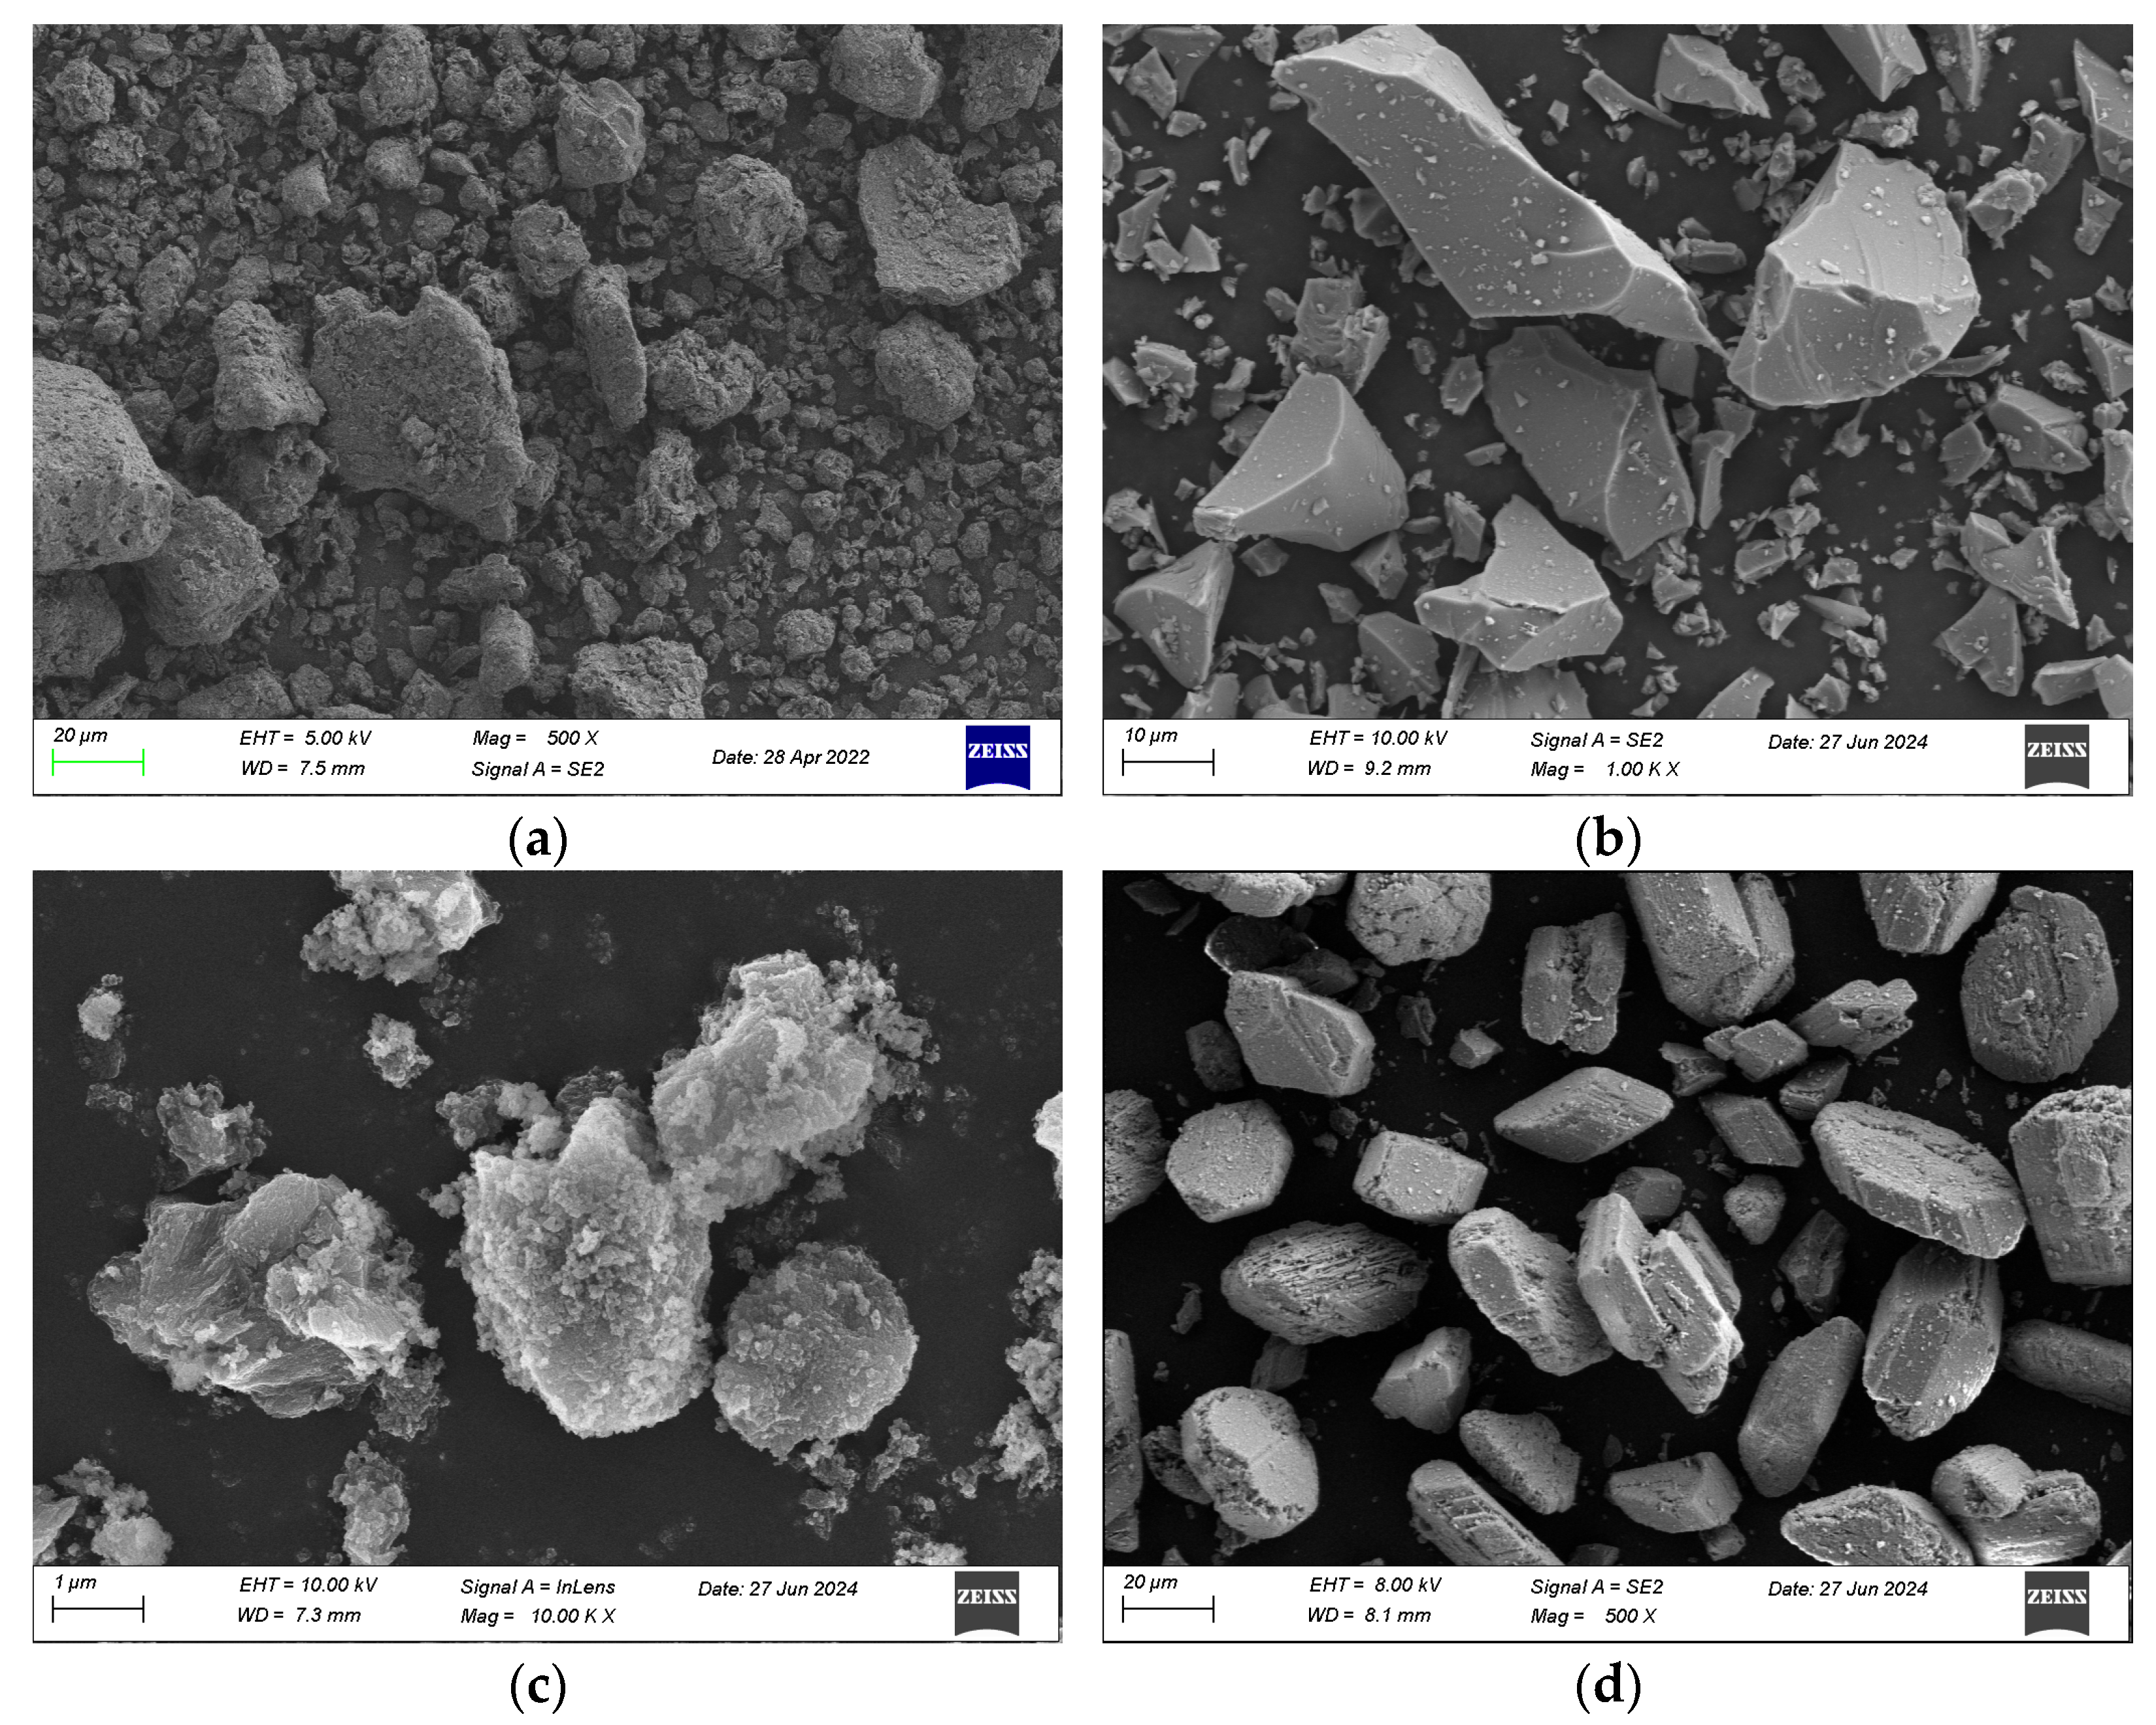
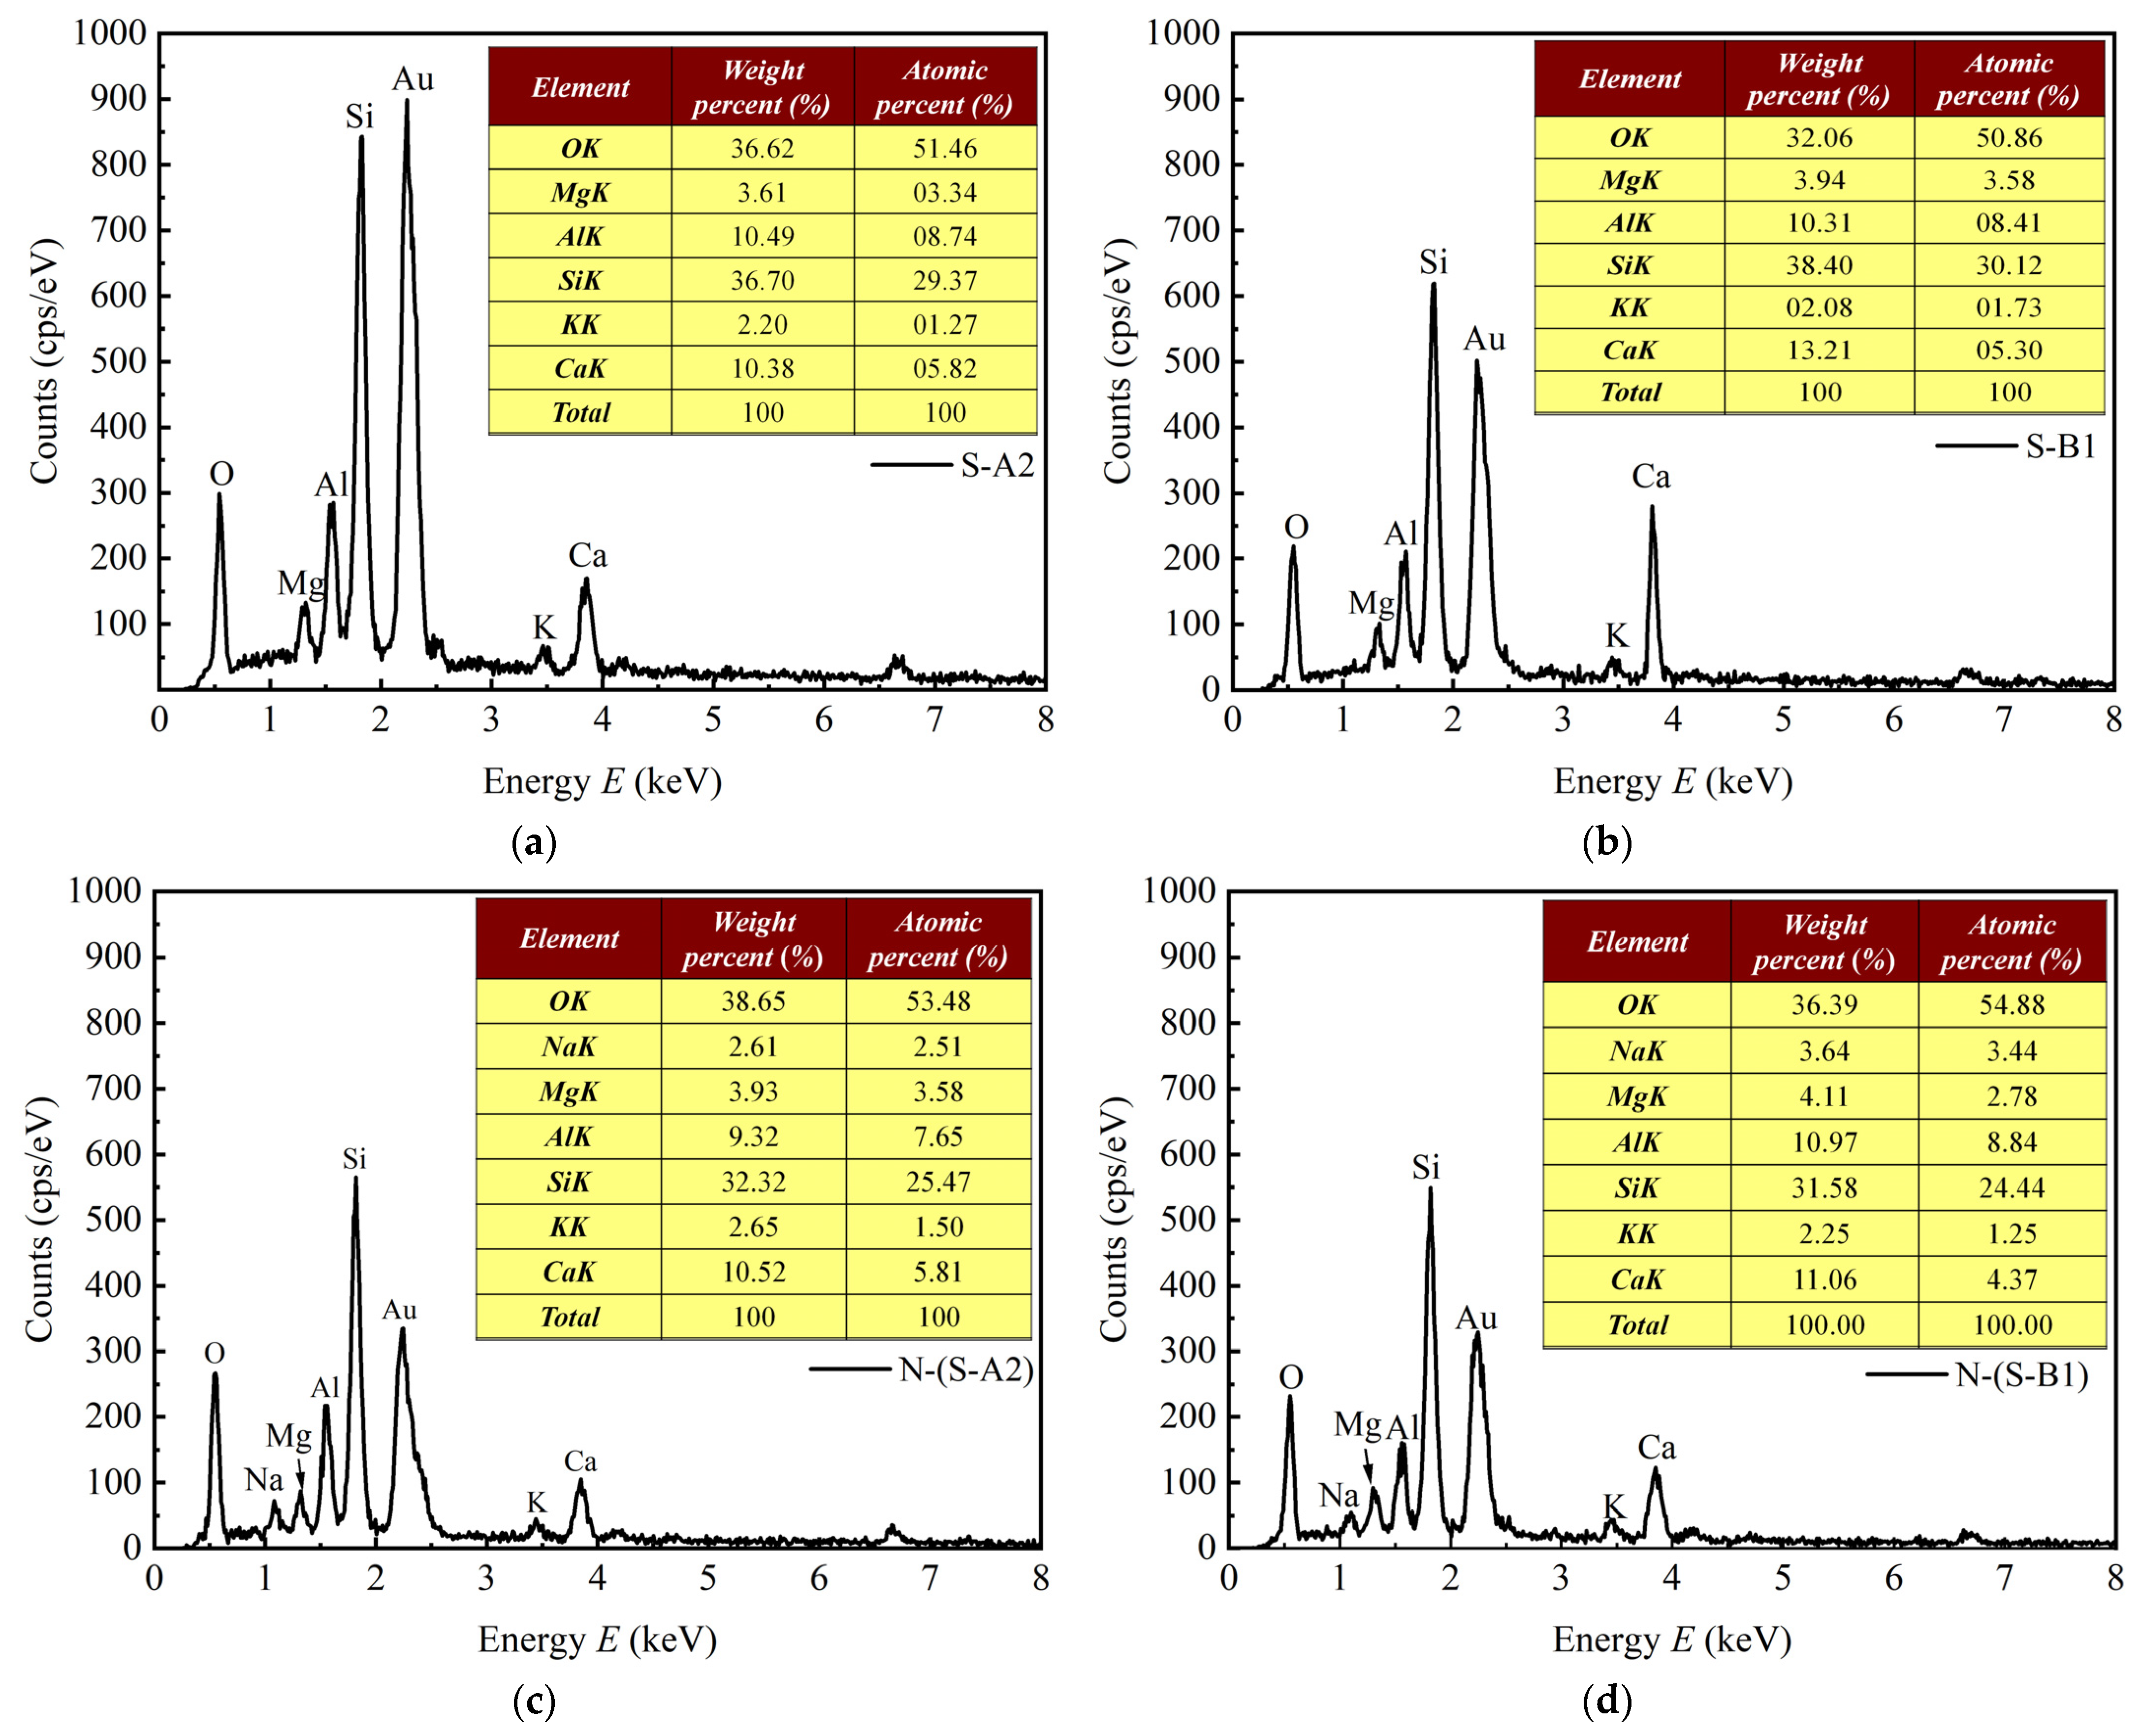
4.3. SEM and EDS of Solidified Clay
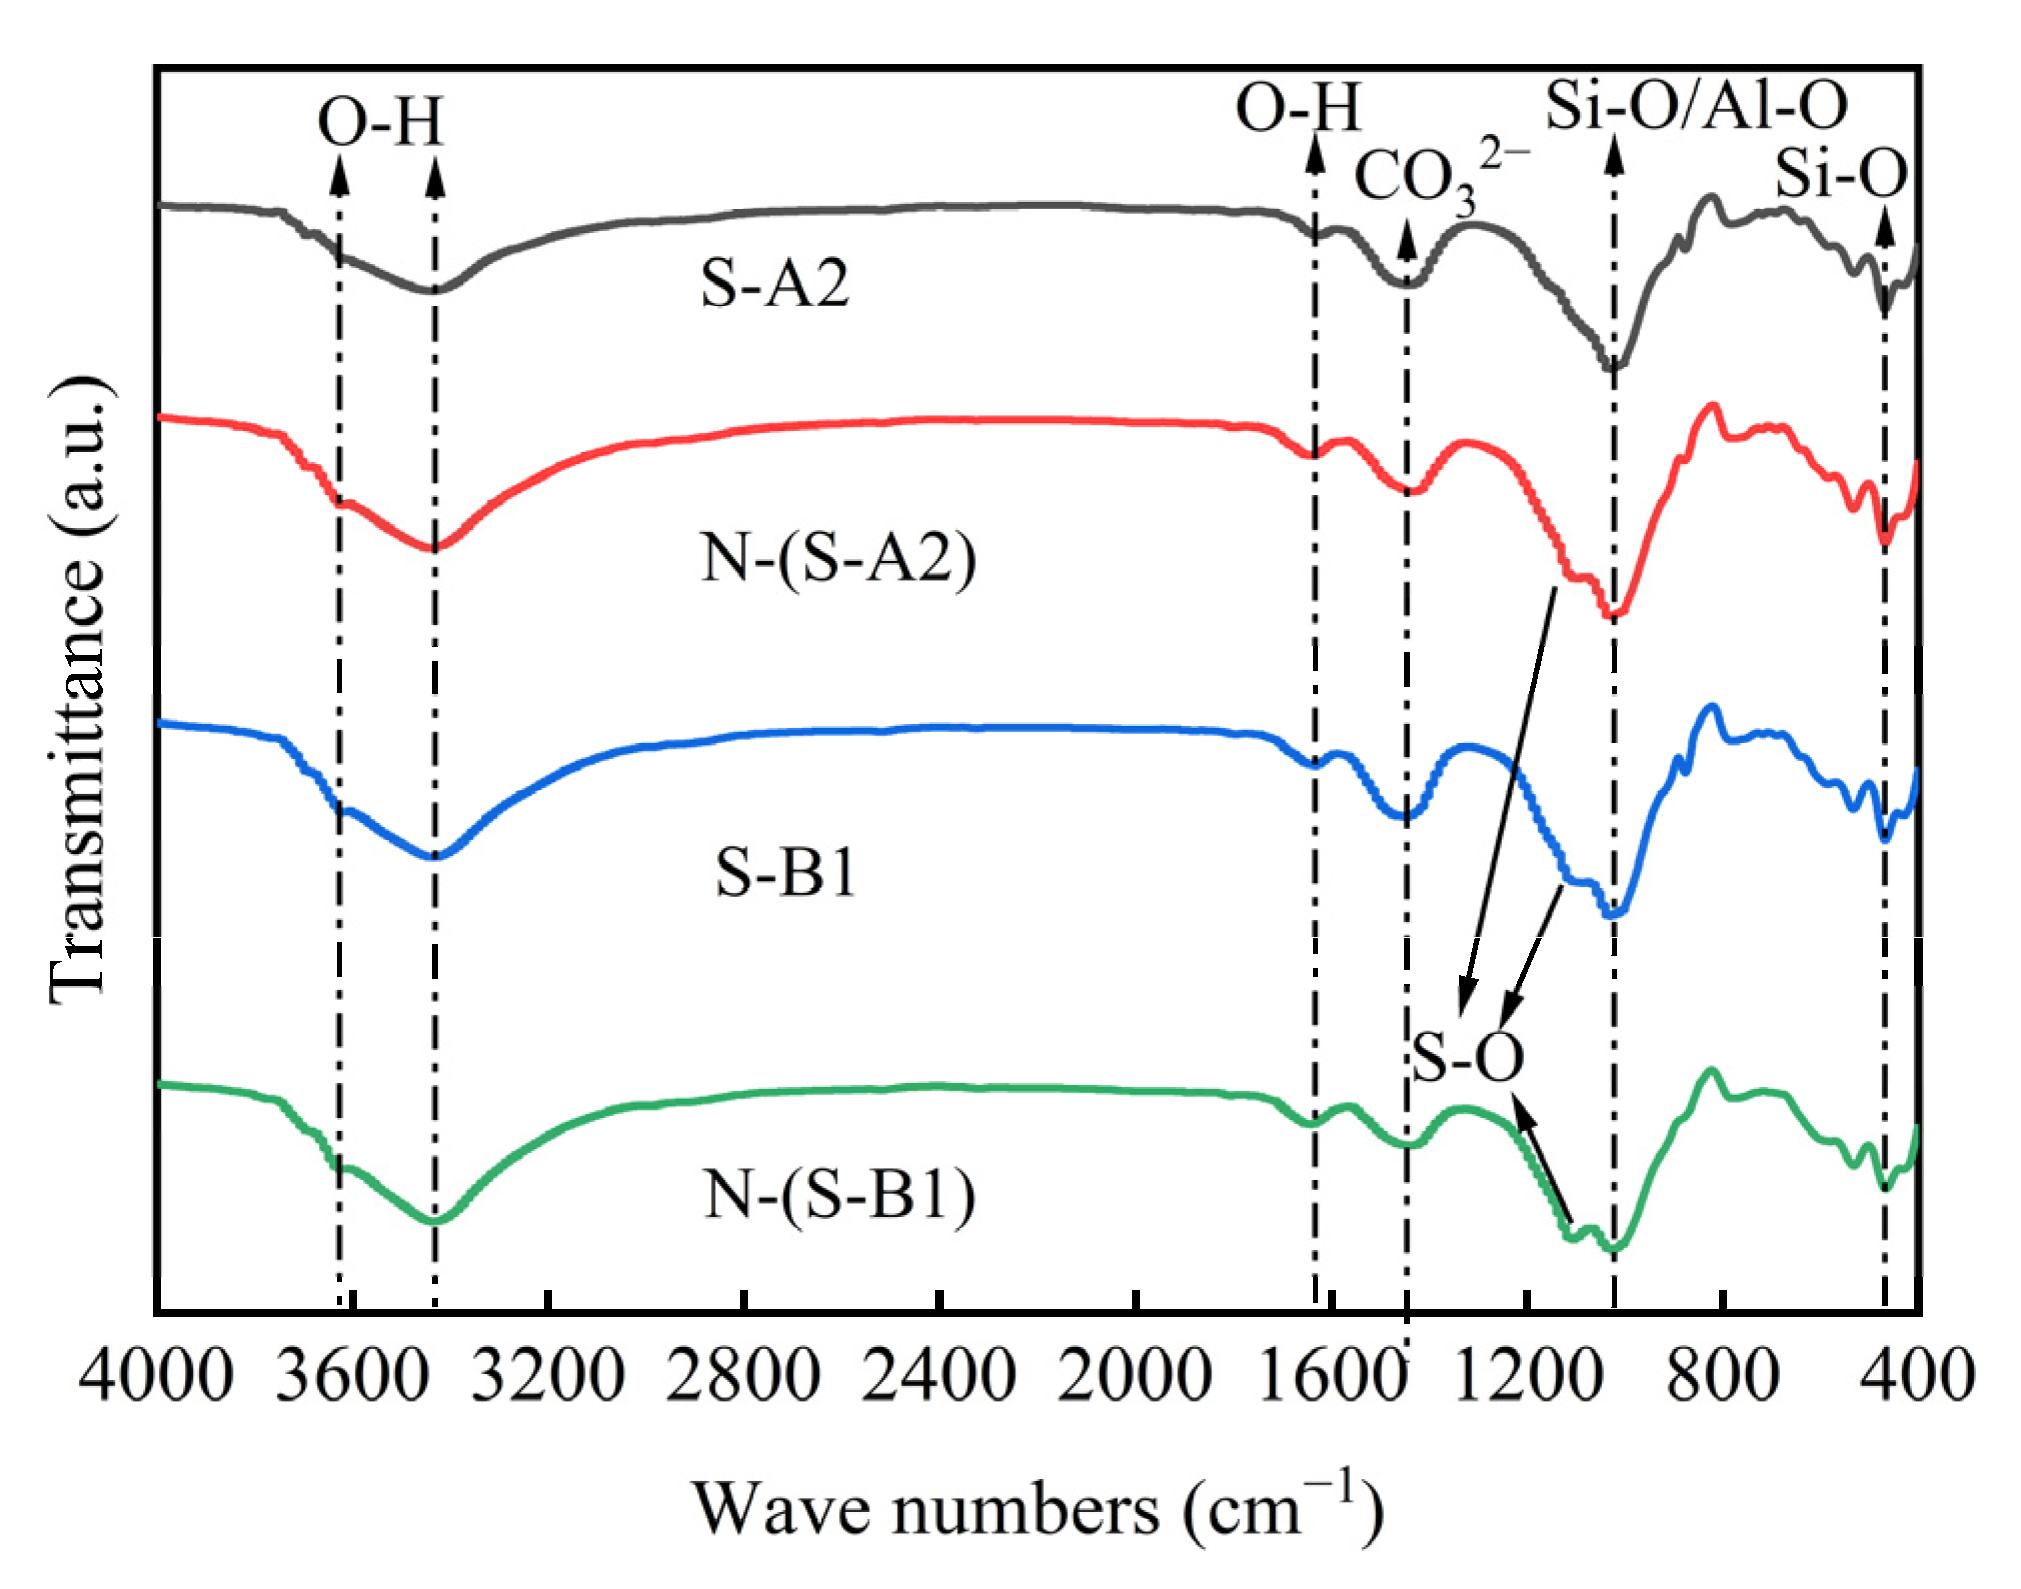
4.4. FTIR of Solidified Clay
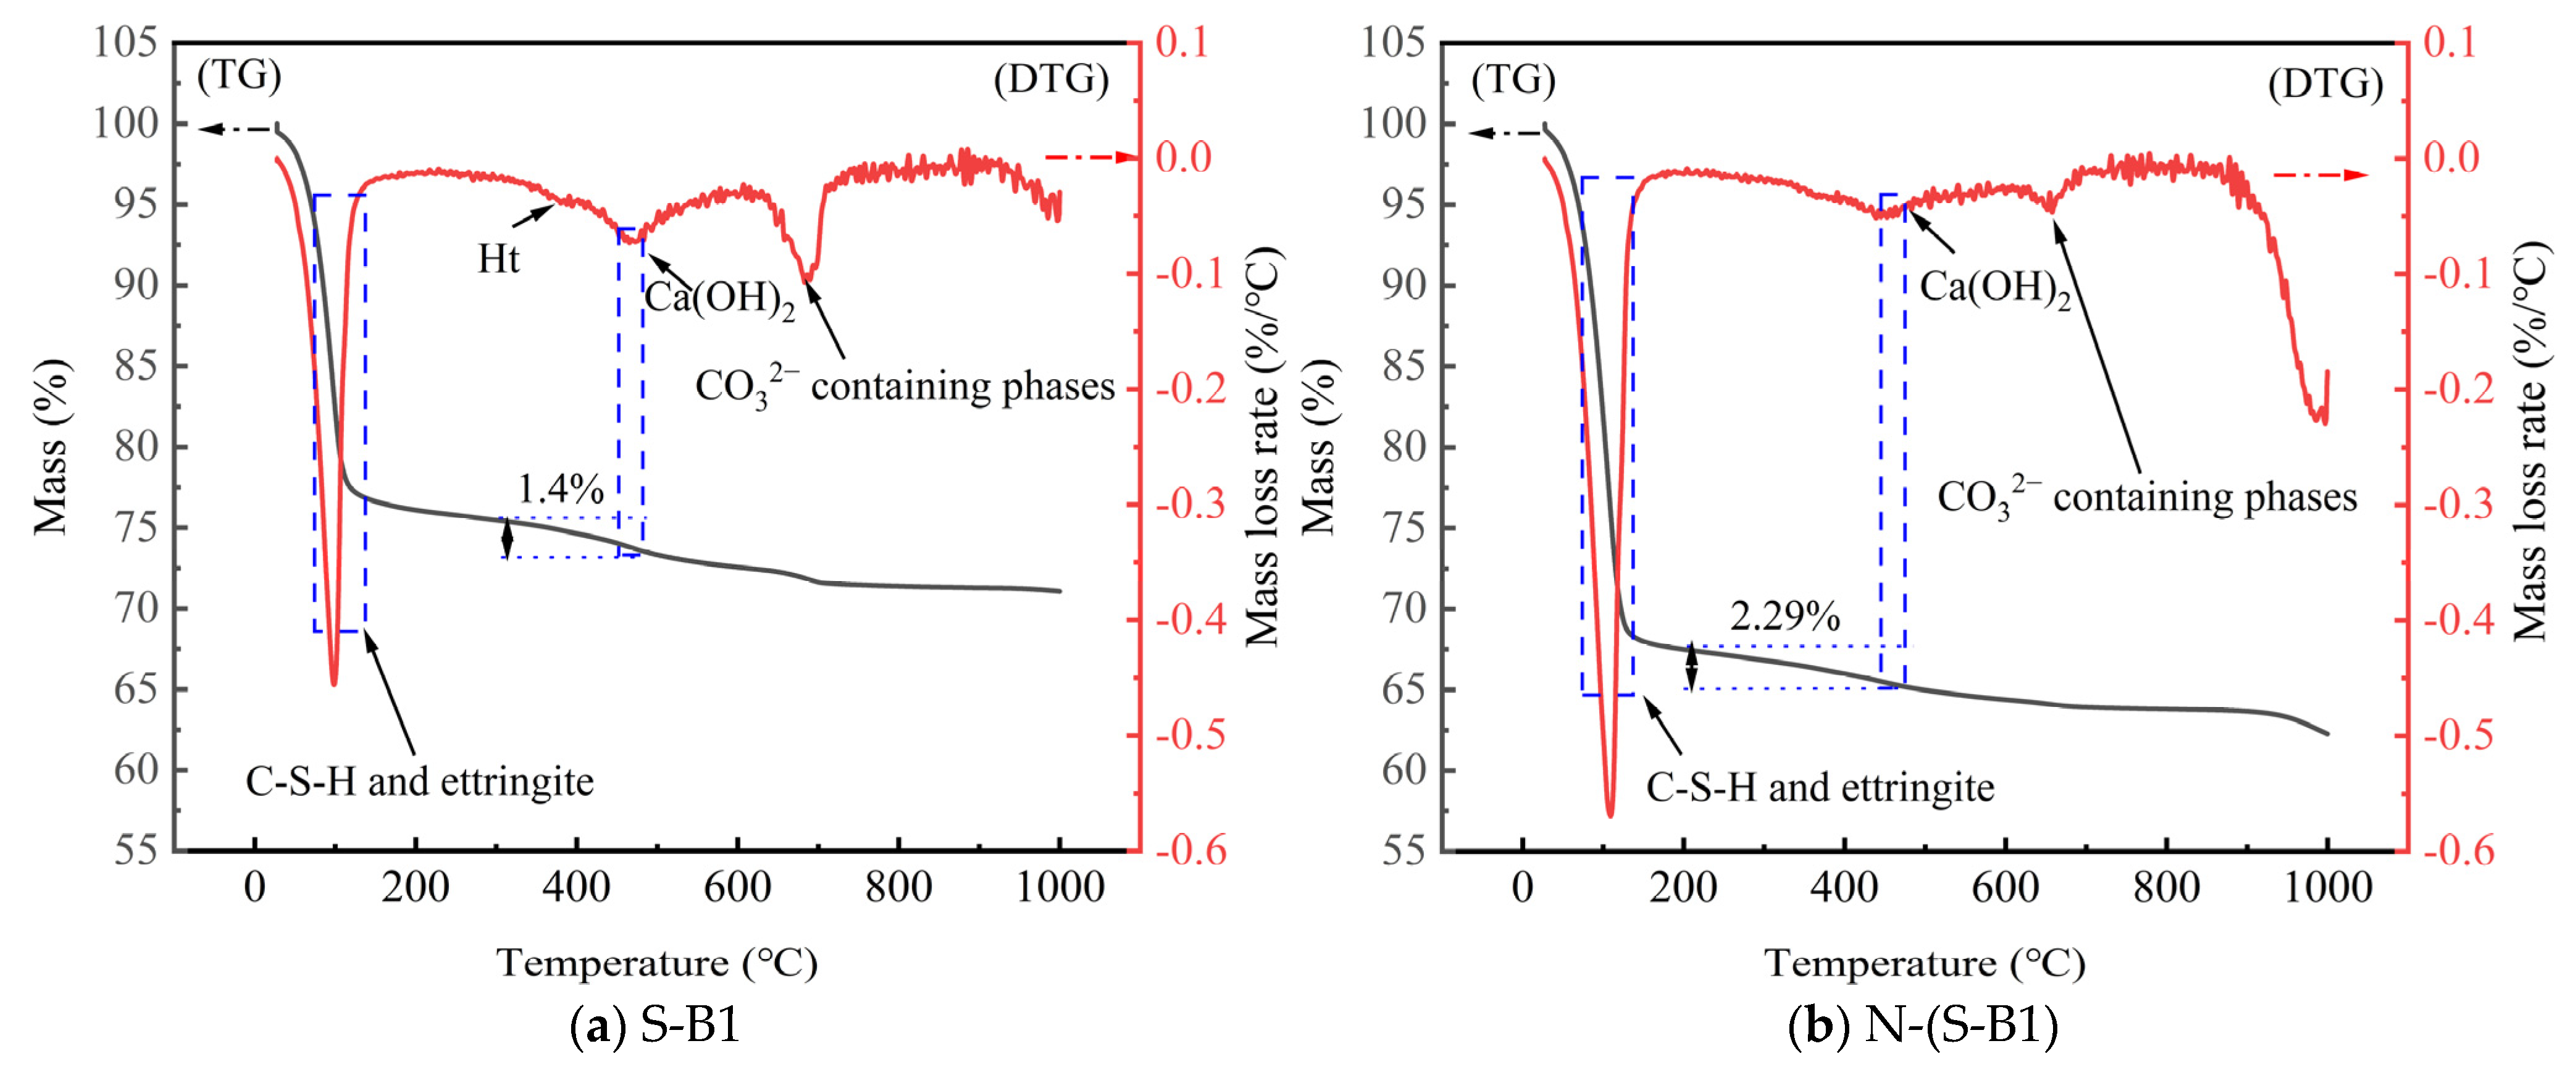
4.5. TGA of Solidified Clay
5. Conclusions
Author Contributions
Funding
Institutional Review Board Statement
Informed Consent Statement
Data Availability Statement
Conflicts of Interest
References
- Wang, D.; Zentar, R.; Abriak, N. Durability and swelling of solidified/stabilized dredged marine soils with class-f fly ash, cement, and lime. J. Mater. Civ. Eng. 2018, 30, 04018013. [Google Scholar] [CrossRef]
- Min, F.; Ma, J.; Zhang, N.; Song, H.; Du, J.; Wang, D. Experimental study on lime-treated waste soil based on water transfer mechanism. KSCE J. Civ. Eng. 2021, 25, 1645–1652. [Google Scholar] [CrossRef]
- Miura, N.; Horpibulsuk, S.; Nagaraj, T. Engineering behavior of cement stabilized clay at high water content. Soils Found. 2001, 41, 33–45. [Google Scholar] [CrossRef]
- Lorenzo, G.A.; Bergado, D.T. Fundamental parameters of cement-admixed clay—New approach. J. Geotech. Geoenviron. Eng. 2004, 130, 1042–1050. [Google Scholar] [CrossRef]
- Tang, Y.X.; Miyazaki, Y.; Tsuchida, T. Practices of reused dredgings by cement treatment. Soils Found. 2001, 41, 129–143. [Google Scholar] [CrossRef]
- Dubois, V.; Abriak, N.E.; Zentar, R.; Ballivy, G. The use of marine sediments as a pavement base material. Waste Manag. 2009, 29, 774–782. [Google Scholar] [CrossRef] [PubMed]
- Chiu, C.F.; Zhu, W.; Zhang, C.L. Yielding and shear behaviour of cement-treated dredged materials. Eng. Geol. 2009, 103, 1–12. [Google Scholar] [CrossRef]
- Zhu, J.F.; Tao, Y.L.; Yang, H.; Yang, H.; Pan, B.J. Investigation on the optimal formulation and mechanism of marine organic silt improved with magnesium-cement-based stabilizer. Constr. Build. Mater. 2022, 341, 127233.1–127233.12. [Google Scholar] [CrossRef]
- Du, Y.; Bo, Y.; Jin, F.; Liu, C.Y. Durability of reactive magnesia-activated slag-stabilized low plasticity clay subjected to drying-wetting cycle. Eur. J. Environ. Civ. Eng. 2016, 20, 215–230. [Google Scholar] [CrossRef]
- Pu, S.Y.; Zhu, Z.D.; Wang, H.R.; Song, W.L.; Wei, R.J. Mechanical characteristics and water stability of silt solidified by incorporating lime, lime and cement mixture, and SEU-2 binder. Constr. Build. Mater. 2019, 214, 111–120. [Google Scholar] [CrossRef]
- Cabrera-Luna, K.; Maldonado-Bandala, E.E.; Nieves-Mendoza, D.; Escalante García, J.I. Supersulfated binders based on volcanic raw material: Optimization, microstructure and reaction products. Constr. Build. Mater. 2018, 176, 145–155. [Google Scholar] [CrossRef]
- Cabrera Luna, K.; Maldonado Bandala, E.E.; Nieves Mendoza, D.; Castro Borges, P.; Perez Cortes, P.; Escalante García, J.I. Supersulfated cements based on pumice with quicklime, anhydrite and hemihydrate: Characterization and environmental impact. Cem. Concr. Compos. 2021, 124, 104236. [Google Scholar] [CrossRef]
- Wu, Q.; Xue, Q.; Yu, Z. Research status of super sulfate cement. J. Clean. Prod. 2021, 294, 126228.1–126228.11. [Google Scholar] [CrossRef]
- Liu, J.; An, S.; Zhang, Y. Mechanism of regulating the mechanical properties and paste structure of supersulfated cement through ultrafine iron tailings powder. Cem. Concr. Compos. 2023, 140, 105061. [Google Scholar] [CrossRef]
- Gruskovnjak, A.; Lothenbach, B.; Winnefeld, F. Hydration mechanisms of super sulphated slag cement. Cem. Concr. Res. 2008, 38, 983–992. [Google Scholar] [CrossRef]
- Masoudi, R.; Hooton, R.D. Examining the hydration mechanism of supersulfated cements made with high and low-alumina slags. Cem. Concr. Compos. 2019, 103, 193–203. [Google Scholar] [CrossRef]
- Singh, M.; Garg, M. Calcium sulfate hemihydrate activated low heat sulfate resistant cement. Constr. Build. Mater. 2002, 16, 181–186. [Google Scholar] [CrossRef]
- Gao, Y.X.; Yu, B.Y.; Xu, F.L. Effect of modified phosphogypsum on the mechanical properties of super sulphate cement. Appl. Mech. Mater. 2012, 161, 264–268. [Google Scholar] [CrossRef]
- Pang, M.; Sun, Z.; Huang, H. Compressive strength and durability of FGD gypsum-based mortars blended with ground granulated blast furnace slag. Materials 2020, 13, 3383. [Google Scholar] [CrossRef]
- Jin, F.; Gu, K.; Al-Tabbaa, A. Strength and hydration properties of reactive MgO-activated ground granulated blastfurnace slag paste. Cem. Concr. Compos. 2015, 57, 8–16. [Google Scholar] [CrossRef]
- Hwang, C.L.; Vo, D.H.; Tran, V.A.; Yehualaw, M.D. Effect of high MgO content on the performance of alkali-activated fine slag under water and air curing conditions. Constr. Build. Mater. 2018, 186, 503–513. [Google Scholar] [CrossRef]
- Huang, X.; Li, J.S.; Guo, M.Z.; Xue, Q.; Du, Y.J.; Wan, Y.; Liu, L.; Poon, C.S. Using MgO activated slag and calcium bentonite slurry to produce a novel vertical barrier material: Performances and mechanisms. Constr. Build. Mater. 2021, 291, 123365. [Google Scholar] [CrossRef]
- Krivenko, P.; Drochytka, R.; Gelevera, A.; Kavalerova, E. Mechanism of preventing the alkali–aggregate reaction in alkali activated cement concretes. Cem. Concr. Compos. 2014, 45, 157–165. [Google Scholar] [CrossRef]
- Maghsoodloorad, H.; Allahverdi, A. Efflorescence formation and control in alkali-activated phosphorus slag cement. Int. J. Civ. Eng. 2016, 14, 425–438. [Google Scholar] [CrossRef]
- Habert, G.; Lacaillerie, J.; Roussel, N. An environmental evaluation of geopolymer based concrete production: Reviewing current research trends. J. Clean. Prod. 2011, 19, 1229–1238. [Google Scholar] [CrossRef]
- Jin, F. Activation of ground granulated blast furnace slag by using calcined dolomite. Constr. Build. Mater. 2014, 68, 252–258. [Google Scholar] [CrossRef]
- Zentar, R.; Wang, D.X.; Abriak, N.E.; Benzerzour, M.; Chen, W.Z. Utilization of siliceous-aluminous fly ash and cement for solidification of marine sediments. Constr. Build. Mater. 2012, 35, 856–863. [Google Scholar] [CrossRef]
- Li, L.; Shao, W.; Cetin, B. Effects of climatic factors on mechanical properties of cement and fiber reinforced clays. Geotech. Geol. Eng. 2015, 33, 537–548. [Google Scholar] [CrossRef]
- Qing, Y.; Du, C.; Zhang, J. Influence of silica fume and additives on unconfined compressive strength of cement-stabilized marine soft clay. J. Mater. Civ. Eng. 2020, 32, 04019346. [Google Scholar] [CrossRef]
- Kampala, A.; Jitsangiam, P.; Pimraksa, K.; Chindaprasirt, P. An investigation of sulfate effects on compaction characteristics and strength development of cement-treated sulfate bearing clay subgrade. Road Mater. Pavement Des. 2020, 22, 1–14. [Google Scholar] [CrossRef]
- Li, Q.; Chen, J.; Shi, Q.; Zhao, S.H. Macroscopic and microscopic mechanisms of cement-stabilized soft clay mixed with seawater by adding ultrafine silica fume. Adv. Mater. Sci. Eng. 2014, 2014, 1–12. [Google Scholar] [CrossRef]
- Elahi Md Manjur, A.; Shearer Christopher, R.; Naser, R.R.A.; Saha, A.K.; Khan Md, N.N.; Hossain Md, M.; Sarker, P.K. Improving the sulfate attack resistance of concrete by using supplementary cementitious materials (SCMs): A review. Constr. Build. Mater. 2021, 281, 122628.1–122628.16. [Google Scholar] [CrossRef]
- Santhanam, M.; Cohen, M.D.; Olek, J. Sulfate attack research-whither now? Cem. Concr. Res. 2001, 31, 845–851. [Google Scholar] [CrossRef]
- Beddoe, R.E.; Dorner, H.W. Modelling acid attack on concrete: Part I. The essential mechanisms. Cem. Concr. Res. 2005, 35, 2333–2339. [Google Scholar] [CrossRef]
- ASTM D854-14; Standard Test Methods for Specific Gravity of Soil Solids by Water Pycnometer. ASTM International: West Conshohocken, PA, USA, 2014. [CrossRef]
- ASTM D2487-17e1; Standard Practice for Classification of Soils for Engineering Purposes (Unified Soil Classification System). ASTM International: West Conshohocken, PA, USA, 2017. [CrossRef]
- ASTM D4318-17e1; Standard Test Methods for Liquid Limit, Plastic Limit, and Plasticity Index of Soils. ASTM International: West Conshohocken, PA, USA, 2017. [CrossRef]
- ASTM D2974-14; Standard Test Methods for Moisture, Ash, and Organic Matter of Peat and Other Organic Soils. ASTM International: West Conshohocken, PA, USA, 2014. [CrossRef]
- GB175; Common Portland Cement, General Administration of Quality Supervision. Inspection and Quarantine of the People’s Republic of China and Standardization Administration of the People’s Republic of China: Beijing, China, 2023.
- GB/T 18046-2017; Ground Granulated Blast Furnace Slag Used for Cement, Mortar and Concrete. Standardization Administration of the People’s Republic of China: Beijing, China, 2017.
- Preetham, H.K.; Nayak, S. Geotechnical investigations on marine clay stabilized using granulated blast furnace slag and cement. Int. J. Geosynth. Ground Eng. 2019, 5, 28. [Google Scholar] [CrossRef]
- Wang, D.X.; Wang, H.W.; Wang, R.H. Micro-mechanisms of dredged sludge solidified with reactive MgO-fly ash. J. Rock Mech. Eng. 2019, 38, 3717–3725. [Google Scholar] [CrossRef]
- JTG 3441; Test Methods of the Materials Stabilized with Inorganic Binders for Highway Engineering. Ministry of Transport of the People’s Republic of China: Beijing, China, 2024.
- ASTM D4843-88; Standard Test Method for Wetting and Drying Test of Solid Wastes. ASTM International: West Conshohocken, PA, USA, 2016.
- Rajasekaran, G. Sulphate attack and ettringite formation in the lime and cement stabilized marine clays. Ocean Eng. 2005, 32, 1133–1159. [Google Scholar] [CrossRef]
- Al-Amoudi, O.S.B. Attack on plain and blended cements exposed to aggressive sulfate environments. Cem. Concr. Compos. 2012, 24, 305–316. [Google Scholar] [CrossRef]
- Wang, Q.; Long, J.; Xu, L.; Zhang, Z.; Lv, Y.; Yang, Z.H.; Wu, K. Experimental and modelling study on the deterioration of stabilized soft soil subjected to sulfate attack. Constr. Build. Mater. 2022, 346, 128436. [Google Scholar] [CrossRef]
- Higgins, D.D.; Crammond, N.J. Resistance of concrete containing ggbs to the thaumasite form of sulfate attack. Cem. Concr. Compos. 2003, 25, 921–929. [Google Scholar] [CrossRef]
- ASTM D4972-19; Standard Test Methods for pH of Soils. ASTM International: West Conshohocken, PA, USA, 2019. [CrossRef]
- Tran, K.Q.; Satomi, T.; Takahashi, H. Tensile behaviors of natural fiber and cement reinforced soil subjected to direct tensile test. J. Build. Eng. 2019, 24, 100748. [Google Scholar] [CrossRef]
- Tran, K.Q.; Satomi, T.; Takahashi, H. Improvement of mechanical behavior of cemented soil reinforced with waste cornsilk fibers. Constr. Build. Mater. 2018, 178, 204–210. [Google Scholar] [CrossRef]
- Dong, Y.; Wang, B.T. Test study on mechanical properties of the lime stabilized expansive soil under wet and dry cycle. Appl. Mech. Mater. 2012, 1801, 166–170. [Google Scholar] [CrossRef]
- Tan, Y.Z.; Ke, R.; Ming, H.J. Improving the durability of organic matter in cement-treated sludge using metakaolin and lime. Mar. Geores. Geotechnol. 2021, 39, 293–301. [Google Scholar] [CrossRef]
- Xu, H.; Wang, Q.; Zhou, W.; Li, M.; Cai, G. Study on compressive strength and microstructure of slag-calcium carbide residue solidified mud under wetting-drying cycles. Arab. J. Sci. Eng. 2022, 48, 5087–5096. [Google Scholar] [CrossRef]
- Shi, C.; Day, R.L. Pozzolanic reaction in the presence of chemical activators: Part II—Reaction products and mechanism. Cem. Concr. Res. 2000, 30, 607–613. [Google Scholar] [CrossRef]
- Yang, Z.; Gao, Y.; Mu, S.; Chang, H.; Sun, W.; Jiang, J. Improving the chloride binding capacity of cement paste by adding nano-Al2O3. Constr. Build. Mater. 2019, 195, 415–422. [Google Scholar] [CrossRef]
- Chappex, T.; Scrivener, K. Alkali fixation of C-S-H in blended cement pastes and its relation to alkali silica reaction. Cem. Concr. Res. 2012, 42, 1049–1054. [Google Scholar] [CrossRef]
- Zeng, L.L.; Bian, X.; Zhao, L.; Wang, Y.J.; Hong, Z.S. Effect of phosphogypsum on physiochemical and mechanical behaviour of cement stabilized dredged soil from Fuzhou, China. Geomech. Energy Environ. 2020, 2020, 100195. [Google Scholar] [CrossRef]
- Zhang, D.W.; Liu, Z.M.; Sun, X.; Cao, Z.Y. Laboratory tests on enhancing strength of cement stabilized organic soil with addition of phosphor gypsum and calcium aluminate cement. J. Southeast Univ. (Eng. Ed.) 2017, 33, 301–308. [Google Scholar] [CrossRef]
- Odler, I.; ColánSubauste, J. Investigations on cement expansion associated with ettringite formation. Cem. Concr. Res. 1999, 29, 731–735. [Google Scholar] [CrossRef]
- Tang, S.W.; Zhu, H.G.; Li, Z.J.; Chen, E.; Shao, H.Y. Hydration stage identification and phase transformation of calcium sulfoaluminate cement at early age. Constr. Build. Mater. 2014, 75, 11–18. [Google Scholar] [CrossRef]
- Perardt, M. Alkali activated cement made from blast furnace slag generated by charcoal: Resistance to attack by sodium and magnesium sulfates. Constr. Build. Mater. 2020, 238, 117710. [Google Scholar] [CrossRef]
- Damidot, D.; Glasser, F.P. Thermodynamic investigation of the CaO-Al2O3-CaSO4- H2O system at 50 °C and 85 °C. Cem. Concr. Res. 1992, 22, 1179–1191. [Google Scholar] [CrossRef]
- Gabrisová, A.; Havlica, J.; Sahu, S. Stability of calcium sulphoaluminate hydrates in water solutions with various pH values. Cem. Concr. Res. 1991, 21, 1023–1027. [Google Scholar] [CrossRef]
- Kishar, E.A. Hydration reaction of tricalciumaluminate in different systems. Cem. Concr. Res. 2005, 35, 1638–1640. [Google Scholar] [CrossRef]
- Li, J.S.; Zhang, W.; Huang, X.; Lang, L.; Poon, C.S.; Xue, Q. MgO-based supersulfated cement with different industrial by-product gypsum: Experiments and molecular dynamics simulation. Sci. Total Environ. 2024, 941, 173756. [Google Scholar] [CrossRef]
- Cabrera-Luna, K.; Perez-Cortes, P.; Garcia, J.I.E. Pumice-based supersulfated cements in mortars: Effects of pumice fineness and activator ratio on physical and environmental characteristics. Constr. Build. Mater. 2022, 342, 127947. [Google Scholar] [CrossRef]
- Pinto, S.R.; Luz, C.A.D.; Munhoz, G.S.; Medeiros-Junior, R.A. Durability of phosphogypsum-based supersulfated cement mortar against external attack by sodium and magnesium sulfate. Cem. Concr. Res. 2020, 136, 106172. [Google Scholar] [CrossRef]
- Brew, D.M.R.; Glasser, F.P. The magnesia-silica gel phase in slag cements: Alkali (K, Cs) sorption potential of synthetic gels. Cem. Concr. Res. 2005, 35, 77–83. [Google Scholar] [CrossRef]
- Haha, M.B.; Lothenbach, B.; Saout, G.L.; Winnefeld, F. Influence of slag chemistry on the hydration of alkali-activated blast-furnace slag-Part II: Effect of Al2O3. Cem. Concr. Res. 2012, 42, 74–83. [Google Scholar] [CrossRef]
- Wang, D.; Wang, H.; Larsson, S.; Benzerzour, M.; Maherzi, W.; Amar, M. Effect of basalt fiber inclusion on the mechanical properties and microstructure of cement-solidified kaolinite. Constr. Build. Mater. 2020, 241, 118085. [Google Scholar] [CrossRef]
- Sevgi, Ö.; Cemal, M. Sequential formation of natrolite-group zeolites in amygdules of basaltic lavas. Can. Miner. 2015, 53, 757–765. [Google Scholar] [CrossRef]
- García Lodeiro, I.; Macphee, D.E.; Palomo, A.; Fernández-Jiménez, A. Effect of alkalis on fresh C-S-H gels. FTIR analysis. Cem. Concr. Res. 2009, 39, 147–153. [Google Scholar] [CrossRef]
- Zhang, Z.; Zhu, Y.; Zhu, H.; Zhang, Y.; Provis, J.L.; Wang, H. Effect of drying procedures on pore structure and phase evolution of alkali-activated cements. Cem. Concr. Compos. 2019, 96, 194–203. [Google Scholar] [CrossRef]
- Yi, Y.L.; Liska, M.; Jin, F.; Al-Tabbaa, A. Mechanism of reactive magnesia-ground granulated blastfurnace slag (GGBS) soil stabilization. Can. Geotech. J. 2015, 53, 773–782. [Google Scholar] [CrossRef]
- Li, Y.; Wang, S.Y.; Yin, H.B.; He, Z. Review on the influence of alkali on hydration and hydration products of cement-based materials. J. Yangtze River Sci. Res. Inst. 2019, 36, 127–133. [Google Scholar] [CrossRef]
- Al-Tabbaa, A.; Liska, M.; Yi, Y. Properties and microstructure of GGBS—Magnesia pastes. Adv. Cem. Res. 2014, 26, 114–122. [Google Scholar] [CrossRef]
- Oproiu, C.L.; Voicu, G.; Bdnoiu, A.; AdrianIonuţ, N. The solidification/stabilization of wastewater (from a landfill leachate) in specially designed binders based on coal ash. Materials 2021, 14, 5610. [Google Scholar] [CrossRef]
- Kapeluszna, E.; Szudek, W.; Wolka, P.; Adam, Z. Implementation of alternative mineral additives in low-emission sustainable cement composites. Materials 2021, 14, 6423. [Google Scholar] [CrossRef]


| Material | Physical Property | ||||||
|---|---|---|---|---|---|---|---|
| Natural Moisture Content (%) | Specific Gravity | Total Density (g/cm3) | Liquid Limit (%) | Plastic Limit (%) | Plastic Index (%) | USCS Classification | |
| SC | 70 | 2.68 | 1.68 | 42.5 | 22.6 | 19.9 | Lean clay (CL) |
| Fineness (%) | Setting Time (min) | Loss on Ignition (%) | Normal Consistency (%) | Density (g/cm3) | Specific Surface Area (m2/kg) | Compressive Strength (MPa) | ||
|---|---|---|---|---|---|---|---|---|
| Initial | Final | 3 d | 28 d | |||||
| 3.1 | 192 | 372 | 4.5 | 28 | 3.07 | 351 | 24.1 | 48.8 |
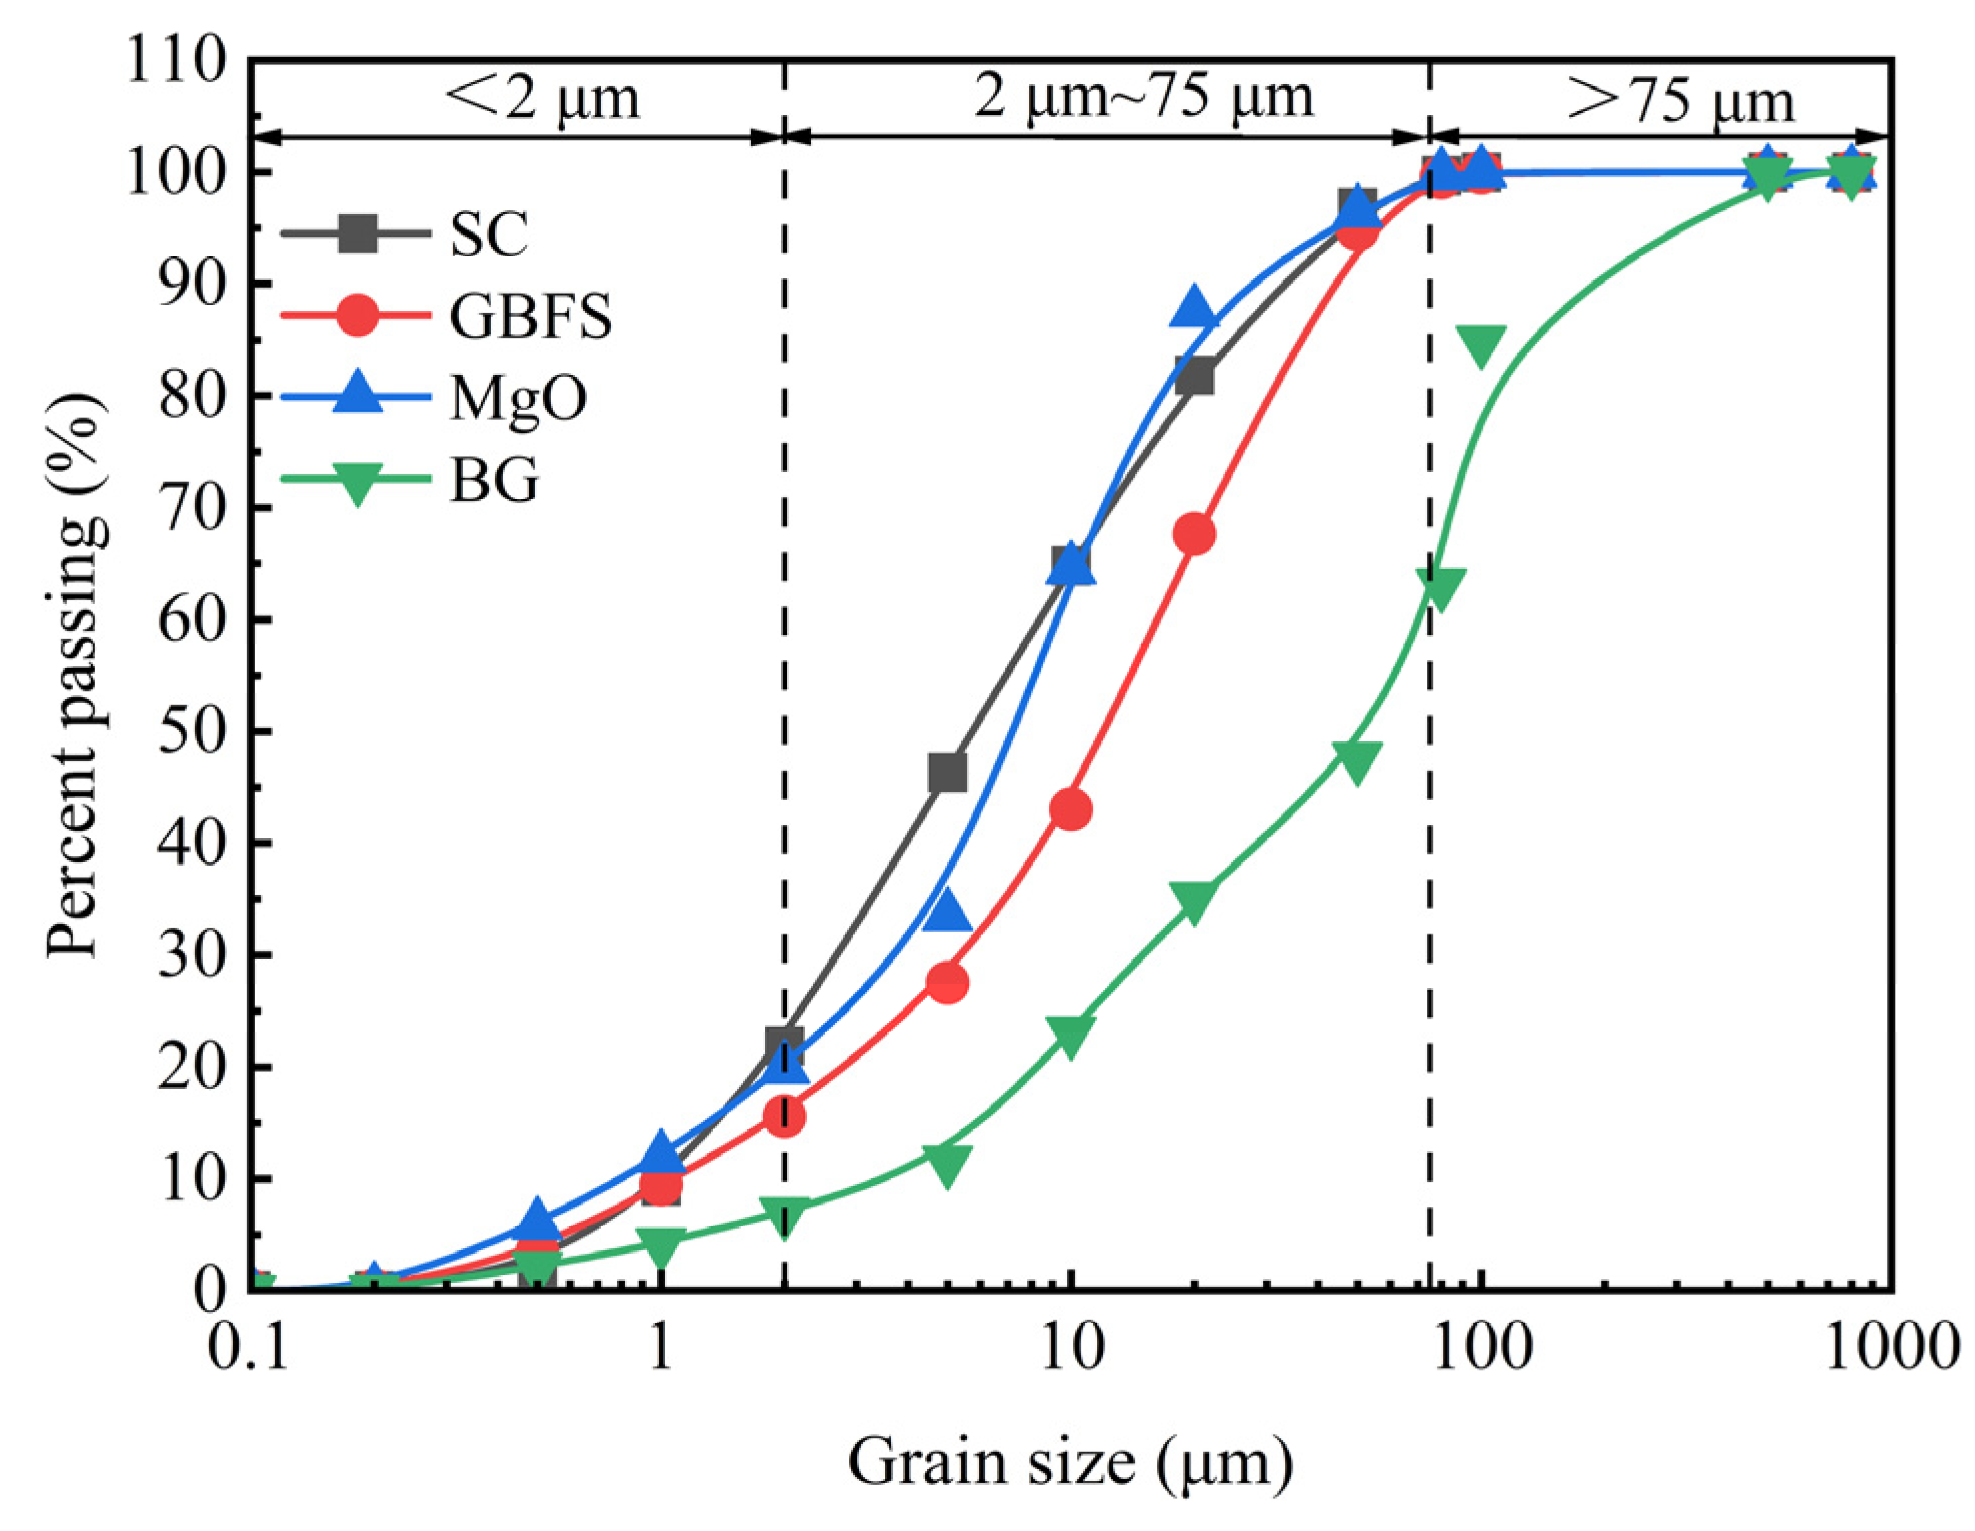
| Material | Particle Size Range Content (%) | Specific Surface Area (cm2/g) | Apparent Specific Gravity (g/cm3) | pH Value | ||
|---|---|---|---|---|---|---|
| <2 μm | 2 μm~75 μm | >75 μm | ||||
| GBFS | 15.56 | 83.26 | 1.18 | 4998 | 2.87 | 11.12 |
| MgO | 19.87 | 79.91 | 0.22 | 2795.12 | 3.12 | 10.56 |
| BG | 6.98 | 63.18 | 29.84 | 2498.15 | 2.73 | 6.8 |
| Materials | Composition Content | |||||||||||
|---|---|---|---|---|---|---|---|---|---|---|---|---|
| SiO2 | Al2O3 | CaO | Fe2O3 | SO3 | MgO | Na2O | K2O | P2O5 | TiO2 | Mn2O3 | Others | |
| SC | 72.1 | 17.5 | 0.43 | 4.2 | 2.9 | 0.9 | 0.54 | 1.4 | / | 0.01 | 0.02 | / |
| GBFS | 35 | 14.1 | 40.1 | 5.29 | 2.51 | 1.1 | 0.8 | 0.7 | / | 0.06 | 0.19 | 0.15 |
| MgO | / | 1.12 | 0.55 | 0.12 | 0.11 | 95.3 | 0.1 | 0.01 | 0.22 | 0.12 | 0.15 | 2.2 |
| BG | 2.09 | 0.89 | 35.1 | 0.65 | 52.87 | 0.67 | / | 0.12 | 0.19 | 0.17 | 0.1 | 7.15 |
| OPC | 25.6 | 13.1 | 45 | 3.55 | 3.55 | 0.85 | 0.63 | 0.25 | 0.16 | 0.26 | 0.13 | 6.92 |
| Solidified Clay | Binder Materials | Percentage of GBFS, MgO, and BG in the Binder Materials (%) | ||
|---|---|---|---|---|
| GBFS | MgO | BG | ||
| S-A1 | A1 | 90 | 10 | - |
| S-A2 | A2 | 80 | 20 | - |
| S-A3 | A3 | 70 | 30 | - |
| S-A4 | A4 | 60 | 40 | - |
| S-A5 | A5 | 50 | 50 | - |
| S-B0 | B0 | 80 | 20 | - |
| S-B1 | B1 | 60 | 20 | 20 |
| S-B2 | B2 | 40 | 20 | 40 |
| S-B3 | B3 | 20 | 20 | 60 |
| Test Project | Sample Size (mm) | Curing Time (d) | Number of Cycles (d) | Soaking Time (d) |
|---|---|---|---|---|
| UCS | 39.1 × 80 | 7, 28, 91 | / | / |
| STS | 50 × 50 | 7, 28, 91 | / | / |
| Dry and wet cycle | 39.1 × 80 | 28, 91 | 1, 2, 3,4, 5, 6, 7, 8, 10 | / |
| Sodium sulfate solution soaking | 39.1 × 80 | 91 | / | 1, 3, 7, 14, 28 |
| Test Project | Solidified Clay | Curing Time (d) | Soaking Time (d) |
|---|---|---|---|
| XRD | S-OPC, S-A1, S-A2, S-A5, S-B1, S-B2, S-B3 | 91 | / |
| N-(S-A2), N-(S-B1) | / | 28 | |
| SEM, EDS, FTIR | S-A2, S-B1 | 91 | / |
| N-(S-A2), N-(S-B1) | / | 28 | |
| TGA | S-B1 | 91 | / |
| N-(S-B1) | / | 28 |
| Samples | Ca (%) | Si (%) | Na (%) | Ca/Si | Ca/Al | Ca/(Si+Al) |
|---|---|---|---|---|---|---|
| S-A2 | 10.38 | 36.7 | / | 0.283 | 0.99 | 0.22 |
| N-(S-A2) | 10.52 | 32.32 | 2.61 | 0.325 | 1.128 | 0.253 |
| S-B1 | 13.21 | 38.4 | / | 0.344 | 1.28 | 0.271 |
| N-(S-B1) | 11.06 | 31.58 | 3.64 | 0.35 | 1.1 | 0.266 |
Disclaimer/Publisher’s Note: The statements, opinions and data contained in all publications are solely those of the individual author(s) and contributor(s) and not of MDPI and/or the editor(s). MDPI and/or the editor(s) disclaim responsibility for any injury to people or property resulting from any ideas, methods, instructions or products referred to in the content. |
© 2025 by the authors. Licensee MDPI, Basel, Switzerland. This article is an open access article distributed under the terms and conditions of the Creative Commons Attribution (CC BY) license (https://creativecommons.org/licenses/by/4.0/).
Share and Cite
Ji, H.; Fan, X.; Ding, F. Mechanical Characteristics of Soft Clay Solidified by Incorporating Granulated Blast Furnace Slag, Magnesium Oxide, and Building Gypsum. Materials 2025, 18, 1757. https://doi.org/10.3390/ma18081757
Ji H, Fan X, Ding F. Mechanical Characteristics of Soft Clay Solidified by Incorporating Granulated Blast Furnace Slag, Magnesium Oxide, and Building Gypsum. Materials. 2025; 18(8):1757. https://doi.org/10.3390/ma18081757
Chicago/Turabian StyleJi, Henggang, Xiang Fan, and Fan Ding. 2025. "Mechanical Characteristics of Soft Clay Solidified by Incorporating Granulated Blast Furnace Slag, Magnesium Oxide, and Building Gypsum" Materials 18, no. 8: 1757. https://doi.org/10.3390/ma18081757
APA StyleJi, H., Fan, X., & Ding, F. (2025). Mechanical Characteristics of Soft Clay Solidified by Incorporating Granulated Blast Furnace Slag, Magnesium Oxide, and Building Gypsum. Materials, 18(8), 1757. https://doi.org/10.3390/ma18081757