Article

Optical and Dielectric Properties of BaF2:(Er,Yb) Co-Doped Crystal

1
Faculty of Physics, West University of Timisoara, Bd. V. Parvan 4, 300223 Timisoara, Romania
2
Institute for Advanced Environmental Research, West University of Timisoara, 300086 Timisoara, Romania
*
Author to whom correspondence should be addressed.
Materials 2025, 18(9), 1915; https://doi.org/10.3390/ma18091915
Submission received: 25 March 2025 / Revised: 16 April 2025 / Accepted: 18 April 2025 / Published: 23 April 2025
(This article belongs to the Section Optical and Photonic Materials)

Abstract

:
A BaF2 single crystal co-doped with Er3⁺ and Yb3⁺ was grown by the vertical Bridgman technique and investigated for its optical and dielectric properties. Judd–Ofelt analysis yielded intensity parameters Ω2 = 0.59, Ω4 = 0.38, and Ω6 = 0.27 (×10−20 cm2), with a quality factor χ = 1.41, indicating strong radiative transitions. Under UV and near-UV excitation, emissions at 321, 405, 518, and 536 nm were observed, with radiative lifetimes ranging from 1.1 to 3.4 ms. A single dielectric relaxation process was identified, with activation energy of 0.58 eV and associated with trigonal NNN dipoles. The NNN dipole concentration was estimated at ~2.5 × 1018 cm−3. These results support the suitability of Er3⁺,Yb3⁺ co-doped BaF2 crystals for luminescent and dielectric applications in advanced photonic materials.

1. Introduction

Luminescent materials utilizing rare-earth (RE) ions continue to captivate the scientific community due to their intriguing properties and hold significant relevance for a wide array of emerging applications. Rare-earth-doped fluorite materials are well known as active media for solid-state lasers from ultraviolet up to middle infrared spectral region [1,2,3,4]. Due to the up-conversion phenomenon of fluorites doped or co-doped with rare earth ions, they are being studied for their applications as optical temperature sensors [5,6,7,8,9,10], solar radiation converters [11], or scintillators [12,13]. Although many types of materials co-doped with Er and Yb ions have been studied [14,15,16,17,18,19,20,21,22], there are few studies concerning the optical and dielectric properties investigation of Er-doped and Yb-codoped BaF2 crystal. Recently, N. Li et al. [23] reported a color-tuned up-conversion luminescence of BaF2:Yb3+, Er3+ 1D nanostructures containing nanofibers, nanobelts, and hollow nanofibers under excitation on 980 nm. S. Balabhadra et al. have reported an up-conversion fluorescence upon selective excitation of Yb3+ ions at 980 nm, resulting in a strong visible emission from 2H11/2 (blue), 4S3/2 (green) and 4F9/2 (red) multiplets [24]. However, there is limited information regarding the luminescent properties of double-doped BaF2:(Er,Yb) crystal [25], but for up-conversion luminescence only. BaF2 crystal have a cubic structure in the Fm-3m space group, with Ba2+ ions suitable for rare-earth doping. For a low dopant concentration, the charge compensation takes place through interstitial F ions in the next-nearest neighbor (NNN) lattice positions, resulting in trigonal site symmetries [3]. Higher dopant concentrations lead to the formation of complex defects and clusters in the crystal. The presence of local charge compensation results in the formation of electric dipoles, which exhibit relaxations detected as dielectric absorption. Dielectric relaxation measurements of Er3+ ions in BaF2 crystals were recently reported [26]. A single dielectric relaxation has been observed, characterized by activation energy of 0.54 eV which is attributed to the trigonal (C3v) centers. Similarly, the dielectric spectra of Yb3+ doped BaF2 crystals have shown a relaxation peak around 0.54 eV also assigned to the NNN dipoles (namely Yb3+–F(i) compensating defect with C3v site symmetry) [27]. It is important to mention that in both cases, the dopant concentration is less than or equal to 0.5 mol%. With the increase in dopant concentration, the number of isolated centers decreases, giving rise to new aggregates or clusters. Using the method described by Nicoara et al. [26], the number of NNN dipoles can be calculated. It is known that certain trivalent rare earth ions (such as Eu, Sm, Ho, Tm, and Yb) can dissolve in the BaF2 crystal in both trivalent and divalent state. The presence of Yb2+ ions is revealed in the UV absorption spectrum and the presence of Yb3+ ions is in the near-IR. The Yb2+ ions replace Ba2+ ions, require no charge compensation, exhibit cubic site symmetry, and do not contribute to the dielectric spectra [27]. Compared to CaF2 or SrF2, BaF2 allows efficient charge compensation through interstitial fluorine ions located in next-nearest-neighbor positions (NNN), leading to well-characterized trigonal (C3v) dipoles. This makes it a model system for studying dielectric relaxation associated with NNN dipoles [27]. Moreover, BaF2’s low phonon cutoff energy and high transparency in the UV–MIR range enhance its suitability for investigating the luminescence phenomena in RE3⁺/RE2⁺ co-doped systems [11,19]. Despite its advantages, detailed studies on the dielectric and photoluminescent behavior of Er3⁺,Yb3⁺ co-doped BaF2 crystals remain limited, particularly in relation to defect–dipole dynamics, which we aim to address in this work. Both dielectric and absorption spectra can provide information about the nature and site symmetry of the defects. Spectroscopic properties of Yb2+ and Yb3+ ions and, separately, Er3+ ions doped in BaF2, crystals have been investigated, particularly for applications as up-conversion luminescent materials in the UV–VIS–NIR spectral range [3,12,13,28,29,30]. There are few papers related to the luminescence properties of Er/Yb double-doped crystals under excitation in the visible range (downshifting emission), but no study reported for BaF2:(Er,Yb) crystals. In 2019, Liu et al. [31] reported that PbF2:(Er,Yb) phosphors show a green emission, around 550 nm, and red emission at 660 nm, under excitation at 376 nm, which correspond to 4S3/24I15/2 and 4F9/24I15/2 transitions of Er3+ ions, respectively. Red, green, and blue up-conversion emissions were also observed in Er/Yb double-doped Ba2LaF7 nanocrystals [32]. Kaczmarek et al. [33] reported a near infrared emission, at room temperature, around 1540 and 978 nm of (Er3+,Yb3+):LaF3 nanoparticles under excitation at 378 nm (direct excitation of 4G11/2 level). On the other hand, by direct excitation at 380 nm, a broad and intensive emission, with maximum around 410 nm, was observed in Bi2ZnOB2O6:Yb3+/Er3+ single crystal which correspond to to the 3P11S0 transition of Bi3+ ions from the host crystal [34].
The focus of this paper is to investigate the spectroscopic and dielectric properties of double-doped BaF2:(Er,Yb) crystal. To achieve this objective, optical absorption and photoluminescence (PL) measurements were obtained, and the Judd–Ofelt (JO) model was used to obtain information about the luminescence properties of the crystal. The obtained theoretical values were compared with those reported by other authors. The dielectric measurements were utilized to investigate the nature of charge compensating defects arranged in a dipolar configuration. Within this analysis, the dielectric absorption unveiled the relaxation process of these dipoles. The study identified a singular type of charge compensating defect, specifically, the isolated C3v site symmetry. The examination of these physical properties of the low concentration double-doped BaF2:(Er,Yb) crystal holds significance not just from a scientific perspective but also for practical applications.

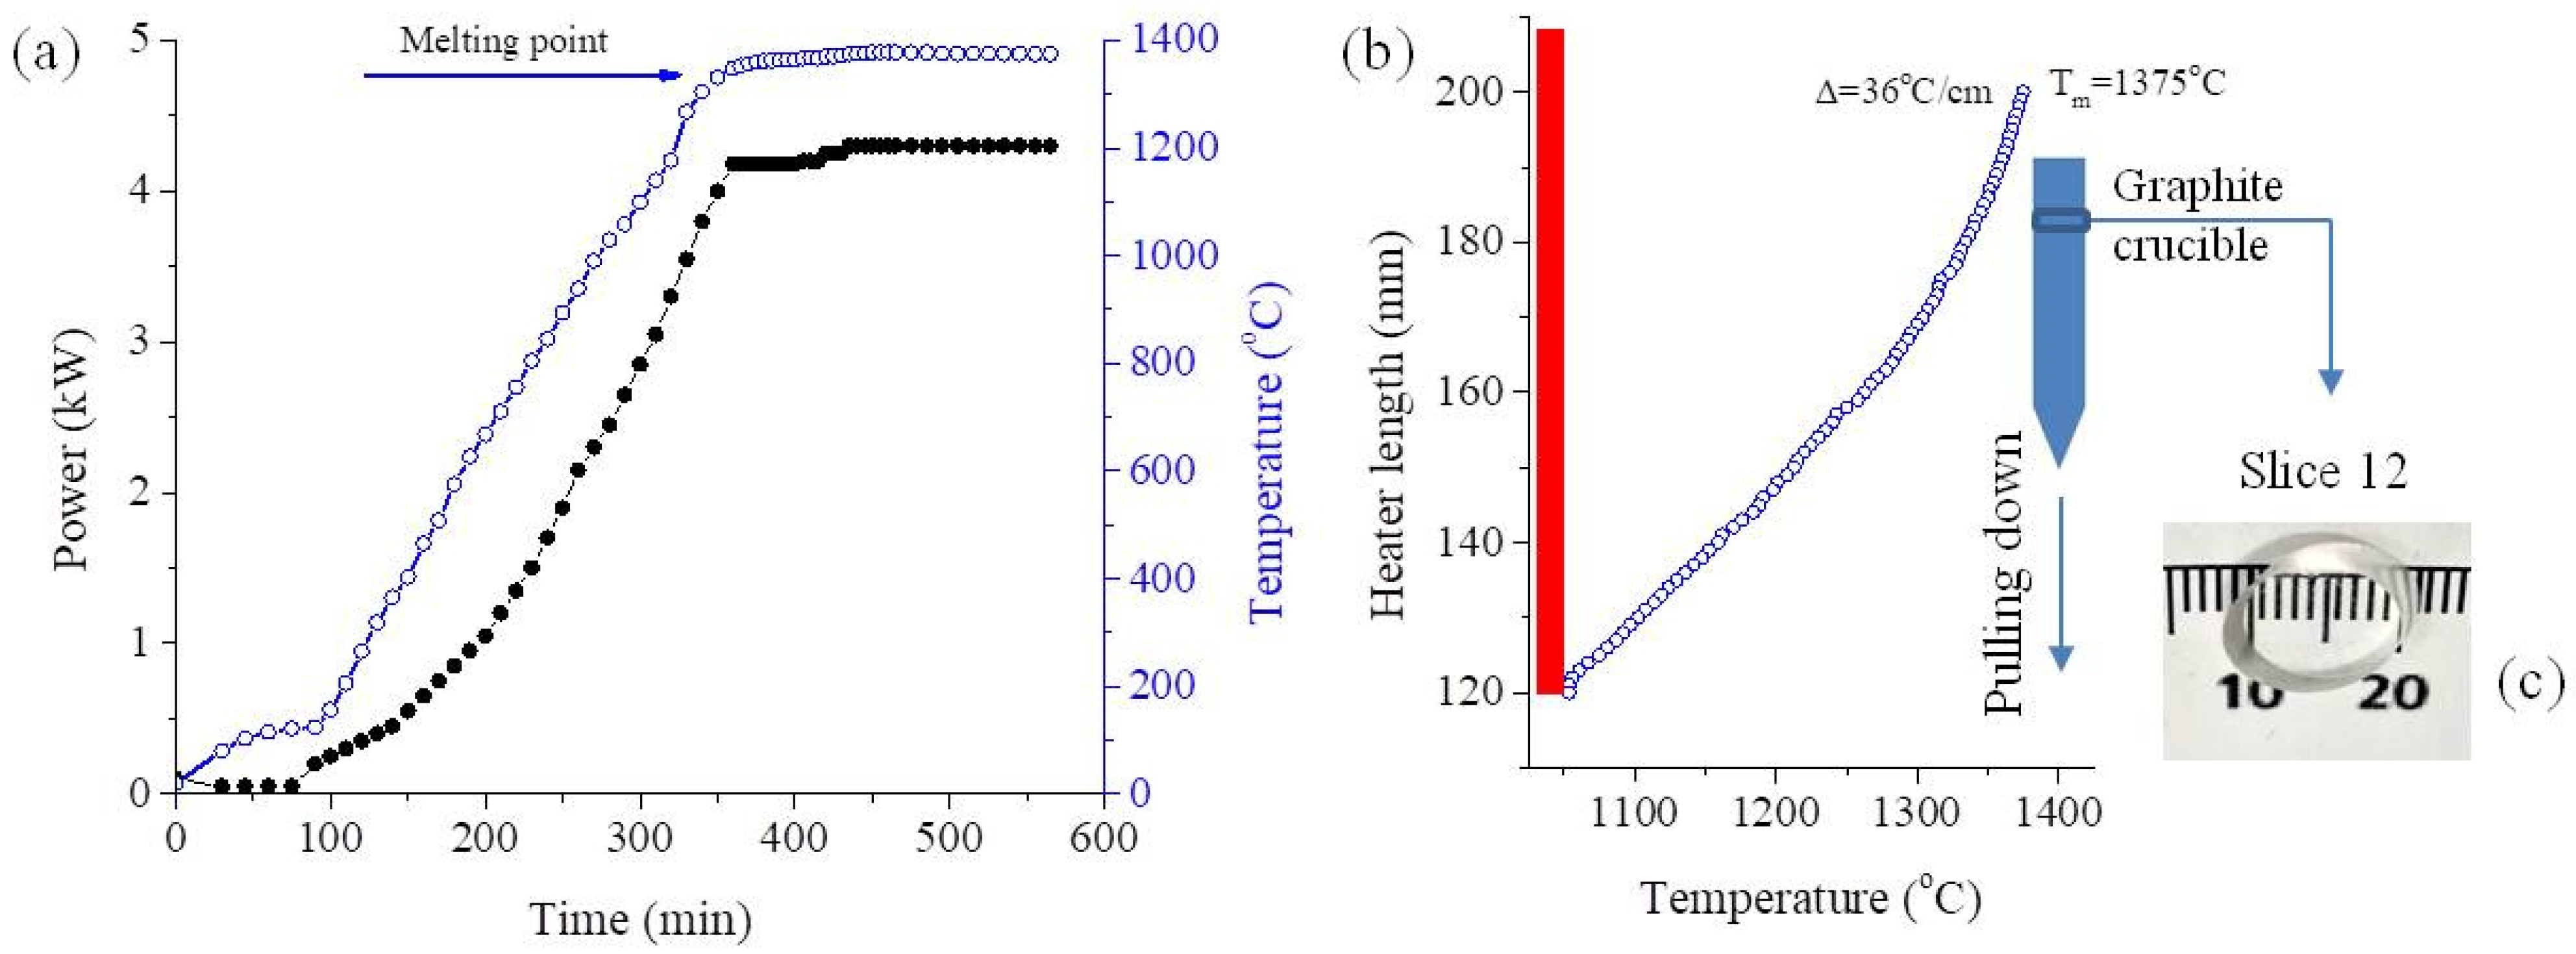
2. Materials and Methods

Double-doped BaF2:(0.05 mol% YbF3, 0.2 mol% ErF3) crystal was grown in our Crystal Growth Laboratory by vertical Bridgman method using a shaped graphite furnace [35]. The doping concentrations mentioned pertain to the inclusion of ErF3 and YbF3 into the molten substance. The crystal was grown under a vacuum of approximately 10−1 Pa in a crucible made of spectrally pure graphite. We utilized crushed BaF2 optical UV–VIS windows sourced from Crystran Ltd., Dorset, UK (derived from 99.99% BaF2 powder) as our initial material. To this raw material, the specified quantity of ErF3 and YbF3 (purchased from Merck, Dramstadt, Germany, 99.99% purity) was added. Figure 1a shows the preparation stage of the Bridgman setup for reaching the rated electrical power of 4.3 kW on the graphite heater. This electrical power is required to achieve the melting temperature of the raw material (1375 °C). A period of three hours at the 4.3 kW is required in order to stabilize the melt. Figure 1b illustrates the typical temperature distribution measured at the bottom of the crucible using an S-type thermocouple. The crucible, with the melt, goes down in the heater with a pulling rate of 4 mm/h. In the first hour of the growth process, the temperature gradient was 36 °C/h. The grown crystal has approximately 6 cm long and 10 mm in diameter. The crystal was cleaved along the (111) crystallographic direction into several slices. For this study, a 2.33 mm thick slice was selected from the top of the crystal (slice 12). It exhibits transparency and is devoid of any visible inclusions or cracks, as depicted in Figure 1c.
The room temperature optical absorption spectra in the UV–VIS–NIR spectral range were recorded using a Shimadzu 1650PC, Schimadzu Corporation, Kyoto, Japan and Nexus 470 FTIR spectrophotometer, Thermo Fisher Scientific, Waltham, MA, USA The spectrophotometers use an automatic correction for baseline correction. The correction takes into account the effect of instrument noise and the light scattering due to the possible undesired particles in the sample. In order to measure the room temperature luminescence spectra, at room temperature, in the UV–VIS domain, the PerkinElmer LS55 spectrofluorometer, Perkin Elmer Inc., Waltham, MA, USA, was used. The room temperature luminescence spectra were obtained by excitation at two wavelengths, 290 and 378 nm, respectively, which correspond to the 4I15/24G7/2 and 4I15/24G11/2 transition of Er3+ ions [13]. The local charge compensations by pairing the trivalent rare-earth (RE3+) cations with interstitial F(i) anions create electric dipoles, (RE3+-F). These dipoles can reorient under a variable electric field. The reorientation process can be studied by various methods as anelastic relaxation, thermally stimulated depolarization, or dielectric relaxation measurements. The temperature and frequency dependence of the complex dielectric constant, ε* = ε1 − iε2 constitutes the dielectric spectra. The dielectric spectra, spanning ten audio frequencies, were obtained using the RLC Meter ZM2355 NF Corporation, Yokohama, Japan, across temperatures ranging from 150 K to 320 K. The real part of the dielectric constant, ε1, was derived from the measured capacitance C, while the imaginary part, ε2, was subsequently calculated through relation D = ε21, where D = tan θ is the dielectric loss. The measurements were conducted employing linear heating rates of 1 K/min. A sample cleaved from single crystal, polished to ~0.6 mm thick disk, was used, with Ag (Leitsilber) contacts facilitating the dielectric property assessments.

3. Experimental Results and Discussion

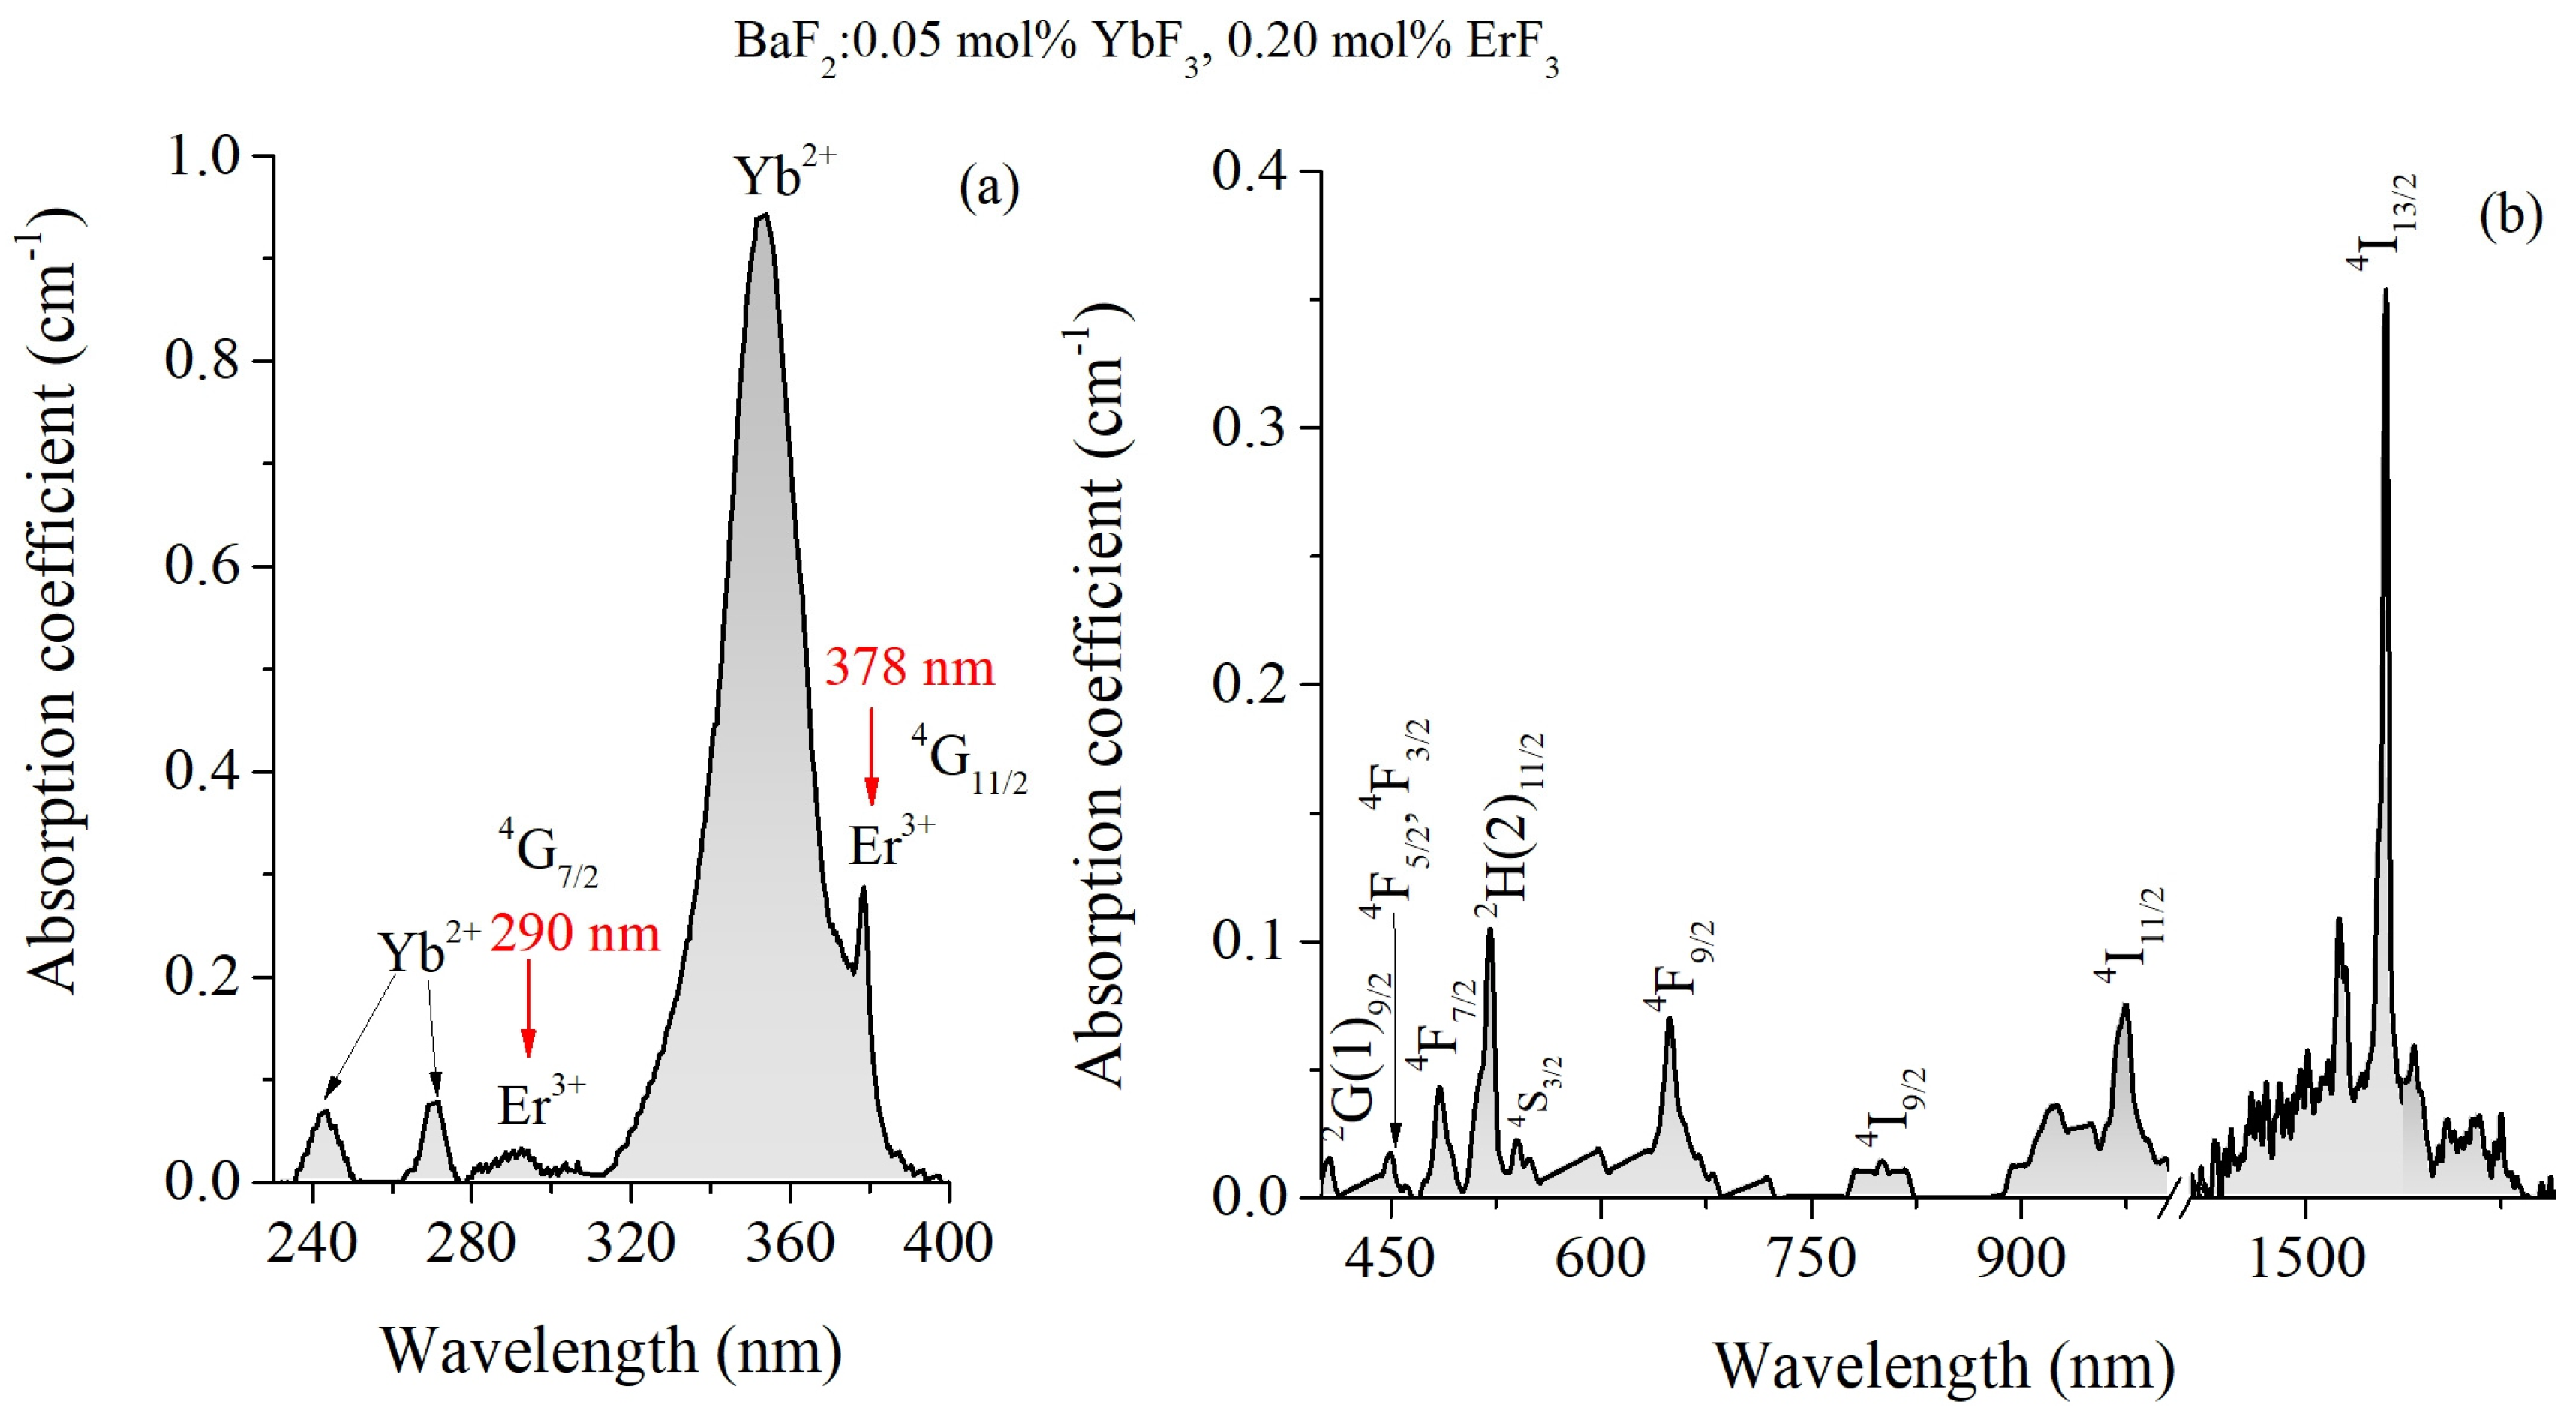
3.1. Optical Absorption Spectra

Figure 2a,b shows the absorption spectra of the selected sample. The absorption spectra show both the characteristic absorption bands of trivalent Er ions and those of Yb3+/Yb2+ ions, the latter resulting from the Yb3+→Yb2+ electric charge conversion, similar to that observed in CaF2:(Er,Yb) crystals [19]. The absorption peaks, denoting the transitions from the ground state 4I15/2 to the excited states of Er3+ ions, are specifically highlighted in Figure 2a,b. Also, in Figure 2a, the absorption bands of Er3+ ions around 290 and 378 nm, used for excitation during emission monitoring, are highlighted. Due to the charge compensation process, involving both rare earth ions, the energy levels of the RE ions split causing the formation of broad and structured absorption bands.

3.2. Judd–Ofelt Analysis

The application of the standard Judd–Ofelt analysis (J-O analysis) [36,37] facilitated the calculation of spectroscopic parameters based on optical absorption spectra. By utilizing a set of four absorption bands corresponding to specific Er3+ transitions from the ground level 4I15 to excited levels (4I13/2, 4F9/2, 2H(2)11/2, and 4F7/2), the J–O intensity parameters, namely Ω2, Ω4, and Ω6, were computed. The 980 nm absorption band was excluded due to overlapping transitions of Er3+ ions and Yb3+ ions (specifically, 4I15/24I11/2 for Er3+ ions and 2F7/22F5/2 for Yb3+ ions). Additionally, the absorption band around 378 nm (4I15/24G11/2 transition), characteristic of Er3+ ions, was excluded from the J–O analysis due to overlapping with the Yb2+ ion absorption band related to the 4f14(1S0)→4f135d (2F3/2) transition.
In order to obtain the J-O parameters Ωt (t = 2, 4, 6) and the measured line strength (see Table 1), we solved a set of four equations, using the Levenberg–Marquardt algorithm, corresponding to the four transitions. The experimental line strength has been determined using the following expression:
S m e a s = 3 c 2 J + 1 n ( λ ) 8 π 3 N 0 λ m e a n e 2 9 n ( λ ) 2 + 2 2 α λ d λ
where J is the total angular momentum quantum number of the initial state, n(λ) is the refractive index, N0 is the Er3+ ions concentration (added to the melt), λmean is the mean wavelength of the specific absorption bands, Σ = α λ d λ is the integrated absorption coefficient as a function of λ, α(λ) is absorption coefficient, c is the vacuum speed of light, and ħ is Planck’s constant. The refractive index, n, was determined from the Sellmeier dispersion equation [38].
Deriving the J–O parameters involved solving a set of four equations for transitions between J and J′ manifolds using the experimental line strengths. This simultaneous calculation, is based on Expression (1) and the electric dipole line strength:
S J J e d = t = 2,4 , 6 Ω t S , L J U ( t ) S , L J 2
and the magnetic dipole (md) line strength:
S J J m d = S , L J L + 2 S S , L J 2
where   U ( t )   are the reduced matrix elements of rank t (t = 2, 4, and 6) of tensor operators between states characterized by the quantum numbers (S, L and J) and (S′, L′ and J′). We have used the values of the reduced matrix elements for the chosen Er3+ transitions from those tabulated in the work of Kaminskii [39]. Only the 4I15/24I13/2 transition has a magnetic dipole contribution corresponding to the absorption band around 1530 nm. The calculated line strength in this case is the sum of electric and magnetic dipole line strength. The calculated J-O parameters, by applying a least-squares fitting of Smeas and Scalc, and the spectroscopic quality factor, χ, are given in Table 2. A comparison of the obtained J–O parameters with those obtained for BaF2:ErF3 [1,12,13,20,21], for BaF2:(Er,Yb) reported by [25] and for Er:YAG [40], is also provided. The observed variations between the Judd–Ofelt parameters obtained in this work and those reported in previous studies on BaF2:Er3⁺ or BaF2:(Er3⁺,Yb3⁺) systems can be attributed to several factors. Firstly, differences in dopant concentrations affect the local field environment and may lead to the formation of clusters rather than isolated centers, thereby altering the local symmetry and affecting the oscillator strengths [13]. Secondly, in co-doped systems such as the present one, additional energy transfer pathways and local charge compensation mechanisms are introduced due to the presence of both Er3⁺ and Yb3⁺ ions. This can modify the effective transition probabilities compared to a singly doped host. Thirdly, spectral overlap, especially in the near-UV region, may introduce uncertainties in the evaluation of certain bands; for instance, the 4I15/24G11/2 transition of Er3⁺ at ~378 nm overlaps with the 4f14→4f135d transition of Yb2⁺, complicating the spectral deconvolution. Such overlapping transitions were excluded from the fit to ensure reliability of the extracted parameters.
The root mean square deviation, defined by Δ S r m s = [ ( q p ) 1 ( S calc S meas ) 2 ] 1 / 2 is a measure of the accuracy of the fitting procedure; q = 4 is the number of analyzed spectral bands and p = 3 is the number of sought parameters. In this case, ΔSrms = 0.08·10−20 cm2, which is comparable with those obtained in other papers [1,12,13,28,40]. In order to calculate the radiative lifetime (τrad) for an excited state, J′ can be used the relationship τrad = 1/∑AJJ′, where:
A J J = 64 π 2 e 2 3 ( 2 J + 1 ) λ m e a n 3 n ( n 2 + 2 ) 2 9 S J J e d + n 2 S J J m d
is the sponaneous emission probability and the sum is taken over all final lower-lying states, S J J e d and S J J m d are defined by Equations (2) and (3). The calculation of fluorescence branching ratios, BJJ involves utilizing the expression BJJ = AJJ·τrad. Table 3 shows the values of the radiative emission probabilities, the branching ratios, and the radiative lifetimes for transitions where luminescence was observed. A comparison of the calculated radiative lifetimes and those measured by other authors is also given in Table 3. The observed difference between calculated and measured lifetimes may imply the presence of energy migration, intense emission reabsorption or thermal coupling across manifolds, factors not taken into account in the standard J-O model.

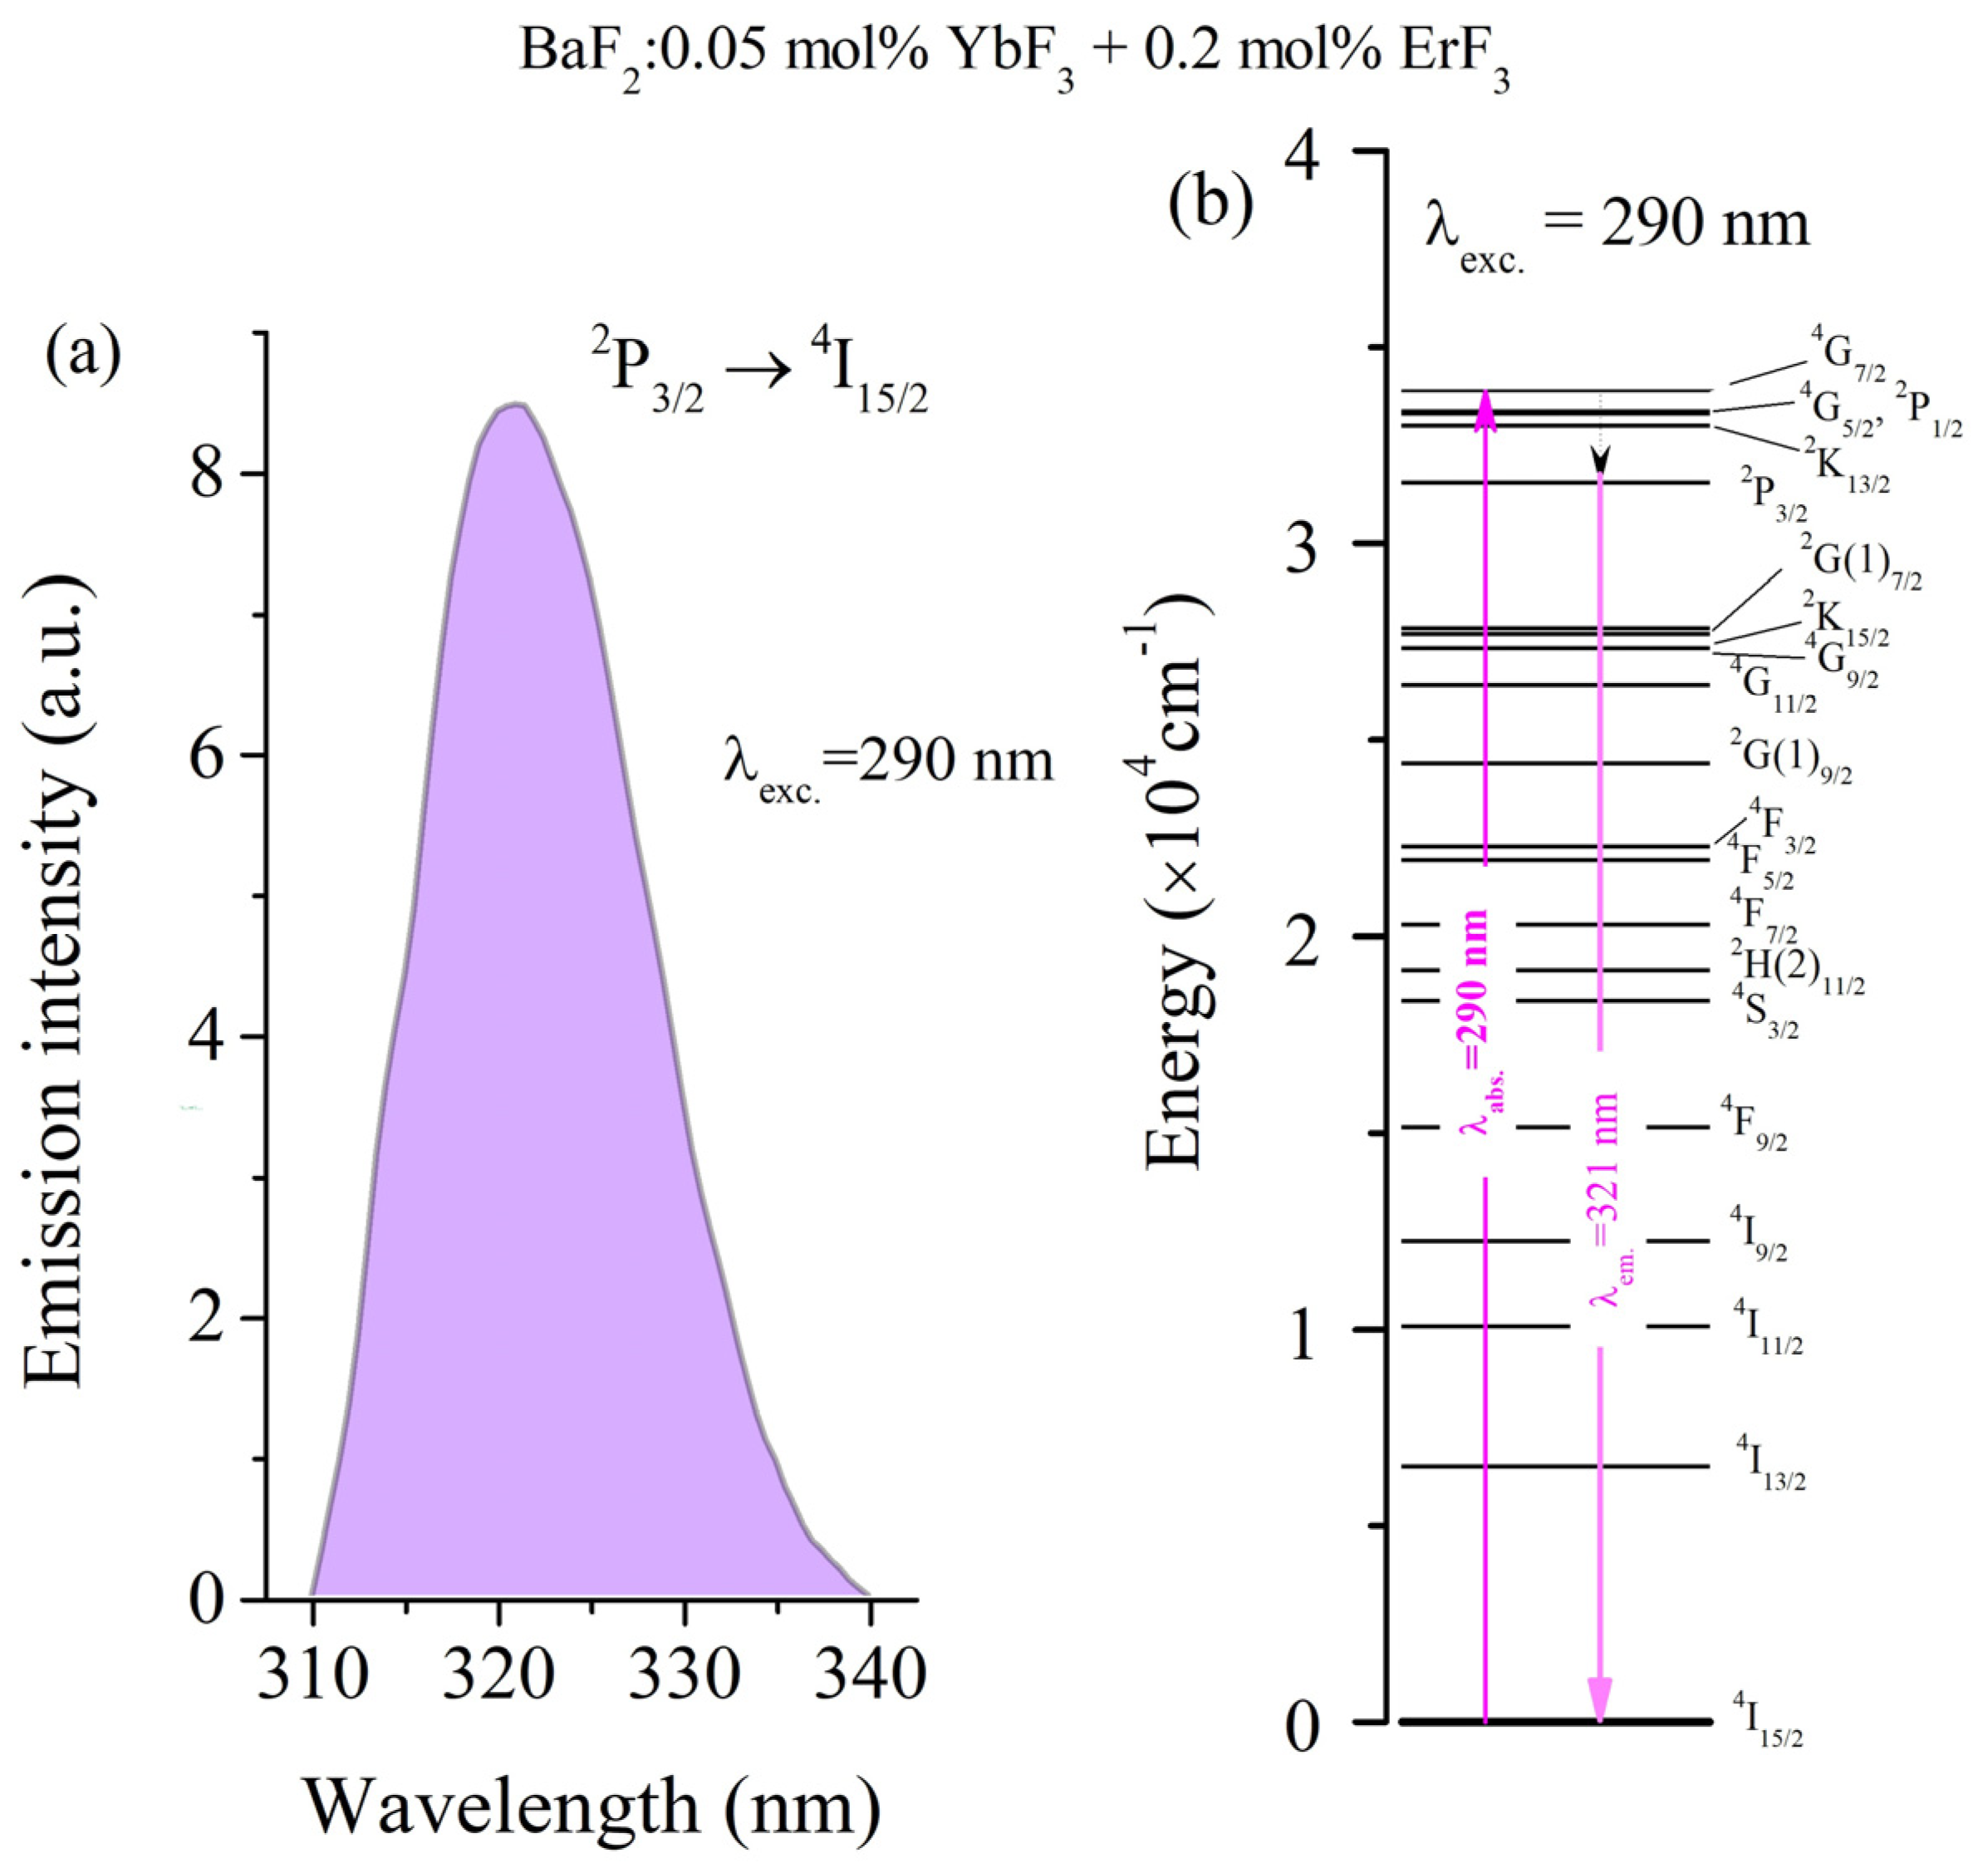
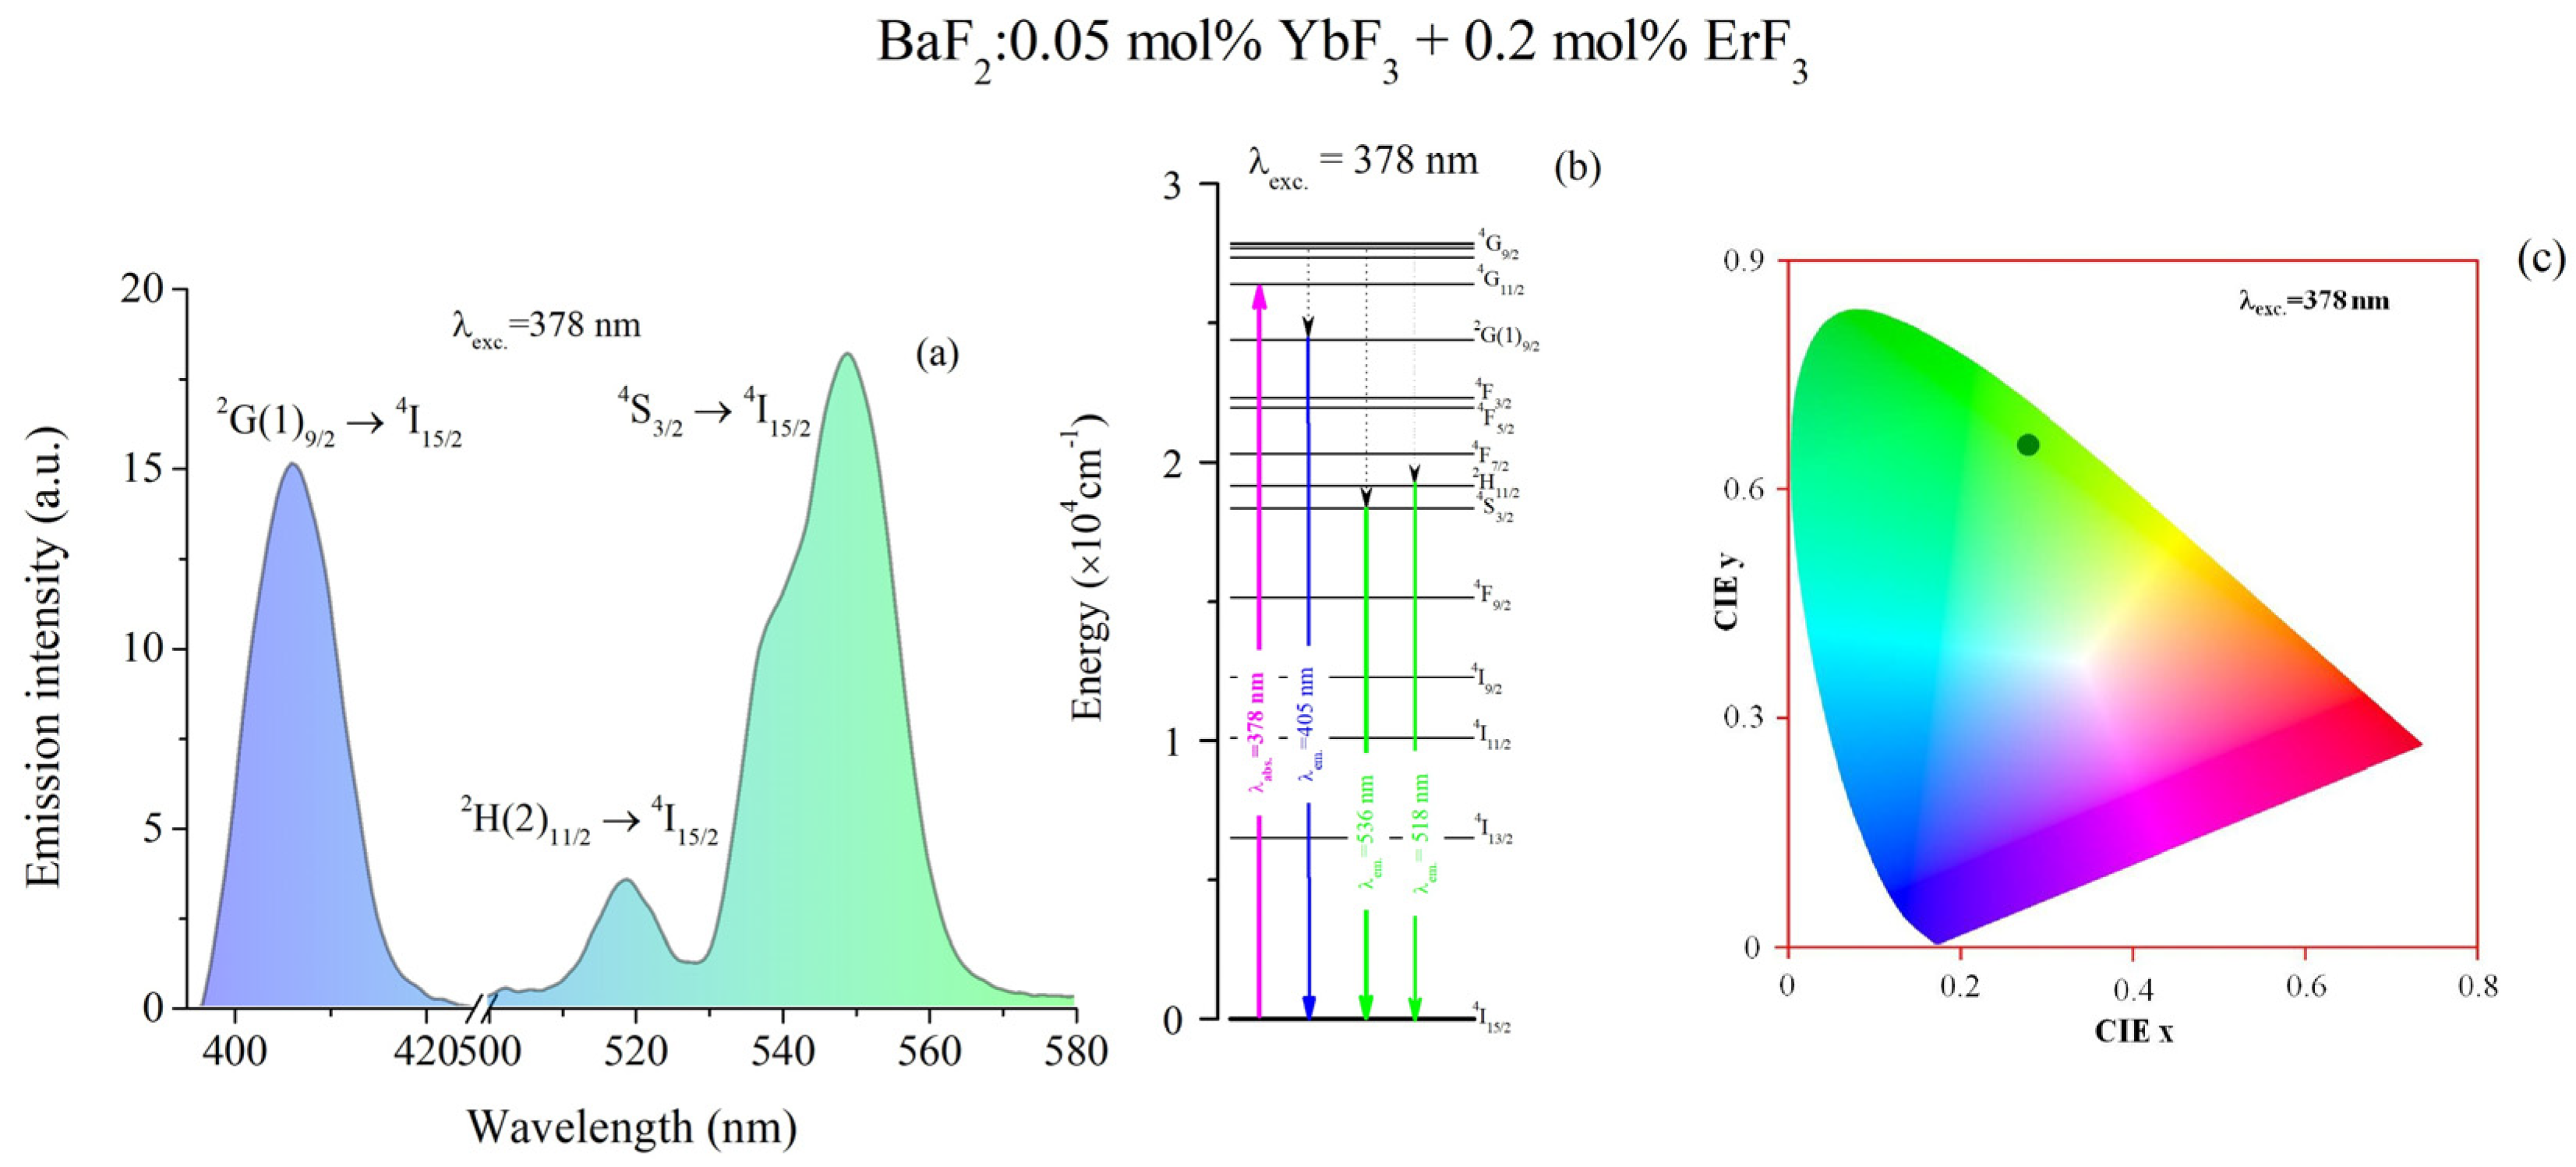
3.3. Emission Spectra

In order to obtain the room temperature emission spectra, two absorption bands were used for excitation, namely λexc. = 290 nm (4I15/24G7/2 transition) and λexc. = 378 nm (4I15/24G11/2 transition). The emission spectrum of the studied sample under 290 nm excitation and the energy level diagram are shown in Figure 3a,b. By excitation at 290 nm, the emission spectrum is characterized by an emission band centered around 321 nm (Figure 3a). This UV emission was reported in our previous work for various concentrations of simple-doped ErF3 doped BaF2 crystals [13] but it was not reported before in double-doped BaF2:(Er,Yb).
This emission can be attributed to the self-trapped exciton (STE). When the energy level 4G7/2 is pumped, the Er-bond exciton emission took place from the 2P3/2 manifold, which is placed in the middle of the STE emission band, therefore the energy transfer from STE to the Er3+ ion becomes effective [13].
By excitation at 378 nm, we obtained three broad emission bands (Figure 4a). The green band has two peaks at 536 nm and 518 nm (weak) which correspond to the transition 4S3/24I15/2 and 2H(2)11/24I15/2 of Er3+ ions (Figure 4b). The blue band, around 405 nm, corresponds to the 2G(1)9/24I15/2 transition. The intensities of the blue and green emissions are over two times higher than the UV emission band. The International Commission on Illumination (CIE) chart corresponding to the visible emissions is shown in Figure 4c. The CIE coordinates were obtained using Gocie V2 software [41]. For the excitation at 378 nm, the color coordinates are X = 0.28 and Y = 0.66. These values are in a good agreement with those obtained for BaF2:0.15 mol% ErF3 (X = 0.30 and Y = 0.67) [13].

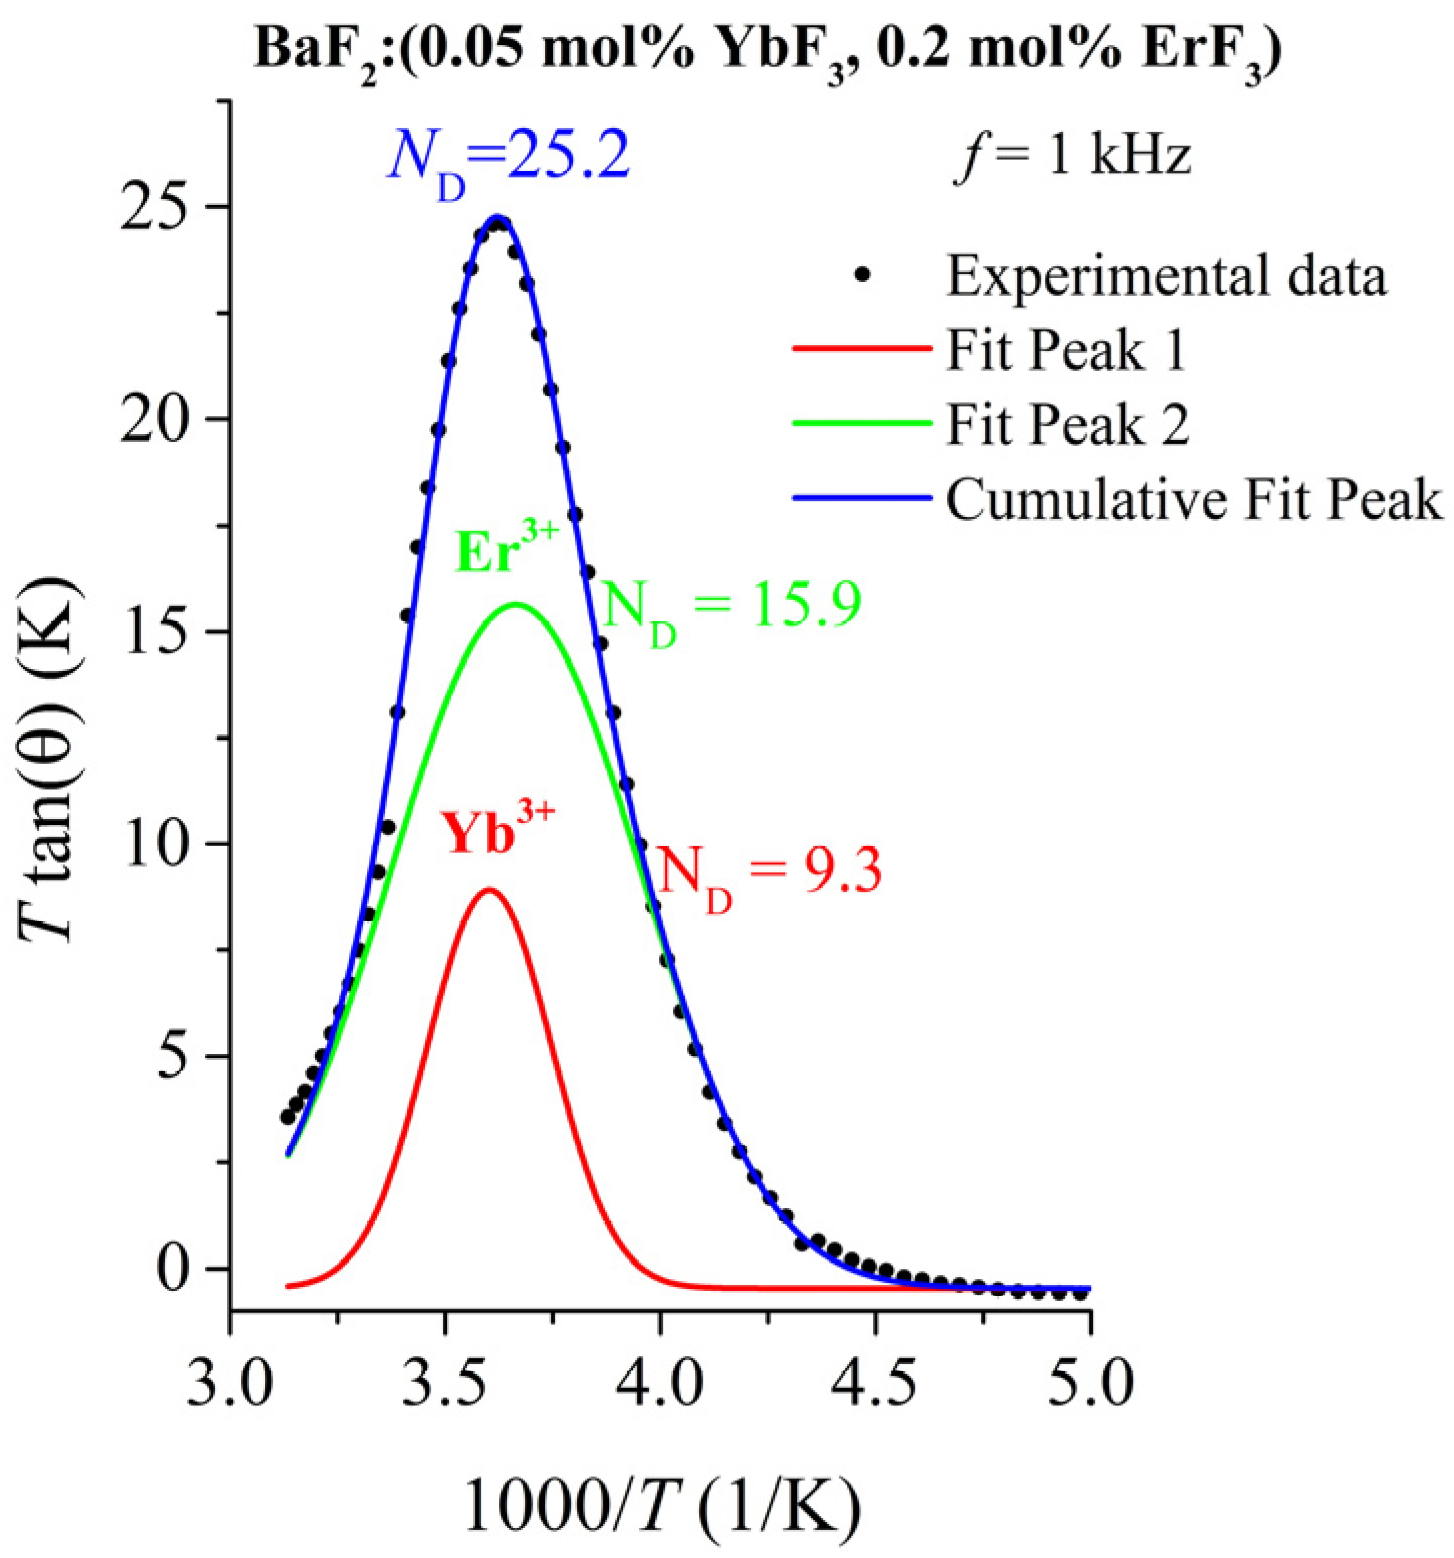
3.4. Dielectric Relaxation

Figure 5a,b show the temperature and frequency variations of both the real, ε1, and imaginary, ε2, components of the complex dielectric constant, ε*, specifically for the BaF2:(0.05 mol% YbF3, 0.2 mol% ErF3) crystal. In the studied temperature range, the imaginary part (ε2) of the complex dielectric constant exhibits a singular peak at a temperature denoted as Trelax, consistent across all frequencies. The Trelax temperature demonstrates a tendency to shift towards higher temperatures with increasing frequency, which indicates a dielectric relaxation phenomenon. The fundamentals of dielectric relaxation and the interpretation of relaxation phenomena in complex systems are well detailed in recent works [42,43,44]. The relaxation process is characterized by the activation energy for re-orientation, E, and by a relaxation time, τ, given by the Arrhenius relation τ = τ0 exp (E/kT), where τ0 is [45] the reciprocal frequency factor. The imaginary part, ε2, has a maximum for ωτ = 1 [45]. Therefore, the plot of 1/Trelax versus ln ω permits to determine the activation energy, E, and the τ0 (Figure 5c). The values of the relaxation parameters for the observed dipoles are E = 0.58 eV and τ0 = 4.1 × 10⁻¹⁵ s. These values correspond to the NNN dipoles (trigonal, C3v) sites (inset of Figure 5b). The RE3+ ions (erbium or ytterbium) substitute for Ba2+ ions in BaF2 crystals. Charge compensation is achieved by a fluorine ion in trigonal site symmetry. This result is in good agreement with our recent study regarding the analysis of site symmetries of Er3+ doped CaF2 and BaF2 crystals by high resolution photoluminescence spectroscopy [13]. For comparison, the relaxation parameters of Yb/Er/Gd doped BaF2 crystals are given in Table 4. Although the activation energy of 0.58 eV is consistent with values attributed in previous works to NNN dipoles of trigonal (C3v) symmetry in rare-earth doped BaF2 crystals, the potential contribution of other defect configurations cannot be entirely ruled out. Defect clusters or residual oxygen-related complexes may lead to similar relaxation signatures, especially at higher doping levels or under different growth atmospheres. Nevertheless, the low dopant concentrations employed here, and the close match to known C3v-related values, support our current assignment [13,27]. Further studies using EPR or impurity profiling would help to clarify the role of such alternative configurations.
The number of dipoles, ND, that contribute to the dielectric relaxation peak can be calculated from the dielectric spectra using the Campos method [46] that consists of plotting (T tan δ) versus 1000/T, where T is the temperature and tan δ is the dielectric loss. The maximum of this curve occurs when ωτ = 1, which corresponds to
N D = 6 ε 0 k μ 2 ( T t a n δ ) m a x
where μ = 8.596 × 10⁻²⁹ C·m is the dipole moment of the NNN dipole, k is the Boltzmann constant, ε0 is the free space dielectric constant, and ND is the number of dipoles contributing to the relaxation.
Table 4. Relaxation parameters of NNN dipoles in Yb/Er/Gd doped BaF2 crystals.
SampleE
(eV)
τ0
(10−15 s)
ND
(1017 cm−3)
BaF2:0.05 mol% YbF3,
0.2 mol% ErF3
0.584.125.2
This work
BaF2:0.2 mol% ErF30.566.722.6 [26]
BaF2:0.05 mol% YbF30.531620.95 [27]
BaF2:0.05 mol% GdF30.53–0.617 [47]-
After the Gaussian multi-peak fit of the plot (T tan δ) versus 1000/T for a frequency f = 1 kHz, the values of the ND for both RE ions can be estimated (Figure 6). In Table 4, the values for the concentration of NNN dipoles are shown. The NNN dipole concentration of Er3+ ions is 15.9·1017 cm−3 being slightly lower than for simply doped BaF2:Er crystals (see Table 4) [26]. Similarly, a lower NNN dipole concentration value of 9.3·1017 cm−3 was obtained for Yb3+ ions [27]. This can be explained by the clustering process in the double-doped crystal. No detailed study on the dielectric spectra of double-doped BaF2:(ErF3, YbF3) crystals has been previously reported.

4. Conclusions

A double-doped BaF2:(ErF3, YbF3) crystal was grown by using the conventional Bridgman technique. The optical and dielectric properties of the crystal were investigated. The significant results found in the present work are as follows: (1) The optical absorption spectrum shows both the characteristic bands of trivalent Er and Yb ions and the characteristic bands of Yb2+ ions (in the UV spectral range). (2) Using the J-O formalism, the radiative emission probabilities, the branching ratios, and the radiative liftimes were calculated. (3) Room temperature emission spectrum of BaF2:(0.05 mol% YbF3, 0.2 mol% ErF3) crystal under excitation at 290 and 378 nm was measured. (4) In the investigated temperature range, only one type of dielectric relaxation has been observed. This relaxation, with activation energy of 0.58 eV is associated with trigonal NNN centers. (5) The number of dipoles corresponding to NNN centers was determined. The values obtained are in agreement with those observed in singly doped crystals. The study of the dielectric behavior and optical properties of double-doped BaF2 crystal with low concentrations of YbF3 and ErF3 has not been reported so far.
In summary, the co-doped BaF2:Er3⁺,Yb3⁺ single crystal investigated in this work demonstrates a combination of favorable optical and dielectric properties, including well-resolved emission bands, radiative lifetimes in the sub-millisecond range, and a clearly defined dielectric relaxation process The Judd–Ofelt analysis reveals a relatively high Ω2 parameter and quality factor (χ = 1.41), indicating good radiative efficiency. These results highlight the suitability of such crystals for UV–visible photonic applications, particularly in compact solid-state luminescent sources. The findings contribute to the growing interest in rare-earth doped fluorides as multifunctional materials combining optical and dielectric functionalities.

Author Contributions

M.S.: investigation, formal analysis and writing—review and editing, methodology, software; C.S.: investigation, formal analysis, investigation and writing—review and editing; G.B.: investigation, formal analysis, investigation and writing—review and editing. All authors have read and agreed to the published version of the manuscript.

Funding

This research was funded by a grant of the European Commission within the framework of the Romanian National Recovery and Resilience Plan (PNRR) through the ESCARGOT project entitled “Enhanced Single Crystal Applications and Research in the Growth of new Optical rare earth-based compounds for sustainable and efficient Technologies” (n◦: 760080/23 May 2023).

Institutional Review Board Statement

Not applicable.

Informed Consent Statement

Not applicable.

Data Availability Statement

The data presented in this study are available on request from the corresponding author. The data are not publicly available due to privacy reasons.

Acknowledgments

The authors would like to acknowledge Ioan Sirbu for his involvement in the crystal growth process.

Conflicts of Interest

The authors declare no conflicts of interest.

References

  1. Brown, E.E.; Fleischman, Z.D.; McKay, J.; Dubinskii, M. Spectroscopic characterization of low-phonon Er-doped BaF2 single crystal for mid-IR lasers. Opt. Mater. Express 2021, 11, 575–584. [Google Scholar] [CrossRef]
  2. Tolstik, N.A.; Kurilchik, S.V.; Kisel, V.E.; Kuleshov, N.V.; Maltsev, V.V.; Pilipenko, O.V.; Koporulina, E.V.; Leonyuk, N. Efficient 1 W continuous diode-pumped Er,Yb:YAl3(BO3)4. Opt. Lett. 2007, 32, 3233–3235. [Google Scholar] [CrossRef] [PubMed]
  3. Racu, A.V.; Ristic, Z.; Ciric, A.; Dordevic, V.; Buse, G.; Poienar, M.; Guttmann, M.J.; Ivashko, O.; Stef, M.; Vizman, D.; et al. Analysis of site symmetries of Er3⁺ doped CaF2 and BaF2 crystals by high resolution photoluminescence spectroscopy. Opt. Mater. 2023, 136, 113337. [Google Scholar] [CrossRef]
  4. Kaminskii, A.A. Laser Crystals: Their Physics and Properties; Springer-Verlag: Berlin/Heidelberg, Germany, 1990. [Google Scholar]
  5. Perera, S.S.; Dissanayake, K.T.; Rabuffetti, F.A. Alkaline-earth fluorohalide nanocrystals for upconversion thermometry. J. Lumin. 2019, 207, 416–423. [Google Scholar] [CrossRef]
  6. Li, N.; Shao, H.; Qi, H.; Sheng, Y.; Yang, L.; Xie, Y.; Li, D.; Yu, W.; Ma, Q.; Dong, X. A strategy towards MF2:Yb3⁺,Er3⁺/SiO2 (M=Ba, Sr, Ca) yolk-shell nanofibers and yolk-shell nanobelts with up-conversion fluorescence. Colloids Surf. A Physicochem. Eng. Asp. 2022, 648, 129338. [Google Scholar] [CrossRef]
  7. Duhanapala, B.D.; Munasinghe, H.N.; Rabuffetti, F.A. Temperature-dependent luminescence of CaFCl:Yb,Er upconverting nanocrystals. J. Lumin. 2021, 235, 117974. [Google Scholar] [CrossRef]
  8. Liu, M.-H.; Li, T.-T.; Wang, X.; Liu, D.-Y.; Yuan, N.; Zhang, D.-L. Synthesis and Er3⁺ spectroscopic property of Er3⁺/Yb3⁺-codoped CaIn2O4 nanofibers for thermometry. J. Lumin. 2020, 215, 116703. [Google Scholar] [CrossRef]
  9. Li, X.; Liu, Q.; Li, G.; Yang, G.; Zhang, X.; Bai, Z.; Wang, X. Synthetic process and luminescence properties of Er3⁺, Yb3⁺ doping fluoride-based up-conversion phosphors. J. Mater. Sci. Mater. Electron. 2020, 31, 6217–6225. [Google Scholar] [CrossRef]
  10. Pisarski, W.A.; Janek, J.; Pisarska, J.; Lisiecki, R.; Ryba-Romanowski, W. Influence of temperature on up-conversion luminescence in Er3⁺/Yb3⁺ doubly doped lead-free fluorogermanate glasses for optical sensing. Sens. Actuators B Chem. 2017, 253, 85–92. [Google Scholar] [CrossRef]
  11. Bitam, A.; Fartas, R.; Diaf, M.; Boubekri, H.; Cheddadi, A.; Martin, I.R. Investigation of Er3+-Doped BaF2 Single Crystals for Infrared Emission and Photovoltaic Efficiency Enhancement. Luminescence 2025, 40, e70102. [Google Scholar] [CrossRef]
  12. Stef, M.; Nicoara, I.; Racu, A.; Buse, G.; Vizman, D. Spectroscopic properties of the gamma irradiated ErF3-doped BaF2 crystals. Radiat. Phys. Chem. 2020, 176, 109024. [Google Scholar] [CrossRef]
  13. Racu, A.; Stef, M.; Buse, G.; Nicoara, I.; Vizman, D. Luminescence properties and Judd–Ofelt analysis of various ErF3 concentration-doped BaF2 crystals. Materials 2021, 14, 4221. [Google Scholar] [CrossRef]
  14. Han, X.; Wang, G.; Tsuboi, T. Growth and spectral properties of Er3+/Yb3+-codoped KY(WO4)2 crystal. J. Cryst. Growth 2002, 242, 412. [Google Scholar] [CrossRef]
  15. Cheng, Z.X.; Zhang, S.J.; Song, F.; Guo, H.C.; Han, J.R.; Chen, H.C. Optical spectroscopy of Yb/Er codoped NaY(WO4)2 crystal. J. Phys. Chem. Solids 2002, 63, 2011. [Google Scholar] [CrossRef]
  16. Sardar, D.K.; Gruber, J.B.; Zandi, B.; Hutchinson, J.A.; Trussell, C.W. Judd-Ofelt analysis of the Er3+ (4f11) absorption intensities in phosphate glass:Er3+,Yb3+. J. Appl. Phys. 2003, 93, 2041. [Google Scholar] [CrossRef]
  17. Denker, B.; Galagan, B.; Ivleva, L.; Osiko, V.; Sverchkov, S.; Voronina, I.; Hellstrom, J.E.; Karlsson, G.; Laurell, F. Luminescent properties of Yb-Er:GdCa4O(BO3)3: A new crystal for eye-safe 1.5-μm lasers. Appl. Phys. B 2004, 79, 577. [Google Scholar] [CrossRef]
  18. Kaminskii, A.A. Laser crystals and ceramics: Recent advances. Laser Photonics Rev. 2007, 1, 93. [Google Scholar] [CrossRef]
  19. Buse, G.; Preda, E.; Stef, M.; Nicoara, I. Influence of Yb3+ ions on the optical properties of double-doped Er,Yb:CaF2 crystals. Phys. Scr. 2011, 83, 025604. [Google Scholar] [CrossRef]
  20. Chen, D.; Yu, Y.; Huang, F.; Huang, P.; Yang, A.; Wang, Z.; Wang, Y. Monodisperse upconversion Er3+/Yb3+:MFCl (M = Ca, Sr, Ba) nanocrystals synthesized via a seed-based chlorination route. Chem. Commun. 2011, 47, 11083. [Google Scholar] [CrossRef]
  21. Xiao, B.; Lin, Z.; Zhang, K.; Huang, Y.; Wang, G. Growth, thermal and spectral properties of Er3+-doped and Er3+/Yb3+-codoped Li3Ba2La3(WO4)8 crystals. PLoS ONE 2012, 7, e40631. [Google Scholar] [CrossRef]
  22. Kong, Q.; Wang, J.; Dong, X.; Yu, W.; Liu, G. Synthesis and luminescence properties of Yb3+-Er3+ co-doped LaOCl nanostructures. J. Mater. Sci. 2014, 49, 2919. [Google Scholar] [CrossRef]
  23. Li, N.; Shao, H.; Qi, H.; Yang, L.; Sheng, Y.; Xie, Y.; Li, D.; Yu, W.; Ma, Q.; Dong, X. A neoteric approach to achieve BaF2:Yb3+, Er3+ one-dimensional nanostructures with color-tuned up-conversion luminescence. Ceram. Int. 2022, 48, 35422. [Google Scholar] [CrossRef]
  24. Balabhadra, S.; Reid, M.; Golovko, V.; Wells, J.-P.R. Absorption spectra, defect site distribution and upconversion excitation spectra of CaF2/SrF2/BaF2:Yb3+:Er3+ nanoparticles. J. Alloys Compd. 2020, 837, 155165. [Google Scholar] [CrossRef]
  25. Madirov, E.I.; Konyushkin, V.A.; Nakladov, A.N.; Fedorov, P.P.; Bergfeldt, T.; Busko, D.; Howard, I.A.; Richards, B.S.; Kuznetsov, S.V.; Turshatov, A. Upconversion luminescence in Er3+-doped BaF2 nanoceramics. J. Mater. Chem. C 2021, 9, 3493. [Google Scholar] [CrossRef]
  26. Nicoara, I.; Stef, M.; Buse, G.; Racu, A. Growth and characterization of ErF3 doped BaF2 crystals. J. Cryst. Growth 2020, 547, 125817. [Google Scholar] [CrossRef]
  27. Nicoara, I.; Stef, M. Charge Compensating Defects Study of YbF3-Doped BaF2 Crystals Using Dielectric Loss. Phys. Status Solidi B 2016, 253, 397–403. [Google Scholar] [CrossRef]
  28. Bitam, A.; Khiari, S.; Diaf, M.; Boubekri, H.; Boluma, E.; Bensalem, C.; Guerbous, L.; Jouart, J.P. Spectroscopic Investigation of Er3⁺ Doped BaF2 Crystal. Opt. Mater. 2018, 82, 104–110. [Google Scholar] [CrossRef]
  29. Labbe, C.; Doualan, J.L.; Moncorgé, R.; Braud, A.; Camy, P. Excited-State Absorption and Fluorescence Dynamics in Er:CaF2. J. Lumin. 2018, 200, 74–80. [Google Scholar] [CrossRef]
  30. Patel, D.N.; Reddy, R.B.; Stevenson, K.N. Diode-Pumped Violet Energy Upconversion in BaF2:Er3+. Appl. Opt. 1998, 37, 7805–7810. [Google Scholar] [CrossRef]
  31. Liu, H.-W.; Sun, J.-L.; Wang, Y.-F.; Ma, X.-Y.; Li, B.; Bai, Z.-H.; Zhang, X.-Y. Dual Mode Conversion Luminescent Properties of PbF2:Er3⁺,Yb3⁺ Phosphors. Funct. Mater. Lett. 2019, 12, 1950033. [Google Scholar] [CrossRef]
  32. Qiu, J.; Jiao, Q.; Zhou, D.; Yang, Z. Recent Progress on Upconversion Luminescence Enhancement in Rare-Earth Doped Transparent Glass-Ceramics. J. Rare Earths 2016, 34, 341–356. [Google Scholar] [CrossRef]
  33. Kaczmarek, A.M.; Kaczmarek, M.K.; Deun, R. Er3⁺-to-Yb3⁺ and Pr3⁺-to-Yb3⁺ Energy Transfer for Highly Efficient Near-Infrared Cryogenic Optical Temperature Sensing. Nanoscale 2019, 11, 833–842. [Google Scholar] [CrossRef]
  34. Kasprowicz, D.; Jaroszewski, K.; Gluchowski, P.; Michalski, E.; Majchrowski, A. Efficient Yb3⁺ Sensitized Er3⁺ Emission of Bi2ZnOB2O₆:Yb3⁺/Er3⁺ Single Crystal. J. Alloys Compd. 2021, 873, 159772. [Google Scholar] [CrossRef]
  35. Nicoara, D.; Nicoara, I. An Improved Bridgman-Stockbarger Crystal-Growth System. Mater. Sci. Eng. A 1988, 102, L1–L4. [Google Scholar] [CrossRef]
  36. Judd, B.R. Optical Absorption Intensities of Rare-Earth Ions. Phys. Rev. 1962, 127, 750–761. [Google Scholar] [CrossRef]
  37. Ofelt, G.S. Intensities of Crystal Spectra of Rare-Earth Ions. J. Chem. Phys. 1962, 37, 511–520. [Google Scholar] [CrossRef]
  38. Li, H.H. Refractive Index of Alkaline Earth Halides and Its Wavelength and Temperature Derivatives. J. Phys. Chem. Ref. Data 1980, 9, 161–289. [Google Scholar] [CrossRef]
  39. Kaminskii, A.A. Crystalline Lasers: Physical Processes and Operating Schemes; CRC Press: Boca Raton, FL, USA, 1996. [Google Scholar] [CrossRef]
  40. Zhmykhov, V.; Dobretsova, E.; Tsvetkov, V.S.; Nikova, M.; Chikulina, I.; Vakalov, D.; Tarala, V.; Pyrkov, Y.; Kuznetsov, S.; Tsvetkov, V. Judd-Ofelt Analysis of High Erbium Content Yttrium-Aluminum and Yttrium-Scandium-Aluminum Garnet Ceramics. Inorganics 2022, 10, 170. [Google Scholar] [CrossRef]
  41. GoCIE V2; Justin Thomas, K.R.; Department of Chemistry, Indian Institute of Technology Roorkee, India. 2009. Available online: https://faculty.iitr.ac.in/~krjt8fcy/gocie.html (accessed on 14 February 2023).
  42. Liu, P.; Yao, Z.; Zhou, J.; Yang, Z.; Kong, L.B. Small magnetic Co-doped NZn ferrite/grapheme nanocomposites and their dual-region microwave absorption performance. J. Mater. Chem. C 2016, 4, 9738–9749. [Google Scholar] [CrossRef]
  43. Liu, F.; Liu, S.; Cui, X.; Cheng, L.; Li, H.; Wang, J.; Rao, W. Ordered domanin and microwave properties of sub-micron structured Ba(Zn1/3Ta2/3)O3 ceramics obtained by spark plasma sintering. Materials 2019, 12, 638. [Google Scholar] [CrossRef]
  44. Nicoara, I.; Munteanu, M.; Pecingina-Girjoaba, N.; Stef, M.; Lighezan, L. Dielectric spectrum of rare-earth-doped calcium fluoride crystals. J. Crystal Growth 2006, 287, 234–238. [Google Scholar] [CrossRef]
  45. Andeen, C. Cluster-Associated Relaxations in Rare-Earth-Doped Calcium Fluoride. Phys. Rev. B 1977, 16, 3762–3769. [Google Scholar] [CrossRef]
  46. Campos, V.B.; Leal Ferreira, G.F. Dipolar studies in CaF2 with Ce3+. J. Phys. Chem. Solids 1974, 35, 905–908. [Google Scholar] [CrossRef]
  47. Edgar, A.; Welsh, H.K. Dielectric relaxation and EPR studies of Gd3⁺-Fᵢ dipoles in strontium and barium fluoride. J. Phys. C: Solid State Phys. 1979, 12, 703–711. [Google Scholar] [CrossRef]
Figure 1. (a) Preparation stage of the Bridgman setup to reach the melting temperature in the graphite heater. (b) The temperature gradient, measured at the bottom of the crucible during the crystallization process. (c) The cleaved sample (slice 12).
Materials 18 01915 g001
Figure 2. Optical absorption spectra of double-doped BaF2:(Er,Yb) crystal at room temperature in (a) 230–400 nm spectral region and (b) 440–1600 nm.
Materials 18 01915 g002
Figure 3. (a) Room temperature emission spectrum of BaF2: (0.05 mol% YbF3, 0.2 mol% ErF3) crystal under excitation at λexc = 290 nm. (b) The emission mechanism of Er3+ ions at λexc = 290 nm.
Materials 18 01915 g003
Figure 4. (a) Room temperature emission spectrum of BaF2: (0.05 mol% YbF3, 0.2 mol% ErF3) crystal under excitation at λexc = 378 nm. (b) The emission mechanism of Er3+ ions at λexc = 378 nm. (c) CIE chart for the emissions obtained under 378 nm excitation.
Materials 18 01915 g004
Figure 5. (a) Dielectric spectra of real part, ε1, and (b) imaginary part, ε2, of the complex dielectric constant at various frequencies ranging 1 ÷ 20 kHz (inset: C3v site-symmetry), (c) determination of the relaxation parameters, E and τ0.
Materials 18 01915 g005
Figure 6. Plot of (T tan δ) versus 1000/T for f = 1 kHz.
Materials 18 01915 g006
Table 1. The mean wavelength, the wavelength range, and the integrated absorption cross-section of the measured and calculated absorption line strengths of the selected absorption peaks of BaF2: (0.05 mol% YbF3, 0.2 mol% ErF3) crystal.
Trasition,
4I15/2 
λmean
(nm)
Wavelength
Range
(nm)
= α (λ) d λ
(×10−20 cm2·nm)
S D E m e a s
(×10−20 cm2)
S D E c a l c
(×10−20 cm2)
4I13/215301450–160014.3530.4050.444
4F9/2648620–6951.5760.3090.330
2H(2)11/2518502–5332.4710.6040.603
4F7/2486476–4981.2710.3310.226
Table 2. The Judd–Ofelt parameters, Ωt (expressed in 10−20 cm2) and the spectroscopic quality factors, χ.
Ωt
(10−20 cm2)
BaF2:
0.2 mol% ErF3 +
0.05 mol% YbF3
(This Paper)
BaF2:
0.15 mol% ErF3
[13]
BaF2:
0.2 mol% ErF3
[12]
BaF2:Er3+
[1]
BaF2:
1.96 mol% ErF3,
2.91 mol% YbF3
[25]
YSAG:
Er3+
[40]
Ω20.58983 ± 0.080260.67490.9321.980.950.4681
Ω40.38250 ± 0.057510.11180.1531.180.490.8378
Ω60.27115 ± 0.129810.55251.0741.201.450.6741
χ = Ω461.410.200.140.980.341.24
Table 3. The radiative emission probabilities, the branching ratios, and the calculated and measured radiative lifetimes for transitions where luminescence was observed.
Transitionλem.
[nm]
AJJ′
(s−1)
βτrad
(ms)
This Work
τexp
(ms)
4S3/24I15/2536191.80.663.41.9 [13]
0.96 [12]
0.38 [19]
0.56 [28]
2H(2)11/24I15/2518733.40.881.91.351 [13]
0.96 [12]
0.39 [19]
2G(1)9/24I15/2405209.10.422.0-
2P3/24I15/232179.20.091.10.906 [13]
Disclaimer/Publisher’s Note: The statements, opinions and data contained in all publications are solely those of the individual author(s) and contributor(s) and not of MDPI and/or the editor(s). MDPI and/or the editor(s) disclaim responsibility for any injury to people or property resulting from any ideas, methods, instructions or products referred to in the content.

