

Study on the Bonding Performance of Reinforced Concrete with Reef Limestone Under the Combined Effects of Dry and Wet Carbonation
Abstract
:1. Introduction
2. Experimental Overview
2.1. Preparation of Test Pieces
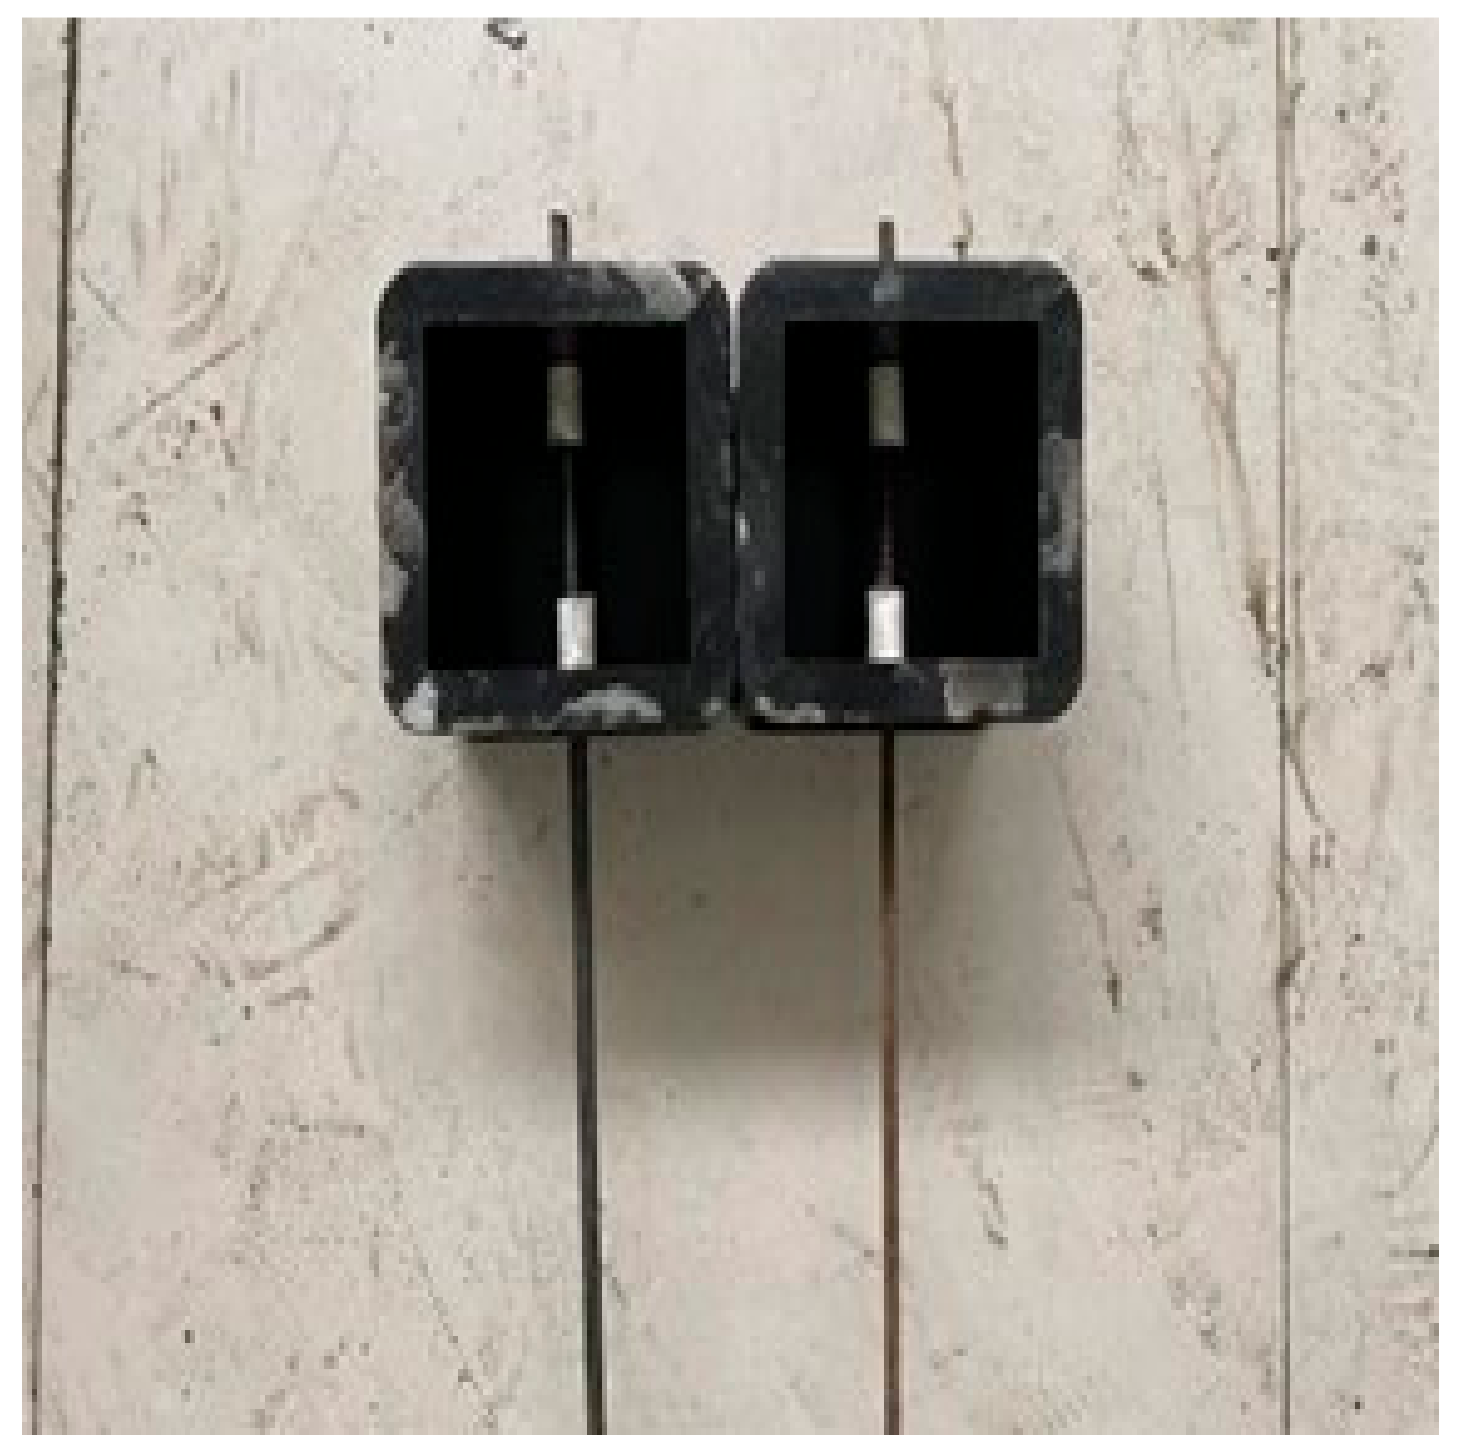
2.2. Anchorage Dry–Wet Carbonation Cycle Test
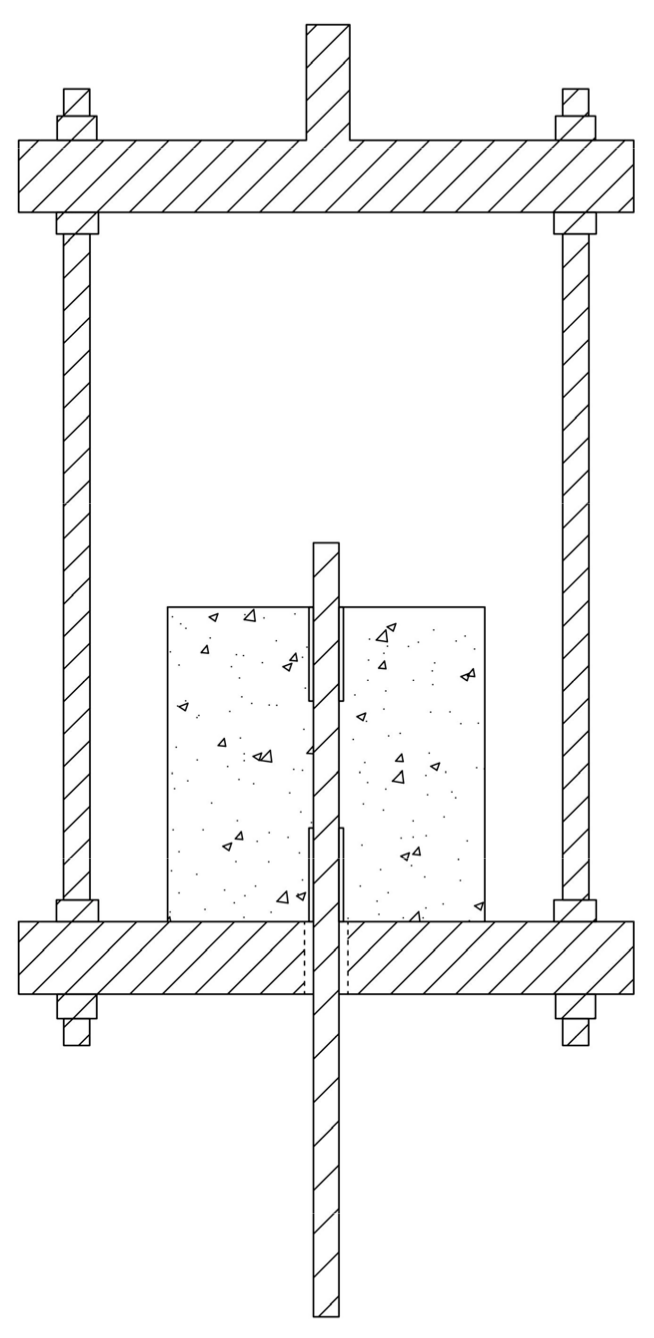
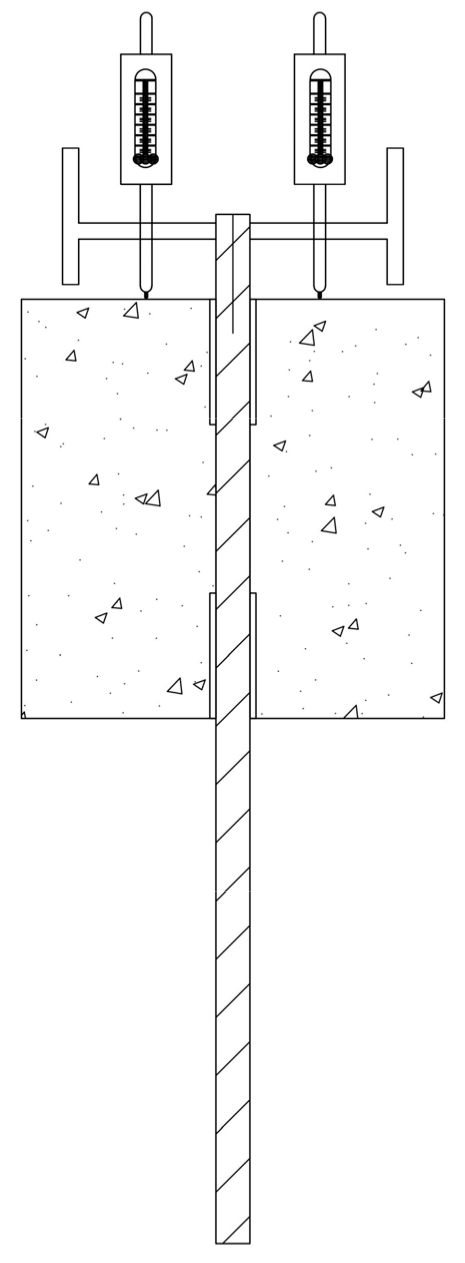
2.3. Pull-Out Test of Anchorage
2.3.1. Test Scheme
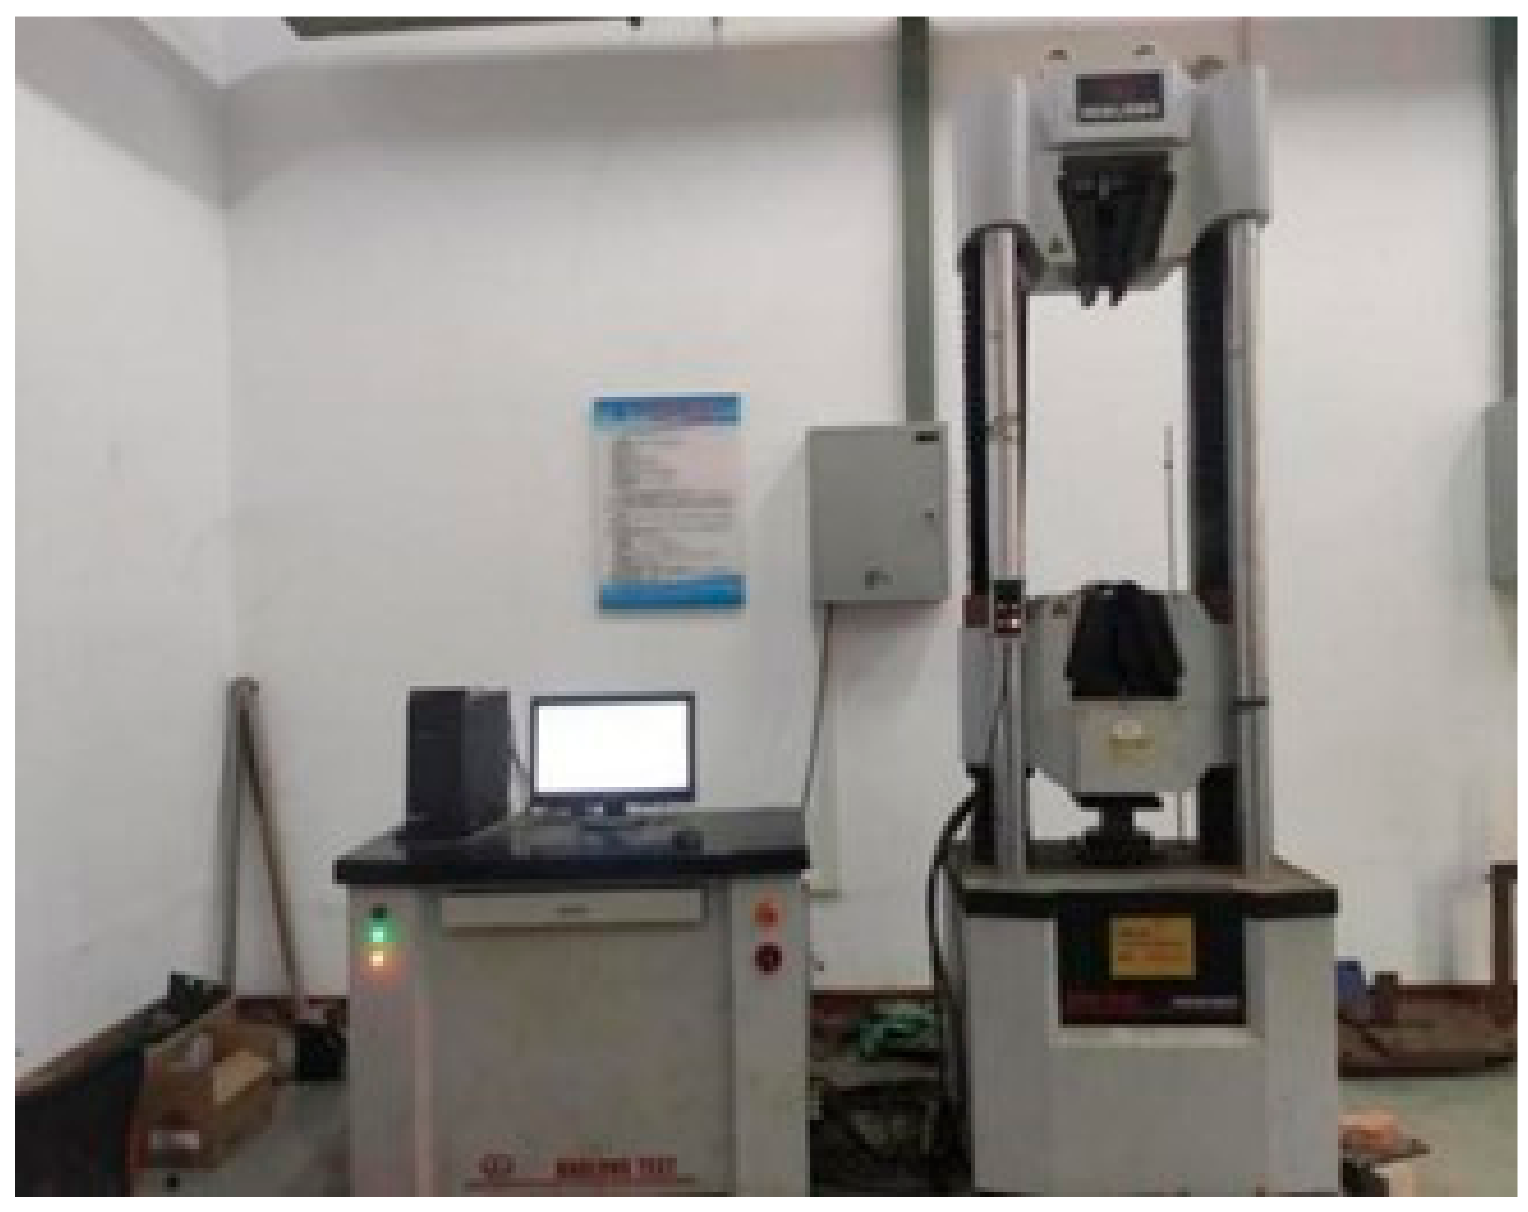
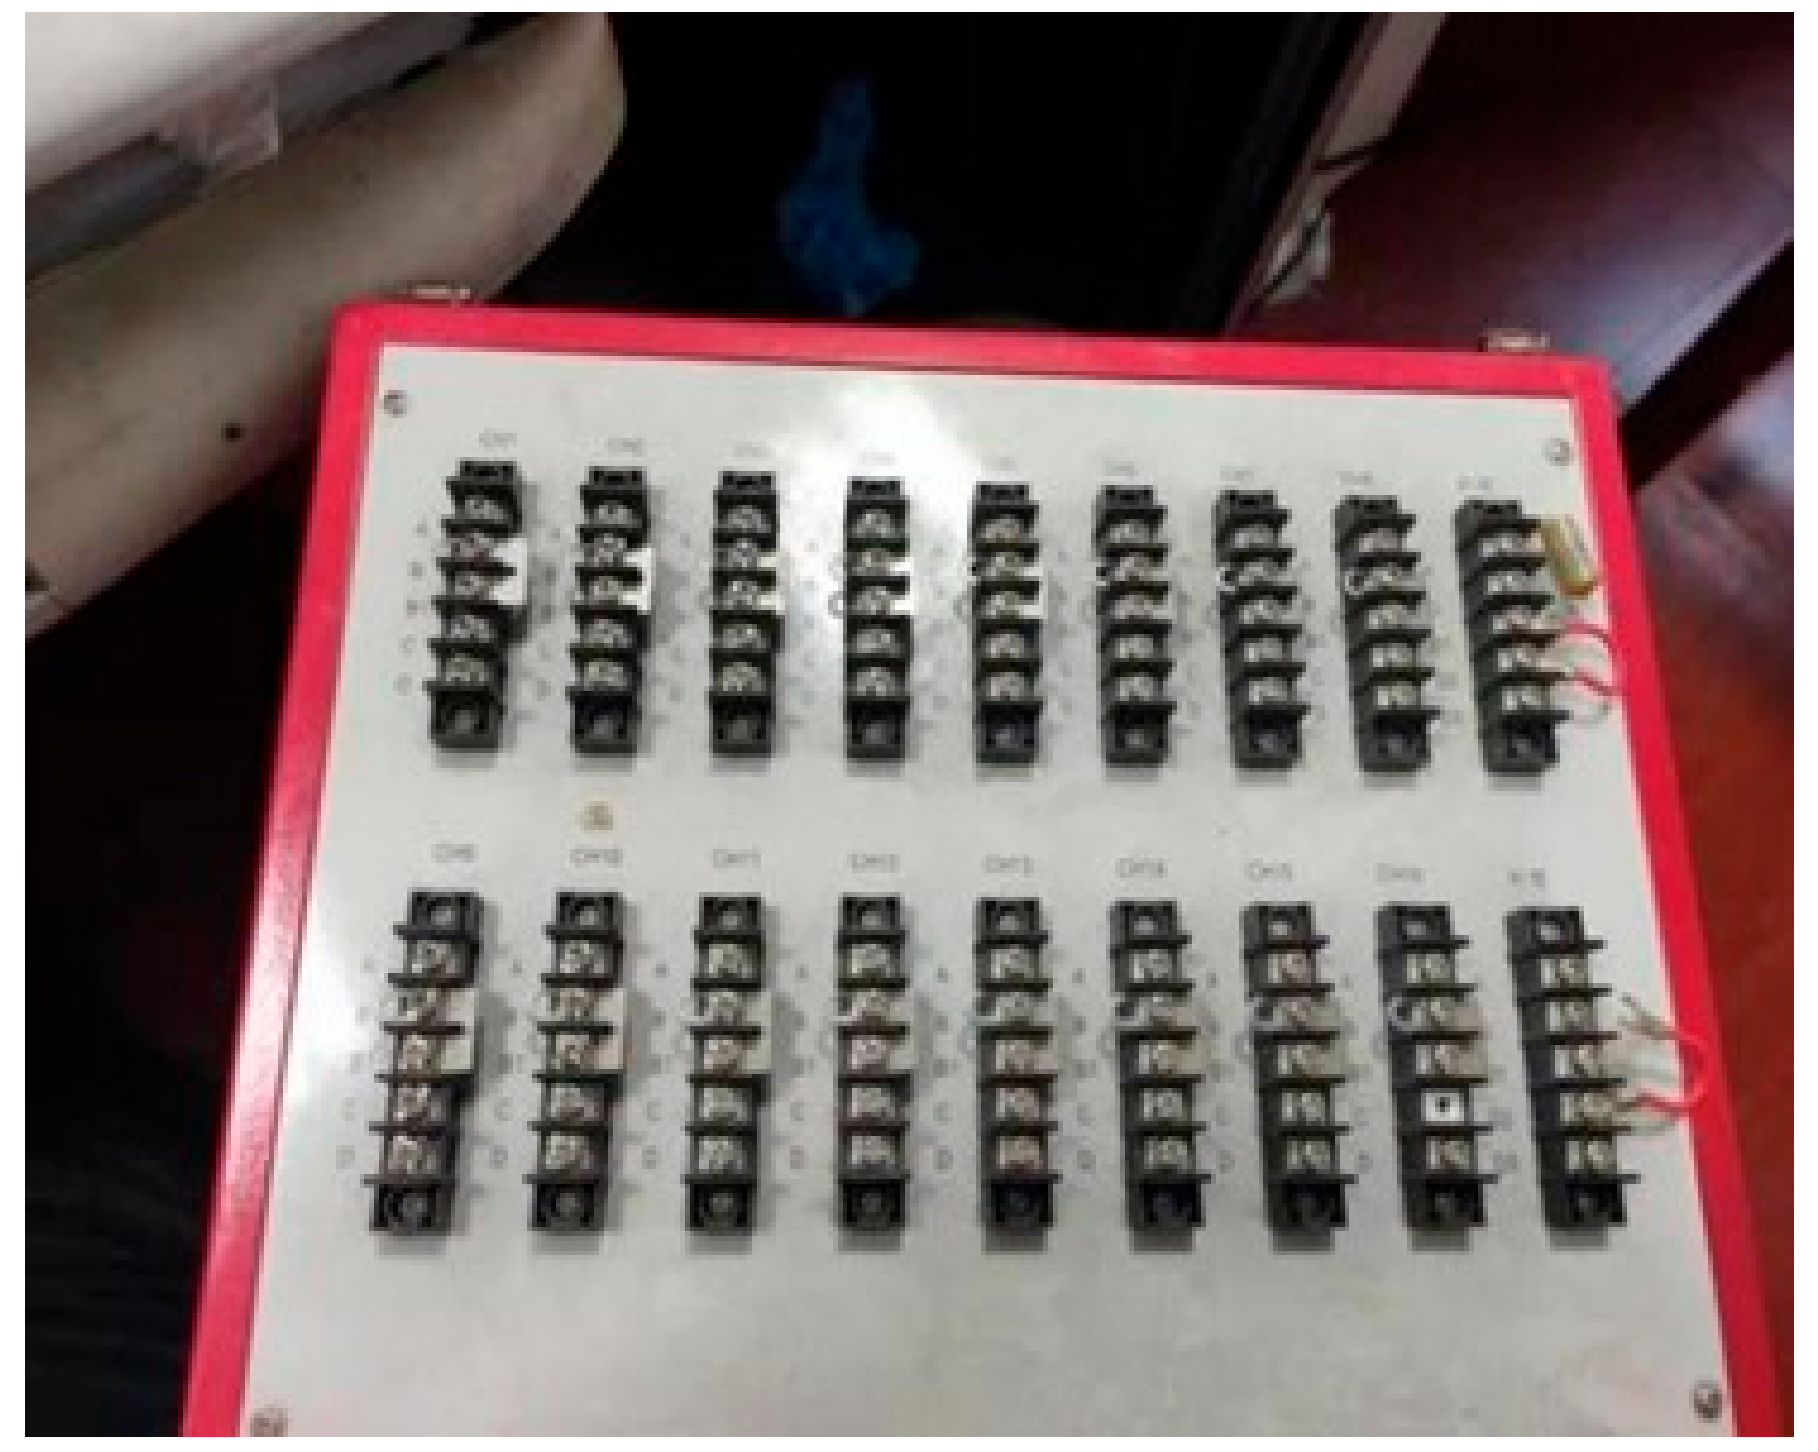
2.3.2. Equipment
3. Test Results and Analysis
3.1. Macro-Micro Deterioration Analysis Under Dry–Wet Carbonation Cycles
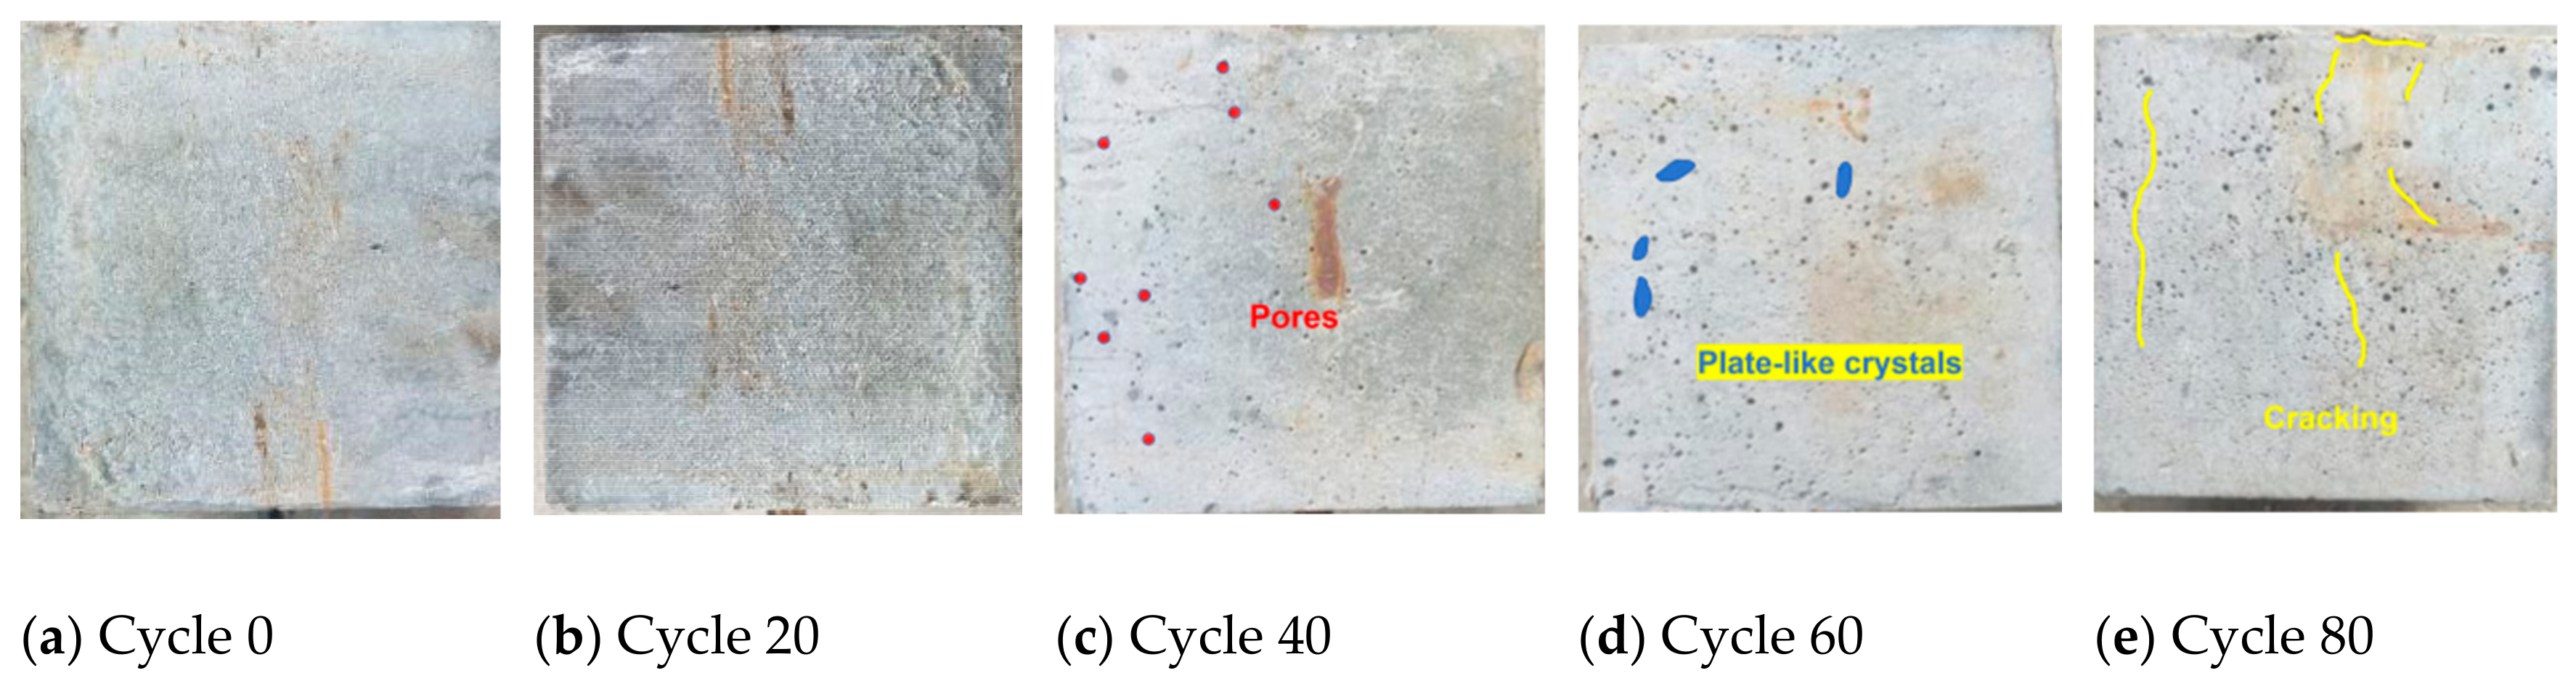
3.1.1. Surface-State Changes
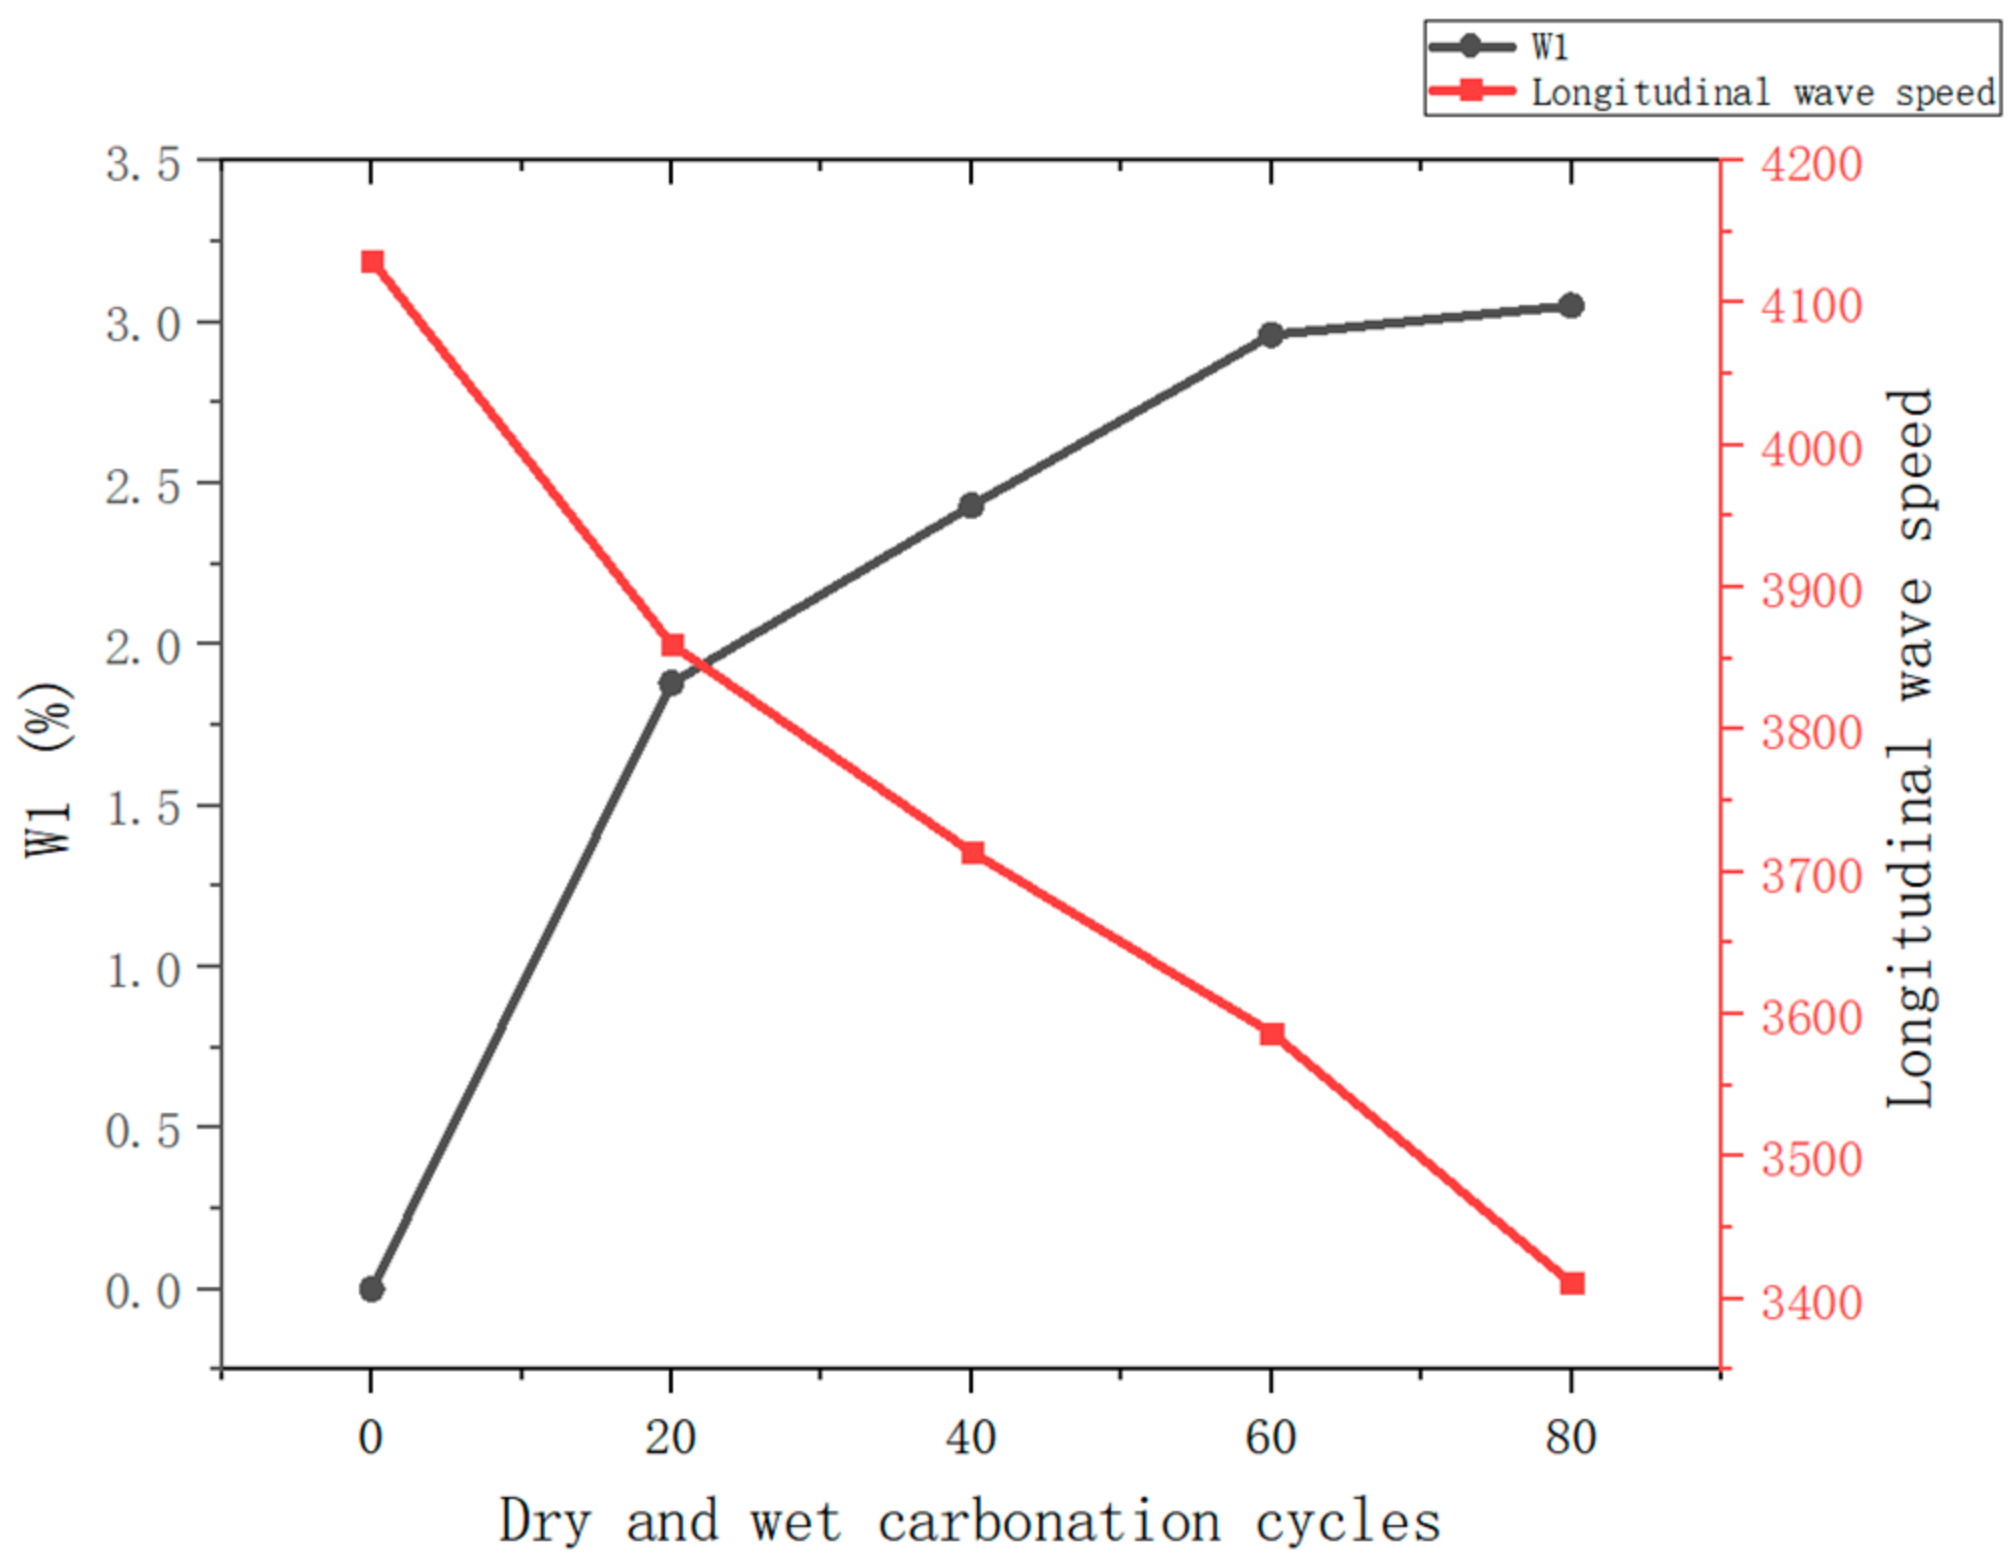
3.1.2. Changes in Mass
3.1.3. Carbonation Mechanism of Concrete
3.2. Analysis of Bonding Performance of Reef Limestone Anchors Under Dry–Wet Carbonation Cycles
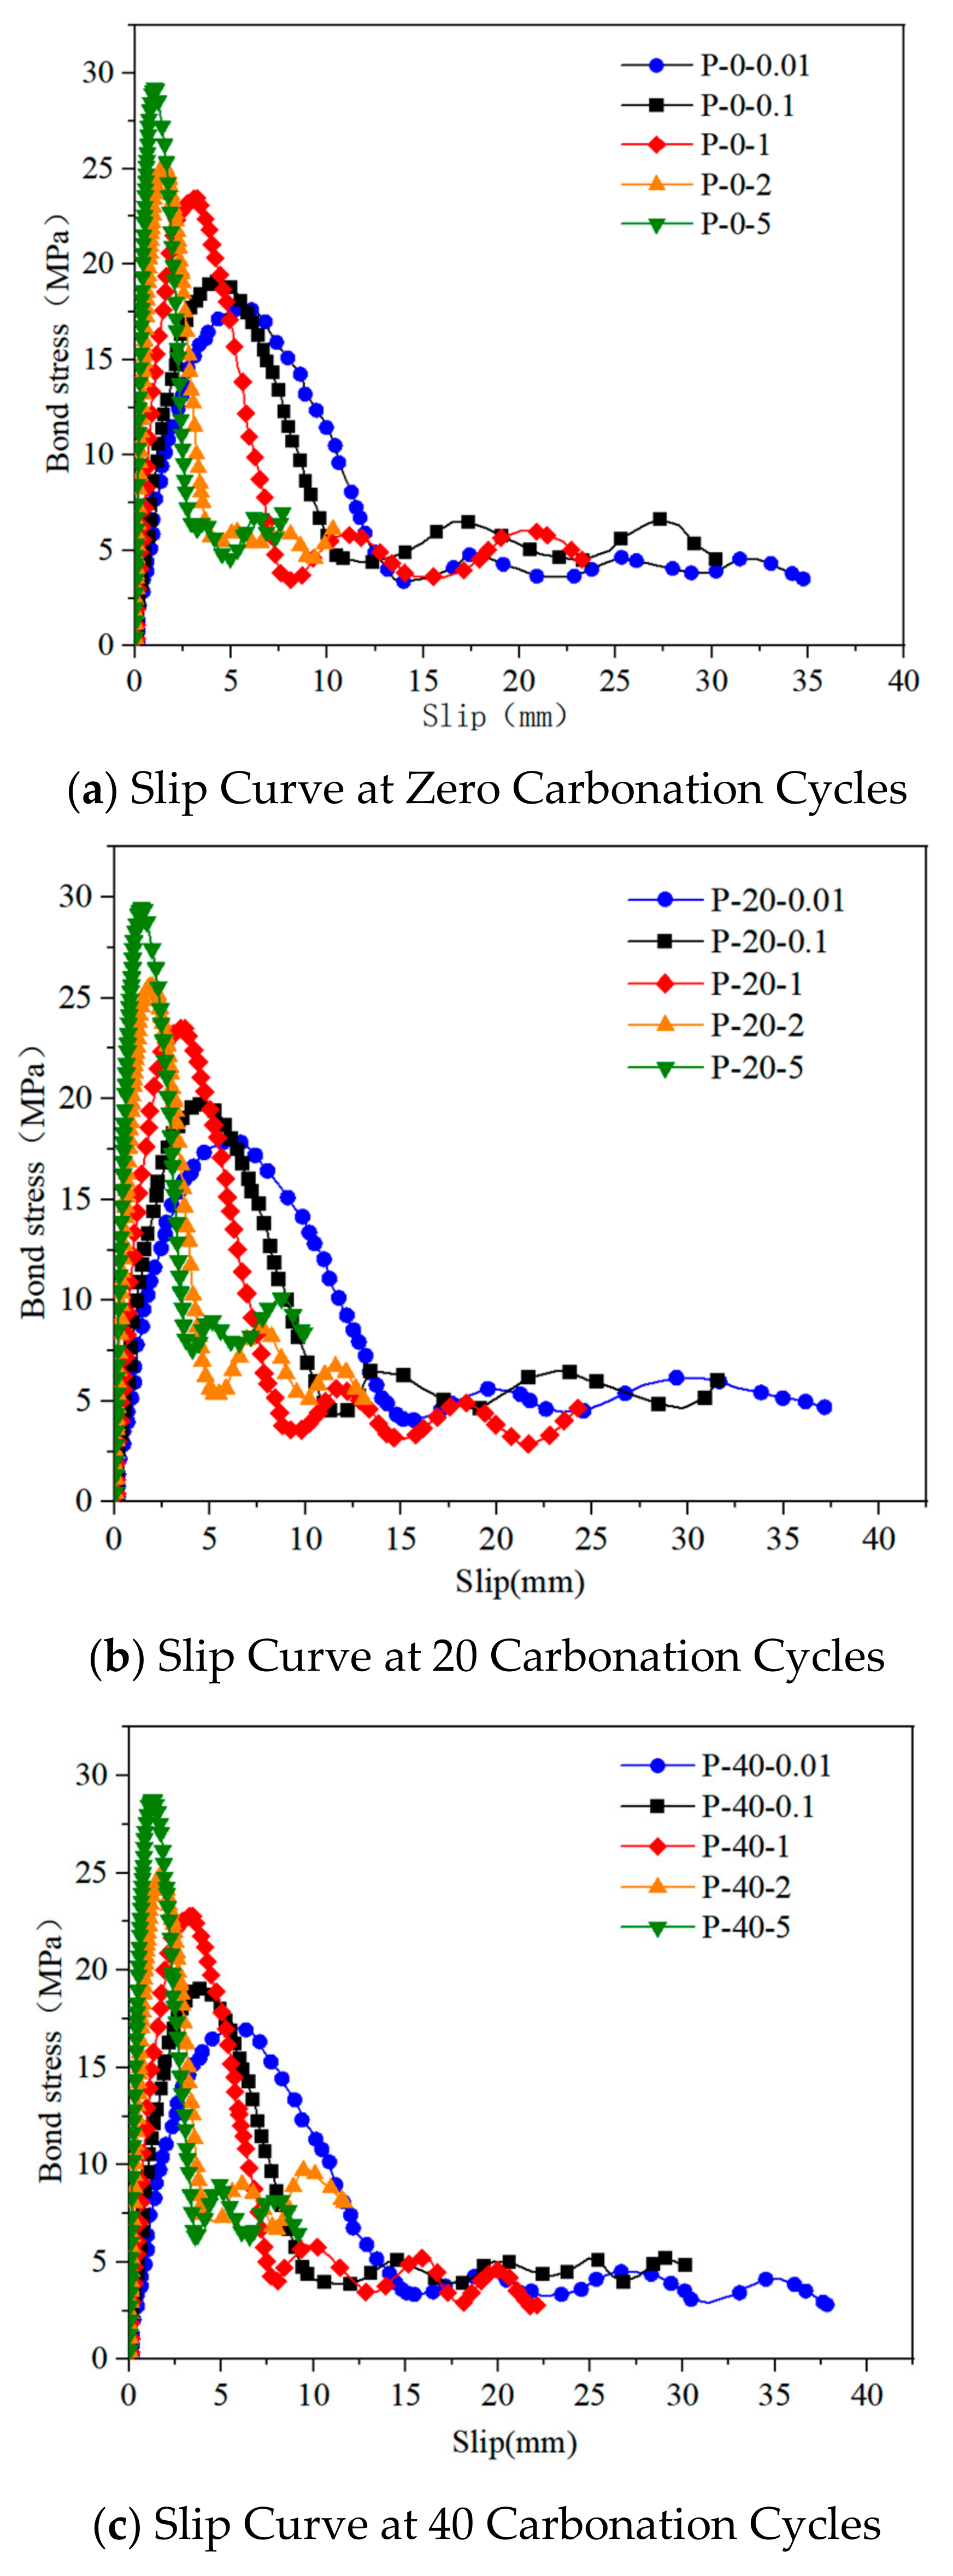
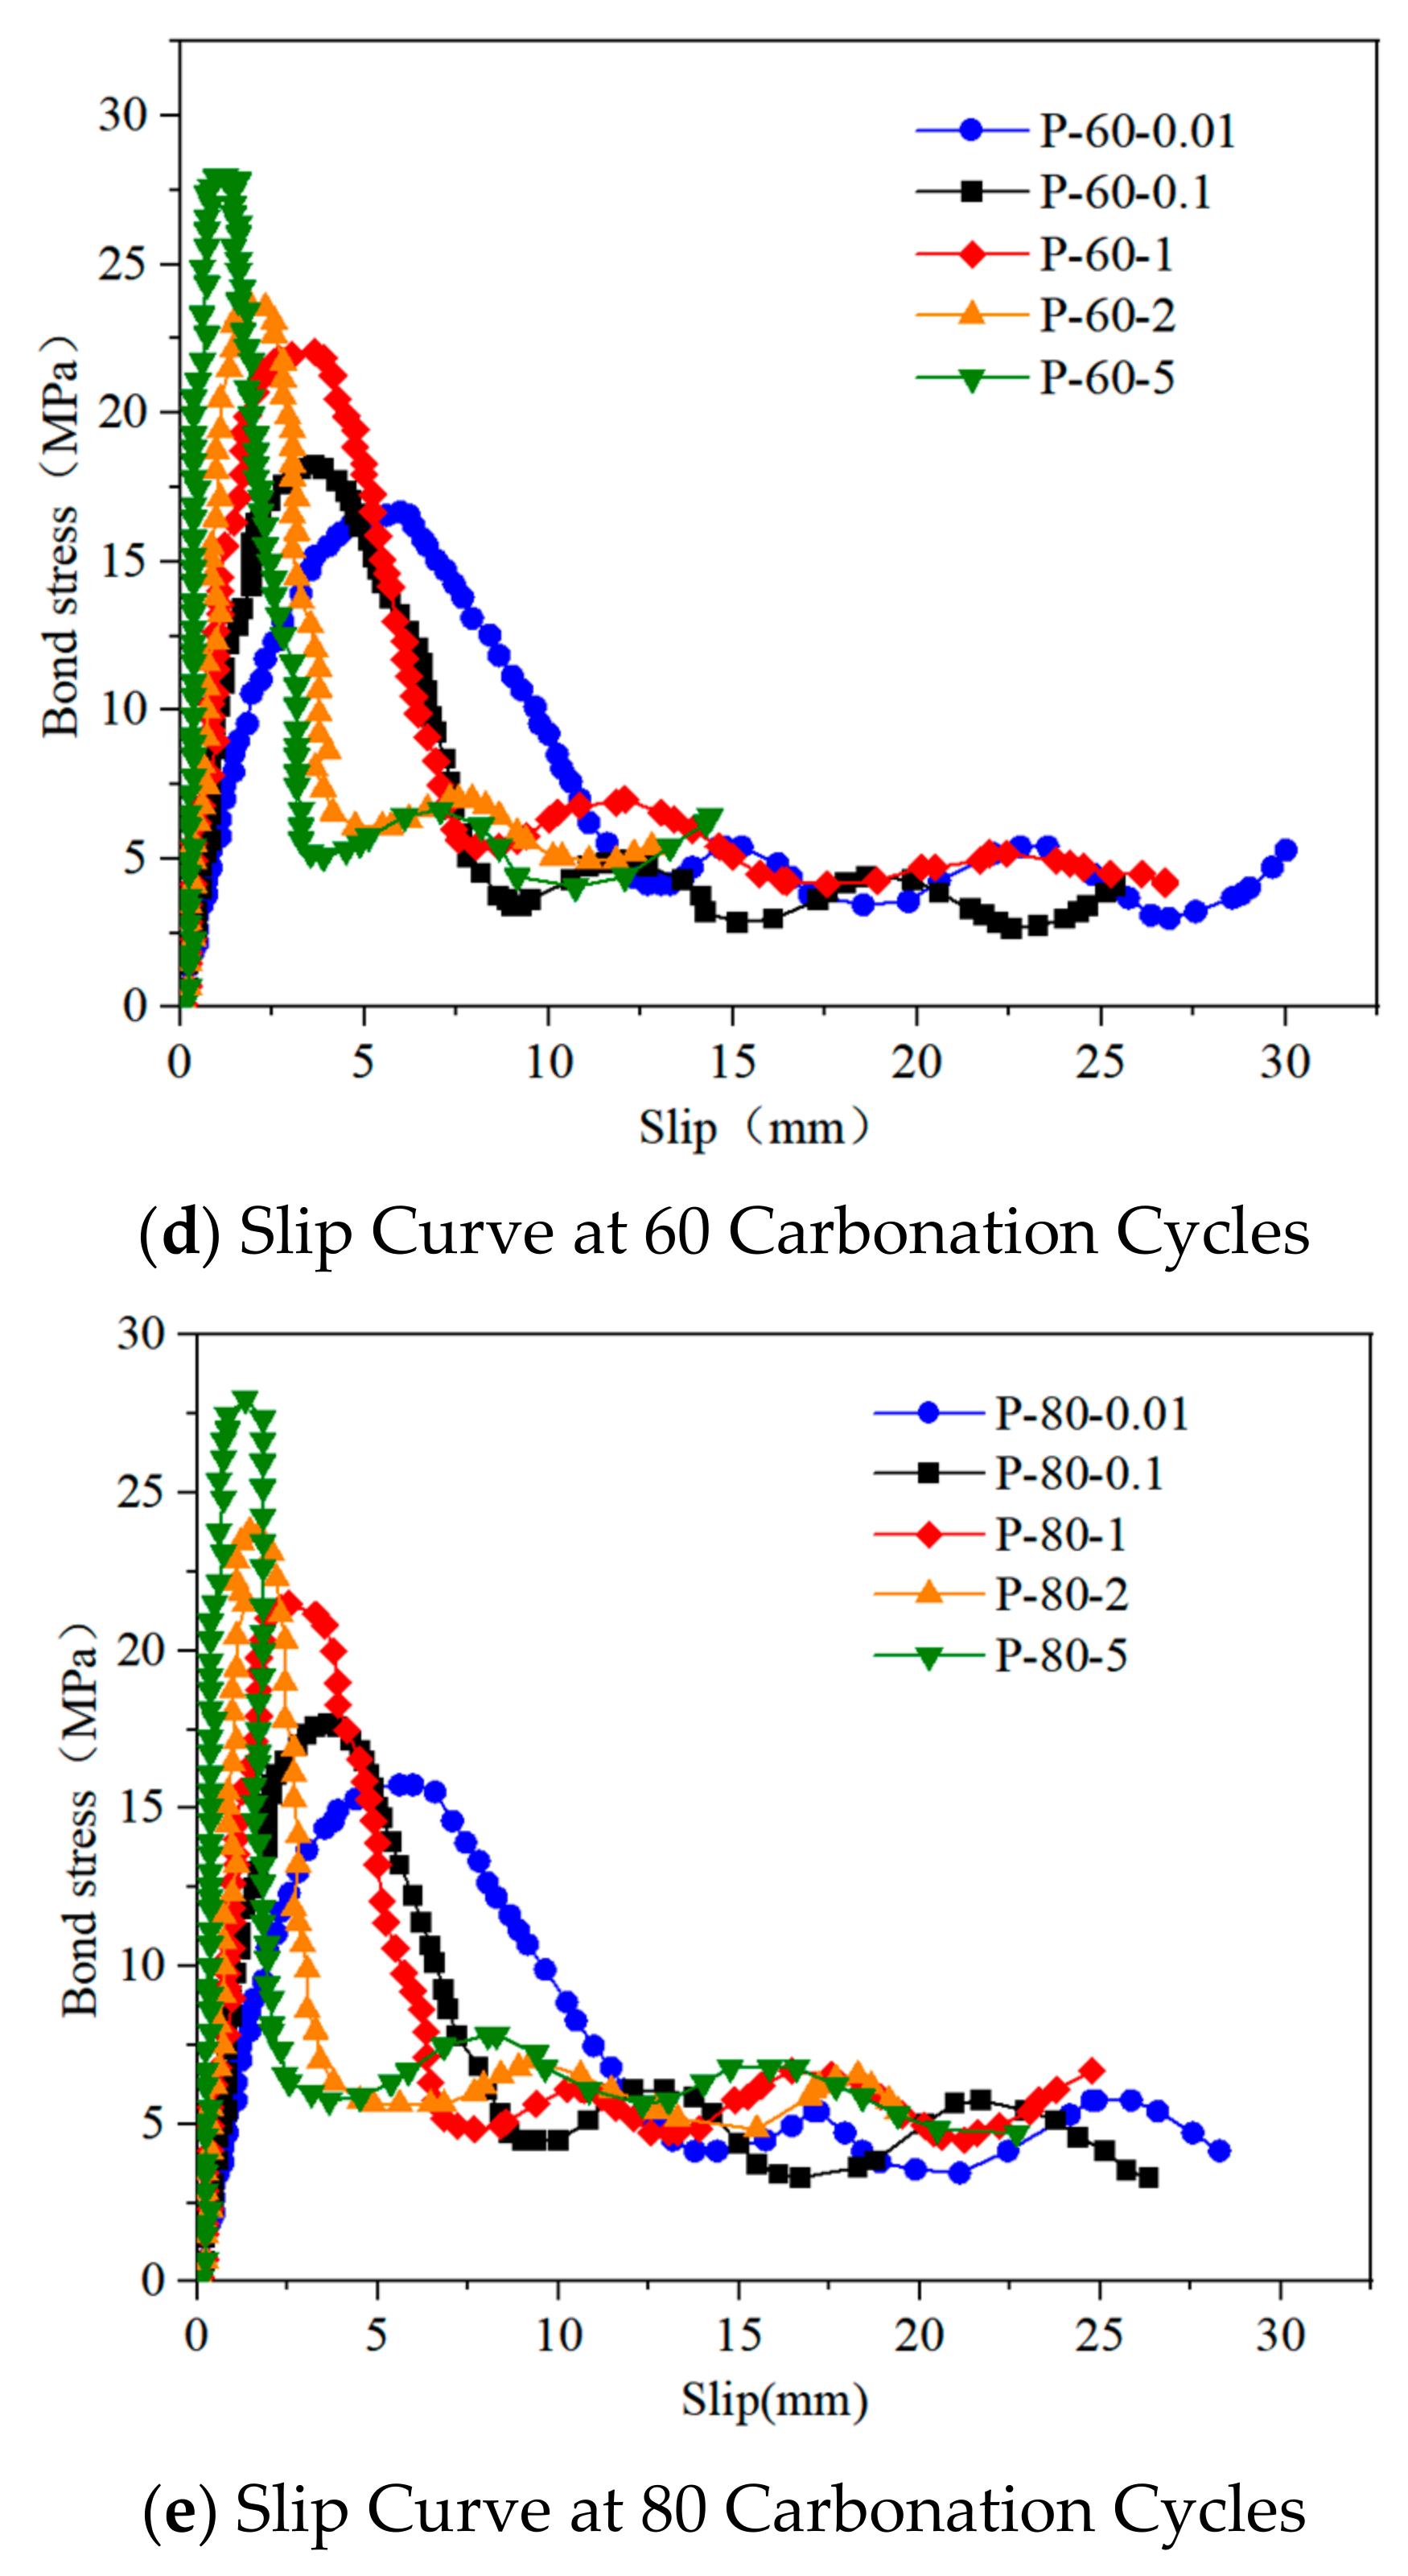
3.2.1. Load-Slip Curve
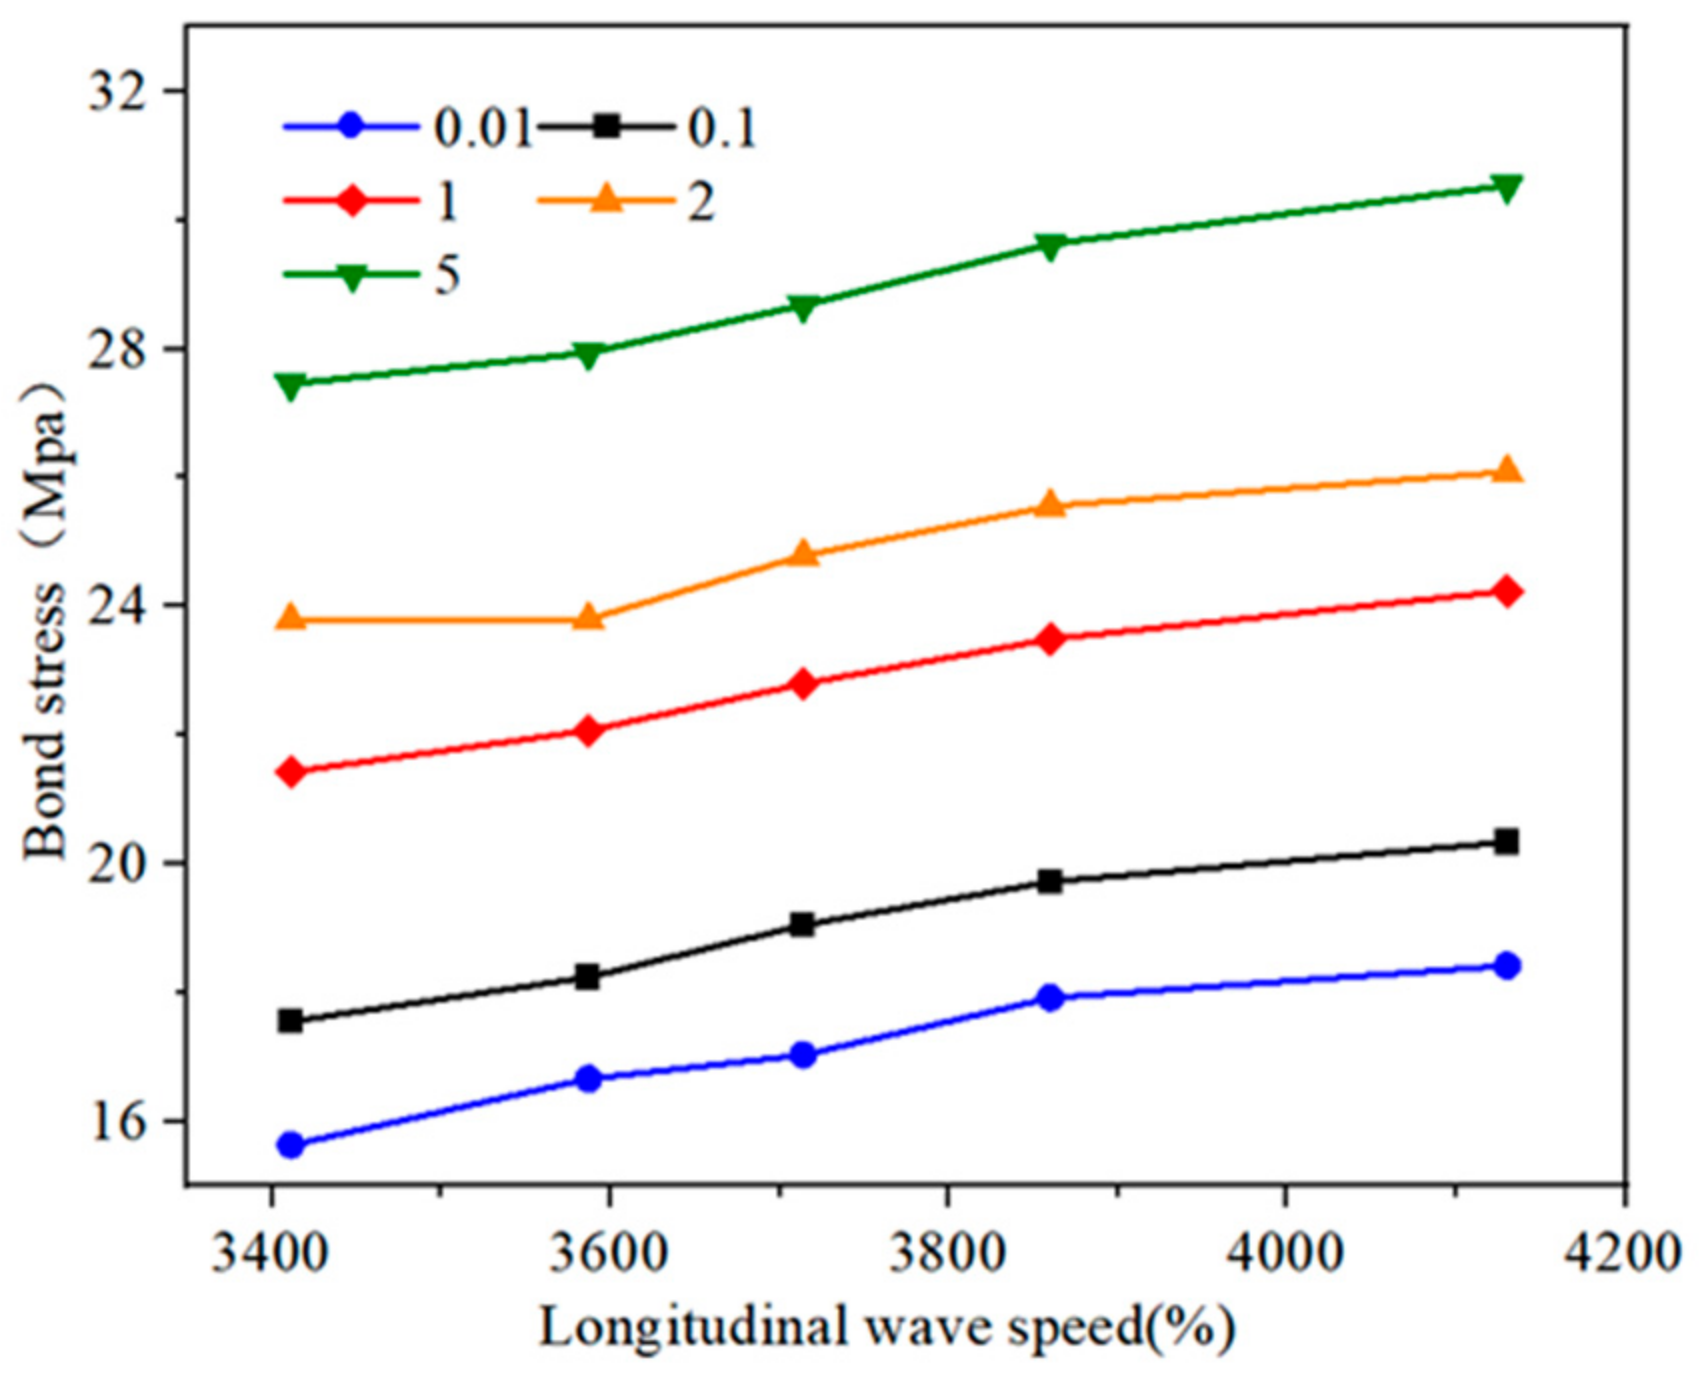
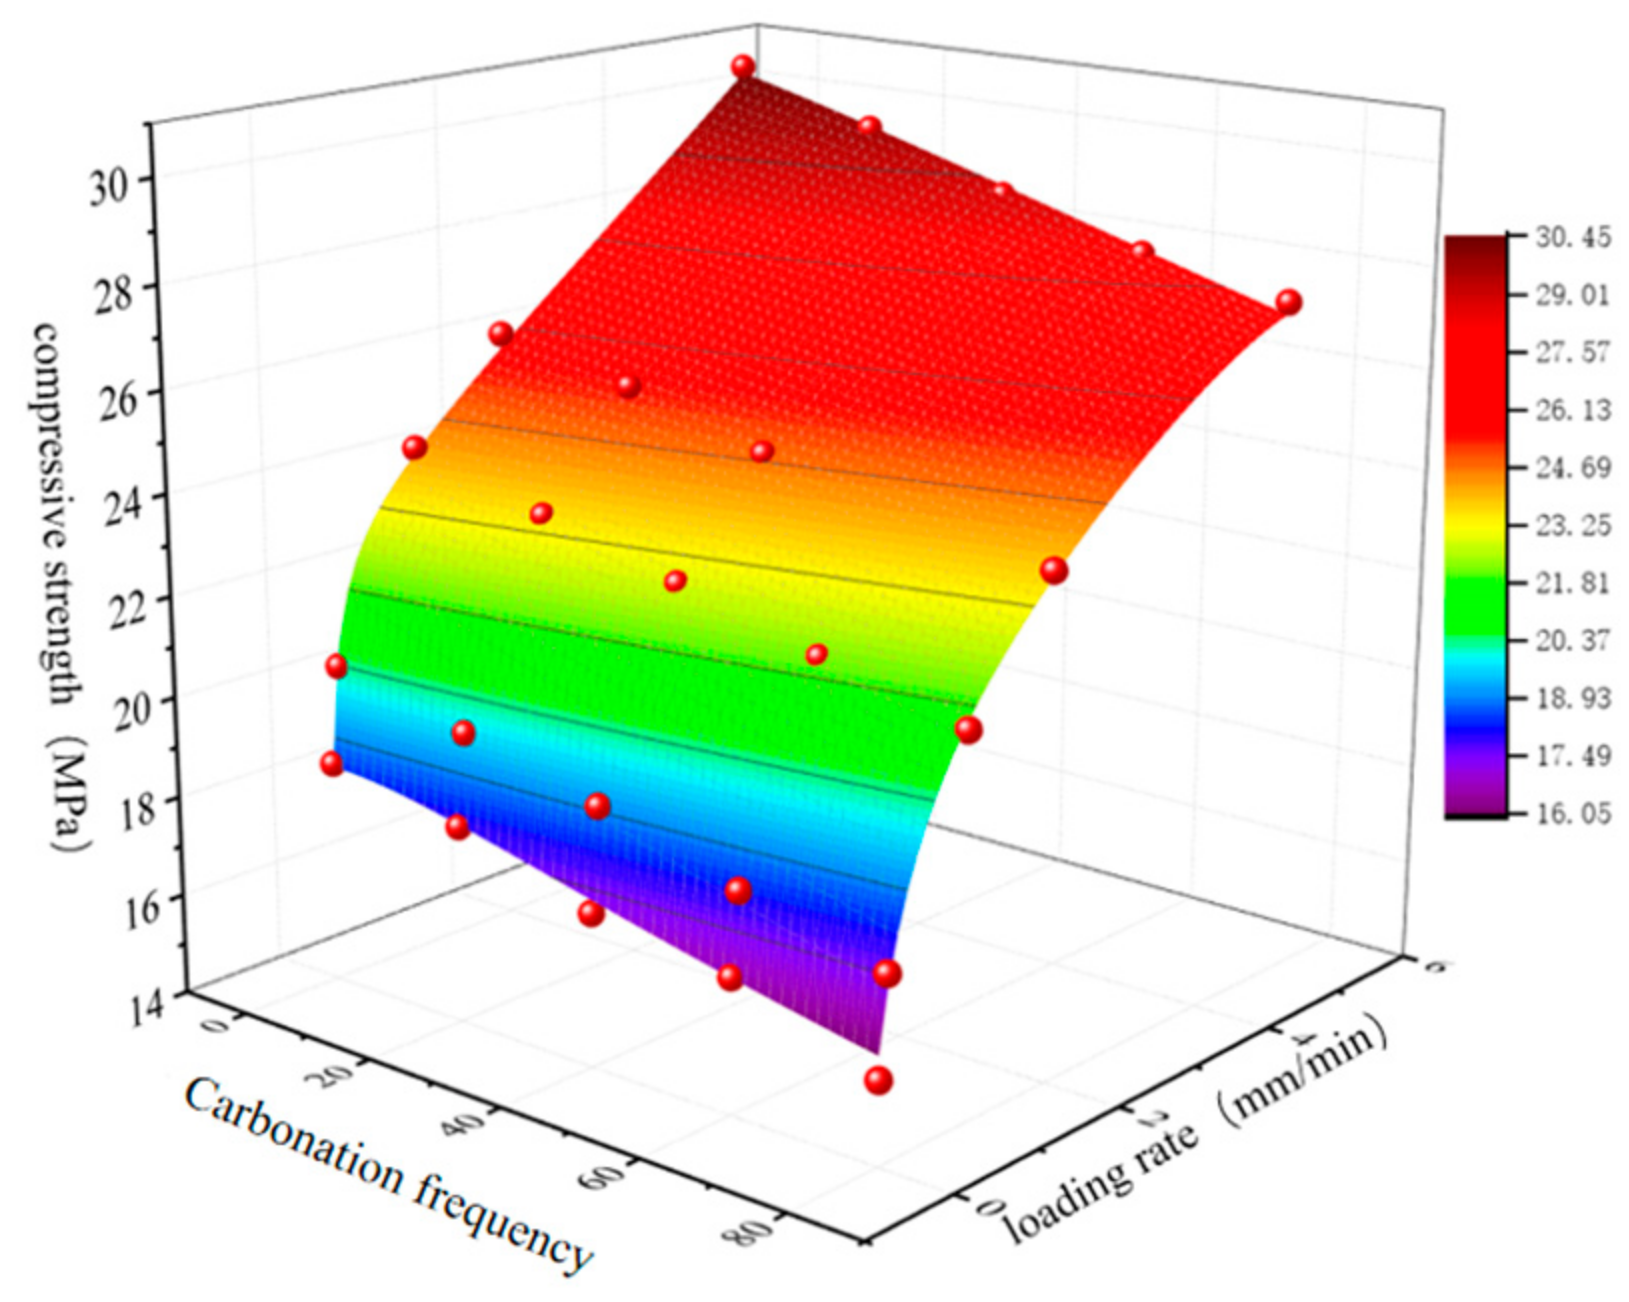
3.2.2. Analysis of Bond Strength Characteristics and Failure Modes
3.2.3. Failure Mode Analysis
4. Deterioration Model of Bond Slip for Reef Limestone Anchors Under Dry–Wet Carbonation Coupling Effects
5. Conclusions
Author Contributions
Funding
Institutional Review Board Statement
Informed Consent Statement
Data Availability Statement
Conflicts of Interest
References
- Cheng, S.; Shui, Z.; Sun, T.; Yu, R.; Zhang, G.; Ding, S. Effects of fly ash, blast furnace slag and metakaolin on mechanical properties and durability of coral sand concrete. Appl. Clay Sci. 2017, 141, 111–117. [Google Scholar] [CrossRef]
- Lyu, B.; Wang, A.; Zhang, Z.; Liu, K.; Xu, H.; Shi, L.; Sun, D. Coral aggregate concrete: Numerical description of physical, chemical and morphological properties of coral aggregate. Cem. Concr. Compos. 2019, 100, 25–34. [Google Scholar] [CrossRef]
- Zhang, B.; Cheng, Y.; Zhu, H. Bond performance between BFRP bars and alkali-activated seawater coral aggregate concrete. Eng. Struct. 2023, 279, 115596. [Google Scholar] [CrossRef]
- Zhang, B.; Zhu, H. Compressive stress–strain behavior of slag-based alkali-activated seawater coral aggregate concrete after exposure to seawater environments. Constr. Build. Mater. 2023, 367, 130294. [Google Scholar] [CrossRef]
- Cao, Y.; Bao, J.; Zhang, P.; Sun, Y.; Cui, Y. A state-of-the-art review on the durability of seawater coral aggregate concrete exposed to marine environment. J. Build. Eng. 2022, 60, 105199. [Google Scholar] [CrossRef]
- Zhang, B.; Zhu, H. Durability of seawater coral aggregate concrete under seawater immersion and dry-wet cycles. J. Build. Eng. 2023, 66, 105894. [Google Scholar] [CrossRef]
- Kakooei, S.; Akil, H.M.; Dolati, A.; Rouhi, J. The corrosion investigation of rebar embedded in the fibers reinforced concrete. Constr. Build. Mater. 2012, 35, 564–570. [Google Scholar] [CrossRef]
- Bao, J.; Wei, J.; Zhang, P.; Zhuang, Z.; Zhao, T. Experimental and theoretical investigation of chloride ingress into concrete exposed to real marine environment. Cem. Concr. Compos. 2022, 130, 104511. [Google Scholar] [CrossRef]
- Liu, S. Research on the Action of Transmission Performance and Thecritical Concentration of Chlorine Ion in Concrete Under the Dry-Wet Circulation Environment; Xi’an University of Architecture and Technology: Xi’an, China, 2014. [Google Scholar]
- Luo, D.; Li, F.; Niu, D. Study on the deterioration of concrete performance in saline soil area under the combined effect of high low temperatures, chloride and sulfate salts. Cem. Concr. Compos. 2024, 150, 105531. [Google Scholar] [CrossRef]
- Wang, L.; Gao, M.; Zhang, J. Effect of continuous loading coupled with wet–dry cycles on strength deterioration of concrete. Sustainability 2022, 14, 13407. [Google Scholar] [CrossRef]
- Wang, H.L.; Dong, Y.S.; Sun, X.Y.; Jin, W.L. Damage mechanism of concrete deteriorated by sulfate attack in wet-dry cycle environment. J. Zhejiang Univ. 2012, 46, 1255–1261. [Google Scholar]
- Jiang, L.; Niu, D.T. Study of constitutive relation of concrete under sulfate attack and drying-wetting cycles. J. China Univ. Min. Technol. 2017, 46, 66–73. [Google Scholar]
- Chen, X.; Yu, H.; Ma, H.; Xu, Y.; Gao, Y.; Mei, Q.; Dou, X.; Da, B. Analysis of service life and reliability of C50CASC structures in the splash zone of the South China Sea. Constr. Build. Mater. 2024, 441, 137524. [Google Scholar] [CrossRef]
- Qi, G. Experimental Research on Chloride Ion Erosion of Concretein the Marine Atmospheric Environment; Xi’an University of Architecture and Technology: Xi’an, China, 2012. [Google Scholar]
- Tian, Y.; Zhang, G.; Ye, H.; Zeng, Q.; Zhang, Z.; Tian, Z.; Jin, X.; Jin, N.; Chen, Z.; Wang, J. Corrosion of steel rebar in concrete induced by chloride ions under natural environments. Constr. Build. Mater. 2023, 369, 130504. [Google Scholar] [CrossRef]
- Liu, J.; Fan, X.; Liu, J.; Jin, H.; Zhu, J.; Liu, W. Investigation on mechanical and micro properties of concrete incorporating seawater and sea sand in carbonized environment. Constr. Build. Mater. 2021, 307, 124986. [Google Scholar] [CrossRef]
- Qian, R.; Li, Q.; Fu, C.; Zhang, Y.; Wang, Y.; Jin, N.; Jin, X. Investigations on atmospheric carbonation corrosion of concrete structure beam exposed to real marine-environment for 7 years. J. Build. Eng. 2023, 71, 106517. [Google Scholar] [CrossRef]
- Karimi, A.; Ghanooni-Bagha, M.; Ramezani, E.; Javid, A.A.S.; Samani, M.Z. Influential factors on concrete carbonation: A review. Mag. Concr. Res. 2023, 75, 1212–1242. [Google Scholar] [CrossRef]
- Du, T.; Cai, Y.; Guo, Y.; Chen, J.; Chen, S.; Yuan, M.; Qu, F. Time-dependent model for in-situ concrete carbonation depth under combined effects of temperature and relative humidity. Case Stud. Constr. Mater. 2025, e04379. [Google Scholar] [CrossRef]
- ASTM D1141-98; Standard Practice for Thepreparation of Substitute Ocean Water. American Society for Testing and Materials: West Conshohocken, PA, USA, 2013.
- Influence of interfacial bond between rebar and concrete on the lateral resistance of RC columns under different loading rates. J. Build. Eng. 2024, 96, 110393. [CrossRef]


| Name | Ordinary Portland Cement | Coarse Aggregate | Fine Aggregate | Groundwater | Fly Ash | Slag | Crack-Resistant Water-Proofing Agent |
|---|---|---|---|---|---|---|---|
| Quantity | 780 | 700 | 300 | 250 | 70 | 150 | 15 |
| Coarse Aggregate | Bulk Density (kg/m3) | Apparent Density (kg/m3) | Porosity % | Moisture Content % | Water Absorption % |
| 873 | 1939.6 | 59 | 13.2 | 22.9 | |
| Fine Aggregate | Bulk Density (kg/m3) | Apparent Density (kg/m3) | Fineness Modulus | Moisture Content % | Water Absorption % |
| 1392 | 2698.5 | 2.5 | 2.9 | 3.7 |
| Steel Bar Model | Yield Strength/MPa | Tensile Strength/MPa | Elongation/% | Elastic Modulus |
|---|---|---|---|---|
| HRB400 | 472 | 630 | 22.5 | 208 |
| NaCl | MgCl2 | Na2SO4 | CaCl2 | KCl | NaHCO3 | KBr |
|---|---|---|---|---|---|---|
| 24.53 | 5.20 | 4.09 | 1.16 | 0.695 | 0.201 | 0.101 |
| Sample Number | Number of Immersions | Number of Dryings | Number of Carbonation Cycles | Number of Specimens |
|---|---|---|---|---|
| P-0 | 0 | 0 | 0 | 15 |
| P-20 | 20 | 20 | 20 | 15 |
| P-40 | 40 | 40 | 40 | 15 |
| P-60 | 60 | 60 | 60 | 15 |
| P-80 | 80 | 80 | 80 | 15 |
| Specimen Number | Peak Average Bond Stress (MPa) | Mean Value | Failure Mode | ||
|---|---|---|---|---|---|
| P-0-0.01 | 18.32 | 18.61 | 18.35 | 18.42 | Concrete Splitting |
| P-0-0.1 | 21.56 | 21.78 | 17.68 | 20.34 | |
| P-0-1 | 23.96 | 24.57 | 24.19 | 24.24 | |
| P-0-2 | 26.15 | 26.38 | 25.76 | 26.09 | |
| P-0-5 | 29.65 | 30.81 | 31.16 | 30.54 | |
| P-20-0.01 | 18.05 | 17.87 | 17.84 | 17.92 | Concrete Splitting |
| P-20-0.1 | 18.91 | 19.59 | 20.66 | 19.72 | |
| P-20-1 | 22.57 | 23.94 | 23.96 | 23.49 | |
| P-20-2 | 24.62 | 26.57 | 25.49 | 25.56 | |
| P-20-5 | 28.84 | 29.82 | 30.23 | 29.63 | |
| P-40-0.01 | 16.68 | 17.45 | 16.96 | 17.03 | Concrete Splitting |
| P-40-0.1 | 19.11 | 18.73 | 19.31 | 19.05 | |
| P-40-1 | 22.51 | 22.52 | 23.37 | 22.8 | |
| P-40-2 | 24.83 | 24.75 | 24.79 | 24.79 | |
| P-40-5 | 28.91 | 28.59 | 28.54 | 28.68 | |
| P-60-0.01 | 16.00 | 17.02 | 16.96 | 16.66 | Concrete Splitting |
| P-60-0.1 | 17.95 | 18.23 | 18.54 | 18.24 | |
| P-60-1 | 21.81 | 21.98 | 22.42 | 22.07 | |
| P-60-2 | 23.49 | 23.93 | 23.93 | 23.8 | |
| P-60-5 | 28.06 | 27.91 | 27.85 | 27.94 | |
| P-80-0.01 | 15.59 | 15.42 | 15.88 | 15.63 | Concrete Splitting |
| P-80-0.1 | 16.99 | 17.75 | 17.91 | 17.55 | |
| P-80-1 | 21.53 | 21.09 | 21.67 | 21.43 | |
| P-80-2 | 23.52 | 24.09 | 23.76 | 23.79 | |
| P-80-5 | 26.61 | 28.13 | 27.64 | 27.46 | |
Disclaimer/Publisher’s Note: The statements, opinions and data contained in all publications are solely those of the individual author(s) and contributor(s) and not of MDPI and/or the editor(s). MDPI and/or the editor(s) disclaim responsibility for any injury to people or property resulting from any ideas, methods, instructions or products referred to in the content. |
© 2025 by the authors. Licensee MDPI, Basel, Switzerland. This article is an open access article distributed under the terms and conditions of the Creative Commons Attribution (CC BY) license (https://creativecommons.org/licenses/by/4.0/).
Share and Cite
Xiong, Y.; Meng, F.; Qu, D.; Mao, M.; Zhang, J. Study on the Bonding Performance of Reinforced Concrete with Reef Limestone Under the Combined Effects of Dry and Wet Carbonation. Materials 2025, 18, 1963. https://doi.org/10.3390/ma18091963
Xiong Y, Meng F, Qu D, Mao M, Zhang J. Study on the Bonding Performance of Reinforced Concrete with Reef Limestone Under the Combined Effects of Dry and Wet Carbonation. Materials. 2025; 18(9):1963. https://doi.org/10.3390/ma18091963
Chicago/Turabian StyleXiong, Yiyang, Fei Meng, Dengxing Qu, Mingju Mao, and Jinrui Zhang. 2025. "Study on the Bonding Performance of Reinforced Concrete with Reef Limestone Under the Combined Effects of Dry and Wet Carbonation" Materials 18, no. 9: 1963. https://doi.org/10.3390/ma18091963
APA StyleXiong, Y., Meng, F., Qu, D., Mao, M., & Zhang, J. (2025). Study on the Bonding Performance of Reinforced Concrete with Reef Limestone Under the Combined Effects of Dry and Wet Carbonation. Materials, 18(9), 1963. https://doi.org/10.3390/ma18091963