3.2. Fundamental Optical Properties
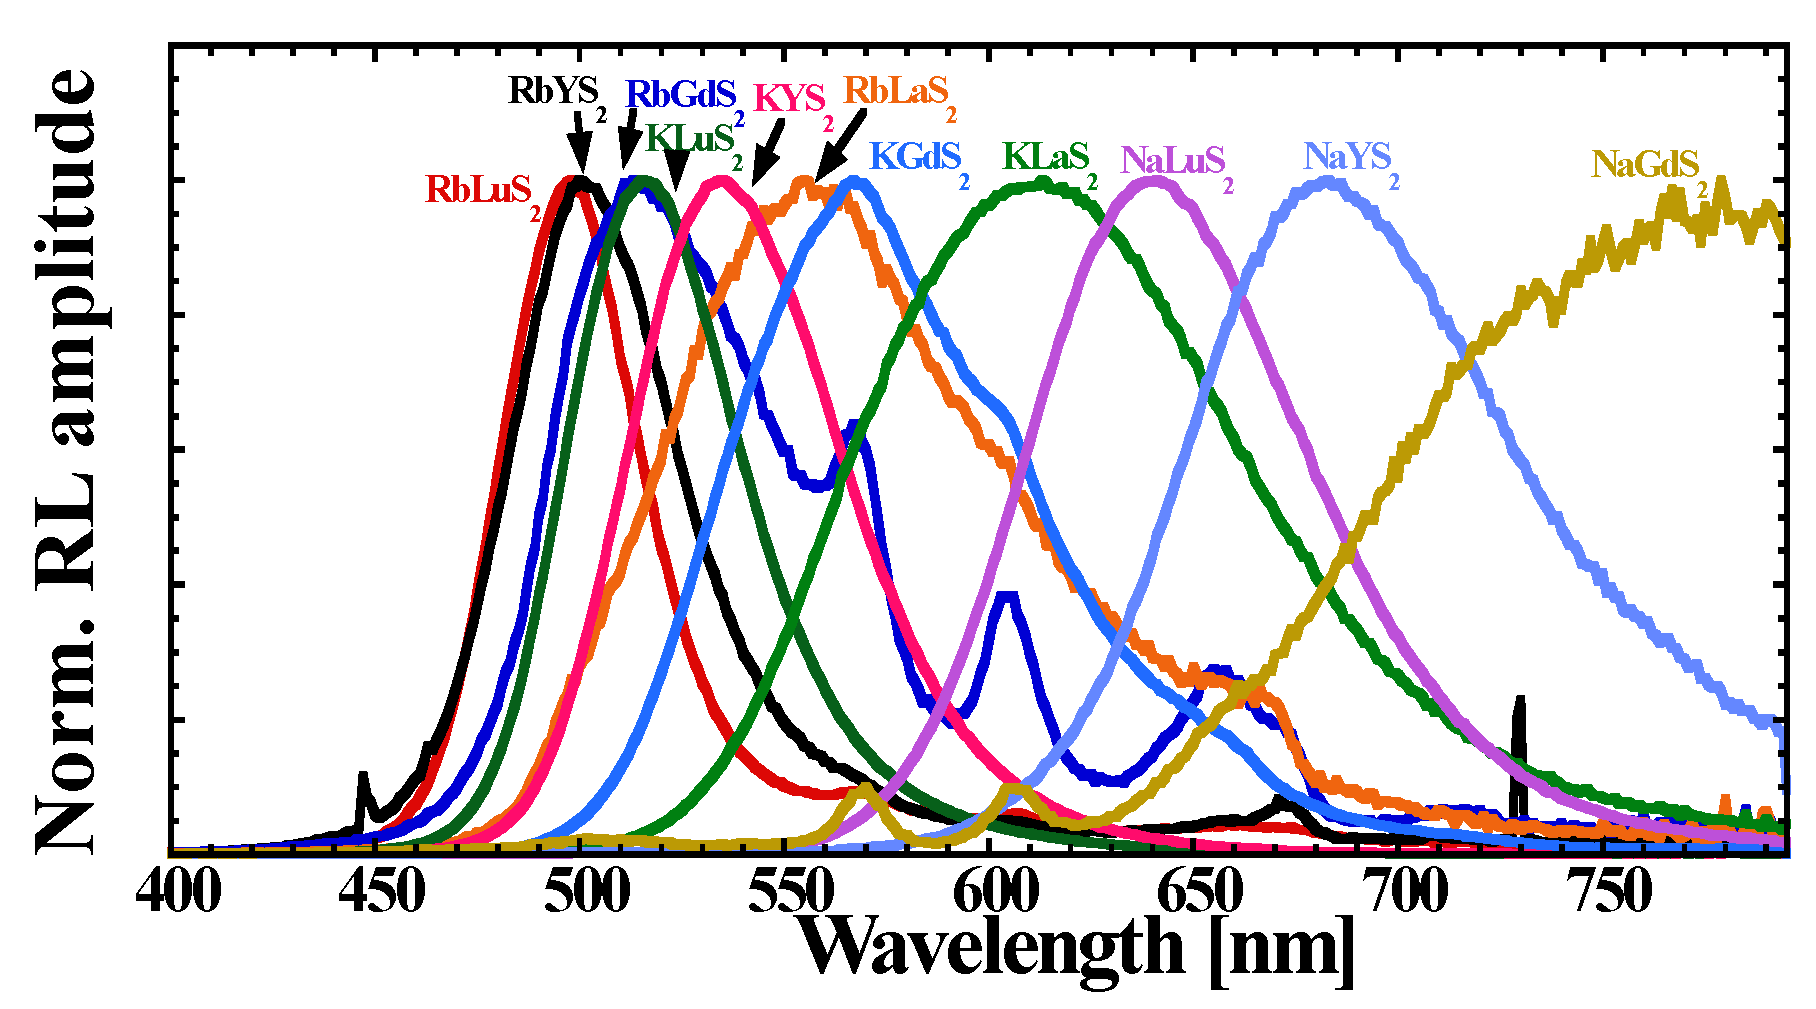
Room temperature (RT) RL spectra of ALnS
2:Eu are shown in
Figure 3. All the spectra are dominated by a broad band, which we assign to the dipole allowed Eu
2+ 5d-4f transition, also based on our previous work [
27]. The positions of the maximum shifts from 498 nm (RbLuS
2:Eu) to 779 nm (NaGdS
2:Eu), for details see
Table 3, are most probably due to the changes in the crystal field strength of different sulfide hosts (see below). It is to be noted that the europium emission in RbLaS
2:Eu (1%) was claimed to be quenched at RT [
24], probably due to heavy concentration quenching as ntense Eu
2+ emission is observed here (0.05% sample). This is fully supported by the concentration dependence measurement performed [
27]. There is a trend of the RT RL intensity reduction in the series ALuS
2-AYS
2-AGdS
2-ALaS
2 (in the sense of increasing Ln
3+ radius [
39]) for all the A = Rb, K, Na cations. A comparison in the Rb-K-Na series only at RT is rather speculative as a different degree of thermal quenching and/or ionization can occur. The RL spectrum of RbGdS
2:Eu is partially contaminated by the Sm
3+ 4f-4f emission lines in the 550–750 nm region. Scintillation light yield of 35.000 ph/MeV for KLuS
2:Eu (0.05%) has been shown [
16], which, together with high RL intensity compared to Bi
4Ge
3O
12 (BGO) standard, allows the usage of the Eu
2+-doped ALnS
2 compounds as X-ray/γ-ray phosphors.
NaLaS
2:Eu sample shows no RT Eu
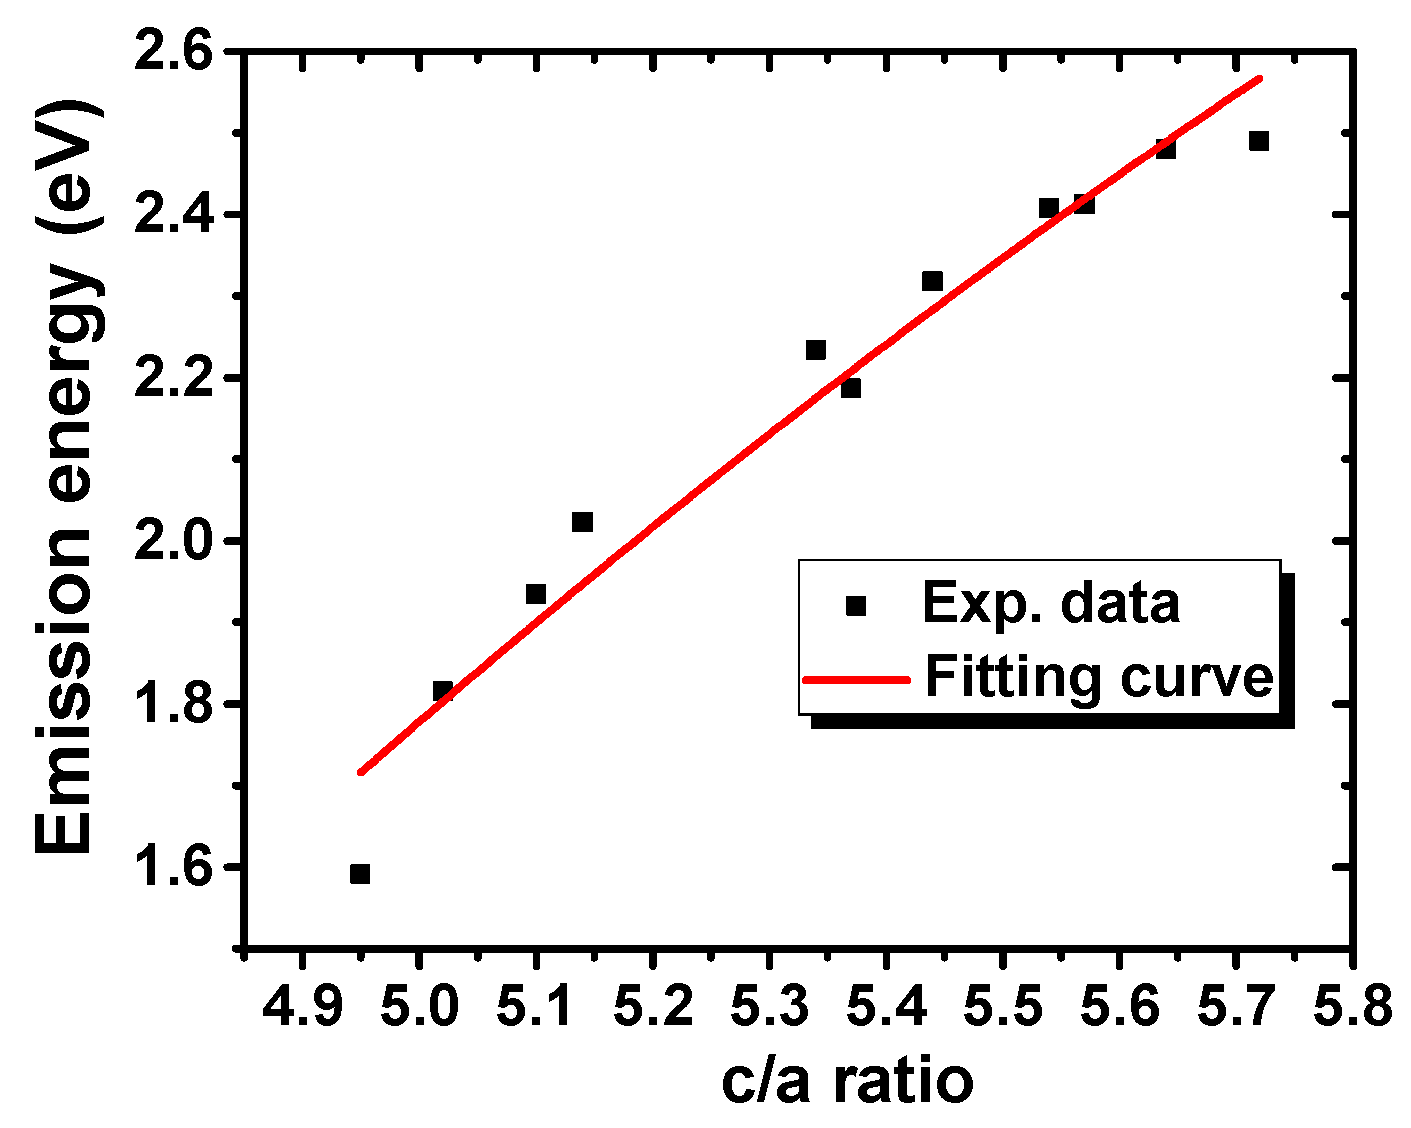
2+ emission under the X-ray excitation which may be caused by its crystallization in a cubic structure instead of the rhombohedral structure. Another possible explanation takes into account the fact that the emission can be positioned even beyond 800 nm, where our instrumental setup is insensitive. However, for ALnS
2:Eu samples crystallizing in the rhombohedral structure, rather interesting dependence of emission wavelength on their hexagonality (
c/
a) was found for the first time, see
Figure 4. The observed positions of Eu
2+ 5d-4f emission band(s) in ALnS
2 should be related to their crystalline structure and crystal field. Thus, correlation between the energy of Eu
2+ emission peak maximum
Eem and structural parameters (
Table 2) was sought. In the plot of
Eem versus either
d(Ln–S) or
d(M–S), large discontinuities occur between ALnS
2 with different A, so the Eu
2+ 5d-4f emission energy cannot be a simple function of
d. However, the
c/
a ratio (hexagonality,
Figure 4) and the S–A–S angle around the alkali metal ion φ
1,2(A) were found to be strongly correlated to
Eem. The dependence on
c/
a was investigated according to crystal field theory.
Figure 3.
Room temperature radioluminescence (RT RL) spectra (40 kV, 15 mA) of ALnS
2:Eu; data of KLuS
2:Eu after [
27].
Figure 3.
Room temperature radioluminescence (RT RL) spectra (40 kV, 15 mA) of ALnS
2:Eu; data of KLuS
2:Eu after [
27].
Figure 4.
Emission maxima as a function of hexagonality (c/a) for the ALnS2:Eu.
Figure 4.
Emission maxima as a function of hexagonality (c/a) for the ALnS2:Eu.
Table 3.
Optical properties of ALnS2:Eu.
Table 3.
Optical properties of ALnS2:Eu.
| Compound | Eu2+ 5d-4f Emission Maximum (nm (eV)) | c/a Ratio | % BGO at RT | Band Gap at RT (nm (eV)) | RT PL Decay Time (ns) | Eu2+ 4f-5d Excitation Maximum (nm (eV)) |
|---|
| RbLuS2 | 498 (2.49) | 5.72 | 102 | 310 (4.00) | 553 | 389 (3.19) |
| RbYS2 | 500 (2.48) | 5.64 | 72 | 307 (4.04) | 514 | 393 (3.16) |
| RbGdS2 | 514 (2.41) | 5.57 | 26 | 321 (3.86) | 453 | 391 (3.17) |
| RbLaS2 | 555 (2.23) | 5.34 | 18 | 323 (3.84) | 513 | 390 (3.18) |
| KLuS2 [27] | 515 (2.41) | 5.54 | 1765 | 308 (4.03) | 454 | 396 (3.13) |
| KYS2 | 535 (2.32) | 5.44 | 614 | 309 (4.01) | 496 | 393 (3.16) |
| KGdS2 | 567 (2.19) | 5.38 | 531 | 330 (3.76) | 437 | 394 (3.15) |
| KLaS2 | 613 (2.02) | 5.14 | 126 | 325 (3.82) | 689 | 394 (3.15) |
| NaLuS2 | 641 (1.93) | 5.10 | 774 | 304 (4.08) | 488 | 429 (2.89) |
| NaYS2 | 683 (1.82) | 5.02 | 119 | 309 (4.01) | 511 | 437 (2.84) |
| NaGdS2 | 779 (1.59) | 4.95 | 25 | 330 (3.76) | 531 | ~430 (2.88) |
Experimental data of emission energy as a function of
c/
a hexagonality (the values of which are listed in
Table 3) were fitted by Equation (3) in the form:
where ξ
2 = 1/48 ≈ 0.0208; Δ,
and
are fitting parameters. Their meanings as well as the derivation of Equation (3) are discussed in Supplementary Materials. From the fit the following values were obtained: Δ = 4.7 ± 0.2 eV,
,
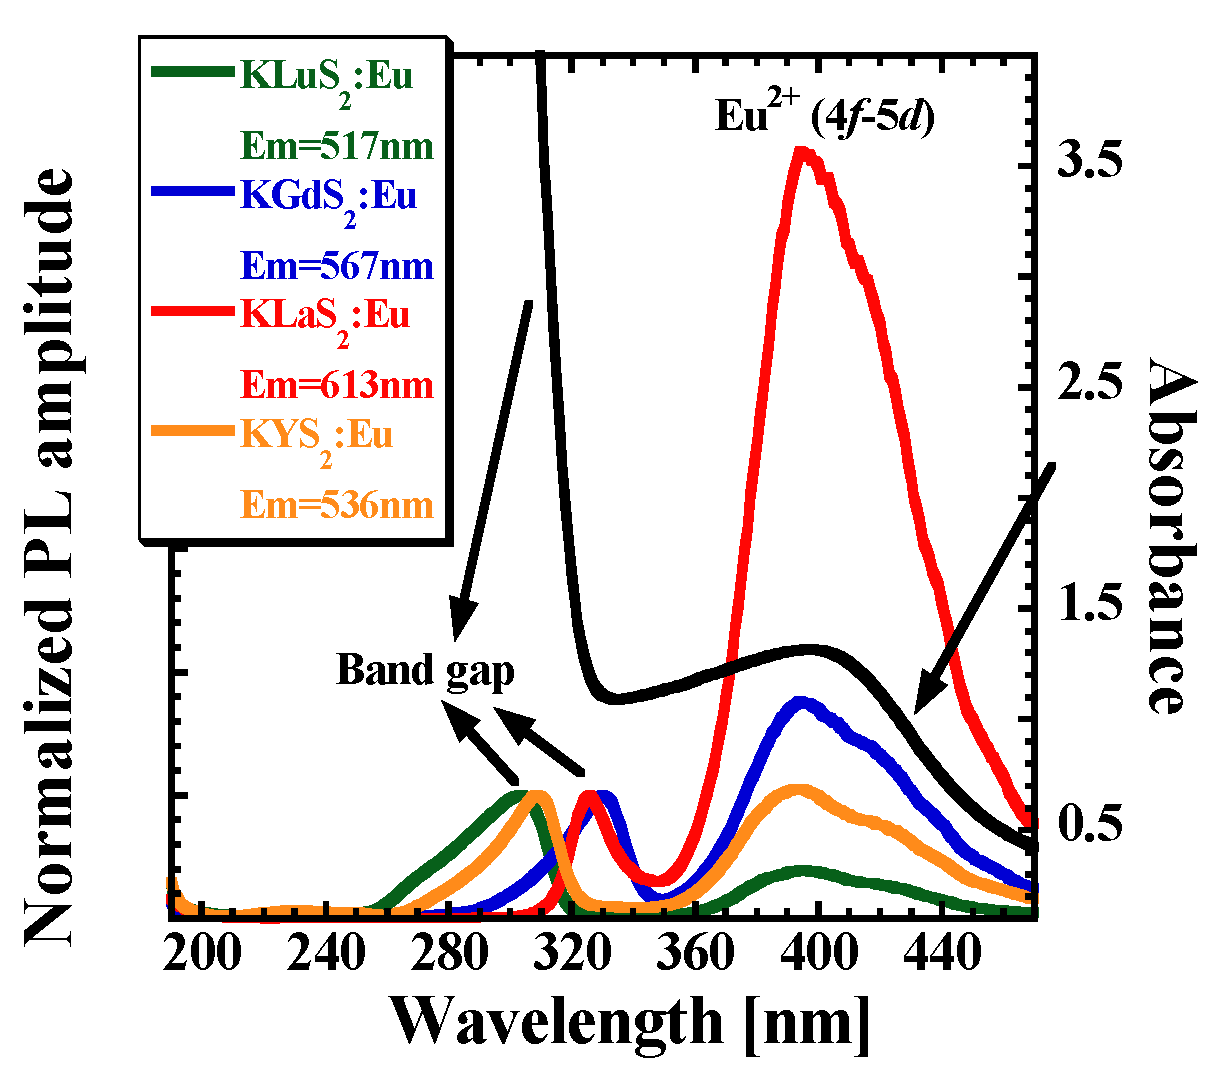
As an example, RT PLE spectra of Eu
2+-doped KLnS
2:Eu (0.05%; Ln = Lu, Y, Gd, La) are presented in
Figure 5. The emission wavelengths used for the PLE spectra recording were taken from the RL spectra maxima, see
Figure 3 and
Table 3. All PLE spectra feature the KLnS
2 band edge shifting between 308 nm (KLuS
2) and 330 nm (KGdS
2), which is in a fairly-good agreement with previously reported values [
27,
30], and another band at lower energies ascribed to the Eu
2+ 4f-5d transition, similarly to [
27]. Such a band is present in all studied samples ALnS
2:Eu (not shown here). Its position covers the range from 389 nm (RbLuS
2:Eu) to 437 nm (NaYS
2:Eu). Interestingly, for the RbLnS
2 and KLnS
2 compounds, only a very small variation in the band position is observed (389–396 nm) while for the NaLnS
2 series, low energy shift is observed (429–437 nm). The corresponding transition is partially allowed and represents an interesting way of efficient excitation in the near UV/blue region. Obviously, absorption spectra would provide better understanding, but since we are dealing with low Eu concentration (to avoid any concentration quenching effects) and the NaLnS
2:Eu (Ln = Lu, Y, Gd) crystals are very small, it is unfeasible to measure well-resolved absorption spectra. However, an example of the absorption spectrum of KLuS
2:Eu (2%) is displayed in
Figure 5, showing good correlation between absorption and excitation features.
RT decay curves related to the Eu
2+ 5d-4f transitions in ALnS
2:Eu (λ
ex and λ
em taken from the maxima of RL and PLE spectra, see
Figure 3 and
Figure 5,
Table 3) can be fitted by a single exponential to the initial decrease. The decay time values are listed in
Table 3. All values are in the order of a few hundred nanoseconds which is in a good agreement with the expected value of dipole allowed 5d-4f Eu
2+ transitions.
As an example, four normalized decay curves of KLnS
2:Eu (Ln = Lu, Y, Gd, La; 0.05% Eu) are shown in
Figure S13 in the Supplementary File (Luminescence and EPR experiment—additional data). Interestingly, their signal-to-background ratio improves in the KLuS
2:Eu-KYS
2:Eu-KGdS
2:Eu-KLaS
2:Eu series, which may be related to processes of the excited state ionization of the Eu
2+ activator, at least in the KGdS
2, KLaS
2 hosts, see below.
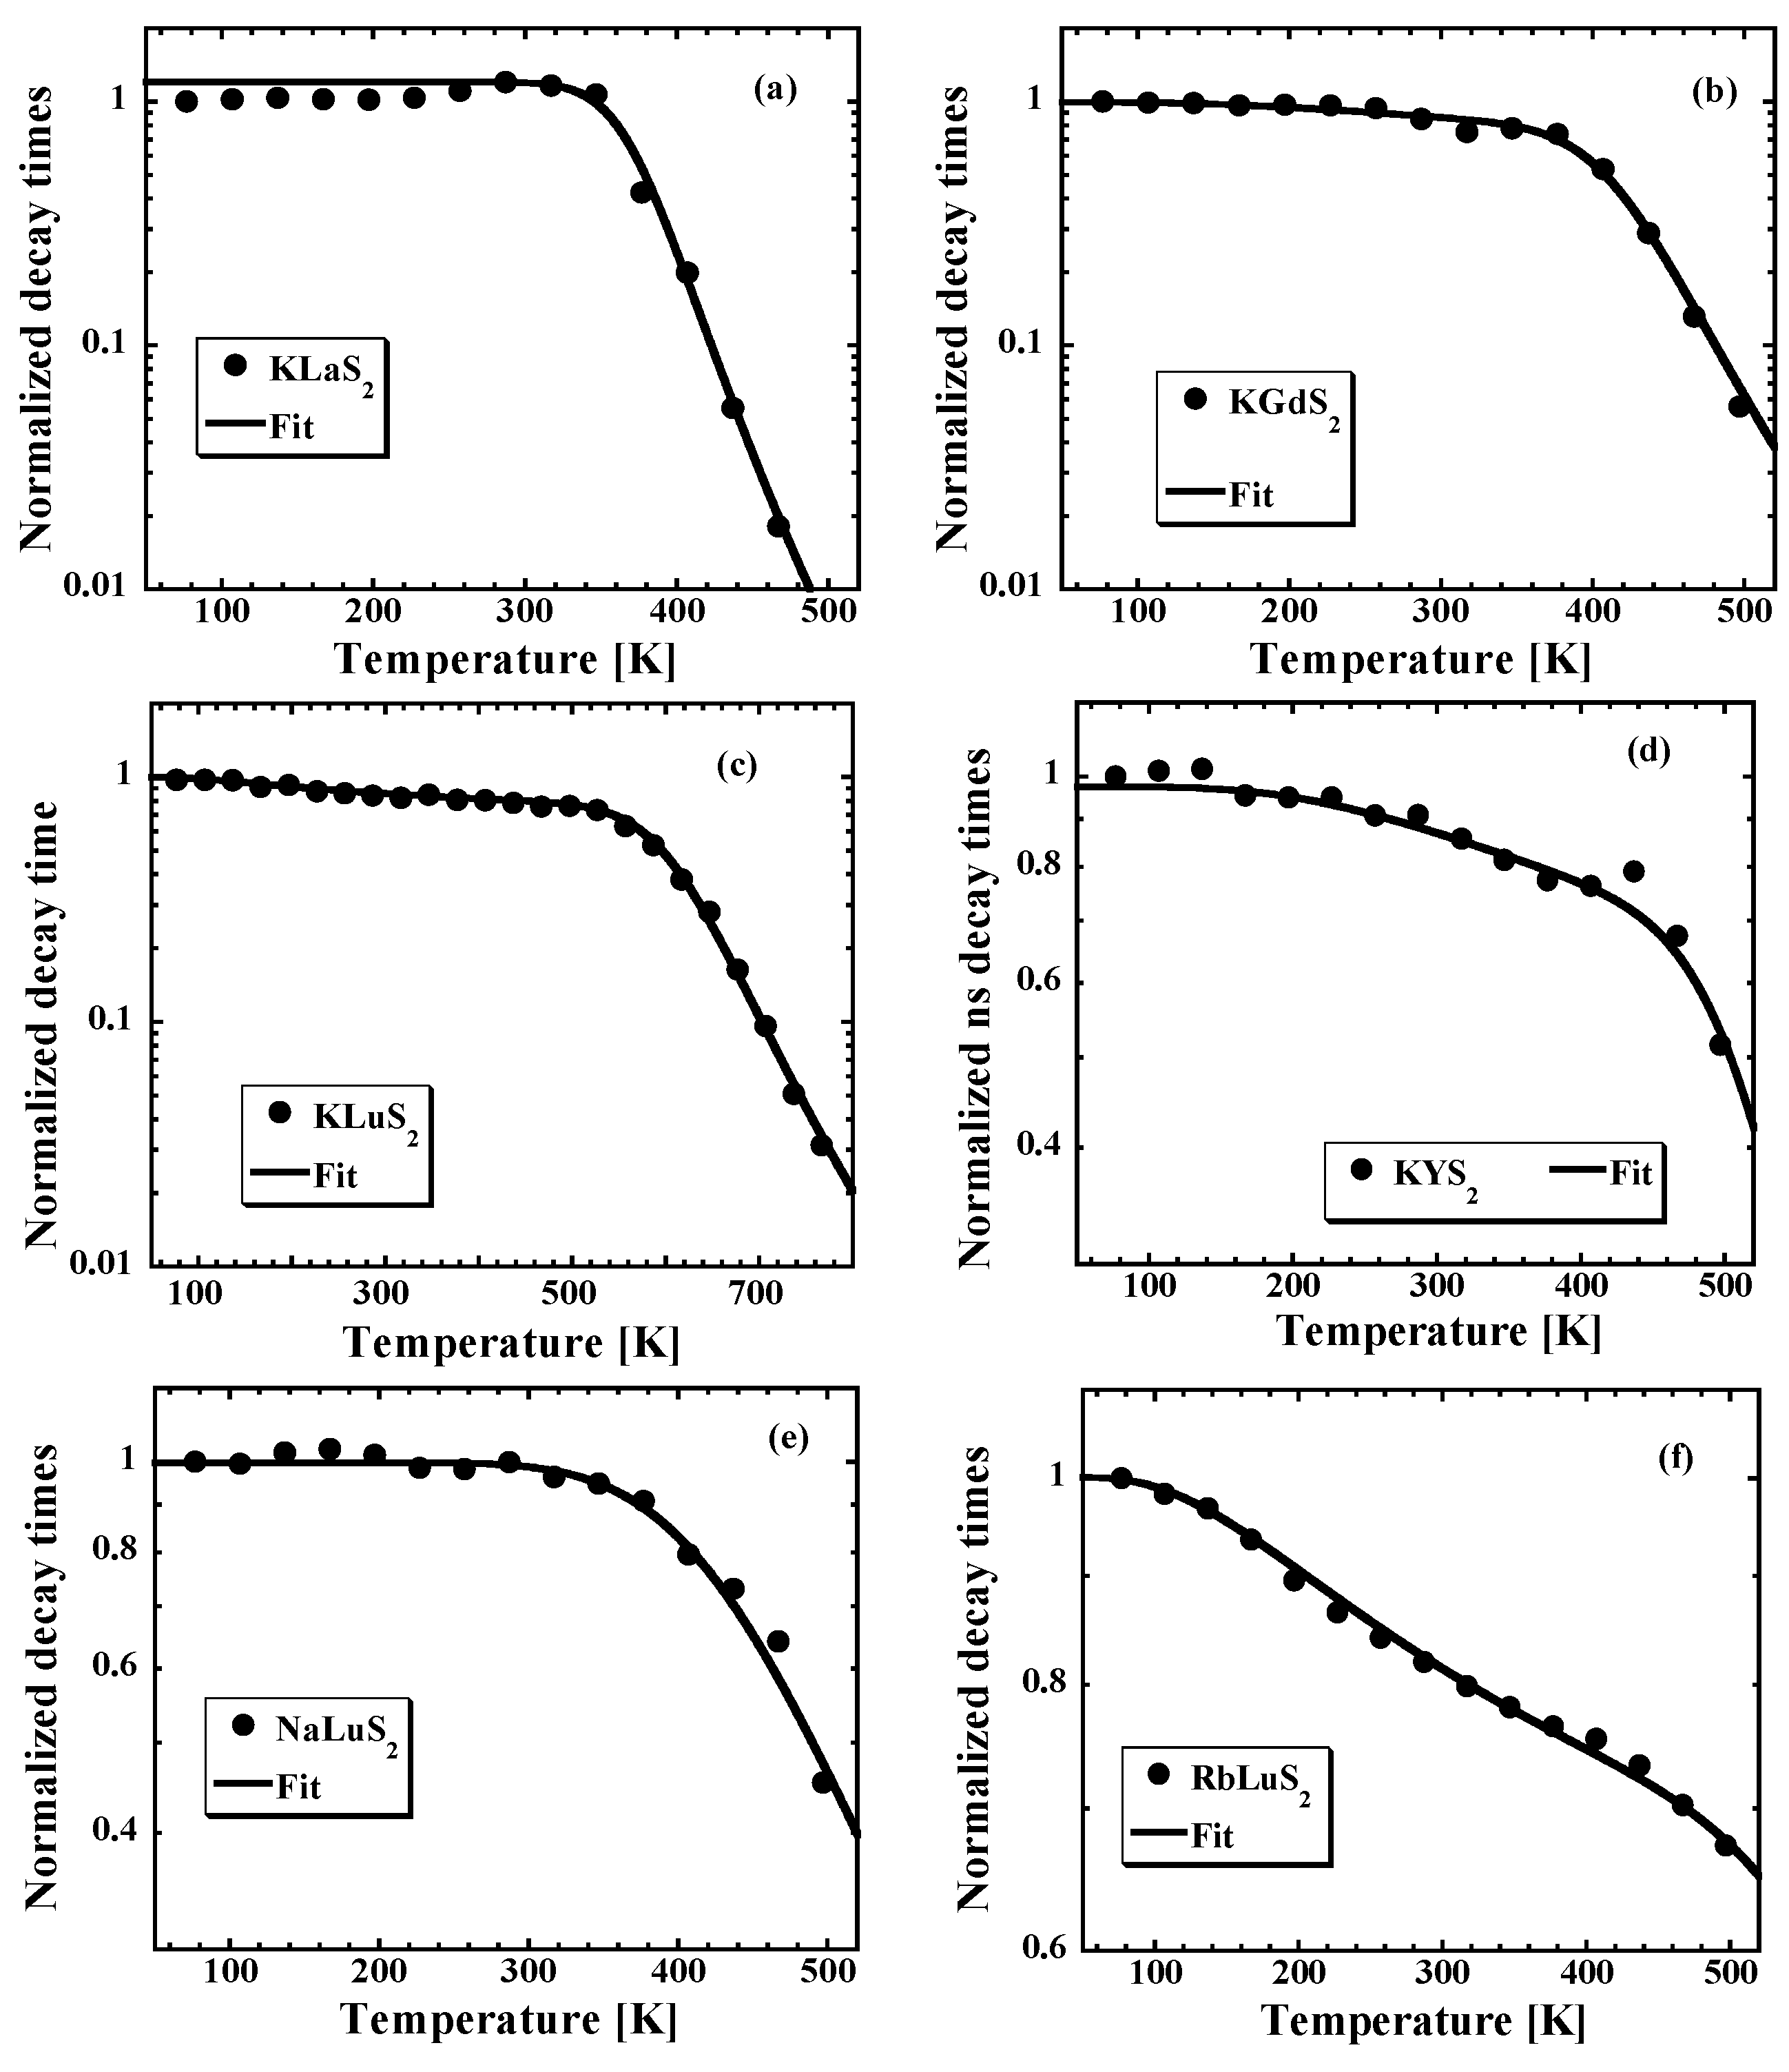
To further study the thermal stability of the Eu
2+ emission center in these ternary sulfide hosts, the temperature dependences (TDs) of the Eu
2+ 5d-4f decay times in KLnS
2 hosts (Ln = Lu, Gd, Y, La) and ALuS
2 hosts (A = Na, K, Rb) were investigated between 77 and 800 K (see
Figure 6). Radiative lifetime values (at 77 K, not effected by any quenching or ionization processes) are listed in
Table 4, together with the excitation and emission wavelengths. Lu-compounds appear to be the most thermally stable as the decay time values at 497 K still reach 80%, 70% and 45% of their low-temperature limit for KLuS
2 (already reported [
27]), RbLuS
2 and NaLuS
2, respectively. Furthermore, prolonged TD of Eu
2+ decay curves in KLuS
2 up to 770 K shows that the decay time value even at 770 K is 18 ns [
16]. On the other hand, thermal stability decreases in the KLuS
2-KYS
2-KGdS
2-KLaS
2 series as the decay time values decrease by more than two orders of magnitude between 77 and 497 K in KLaS
2:Eu.
We approximated the mentioned nanosecond decay time TDs by a simple barrier model described by:
where ô
observed, ô
radiative,
Kxi,
Exi,
k and
T represent the PL decay time measured at temperature
T, the low-temperature limit of the PL decay time (see
Table 4), frequency factor of the
i-th escaping channel,
i-th energy barrier height, Boltzmann constant and absolute temperature, respectively. The parameters of the best fit of Equation (4) to the experimental data are listed in
Table 4. As already published [
27], the low value of the energy barrier (40 meV in KLuS
2:Eu) indicates that the decay time shortening in KLuS
2:Eu (up to 497 K) is not due to a classical temperature quenching to the ground state. It can be caused by a transition to some other state, perhaps that of a nearby defect. In RbLuS
2:Eu, this escaping channel with the
ca. 40 meV energy barrier reported in KLuS
2:Eu can be found as well, but also another one with the energy barrier of 500 meV appears. This channel we ascribe to classical thermal quenching and/or thermally induced ionization of the Eu
2+ 5d excited state (in the 77–497 K temperature range). Such a process starts to play a role in KLuS
2:Eu as well at temperatures above 500 K and the corresponding energy barrier is 820 meV. On the other hand, NaLuS
2:Eu can be reasonably fit with a single escaping channel with the energy barrier 300 meV (see
Table 4). TD of the Eu
2+ decay times in KYS
2:Eu and KGdS
2:Eu exhibits a similar behavior as KLuS
2:Eu and again can be fit with a model introducing two escaping channels (described above). Finally, TD of the Eu
2+ nanoseconds (ns) decay time in KLaS
2:Eu can be approximated by a single barrier model with the energy value of 650 meV and very high frequency factor (9 × 10
14 s
−1—see
Table 4).
Table 4.
Emission (PL) decay time temperature dependences and fit parameters of Eu2+ in a selection of ALnS2:Eu. λexc, λem, ôrad, Kix and Eix are excitation and emission wavelengths, low-temperature limit of observed radiative lifetime, frequency factors and energy barriers of the emission quenching channels. For more details, see the text.
| Host | λexc (nm) | λem (nm) | ôrad (ns) | K1x (s−1) | E1x (meV) | K2x (s−1) | E2x (meV) |
|---|
| KLaS2 | 389 | 610 | 573 | - | - | 9 × 10¹⁴ | 650 |
| KYS2 | 389 | 536 | 546 | 5 × 10⁶ | 80 | 1 × 10¹³ | 700 |
| KGdS2 | 389 | 550 | 517 | 3 × 10⁶ | 60 | 2 × 10¹³ | 580 |
| KLuS2 [16,27] | 389 | 517 | 526 | 1.4 × 10⁶ | 40 | 1.2 × 10¹³ | 820 |
| RbLuS2 | 389 | 500 | 675 | 1.6 × 10⁶ | 40 | 1 × 10¹⁰ | 500 |
| NaLuS2 | 452 | 635 | 489 | - | - | 2.5 × 10⁹ | 300 |
Figure 5.
RT PLE spectra of KLnS
2:Eu (0.05%) samples (Ln = Lu, Y, Gd, La) and RT absorption spectra of KLuS
2:Eu (2% Eu, thickness 0.2 mm); data of KLuS
2:Eu after [
27].
Figure 5.
RT PLE spectra of KLnS
2:Eu (0.05%) samples (Ln = Lu, Y, Gd, La) and RT absorption spectra of KLuS
2:Eu (2% Eu, thickness 0.2 mm); data of KLuS
2:Eu after [
27].
Figure 6.
Temperature dependence of the emission (PL) decay times of Eu
2+ in (
a) KLaS
2; (
b) KGdS
2; (
c) KLuS
2 after [
16,
27]; (
d) KYS
2; (
e) NaLuS
2 and (
f) RbLuS
2 hosts; solid symbols are experimental data, solid lines are fits to the data using the phenomenological model described in the text. The parameters of fits are summarized in
Table 4.
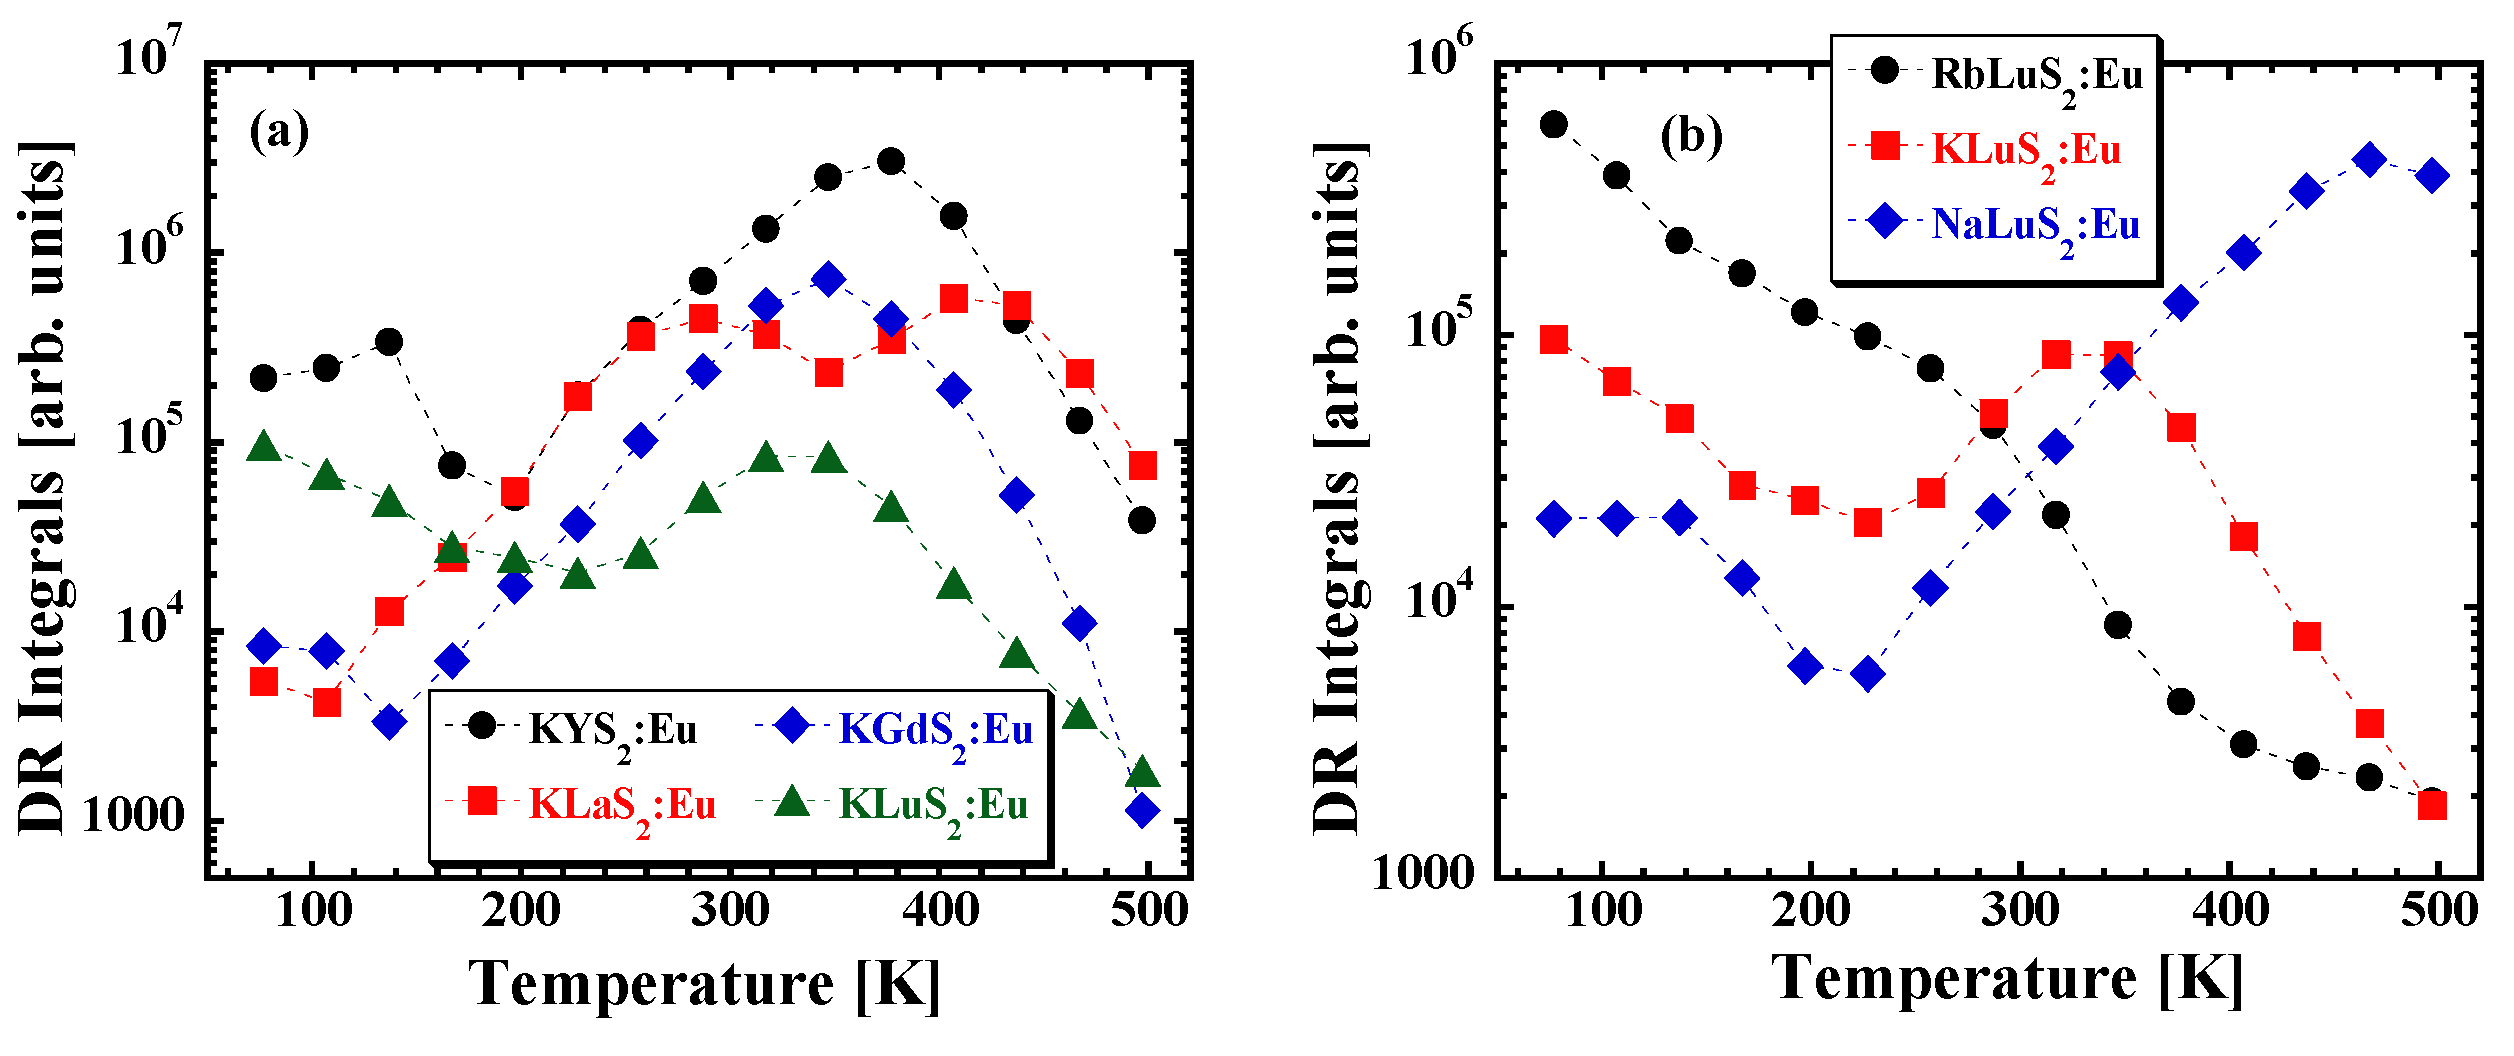
To further investigate the nature of decay times shortening at higher temperatures, the measurement of the TD of the delayed recombination (DR) integrals was performed. This measurement consists in monitoring of the decay under direct optical excitation of the emission center using a xenon-filled flash-lamp in multichannel scaling mode while collecting the emission light in an extended time window (88 ms). Under such conditions, prompt nanosecond Eu
2+ decay does not have to be taken into account and only the delayed light (produced by electrons that were thermally ionized into the conduction band, and later returned back to the emission center) can be easily investigated (for details concerning the method see [
43]).
Figure 7 illustrates the TD of the DR integrals related to the Eu
2+ center in different sulfide hosts. Before integrating the decay curves, a few points with the highest intensity at the very beginning of the decay (containing prompt Eu
2+ ns luminescence) were omitted, for details see [
44]. As demonstrated in
Figure 8 there is, indeed, an increase of the DR integrals between 200–380 K, 140–340 K, 100–440 K, 200–300 K, 200–480 K for KYS
2:Eu, KGdS
2:Eu, KLaS
2:Eu, KLuS
2:Eu
27 and NaLuS
2:Eu, respectively. We tentatively ascribe it to a process in which the electron escapes from the Eu
2+ 5d excited state to either a nearby defect or to a conduction band, from where it can return at later times and radiatively recombine with the hole, giving rise to the DR luminescence. The hypothesis of the nearby defect being involved is supported by the low value of the energy barrier found above, especially for the KLuS
2:Eu, KGdS
2:Eu, RbLuS
2:Eu and KYS
2:Eu. Rapid decrease of the DR integrals at higher temperatures can be due to the shaping of the DR temperature dependence by the presence of traps [
45,
46]. An exception from the behavior is to be noted for the RbLuS
2:Eu, as there is a decrease of the DR integrals in the whole temperature range (77–497 K). We also note that DR integrals show a non-zero value even at the lowest temperatures, which has been explained by quantum tunneling between the luminescence center and a nearby defect state [
47]. Better understanding of the DR behavior, however, would require an independent study of characteristics of the traps involved in the DR process as mentioned above.
Figure 7.
Temperature dependence (TD) of the delayed recombination (DR) integrals (excitation and emission wavelengths identical to those for nanoseconds decay time measurements, see
Table 4) for (
a) KLnS
2:Eu (Ln = La, Gd, Lu, Y) and (
b) ALuS
2:Eu (A = Rb, K, Na); composition given in the legend.
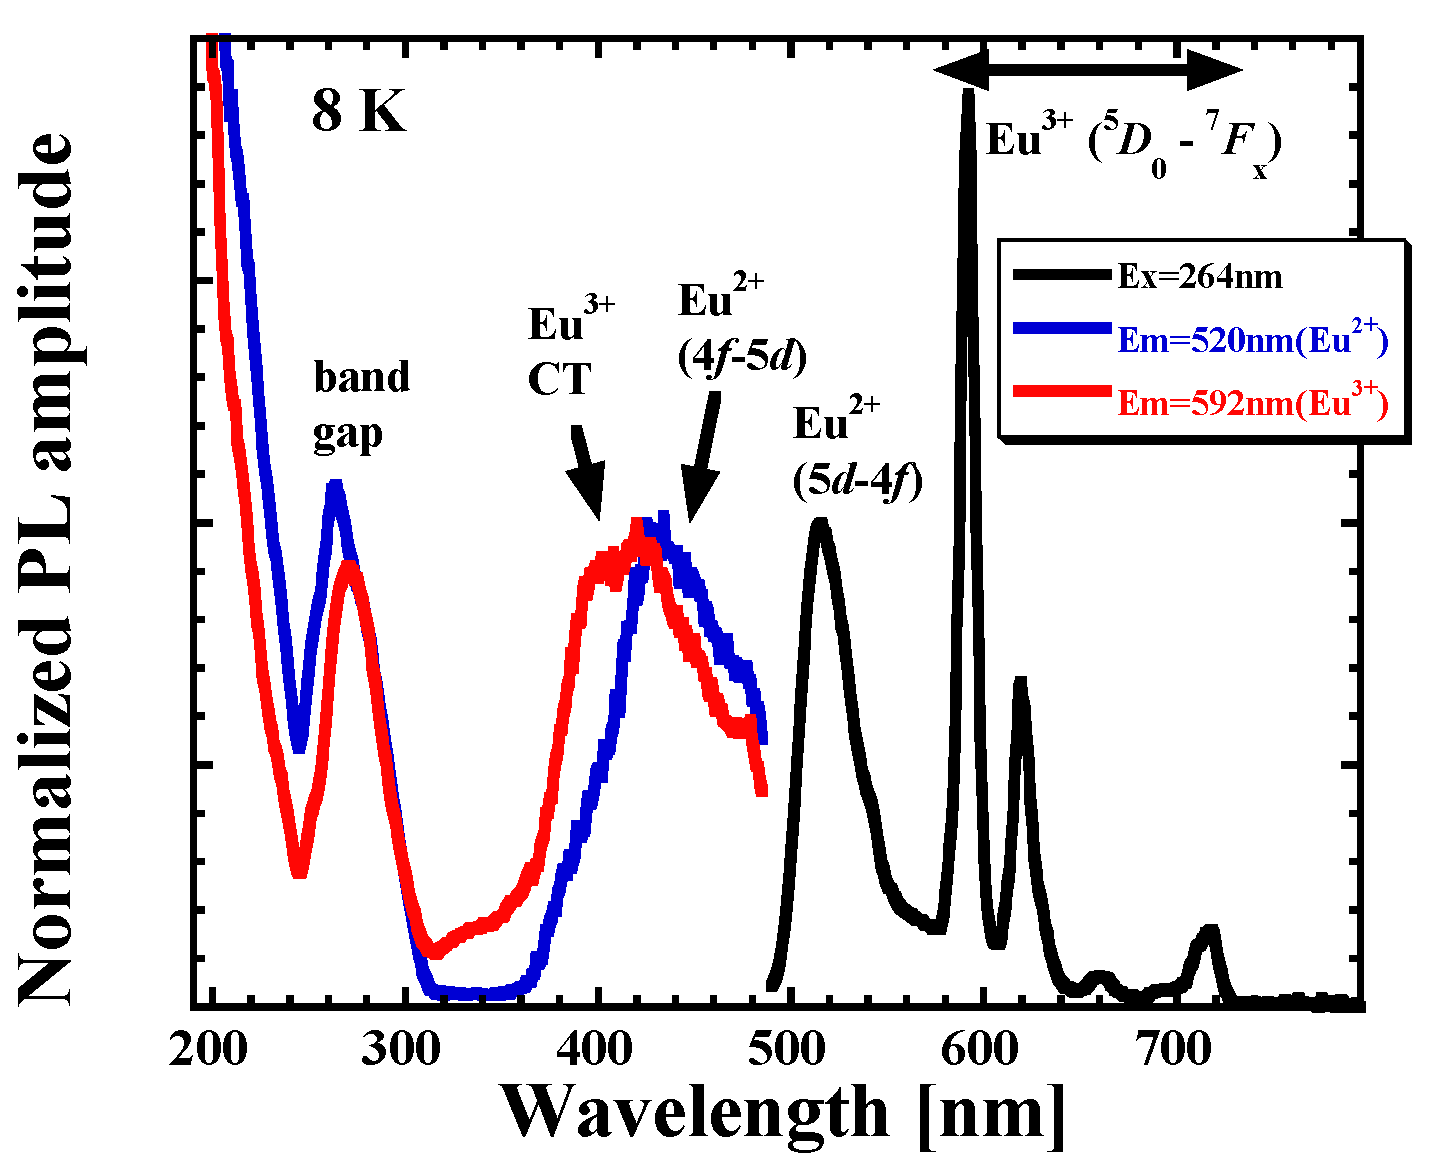
Figure 8.
PL and photoluminescence excitation (PLE) spectra of KLuS2:Eu2+ (0.05%) recorded at 8 K.
Figure 8.
PL and photoluminescence excitation (PLE) spectra of KLuS2:Eu2+ (0.05%) recorded at 8 K.
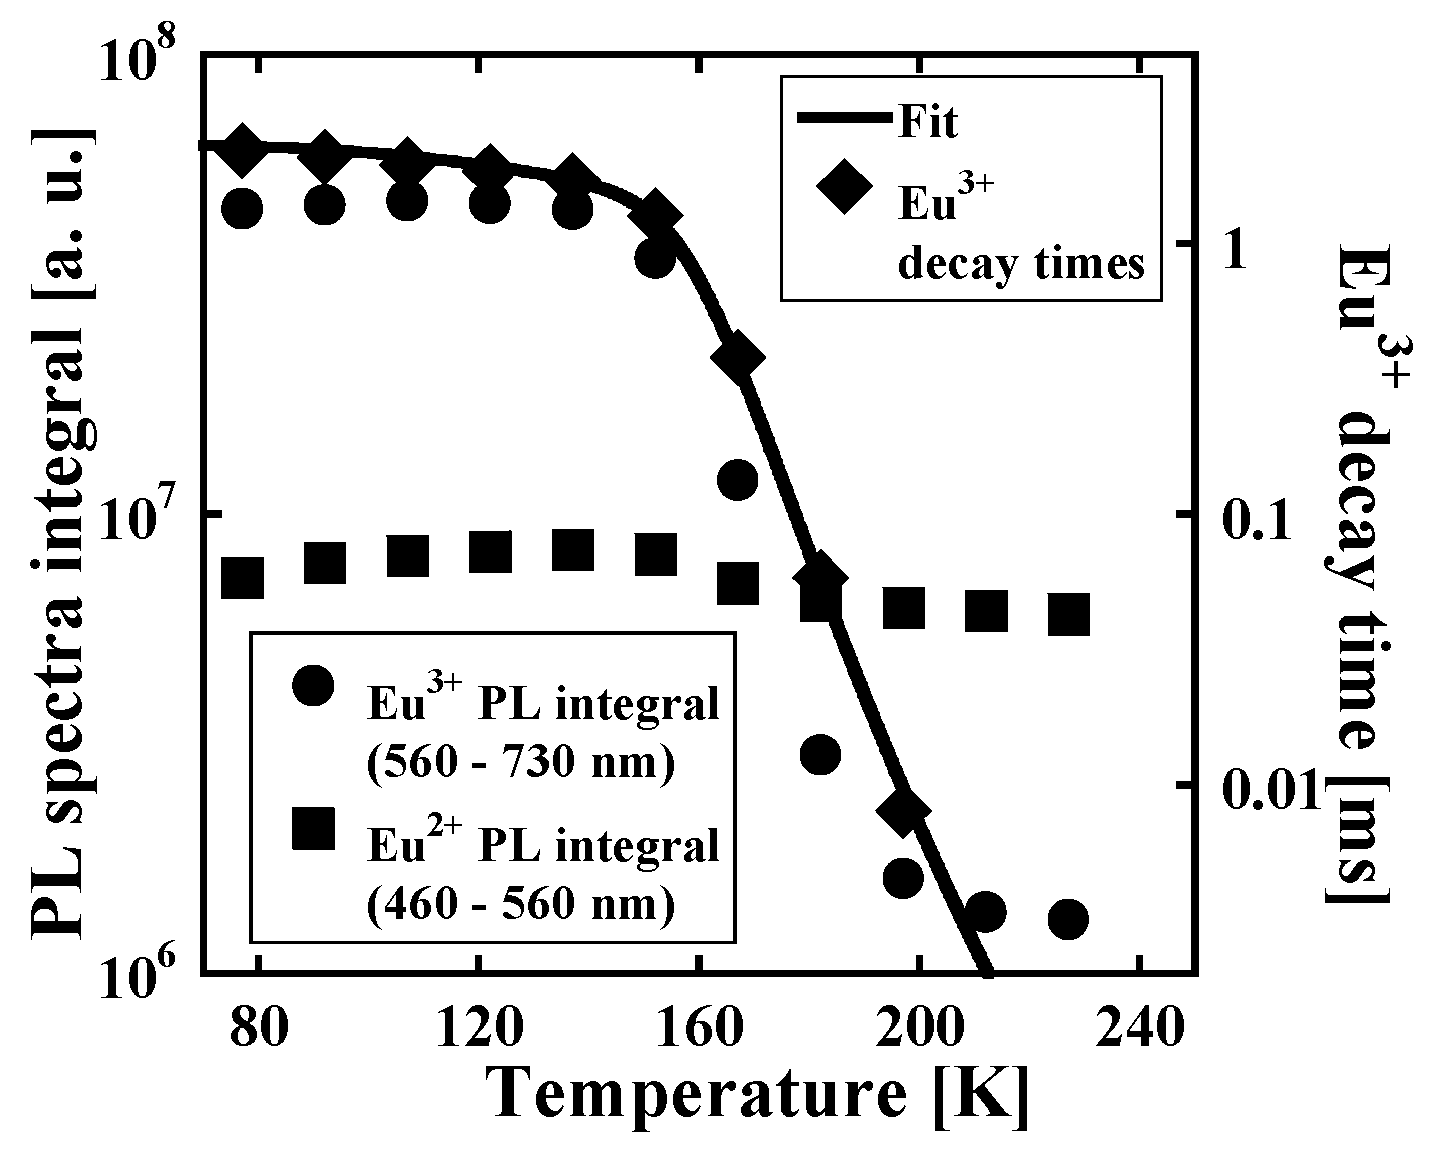
3.3. Eu3+ Emission at Low Temperatures
To our surprise, PL spectrum of KLuS
2:Eu (0.05%) recorded at 8 K uncovered the presence of the characteristic
5D0-
7Fx emission lines in the 570–730 nm spectral region assigned to the Eu
3+, see
Figure 8, co-existing with the known 5d-4f Eu
2+ emission at 515–520 nm. Mentioned Eu
3+ emission starts to vanish above 150 K as demonstrated in
Figure 9, where the temperature dependence of Eu
3+ emission spectra integrals (PL spectra under the 390 nm excitation integrated in the 560–730 nm region) is displayed (full circles). At around 200 K, the Eu
3+ emission is no longer observed and the Eu
2+ emission band dominates the spectrum completely. At the same time, the Eu
3+ decay time at the lowest temperature reaches a value of around 2.5 ms, which is typical for the parity forbidden 4f-4f RE
3+ transitions. However, the decay times start to decrease drastically above 150 K and at around 200 K the decays become undetectable (ô at 197 K is ~8 μs), which is well in agreement with PL integral behavior. PL integrals of Eu
2+ under the 390 nm excitation, integrated in the 460–560 nm region, however, remain constant in the studied temperature range, which implies that Eu
2+ and Eu
3+ centers are probably independent, as decreasing Eu
3+ emission does not enhance the Eu
2+ emission. TD of Eu
3+ decay times was also fit by the phenomenological model described above, yielding the values of parameters
K1x = 1 × 10
4,
E1x = 50 meV,
K2x = 3 × 10
14,
E2x = 370 meV. Eu
3+ heavy quenching in the 150–200 K region is therefore governed by the process with energy barrier of 370 meV height. The nature of the described observation is discussed in
Section 3.5.
Figure 9.
Temperature dependence of PL spectra integrals, separately for Eu
3+ (560–730 nm) and Eu
2+ (460–560 nm) emission region (see
Figure 9) under 390 nm excitation and Eu
3+ decay times (λ
ex = 390 nm, λ
em = 592 nm) with fit by the phenomenological model (see Equation (4)) of KLuS
2:Eu (0.05%).
Similar behavior was also observed for KYS
2:Eu, KGdS
2:Eu, NaLuS
2:Eu, RbLuS
2:Eu (all 0.05% concentration) even for the band-gap and X-ray excitation. Interestingly, the Eu
3+ emission is fully absent even at the lowest temperatures (8 K) in KLaS
2:Eu. To further investigate both divalent and trivalent europium behavior, low-temperature (8 K) PLE spectra were measured separately for Eu
3+ (λ
ex = 592 nm) and Eu
2+ emission (λ
em = 520 nm) in KLuS
2. Both spectra feature the band-gap related maximum below 300 nm. While the latter spectrum shows the already known 4f-5d Eu
2+ band positioned at 430 nm (which is low-energy shifted with respect to room temperature), the former features a new band at around 400 nm, which we ascribe to a charge transfer (CT) transition of Eu
3+ (S
2−-Eu
3+), based also on [
48]. This assignment is discussed in
Section 3.5 (energy diagram).
3.4. EPR Study
For the detailed EPR study, only the KLnS
2:Eu (Ln = Lu, La, Y) ternary sulfides were chosen, since they reveal strong enough signals from the Eu
2+ paramagnetic centers. In the NaLuS
2:Eu, even at the Q band (34 GHz) only the central +1/2 ↔ −1/2 spin transition appears in the spectra, which does not allow any valuable information about the structure of the Eu
2+ centers as compared to the KLuS
2:Eu [
28]. In the sulfides of the general formula AGdS
2:Eu (A = Na, K or Rb), the signals from the Eu
2+ ions cannot be detected separately, as the Eu
2+ ions are coupled with the Gd
3+ lattice ions by exchange and magnetic dipole interaction. As a result, only a very broad signal from the coupled ions is detected.
EPR spectra measured in the Eu-doped KLaS
2 and KYS
2 show resonance lines produced by not only Eu
2+ but Gd
3+ ions (uncontrolled impurity) as well (see, e.g.,
Figure 10). Each of the Eu
2+ fine components in EPR spectra (transitions +7/2 ↔ +5/2, +5/2 ↔ +3/2, …, −3/2 ↔ −5/2, −5/2 ↔ −7/2) yields twelve lines of hyperfine structure (HFS). This is due to two isotopes with non-zero nuclear magnetic moments,
151Eu (nuclear spin
I = 5/2, abundance 47.8%) and
153Eu (nuclear spin
I = 5/2, abundance 52.2%) [
49,
50]. The HFS is well resolved for the +1/2 ↔ −1/2 central transition (
Figure 11), when the direction of an external magnetic field is either parallel with or perpendicular to the
c axis, exhibiting almost the same spectral features as in KLuS
2 [
28].
It is expected that either one of the regular cation lattice sites or both simultaneously in the KLaS
2 and KYS
2 can host dopants similar to the KLuS
2:Eu [
28], where the Eu
2+ ions were found at both the potassium and lutetium positions (see
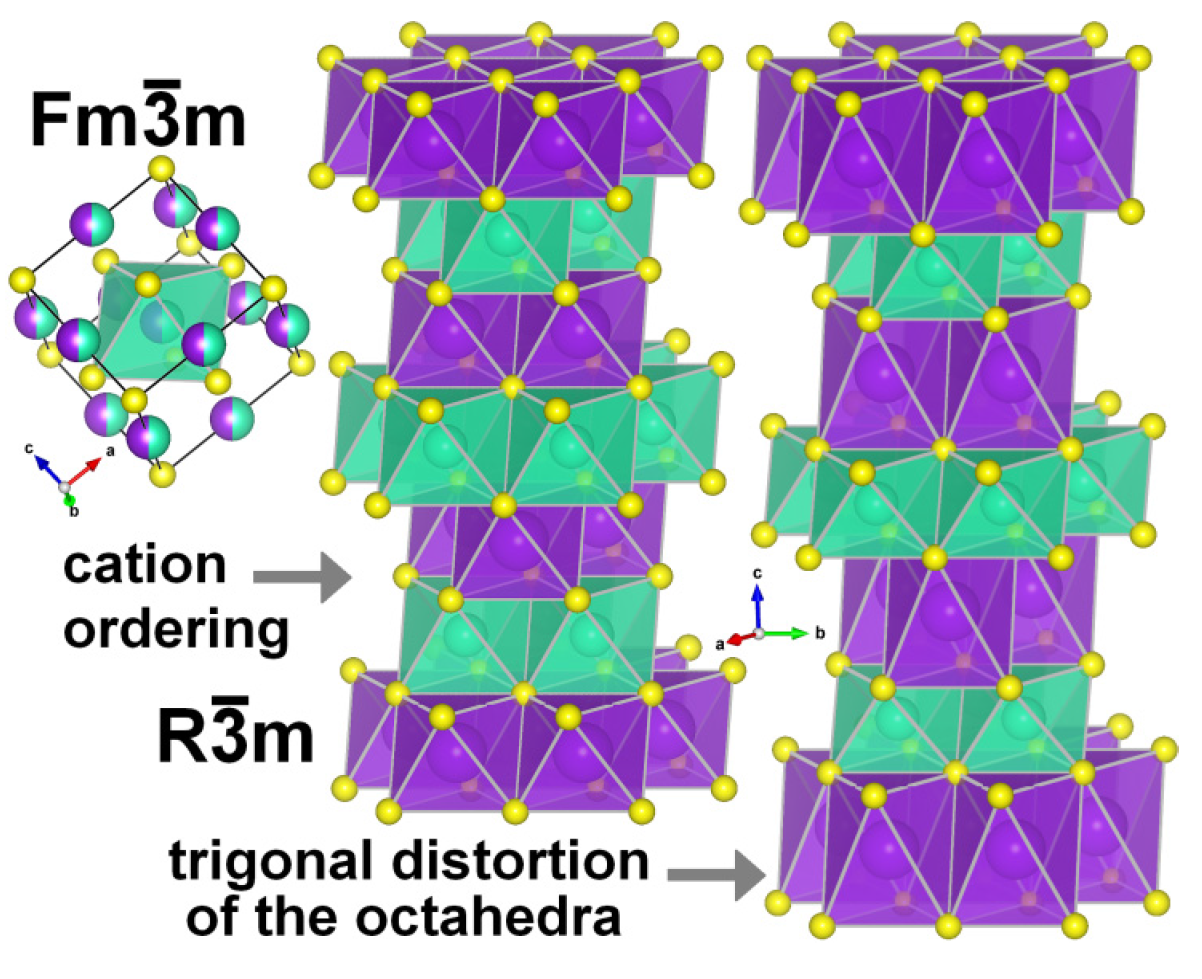
Table 1). Both cation sites are surrounded by six sulfur anions, creating trigonal antiprisms of D
3d point group (see
Figure 1).
In order to enhance spectral resolution and avoid forbidden transitions, most of the measurements were carried out at Q-band. All simulation procedures were performed in “Easyspin 4.5.5 toolbox” program [
51].
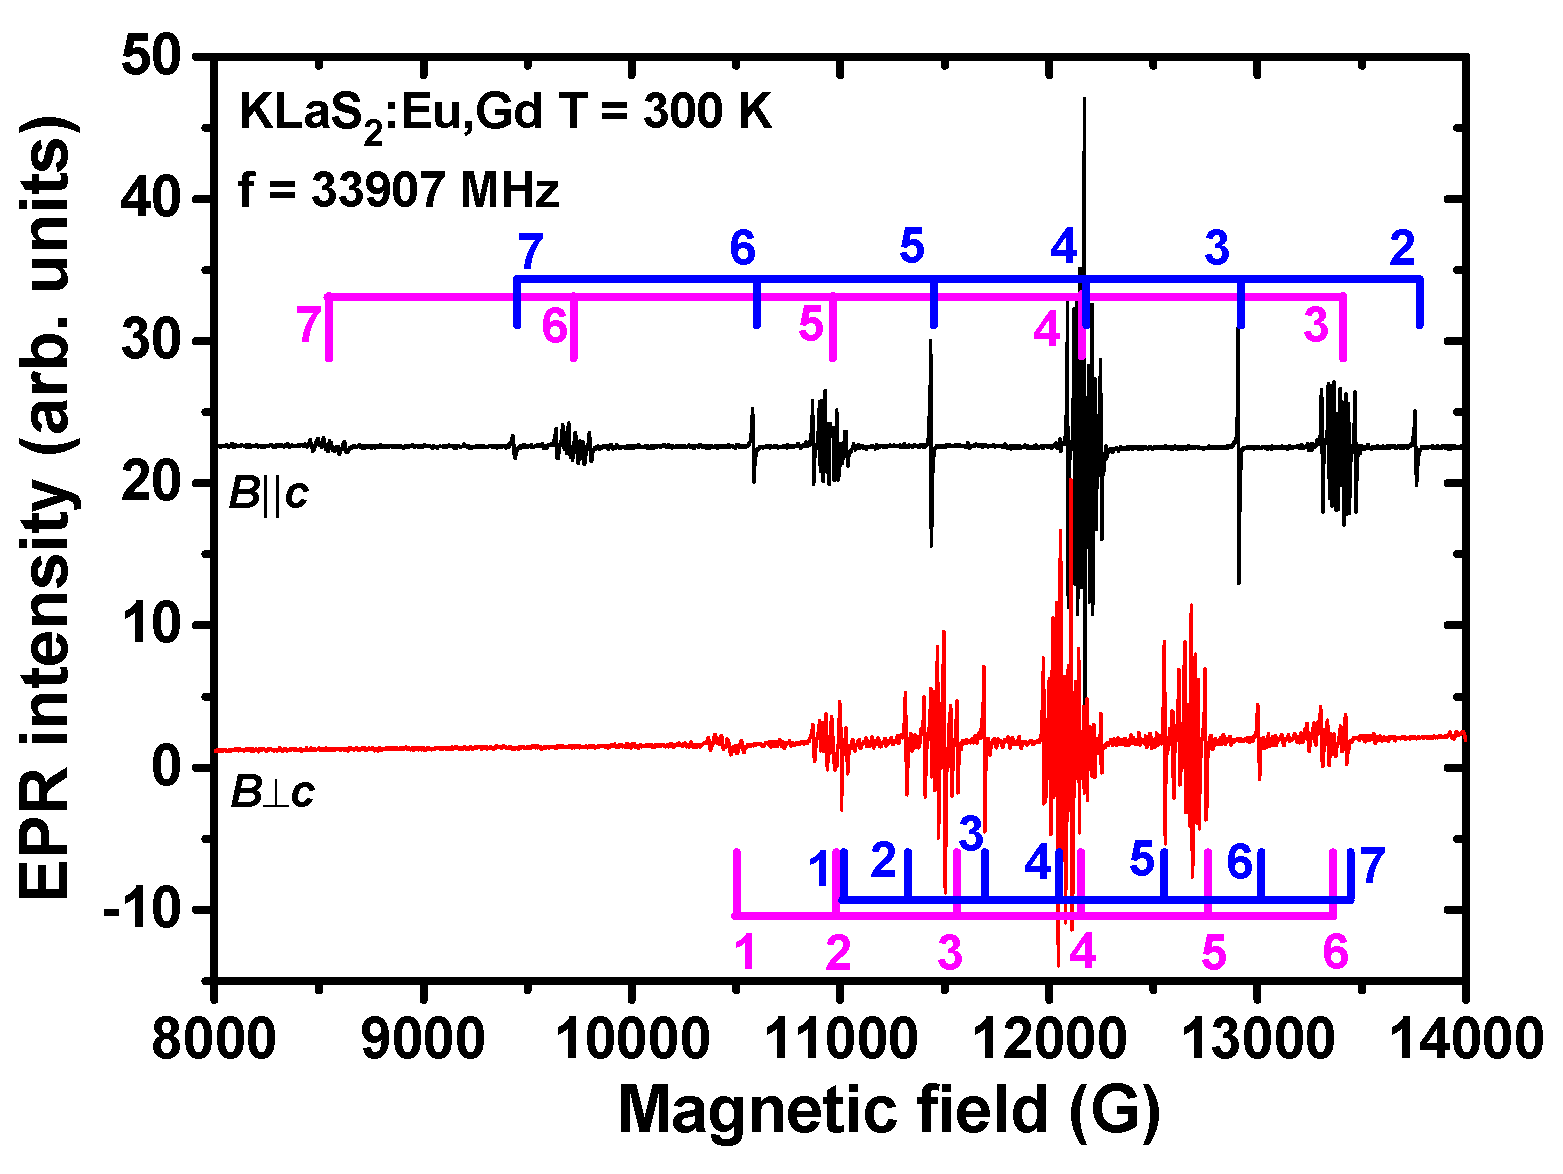
Figure 10.
Electron paramagnetic resonance (EPR) spectra measured in KLaS2:Eu single crystal at two magnetic field directions, B||c and B⊥c. The pink combs indicate transitions corresponding to Eu2+ (each transition is characterized by a pronounced hyperfine structure (HFS)) and the blue combs indicate transitions corresponding to Gd3+ (single narrow lines). Numbers are assigned to particular transitions; 1: −7/2 ↔ −5/2, 2: −5/2 ↔ −3/2, 3: −3/2 ↔ −1/2, 4: −1/2 ↔ +1/2, 5: +1/2 ↔ +3/2, 6: +3/2 ↔ +5/2, 7: +5/2 ↔ +7/2.
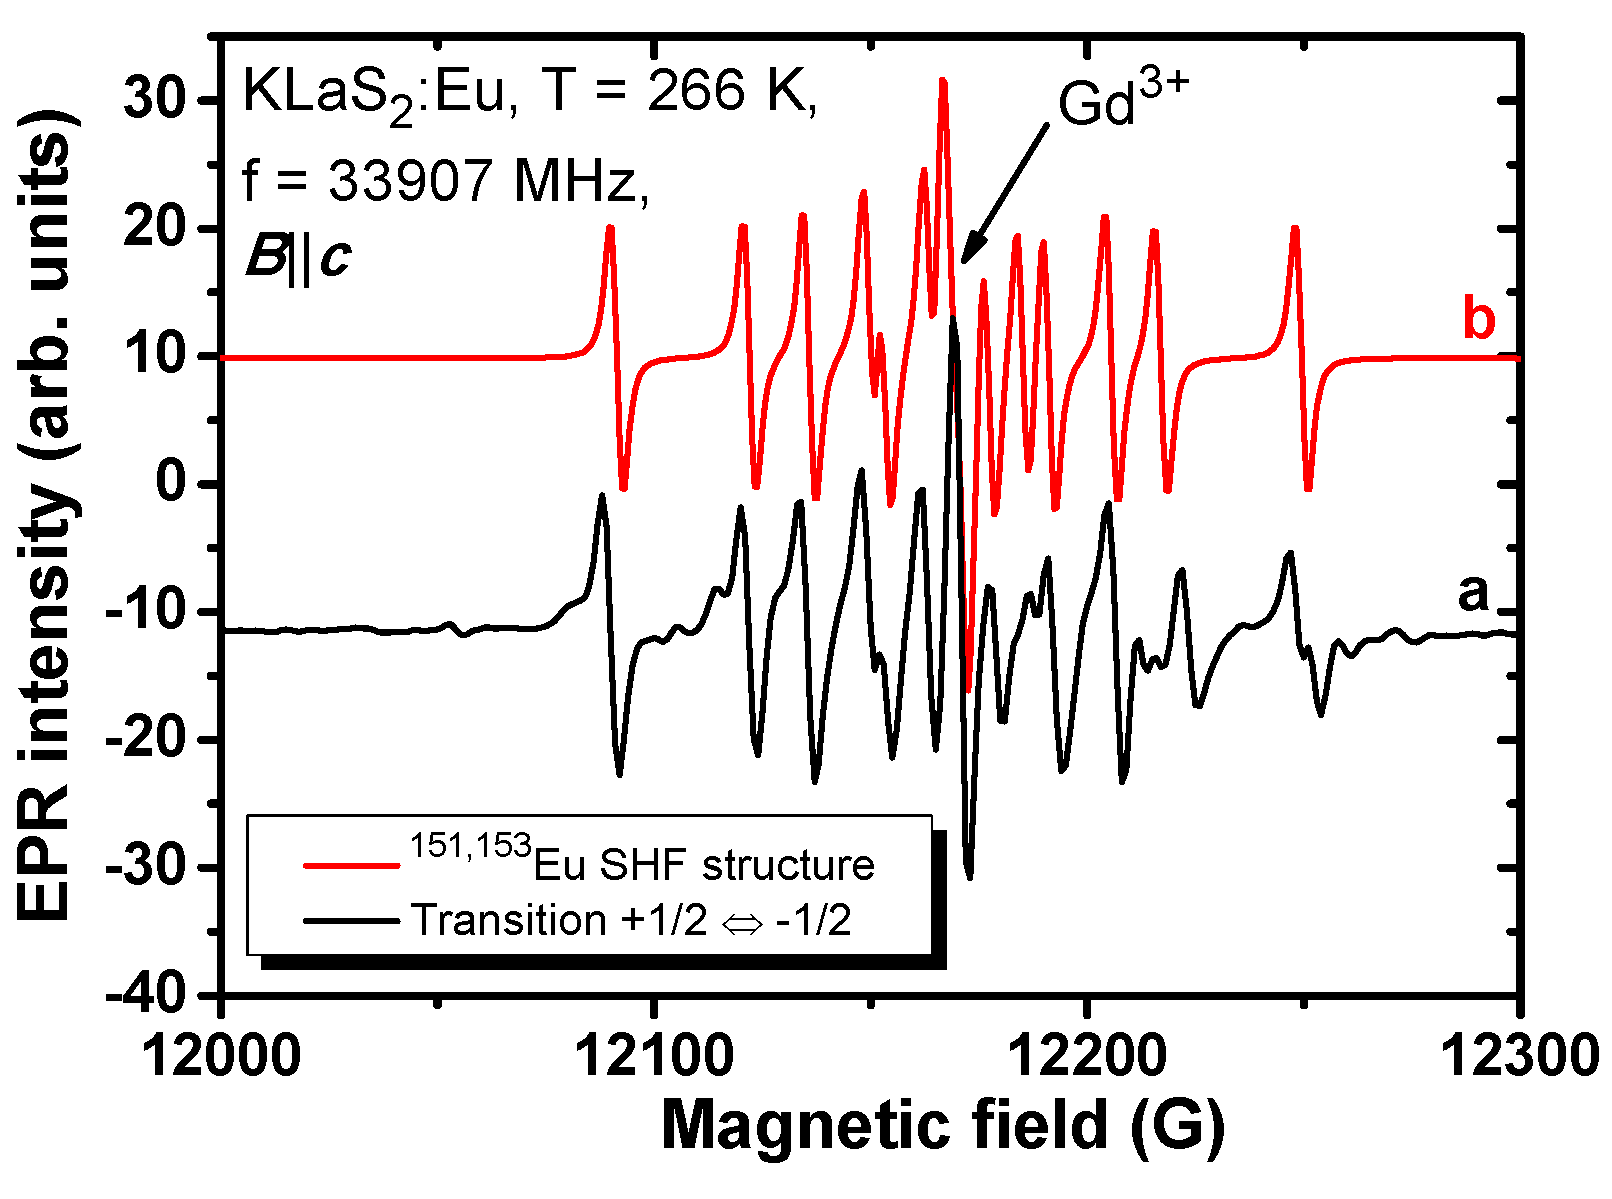
Figure 11.
Experimental (a) and simulated (b) EPR spectra of the Eu2+ centra transition +1/2 ↔ −1/2 showing hyperfine structure from 151,153Eu isotopes.
Figure 11.
Experimental (a) and simulated (b) EPR spectra of the Eu2+ centra transition +1/2 ↔ −1/2 showing hyperfine structure from 151,153Eu isotopes.
3.4.1. KLaS2:Eu
EPR spectra measured in KLaS
2:Eu at two characteristic orientations of the magnetic field,
B||
c and
B⊥
c are shown in
Figure 10. In contrast to KLuS
2 [
28] it seems that the Eu
2+ ions are preferably embedded at one of the available cation positions in the material. Their EPR spectra contain merely all fine transitions allowed by the spin
S = 7/2 and no artifacts. The Gd
3+ ions should substitute for the regular La
3+ ions since KGdS
2 compounds exists.
Angular dependencies of the Eu
2+ and Gd3+ resonances of fine transitions in the plane perpendicular to (0001) (
Figures S4 and S5 in Supplementary Materials) were simulated [
51] by using the spin Hamiltonian, allowed by the D3d symmetry with addition of
term [
52]:
Here β
e,
Sz,
g,
H are the Bohr magneton, electron spin operator,
g factor (isotropic for the
S = 7/2), magnetic field, respectively;
(axial),
,
(cubic) are crystal field parameters;
are the Stevens operators. Terms with the higher order operators, allowed by the
D3d local symmetry, were neglected, as usually they are much smaller than the terms with
,
components [
53]. The angular variations in the (0001) plane show nearly axial symmetry of the corresponding spectra (
Figure S16 in
Supplementary Materials). Therefore the crystal field parameter
was not included in the spin Hamiltonian.
The
g factors and crystal field parameters
were thus determined for both ions and are listed in
Table 5. The value of
is comparable with
, clearly proving that the local surroundings of the Eu
2+ and Gd
3+ ions do not possess
D3d symmetry.
Table 5.
Spin-Hamiltonian parameters of the Eu2+/Gd3+ ions in the different materials.
Table 5.
Spin-Hamiltonian parameters of the Eu2+/Gd3+ ions in the different materials.
| Material | KLaS2:Eu | KYS2:Eu | KLuS2:Eu [28] |
|---|
| Ion | Eu2+ | Gd3+ | Eu2+ | Gd3+ | Eu2+ |
| Center | Eu1 | Eu2 | Eu3 | Eu1 | Eu2 |
| g factor (±0.0005) | 1.9921 | 1.9917 | 1.9882 | 1.9982 | 2 | 1.9882 | 1.992 |
| (±0.0005 cm−1) | 0.0580 | 0.0395 | 0.0910 | 0.0870 | 0.0820 | 0.0242 | 0.1125 | 0.1018 |
| (±0.005 cm−1) | −0.030 | −0.015 | - |
| (±0.0005 cm−1) | 2·× 10−4 | 2·× 10−4 | 2·× 10−4 | 2·× 10−4 | 2·× 10−4 | 1.16·× 10−4 | 4 | 2 |
| |A1(151Eu)|, MHz (B||c) | 87.5 | - | 87.5 | - | 89.4 |
| |A2(153Eu)|, MHz (B||c) | 38.5 | 38.5 | 39.75 |
In
Figure 11 the HFS of the Eu
2+ +1/2 ↔ −1/2 central transition (
B||
c) was almost perfectly approximated by the simulated spectrum [
51]. The
151,153Eu hyperfine constants along the
c axis were derived and are listed in
Table 5 as well.
The ratio of Eu2+ to Gd3+ concentrations in the material was nearly six. It was calculated from the corresponding integral line intensities of the spectra.
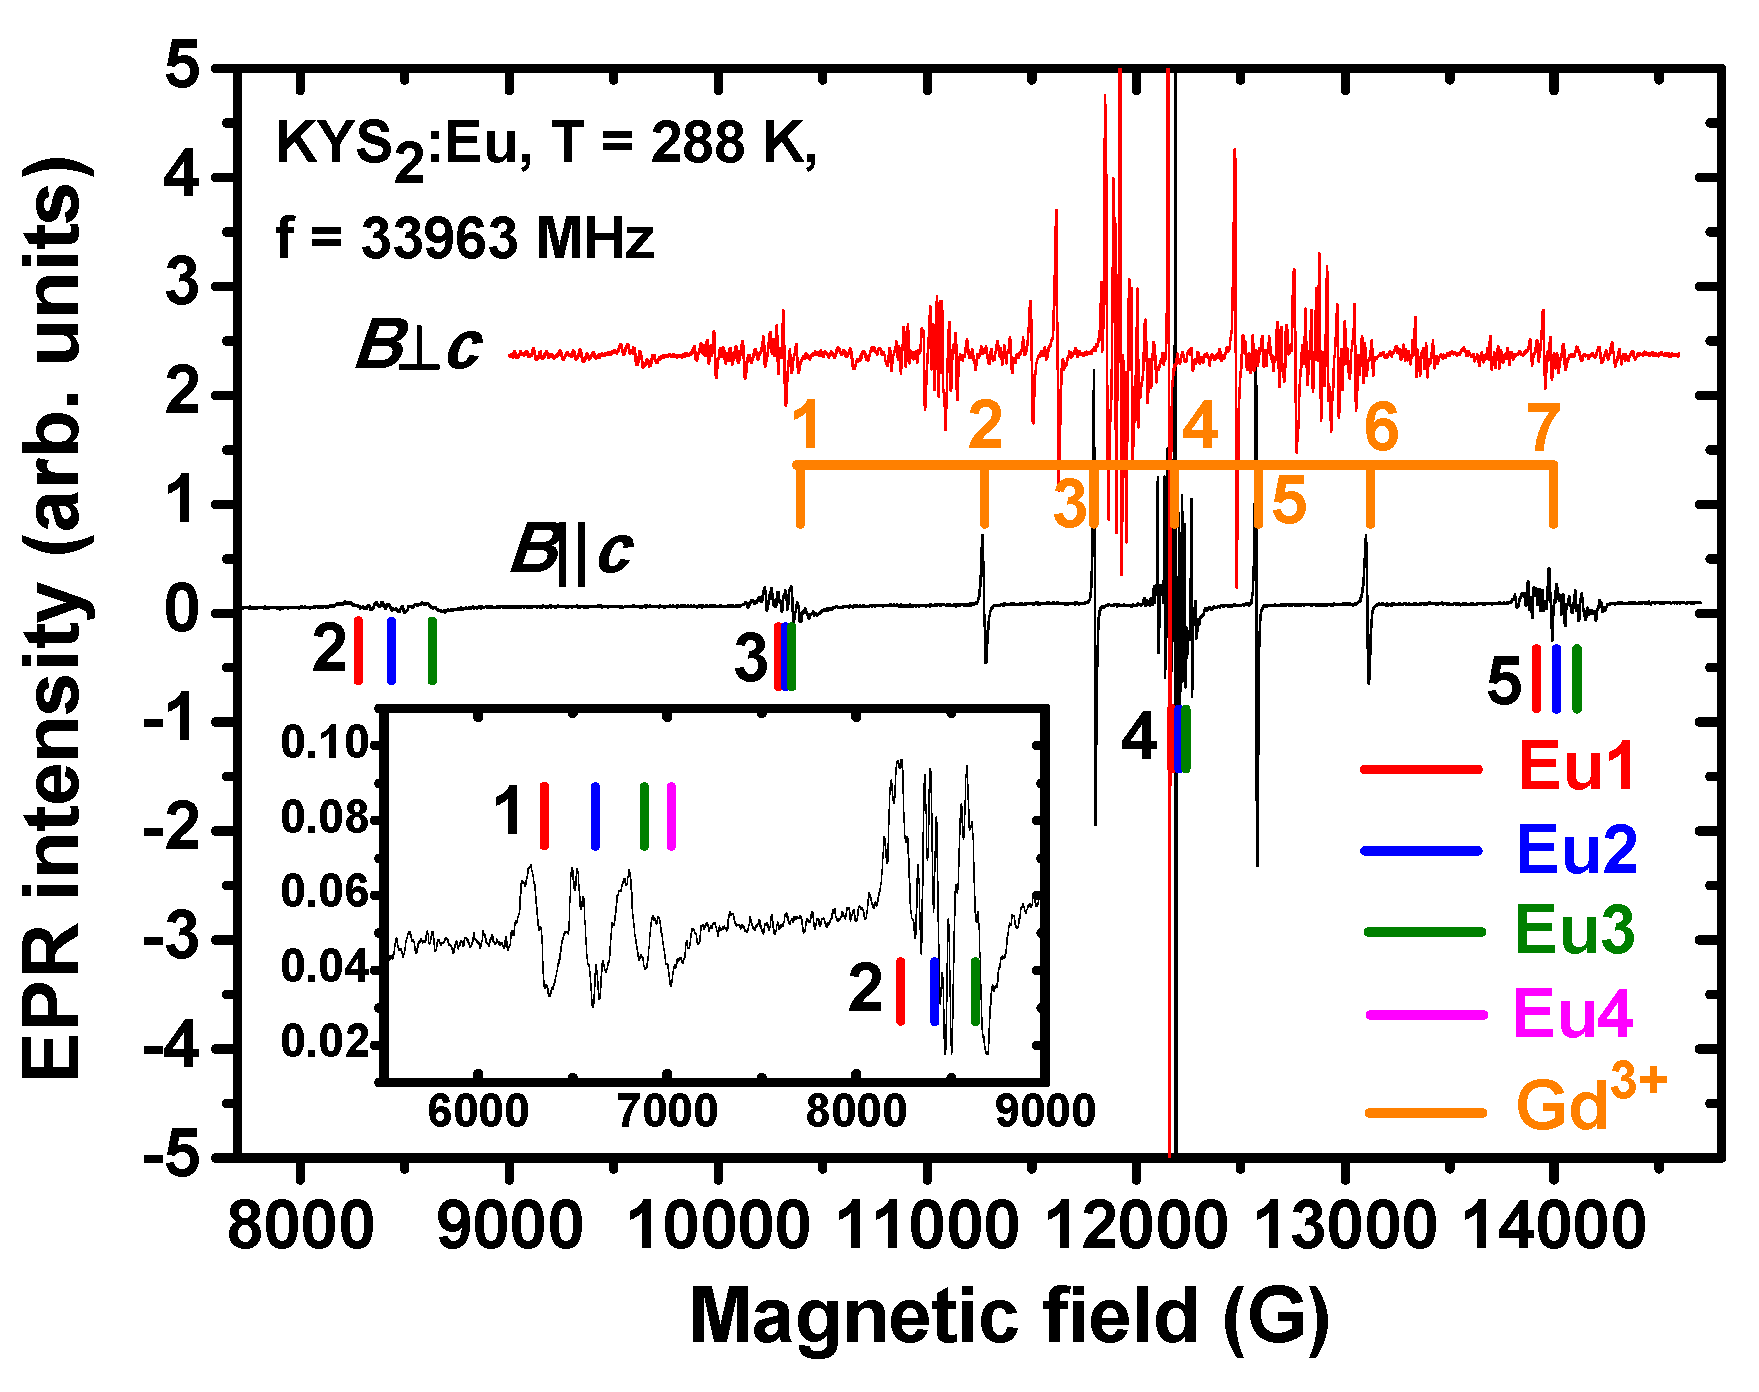
3.4.2. KYS2:Eu and KLuS2:Eu
EPR spectra of the Eu
2+ and Gd
3+ ions measured in KYS
2:Eu are shown in
Figure 12 for two characteristic orientations of magnetic field
B||
c and
B⊥
c.
In contrast to KLaS
2 EPR spectra in KYS
2 prove the existence of several distinct positions of the Eu
2+ ion in the lattice with different strength of crystal field. It can be seen in the low field edge of the Eu
2+ spectrum at
B||
c. Four and three resonance lines of almost equal intensity corresponding to the −7/2 ↔ −5/2 and −5/2 ↔ −3/2 spin transitions (“1” and “2” in the inset of
Figure 12) belong to four Eu
2+ centers designated as Eu1, Eu2, Eu3 and Eu4. Only the spectral components of the Eu1, Eu2, and Eu3 centers survive in the
B||
c to
B⊥
c angular dependence (
Figure S7 in Supplementary Materials) and were analyzed in detail. Similar to the KLaS
2:Eu, the Gd
3+ ions were assumed to substitute for the Y
3+ ions. Angular dependencies of the corresponding fine components are in
Figure S8 in the Supplementary Materials.
Figure 12.
EPR spectra measured in KYS
2:Eu single crystal at two magnetic field directions
B||
c and
B⊥
c. The numbers are assigned to particular transitions similar to
Figure 10. Inset demonstrates the low field edge of the spectrum where the line segments indicate the transitions produced by four Eu
2+ centers of almost equal intensity. They are designated as Eu1, Eu2, Eu3 and Eu4.
The
g factors, axial and cubic crystal field terms of both paramagnetic species and HF constants (for Eu
2+ only) were determined following the procedure applied to the KLaS
2:Eu above. They are listed in
Table 5. Unlike KLaS
2:Eu, the crystal field parameter
is much smaller than
and was neglected therefore, proving that the local surroundings of the centers are only slightly perturbed. Angular variations of the Eu
2+ and Gd
3+ spectra (
Figure S9 of
supplementary materials) in the (0001) plane exhibit nearly axial symmetry similar as in KLuS
2 [
28] and KLaS
2. The concentration ratio
n(Eu
2+)/
n(Gd
3+) was about 1.25. Even with such a small ratio there are four centers of the Eu
2+ as compared to the KLaS
2:Eu, where the Eu
2+ ions occupy only one site. Thus, the role of the Gd
3+ ions does not seem critical for the Eu
2+ incorporation in the KYS
2:Eu.
It should be noted that no Gd impurity was found in the X-ray fluorescence spectra of KYS
2:Eu, whereas Eu in 0.05% concentration was still detectable. When combined with the EPR measurements, this observation suggests that the majority of Eu ions in the KYS
2 sample are presented in the form of non-paramagnetic Eu
3+ and the actual concentration of Eu
2+ is very low, comparable with the concentration of background Gd impurity. Probably, a similar situation takes place in other ALnS
2:Eu sulfides, which can be corroborated by very high emission intensity in KLuS
2:Eu doped with only 0.002% Eu [
27].
The Eu2+ ions at two cation positions in the KLuS2:Eu [28] and KYS2:Eu can reasonably be ascribed to the lattice sites in the way that the higher value corresponds to the smaller Ln–S distance, whereas the lower one to the larger K–S distance. The Eu1 and Eu2 centers in the KYS2:Eu are supposed to be created by substitution of the Eu2+ for the Y3+ ions with regular and somehow perturbed ligand surroundings, respectively. Similarly, the Eu3 and Eu4 centers were assigned to the K+ sites.
The most profound difference among KLnS
2 (Ln = La, Lu, Y) is between
dLa–S and
dLu/Y–S distances (0.197, 0.153 Å, respectively,
Table 2) so the crystal field strengths of the trivalent sites should vary much more. The difference between K–S distances in the mentioned materials is in the range 0.020–0.088 Å (from
Table 2,
dK–S(KYS
2) −
dK–S(KLuS
2) = 3.174 Å − 3.154 Å = 0.020 Å and
dK–S(KLaS
2) −
dK–S(KLuS
2) = 3.242 Å − 3.154 Å = 0.088 Å), assuming slight deviations between the local crystal field strengths. Therefore, the Eu
2+ ion most probably occupies namely the La
3+ regular lattice site in KLaS
2. Its axial constant
in the KLaS
2 is almost two times lower than that in the KLnS
2:Eu (Ln = Lu, Y). The mechanisms of charge compensation in KLaS
2:Eu for the Eu
2+ at the trivalent site thus can be either
or
(
Vk denotes the potassium vacancy). The second charge compensation scheme is less likely, since concentration of potassium vacancies would then need to be similar to the Eu
2+ ions concentration. Such a great number of vacancies might cause very strong perturbation of the Eu
2+ local environment, significantly reducing the local trigonal symmetry. This impact on the local ligands should be detectable as the presence of anisotropy in the corresponding EPR spectra in the (0001) rotation plane. The first compensation mechanism
corresponds to slight distortions of the trigonal antiprism (see
Figure 1) since the presence of the antisite defects nearby (
) could hardly have a strong influence on the local Eu
2+ surroundings as their concentration is two times lower than the concentration of the Eu
2+ dopants. Most probably, the antisite defects are responsible for the mentioned local symmetry break in the KLaS
2:Eu.
The characteristic emission lines of the Eu
3+ ions, which are “invisible” for EPR, were observed in the luminescence spectra of all studied sulfides except for KLaS
2:Eu in the temperature range 8–200 K (
Section 3.3). We measured temperature dependencies of Eu
2+ EPR spectra in KYS
2 and KLuS
2in the temperature range 20–298 K (
Figures S10 and S11 in Supplementary Materials). No significant changes in the spectra occurred while cooling the samples to 40 K. Below this temperature the spectra become saturated due to long spin-lattice relaxation times. The ratio of resonance line intensities of at least two clearly visible spectral components originating from Eu
2+ centers was constant in the temperature range 40–298 K.
This is in a good agreement with the TD of RL data for KLuS
2:Eu (0.05%). Eu
2+ was claimed to occupy three different sites in the KLuS
2 structure [
28], namely the K
+ site, Lu
3+ site and defect-based sites (see also above). These sites provide slightly different emissions which can be obtained by decomposition of the spectra into three Gaussians. Therefore we decomposed the measured RL spectra at each temperature (see details in [
28]). We assumed that the positions (in eV) of each of three Gaussian components are temperature independent and therefore only band widths (expressed as full width at half maximum (FWHM) and amplitudes were varied in the fitting process. The product of
i-th band amplitude and
i-th band width provides the information about intensity released by the
i-th band. These products are indeed more or less constant, see
Figure S12 in the Supplementary Material, well matching the above-mentioned EPR results. Thus, the Eu
3+ ions exist in the materials initially along with the Eu
2+ ions and are not created due to the charge transfer between the Eu
2+ centers.
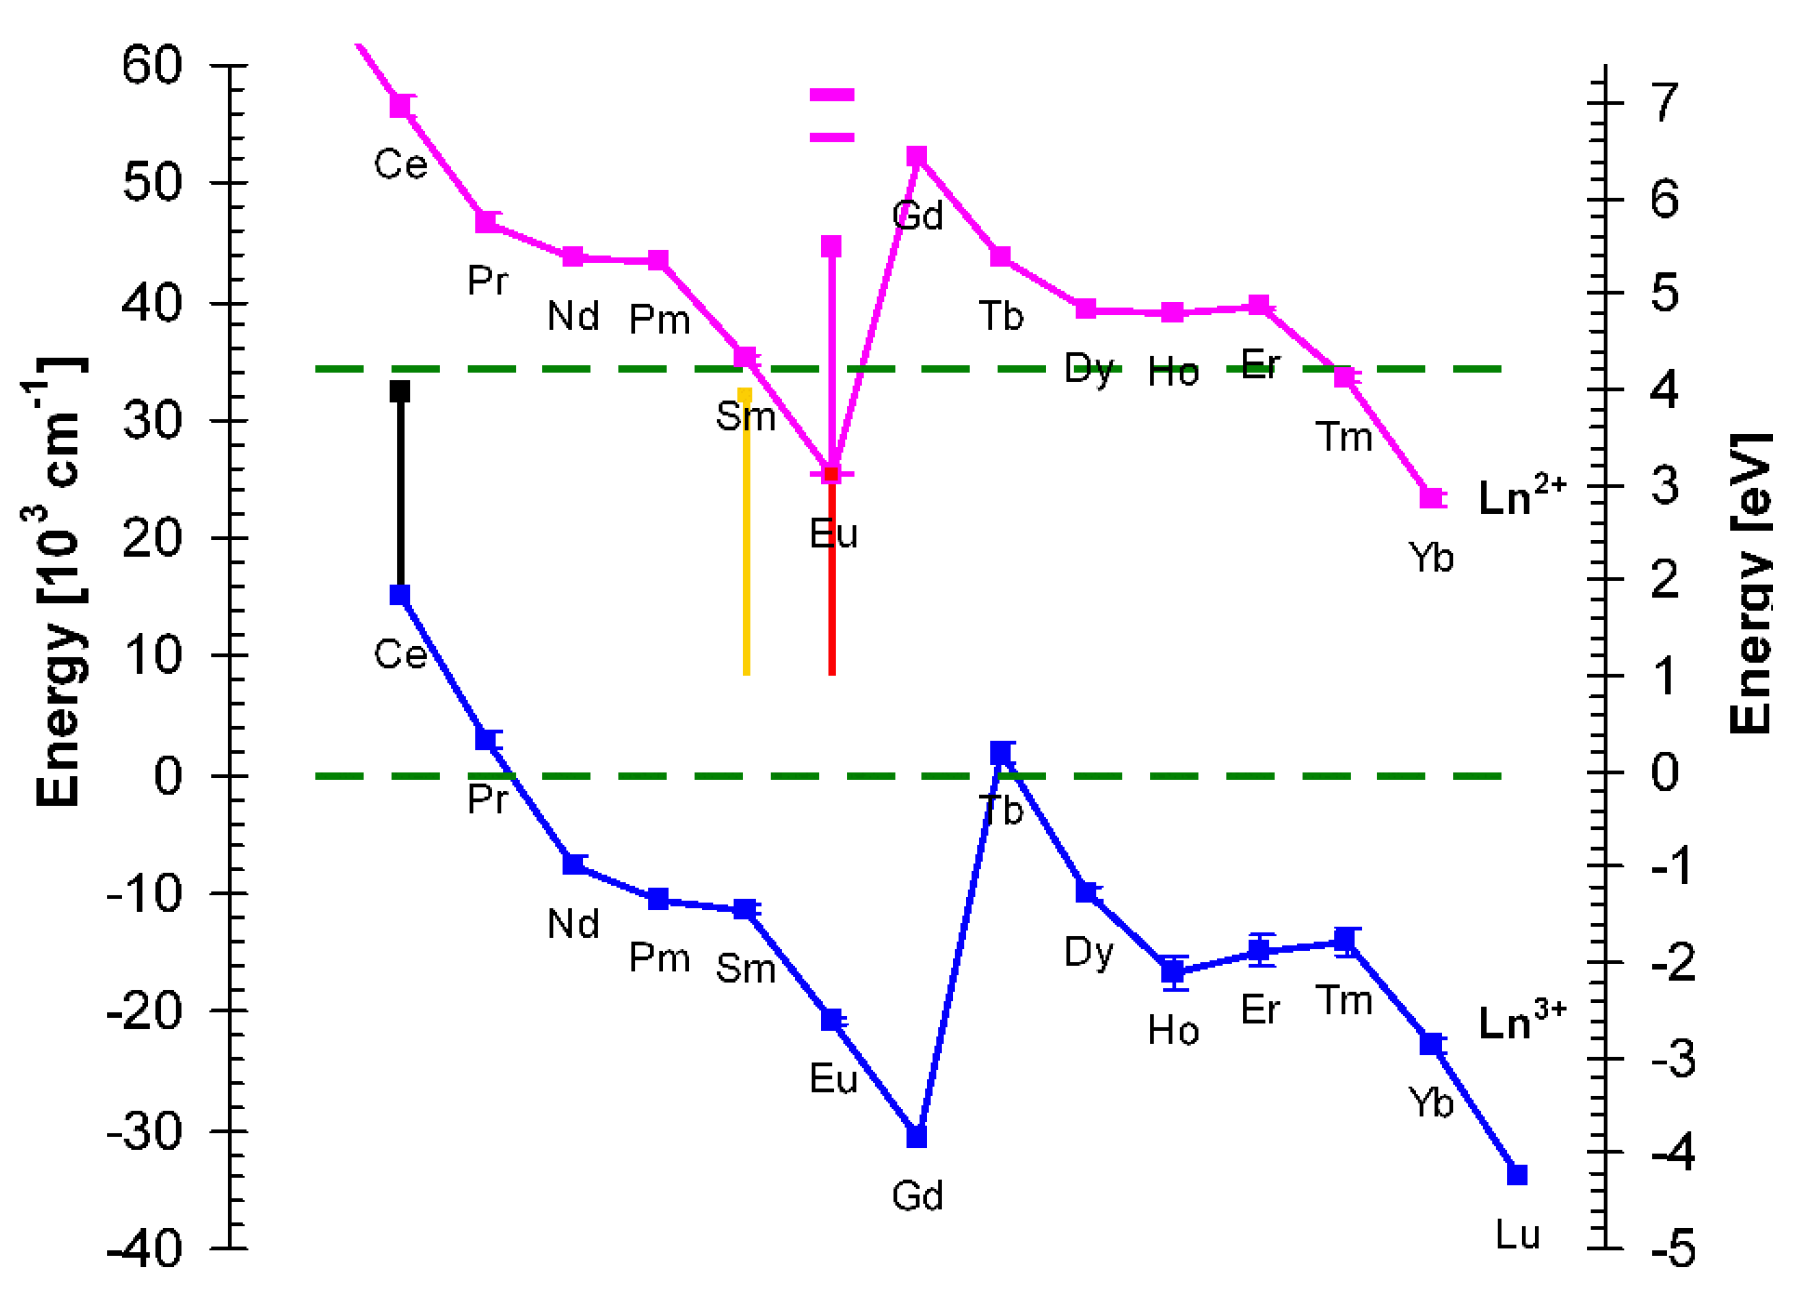
3.5. Energy Diagram of Lanthanide Levels in KLuS2
Figure 13 shows the most probable energy diagram of lanthanide energy levels in KLuS
2 host at 77 K constructed from the measured luminescence properties. Low temperature was chosen to interpret the Eu
3+ emission, which occurs only at lower temperatures. While discussing the energy levels of europium, we assume that both Eu
2+ and Eu
3+ ions occupy the Lu
3+ position in the KLuS
2 structure. The band gap of KLuS
2 at 77K estimated from photoluminescence excitation spectrum is at
ca. 291 nm (4.26 eV) and it corresponds to the distance between the top of the valence band and the bottom of the conduction band of the host lattice (the horizontal dashed lines in
Figure 13). From the position of the Eu
3+ CT band in PLE spectra at 396 nm (3.13 eV, see
Figure 8), we can locate the Eu
2+ 4f ground state to the energy diagram, following the procedure of Dorenbos [
54], according to which the CT process starts from the top of the valence band and the final state is the ground state of the divalent lanthanide. We also note here that the Eu
3+ CT band position and shape in the PLE spectra are practically identical for Eu-doped KLuS
2, KYS
2, KGdS
2, RbLuS
2 and NaLuS
2 (not shown here) at 77 K. Knowledge of the Eu
2+ ground state position allows us to approximately determine the position of the Eu
3+ ground state as well. Energy difference ΔE(Eu) between the 4f
6 ground state of Eu
3+ and the 4f
7 ground state of Eu
2+ is reported to reflect the type of anions in the compound and was very roughly estimated to be ≈5.7 eV in the ternary sulfide host [
55] (namely in CaGa
2S
4 [
7]). We would like to stress that this is a very rough approximation and can only be used for qualitative description. Following such an approach [
55], the ground state of Eu
3+ in KLuS
2 at 77 K was shown to be deeply inside the valence band (
Figure 13), possibly even under the valence band. Similarly, the Eu
3+5D0 excited state seems to lie inside the valence band as well. A very approximate valence band width of 4 eV can be derived using [
56] where the electronic structure of RbLnSe
2 was calculated, which is isostructural with ALnS
2 sulfides. However, the characteristic intense Eu
3+ emissions from
5D0 level to
7Fx levels were clearly observed in the KLuS
2 host at low temperature (see
Figure 9), which means that the energy from the CT state (4f ground state of Eu
2+) is transferred, probably via intersystem crossing, to an excited state of Eu
3+. This is a common situation for (Eu
3+) [
54]. Interestingly, the energy diagram of lanthanide energy levels in CaGa
2S
4 [
7] shows that the CT band of Eu
3+ is predicted even below 2 eV. Such low values in practice imply that Eu
3+ is not stable in CaGa
2S
4 and therefore Eu
2+ is formed during synthesis [
48].
Another possibility of how to estimate the Eu
3+ CT transition position in the forbidden gap is to use the known value of Sm
3+ CT in KLuS
2 which is situated at 313 nm (3.96 eV, vertical dots in
Figure 13) [
30]. According to Dorenbos [
57], the energy difference between CT Sm
3+ and CT Eu
3+ is equal to
ca. 9800 cm
−1 (1.22 eV), which locates the Eu
3+ CT in KLuS
2 at 2.75 eV. This is not far from the experimentally obtained value 3.13 eV. The error is assumed to be systematic for each lanthanide and on the order of 0.5 eV [
58]. It needs to be mentioned here that a similar lanthanide energy level scheme for a compound with comparable band gap, namely GaN (band gap 3.42 eV), was published [
55,
59]. Dorenbos had already published numerous papers connected to such energy diagrams for various compounds, for example YPO
4 [
54], Y
2O
3, CaBPO
5, KCl [
60], CaF
2 [
54], Al
xGa
1 - xN [
55] and therefore following his procedure was also considered applicable for our KLuS
2 ternary sulfide.
Figure 13.
The proposed lanthanide energy level scheme in KLuS2 at 77 K, description in text.
Figure 13.
The proposed lanthanide energy level scheme in KLuS2 at 77 K, description in text.
From what was said above a crucial question arises: What is the cause of Eu
3+ quenching in KLuS
2? We believe that an explanation will also be valid for other Eu-doped ternary sulfides, in which we observed Eu
3+ emission at low temperature, those being KGdS
2, KYS
2, RbLuS
2 and NaLuS
2. First, it is rather unlikely that classical thermal quenching (ergo return of the electron from the excited state of Eu
3+ to its ground state via phonon interaction without any radiation) would be responsible for observed Eu
3+ vanishing. In [
61] it is shown that the temperatures of thermal quenching for Eu
3+ emission (when excited via Eu
3+ CT band) are very much above RT even in oxysulfides. Secondly, thermally induced ionization of the Eu
3+ exited state to the conduction band of host is completely unfeasible as this state lies within the valence band of the host. Ionization to any state within the valence band is excluded as all the states should be occupied by electrons. Based on the work of Blasse [
48] it appears that a possible source of Eu
3+ quenching might by the crossing of the Eu
3+ excited and ground state parabolas with the parabola representing the Eu
3+ CT state (see
Figure 1 in [
48]). At low temperature Eu
3+ emission is observed. With an increasing temperature system in the Eu
3+ excited state
5D0 can acquire thermal energy (≈370 meV) sufficient to reach the crossing point with the CT state parabola, in which case no light emission would be observed.
Moreover we are aware that showing energy diagram as depicted in
Figure 13 cannot explain every Eu feature we have investigated. Eu
2+ 4f-5d absorption band in KLuS
2 at low temperature peaks at 394 nm and emission 5d-4f at 520 nm (see
Figure 8). Taking into account both the position of the Eu
2+ ground state 3.13 eV above the top of the valence band and the diagram from
Figure 13, the Eu
2+ excited state would have to be buried in the conduction band of the KLuS
2 host. It implies that the Eu
2+ center would be ionized at any temperature. However, this is not observed. From Eu
2+ 5d-4f photoluminescence decay time measurements we know that the decay time shortening starts around 480 K (see
Figure 6c). Baran
et al., investigated binding energies of europium in β-Ca
2SiO
4 doped (purposely) by both Eu
2+ and Eu
3+ ions [
62]. They proposed that both conduction and valence bands can bend (see
Figure 13 in [
62]). The band bending occurs in the vicinity of a certain defect and two Eu
3+ ions. It has a local character, because the defect and two Eu
3+ ions do not create long range Coulomb potential. Possibly, similar local band bending can appear in the Eu-doped KLuS
2, promoting a location of the Eu
2+ excited state under the bottom of the conduction band. The latest approach of energy level modeling of lanthanide materials is published in [
63]. Nevertheless, more experimental work, both optical and paramagnetic, will definitely have to be carried out in the future to complete an explanation of all the observed features.
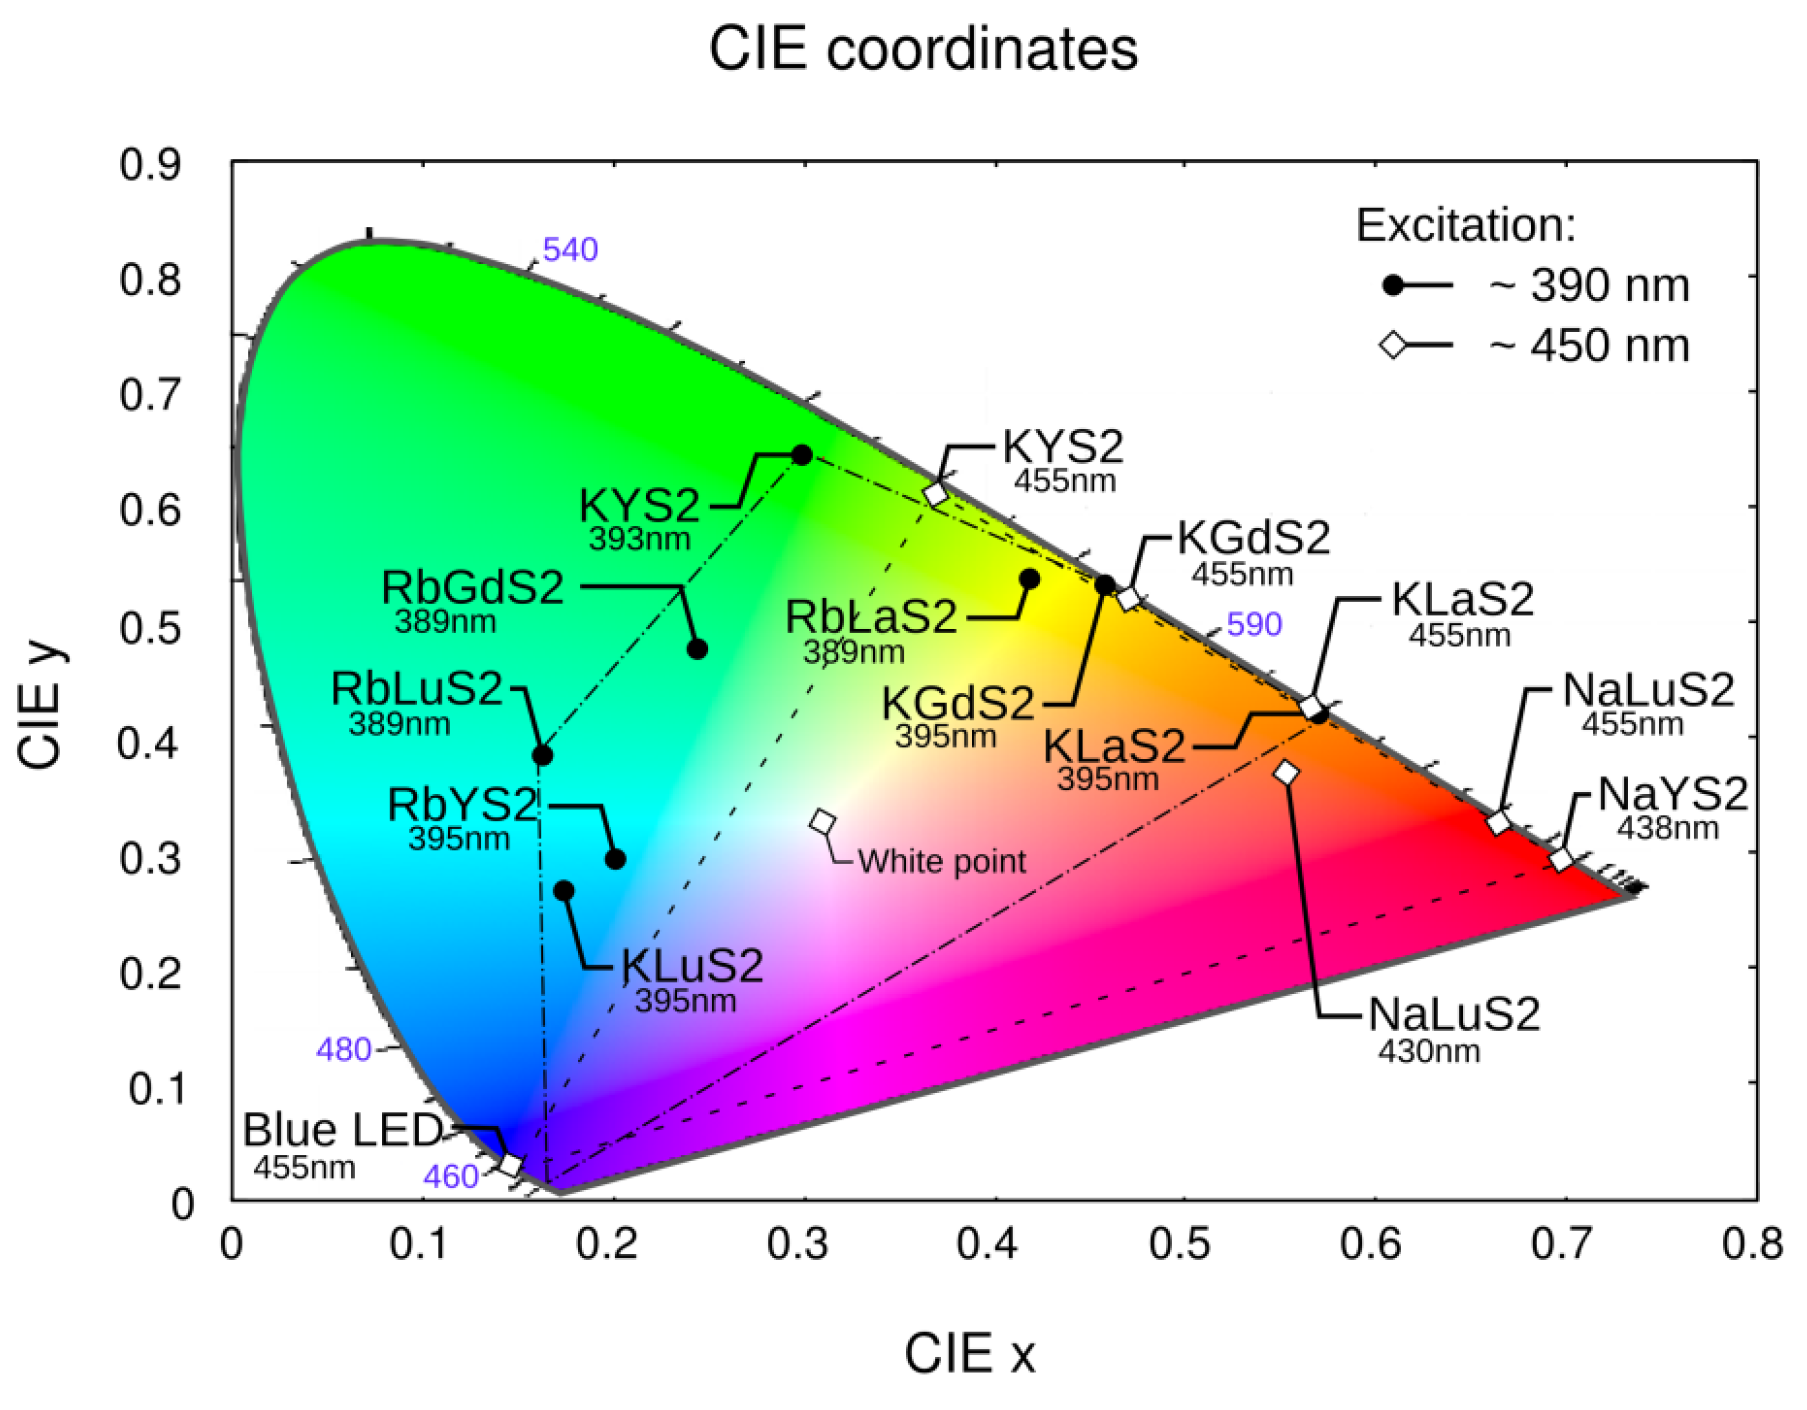
3.6. CIE Coordinates
CIE 1931 coordinates were calculated for the presented samples under different excitations, see
Figure 14. Dashed (exc. 390 nm) and dash-and-dot (excitation 455 nm) lines show colors available by mixing the emission spectra of the samples—A large area of visible color space is covered, which outlines a great potential in solid-state lighting applications. KLuS
2, RbYS
2, RbLuS
2, under 395 nm excitation, provide a good opportunity for tuning white correlated color temperature (CCT). The same is valid for NaLuS
2 and KLaS
2 under 455 nm excitation, where the red color produced could find its application also in improving the color rendering index (CRI) of state-of-the-art materials (e.g., YAG:Ce with 455 nm blue LED source, where mainly blue and yellow light is present).
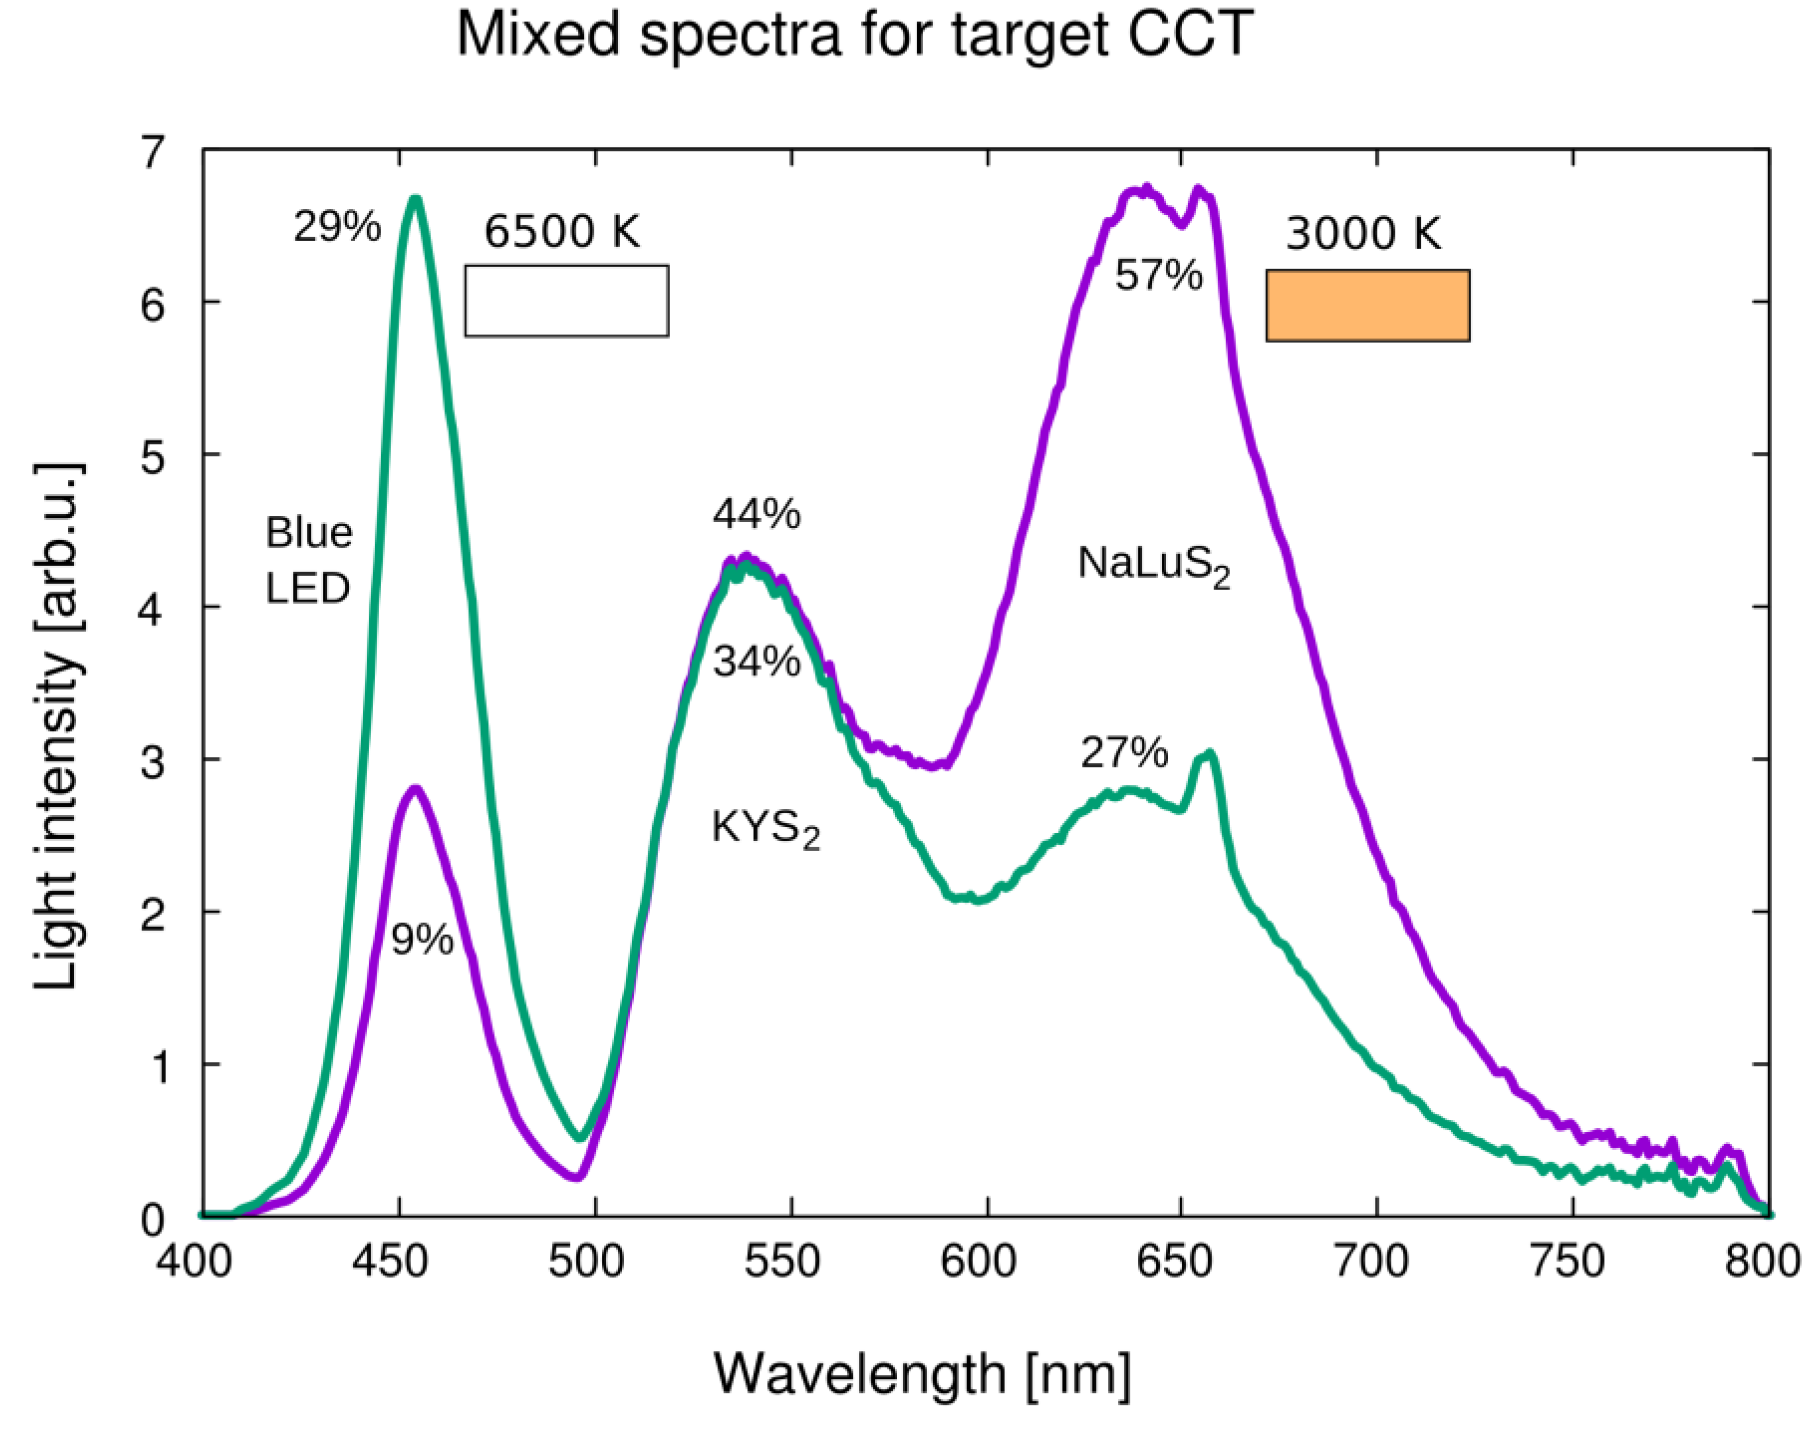
To demonstrate the potential of studied materials, combined spectra were calculated for 455 nm excitation and target CCT of 3000 K and 6500 K, respectively, using blue LED source, KYS
2 and NaLuS
2 as building blocks (see
Figure 15). Composition of the spectra was calculated using an optimization routine. Using other presented materials and their different active volume, a large area of color space is available for composed light devices (denoted by lines in
Figure 14). A slight difference will be present in reality, because we use the emission spectrum of the source, while in the real applications the spectrum needed is an emission spectrum of the source after passing through the light device to the detector (
i.e., after light absorption).
Figure 14.
Commission Internationale de I’Eclairage (CIE) 1931 color coordinates calculated for samples under ~390 nm excitation (dark points, labeled inside) and ~450 nm excitation (empty diamonds, labeled outside)—Actual excitation is written below each sample label. Blue light emitting diode (LED) at 460 nm added for comparison. Lines denote colors available by mixing multiple materials under 390 nm and 455 nm excitation, respectively.
Figure 15.
Spectral profile obtained by combination of three spectra (blue LED source, KYS2 and NaLuS2) to obtain 3000 K (9%, 34%, 57%) and 6500 K (29%, 44%, 27%) light with 455 nm excitation source. Approximate resulting white light colors are demonstrated in color boxes. CCT: correlated color temperature.


