2.1. Materials Composition and Microstructure Parameters
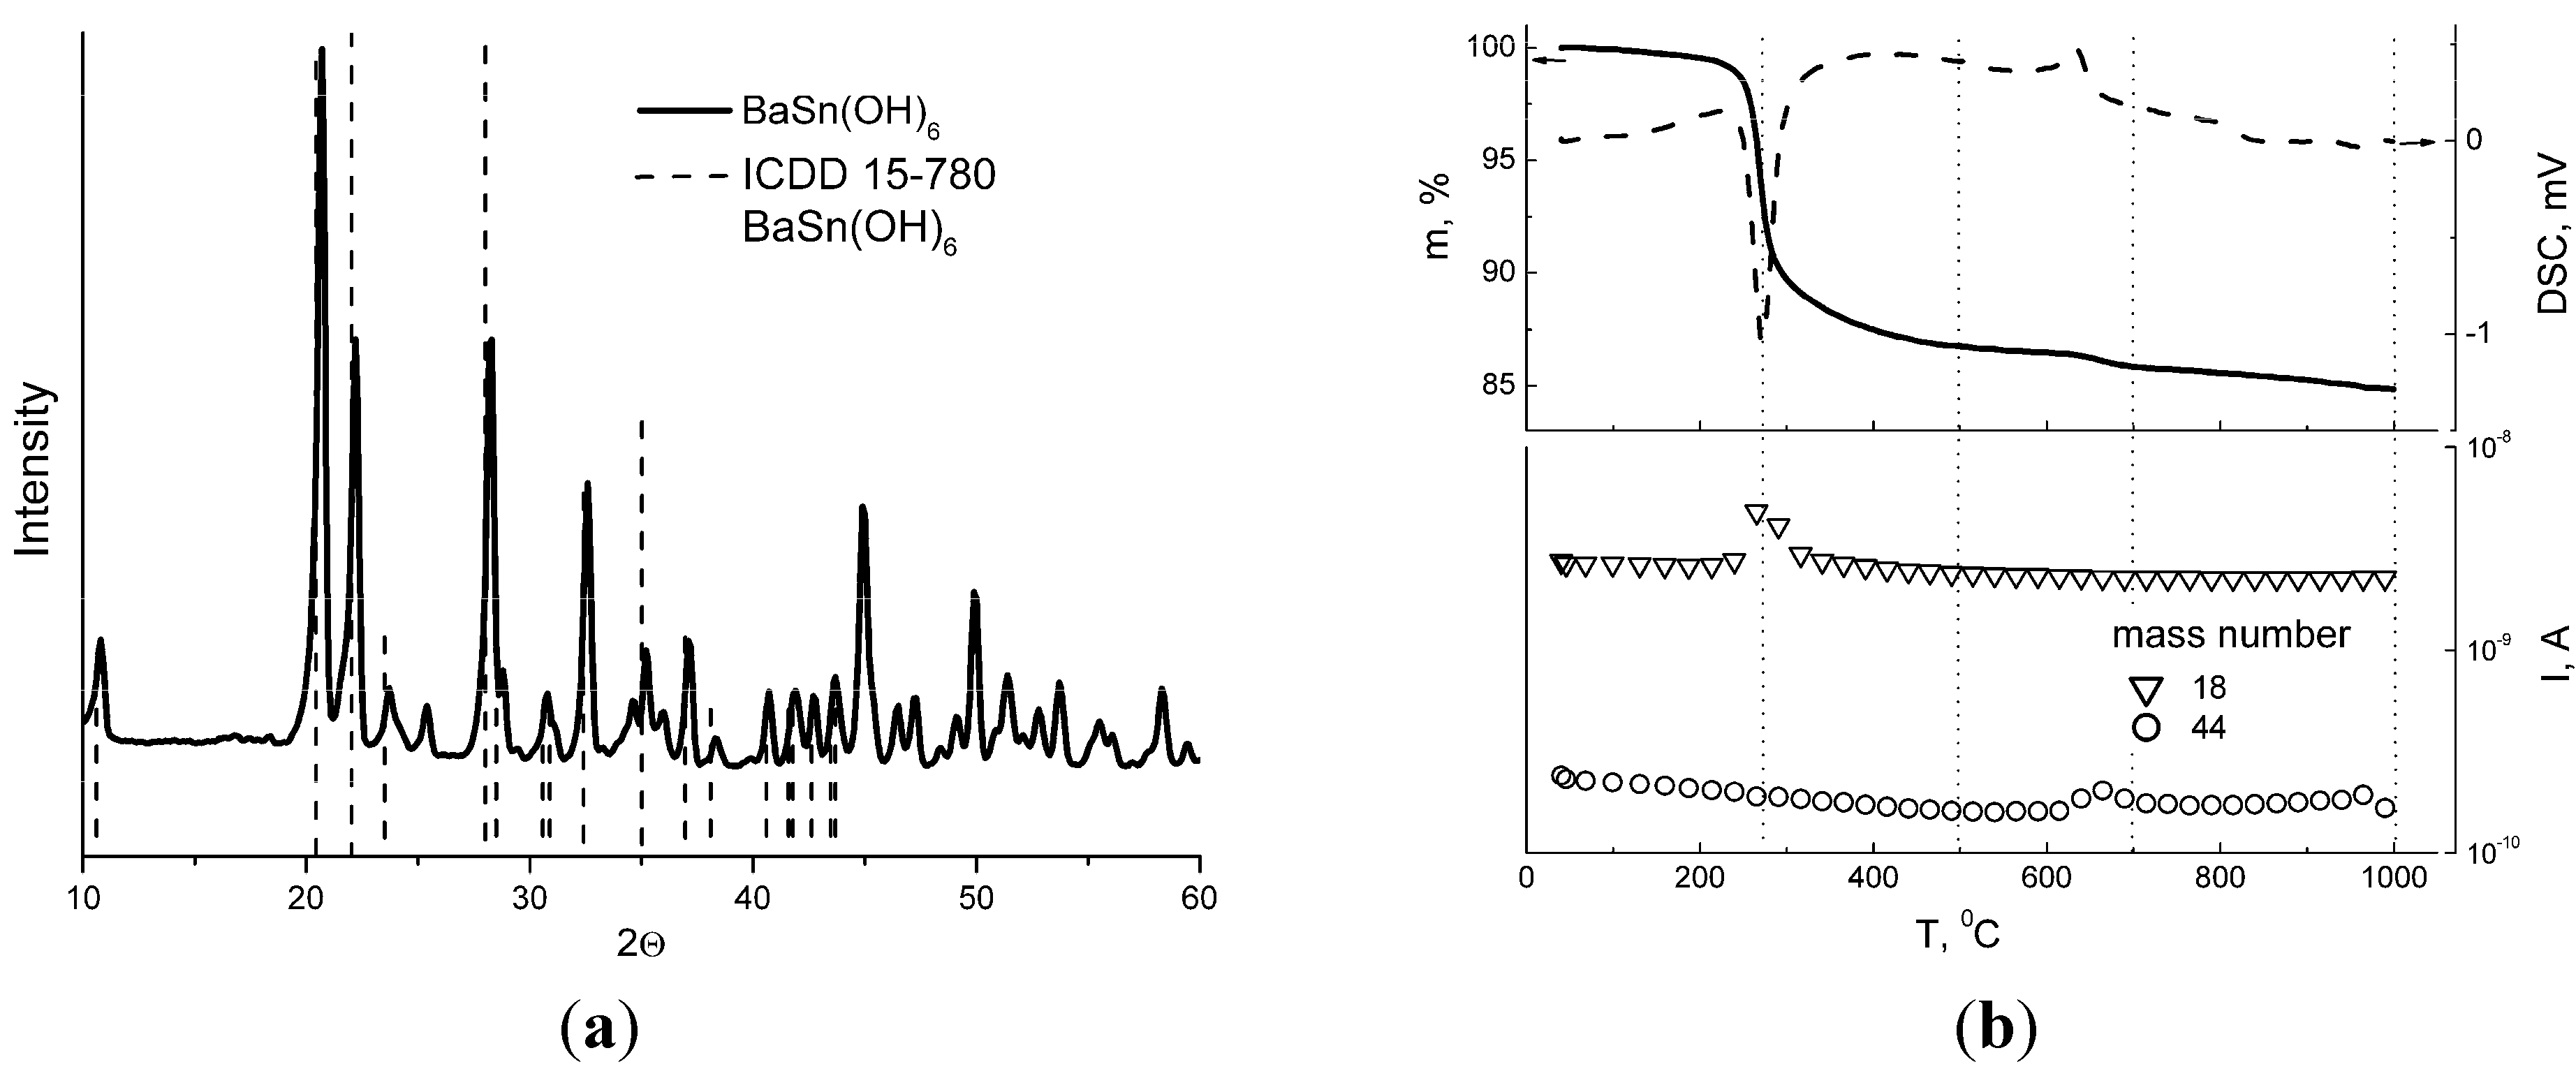
The powder yielded from hydrothermal treatment of barium-tin hydroxide consisted of BaSn(OH)
6 phase with crystallite size
dXRD = 21–27 nm (
Figure 1a). The results of as-obtained BaSn(OH)
6 analysis by thermogravimetry-differential scanning calorimetry with mass-spectrometric detection of outlet gas (TG-DSC-MS) revealed four features (
Figure 1b). The largest mass-loss step accompanied by strong endothermic peak at 275 °C is due to water elimination (mass number 18 in
Figure 1b) that is consistent with the literature [
25]. The amount of desorbed water during the first mass-loss stage, which was completed at ~500 °C, equals to the composition BaSnO
3·3H
2O corresponding to BaSn(OH)
6. At ~700 °C, a small mass-loss (0.5 wt %) along with CO
2 evolution peak (mass number 44) were observed (
Figure 1b). The emergence of an exothermic DSC peak suggests that barium stannate crystallinity increased at this temperature, probably at the expense of some carbonate decomposition. At 1000 °C, additional CO
2 evolvement with a slight mass-loss were detected by TG-DSC-MS. Thus, annealing BaSn(OH)
6 at the four featured temperatures was performed to obtain distinct barium stannate samples. Tin dioxide samples synthesized for comparison were processed at the same temperatures.
Figure 1.
(a) XRD pattern of BaSn(OH)6 obtained by hydrothermal treatment of barium-tin hydroxide; (b) Thermogravimetry (solid line) and differential scanning calorimetry (dashed line) curves for hydrothermally-treated BaSn(OH)6 (upper plot) with the results of mass-spectrometry analysis of the outlet gas (lower plot).
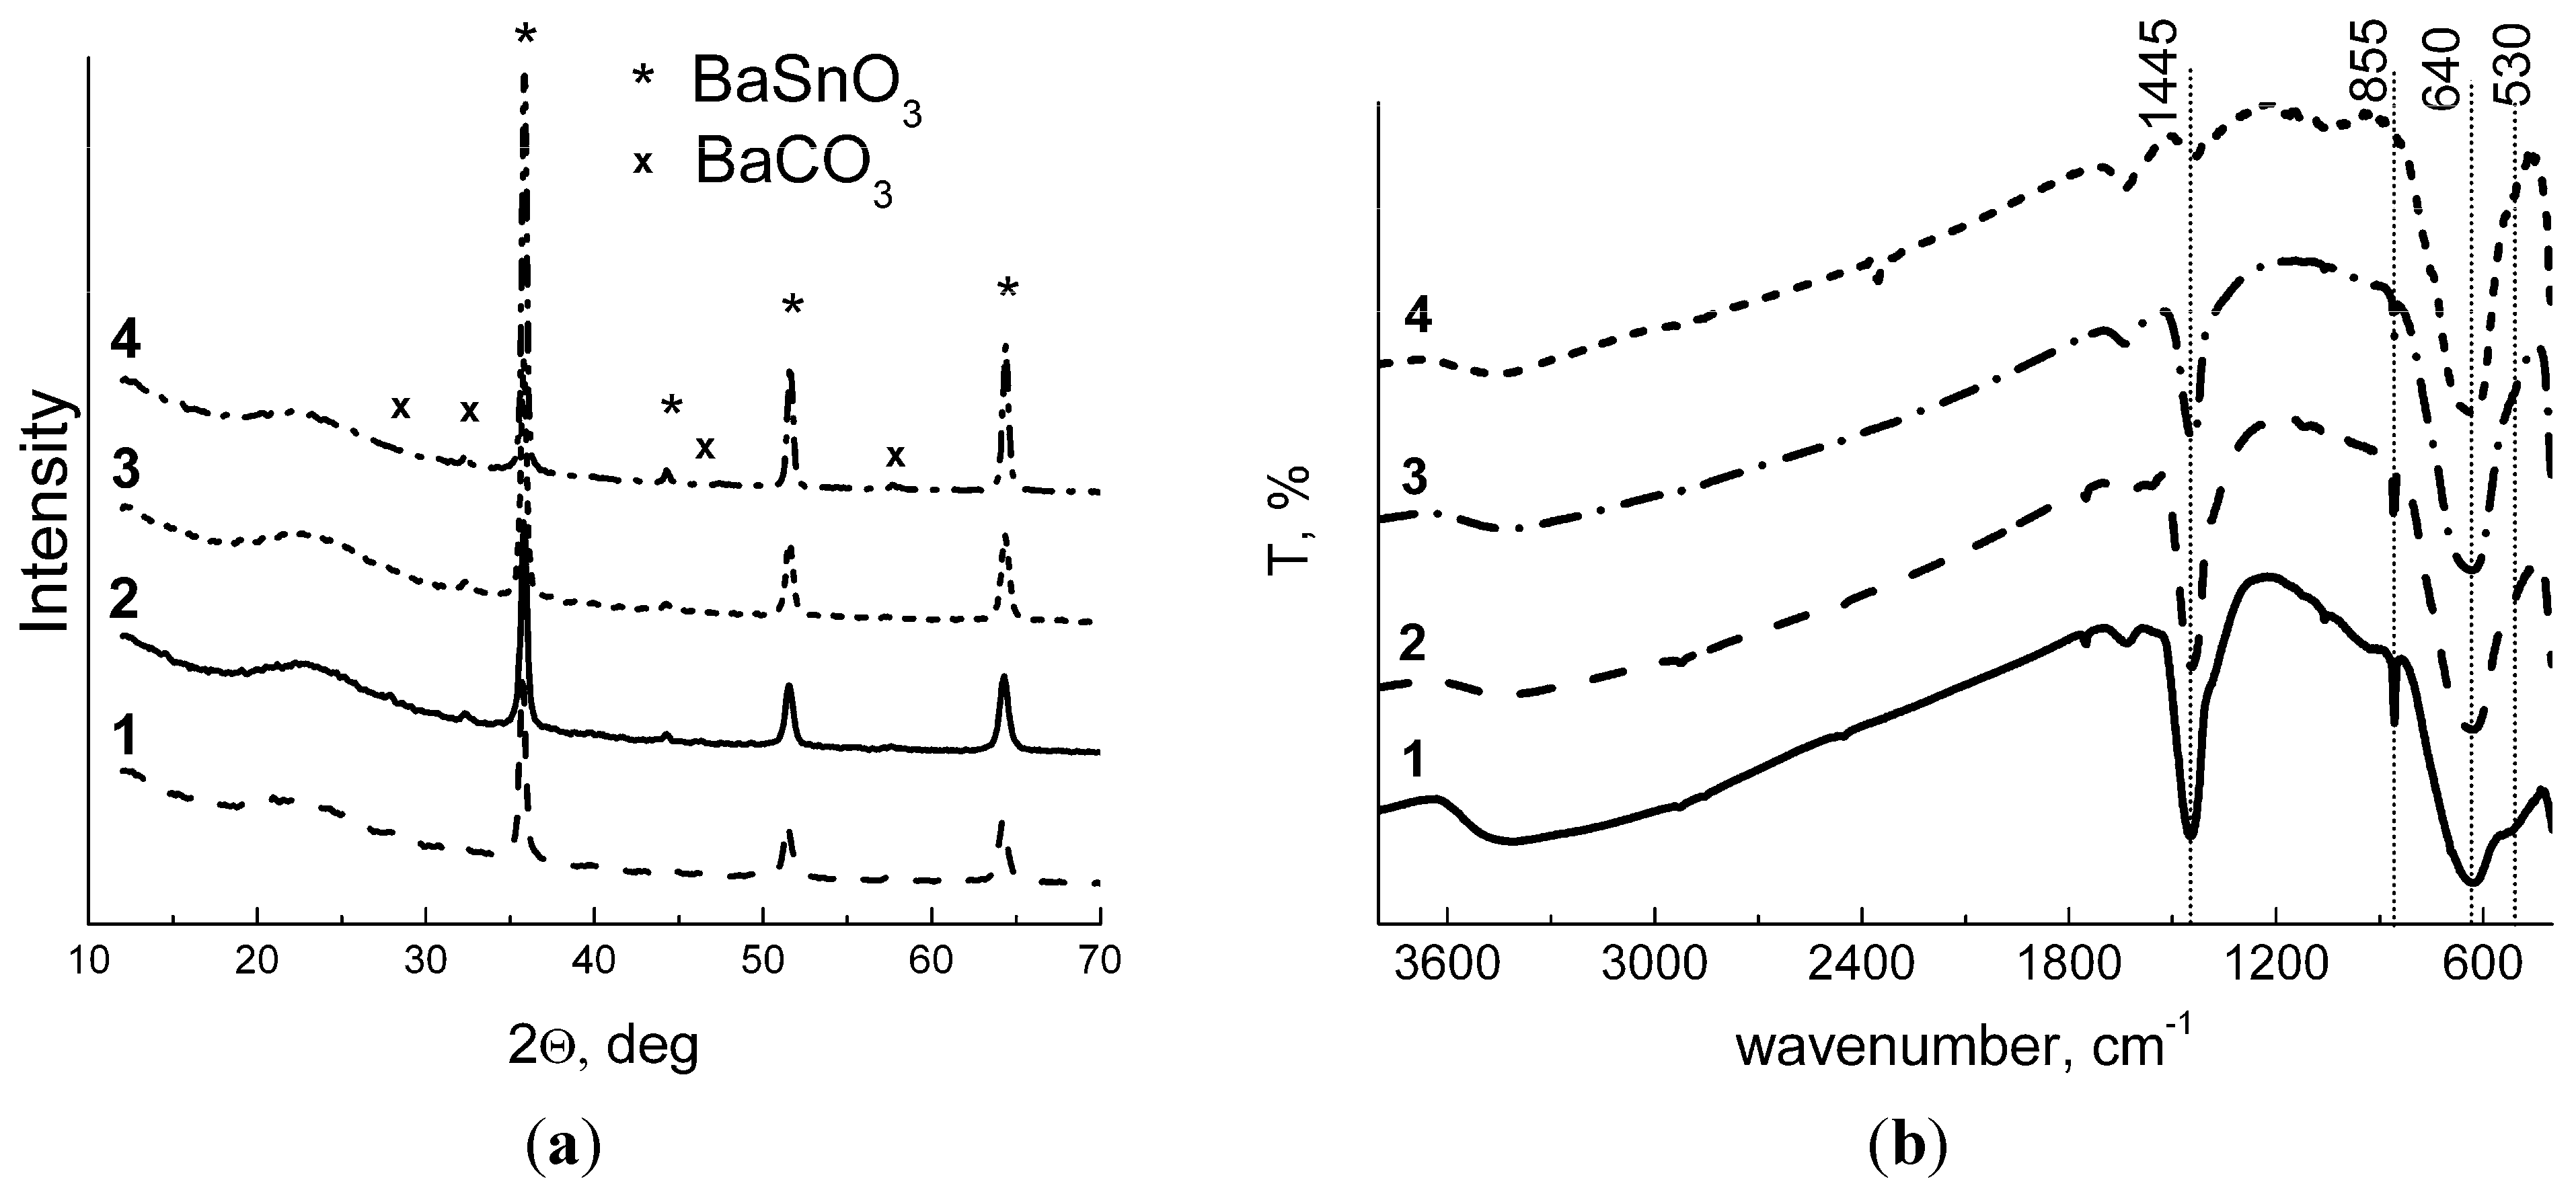
According to X-ray diffraction (XRD) patterns, barium stannate samples consist of well-crystallized cubic perovskite phase with a small impurity of BaCO
3 (
Figure 2a). The appearance of carbonate impurity in BaSnO
3 was observed elsewhere, despite the hydrothermal synthesis had been performed under inert atmosphere [
27]. Fourier-transformed infrared (FTIR) spectra showed the decrease of characteristic carbonate peaks at 1445 cm
−1 and 855 cm
−1 with the increase of annealing temperature, so that in the BaSnO
3-1000 sample carbonate species were hardly detectable (
Figure 2b). The major peak at 640 cm
−1 is due to stretching vibrations of {SnO
6}-octahedra [
26,
35]. The intensity of hydroxyl stretching band (3600–3200 cm
−1) and Sn-OH peak at 510 cm
−1 diminish with the increase of annealing temperature. As follows from
Figure 2a and
Table 1, the variation of annealing temperature in the range 275–700 °C had negligible effect on BaSnO
3 crystallinity and microstructure parameters: the samples have close mean crystallite size (
dXRD = 18–23 nm) and specific surface area of 5–10 m
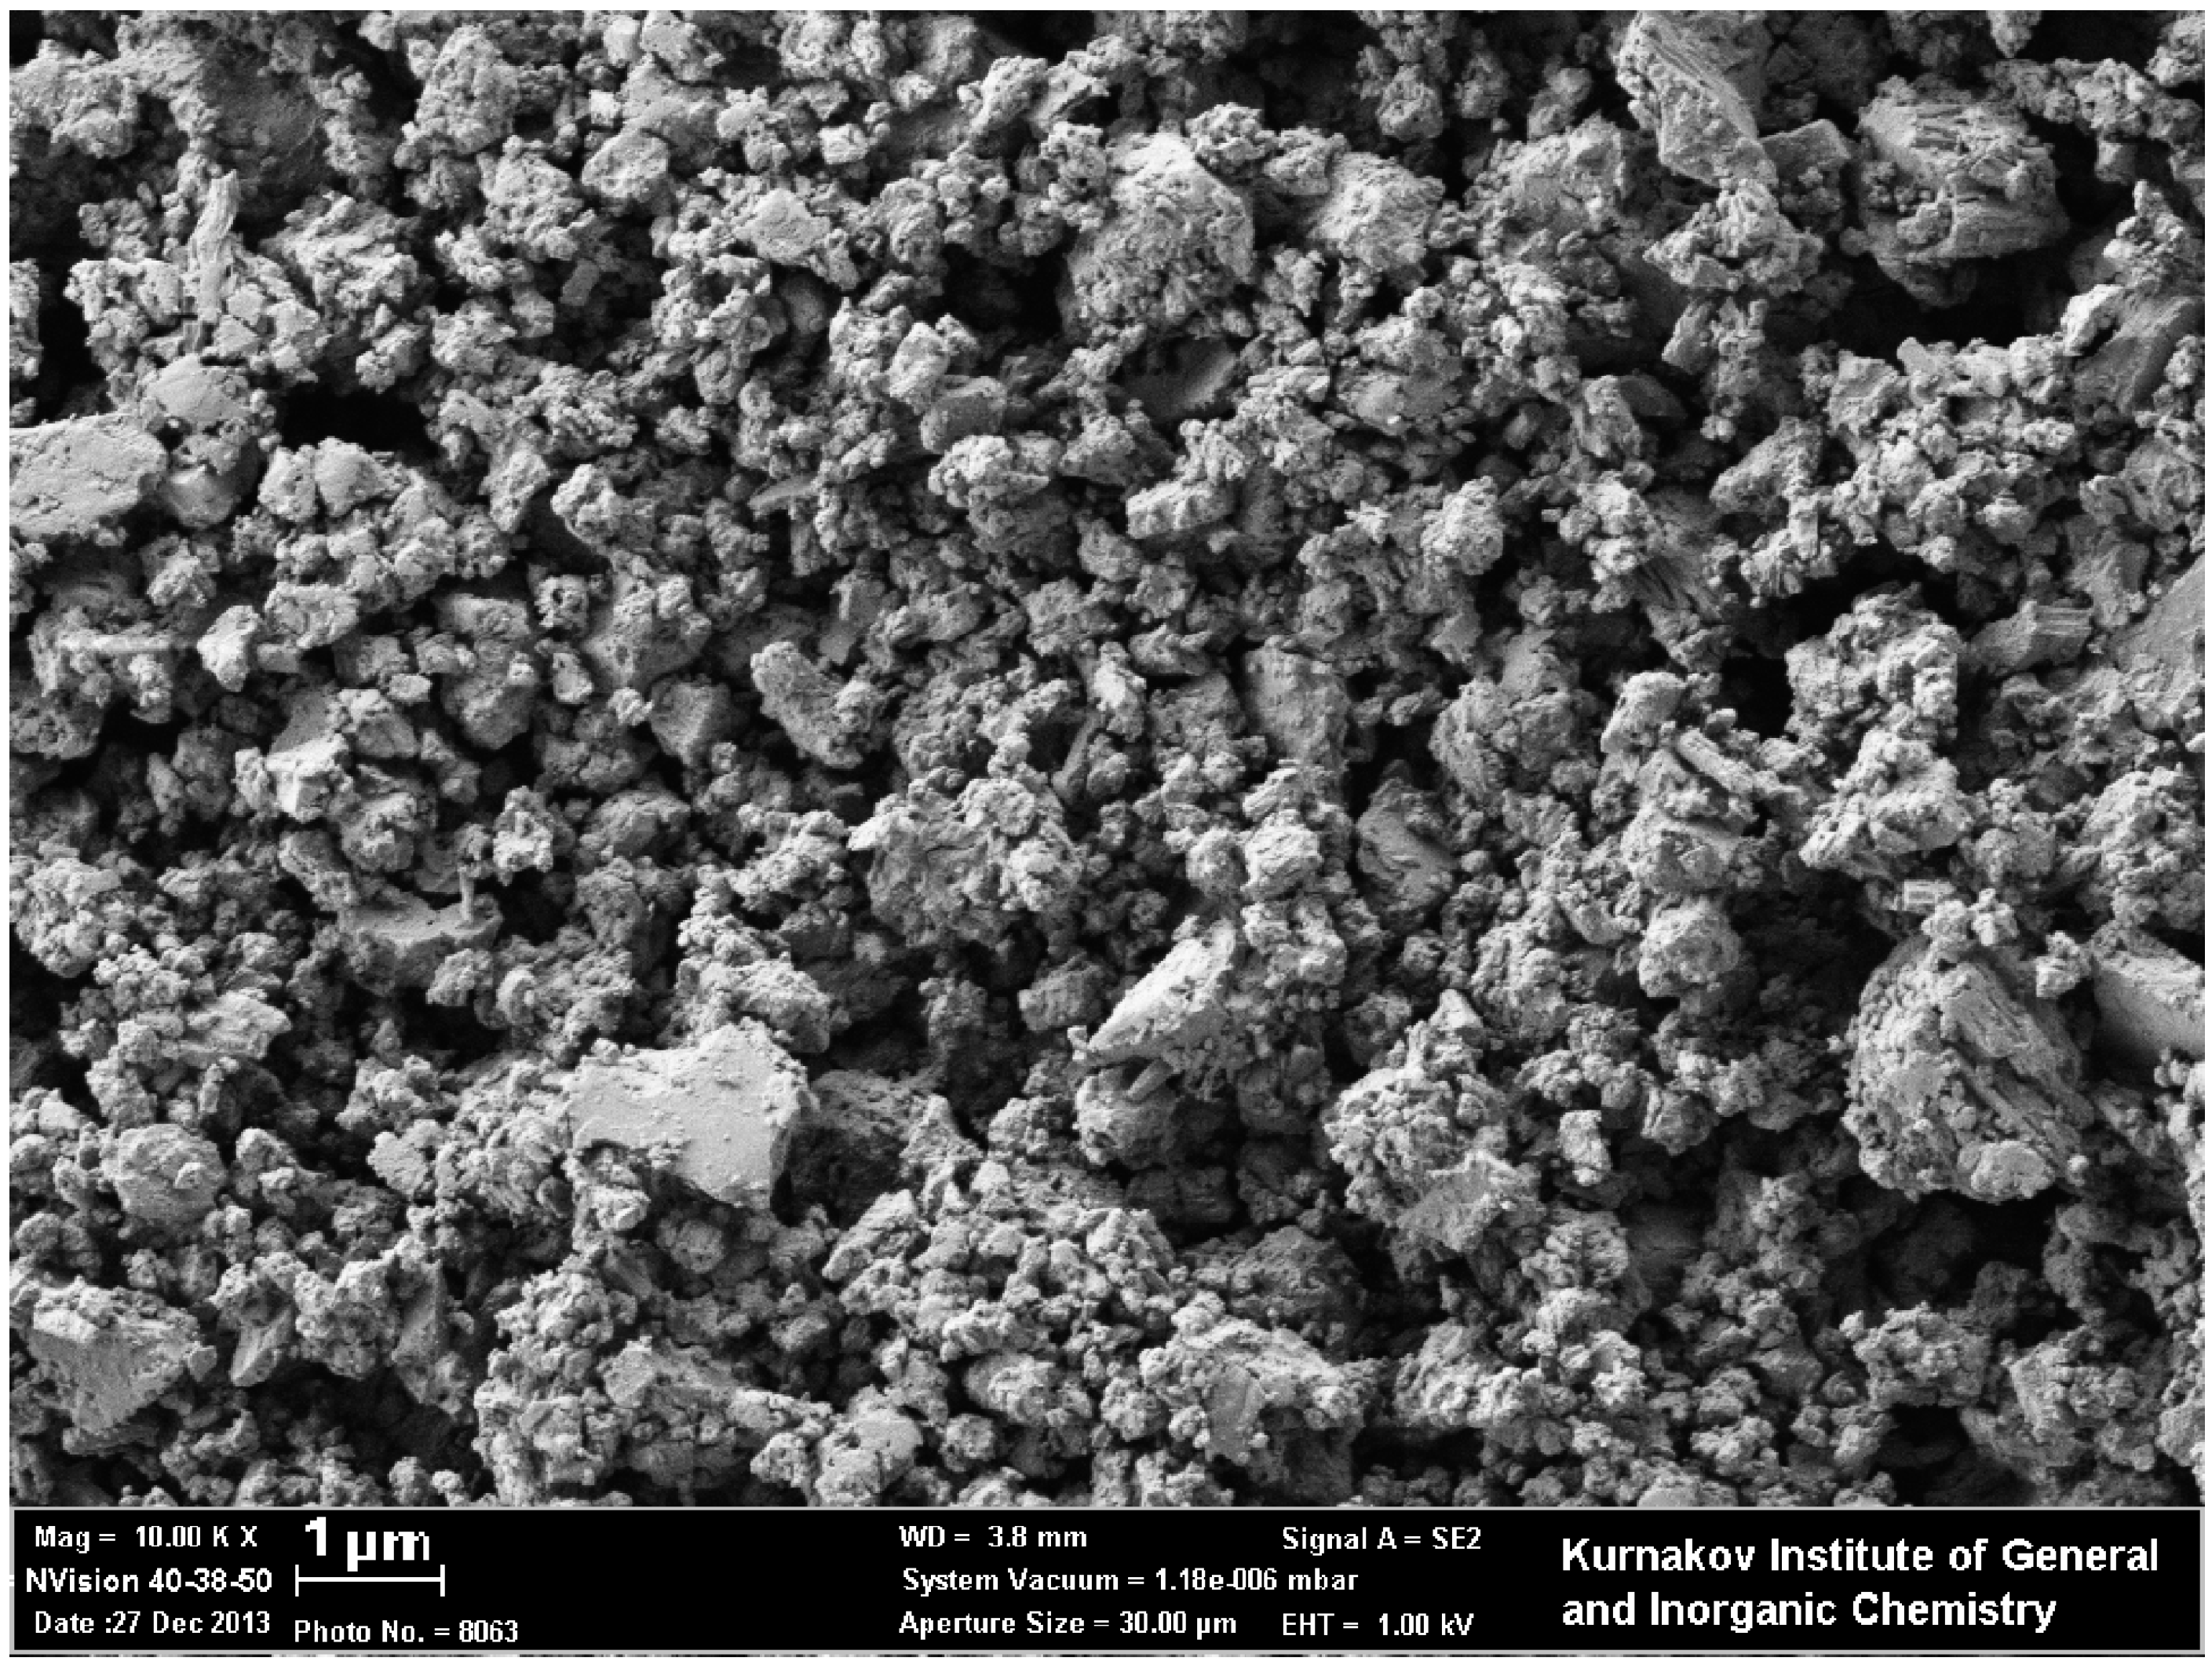
2/g estimated by Brunauer-Emmett-Teller (BET) method. Imaging the samples using scanning electron microscopy (SEM) visualized polycrystalline porous structure of the surface (
Figure 3). It is likely represented by agglomerates of BaSnO
3 crystallites, the size of agglomerates widely distributed in the range 0.1–1 μm.
Figure 2.
XRD patterns (a) and FTIR spectra (b) of BaSnO3 samples annealed at different temperatures: (1) −275 °C, (2) −500 °C, (3) −700 °C, and (4) −1000 °C.
Figure 2.
XRD patterns (a) and FTIR spectra (b) of BaSnO3 samples annealed at different temperatures: (1) −275 °C, (2) −500 °C, (3) −700 °C, and (4) −1000 °C.
Annealing barium stannate at 1000 °C resulted in a twofold increase of its mean crystallite size and respective decrease of BET area (
Table 1). Noteworthy, the improved crystallinity of BaSnO
3-1000 is coincident with the cleavage of carbonate impurity (
Figure 2b). On the other hand, tin dioxide samples were phase-pure (XRD patterns in Supplementary data). Tin dioxide was prepared by the calcination of as-deposited and dried at 50 °C xerogel SnO
2·nH
2O, so that its crystallization occurred on the annealing stage. That is why its particle size and surface area were strongly dependent on the annealing temperature value. On the other hand, as-deposited barium-tin hydroxide was hydrothermally treated at 200 °C (pressure was 16–24 bar), that was necessary for BaSn(OH)
6 phase formation and its further transformation in BaSnO
3 phase during calcination. It is likely that the well-crystallized character of BaSnO
3 was determined on the stage of hydrothermal treatment, so that variation of annealing temperature influenced slightly its particle size and surface area. An important factor here seems to be the presence of BaCO
3 impurity which could be segregated on BaSnO
3 particles and protect them from thermally induced aggregation. Alternately, the carbonate impurity because of more ionic character and different structure could inhibit ionic diffusion in BaSnO
3 structure, thus preventing its crystallites growth. This could also explain the coincidence of carbonate disappearance and sharp increase of BaSnO
3 crystallinity in the material annealed at 1000 °C and their microstructure parameters were strongly dependent on annealing temperature in the whole range (
Table 1). Such a contrast in the trends of BaSnO
3 and SnO
2 microstructural parameters with annealing temperature could be attributed to different synthetic procedures.
Figure 3.
SEM image of BaSnO3 sample annealed at 275 °C.
Figure 3.
SEM image of BaSnO3 sample annealed at 275 °C.
Table 1.
Samples designation, phase composition and microstructure parameters.
Table 1.
Samples designation, phase composition and microstructure parameters.
| Sample | Annealing T, °C | Crystalline phase a | dXRD b, nm | BET area, m2/g |
|---|
| BaSnO3-275 | 275 | BaSnO3 (impurity BaCO3) | 17–19 | 5–7 |
| BaSnO3-500 | 500 | 20–22 | 7–8 |
| BaSnO3-700 | 700 | 19–23 | 6–8 |
| BaSnO3-1000 | 1000 | BaSnO3 | 40–43 | <2 |
| SnO2-300 | 300 | SnO2 | 3–6 | 95–100 |
| SnO2-500 | 500 | 10–12 | 20–25 |
| SnO2-700 | 700 | 16–20 | 7–10 |
| SnO2-1000 | 700 | 26–33 | <5 |
2.2. Electronic Conductance of BaSnO3 in Relation to Temperature and Oxygen Concentration
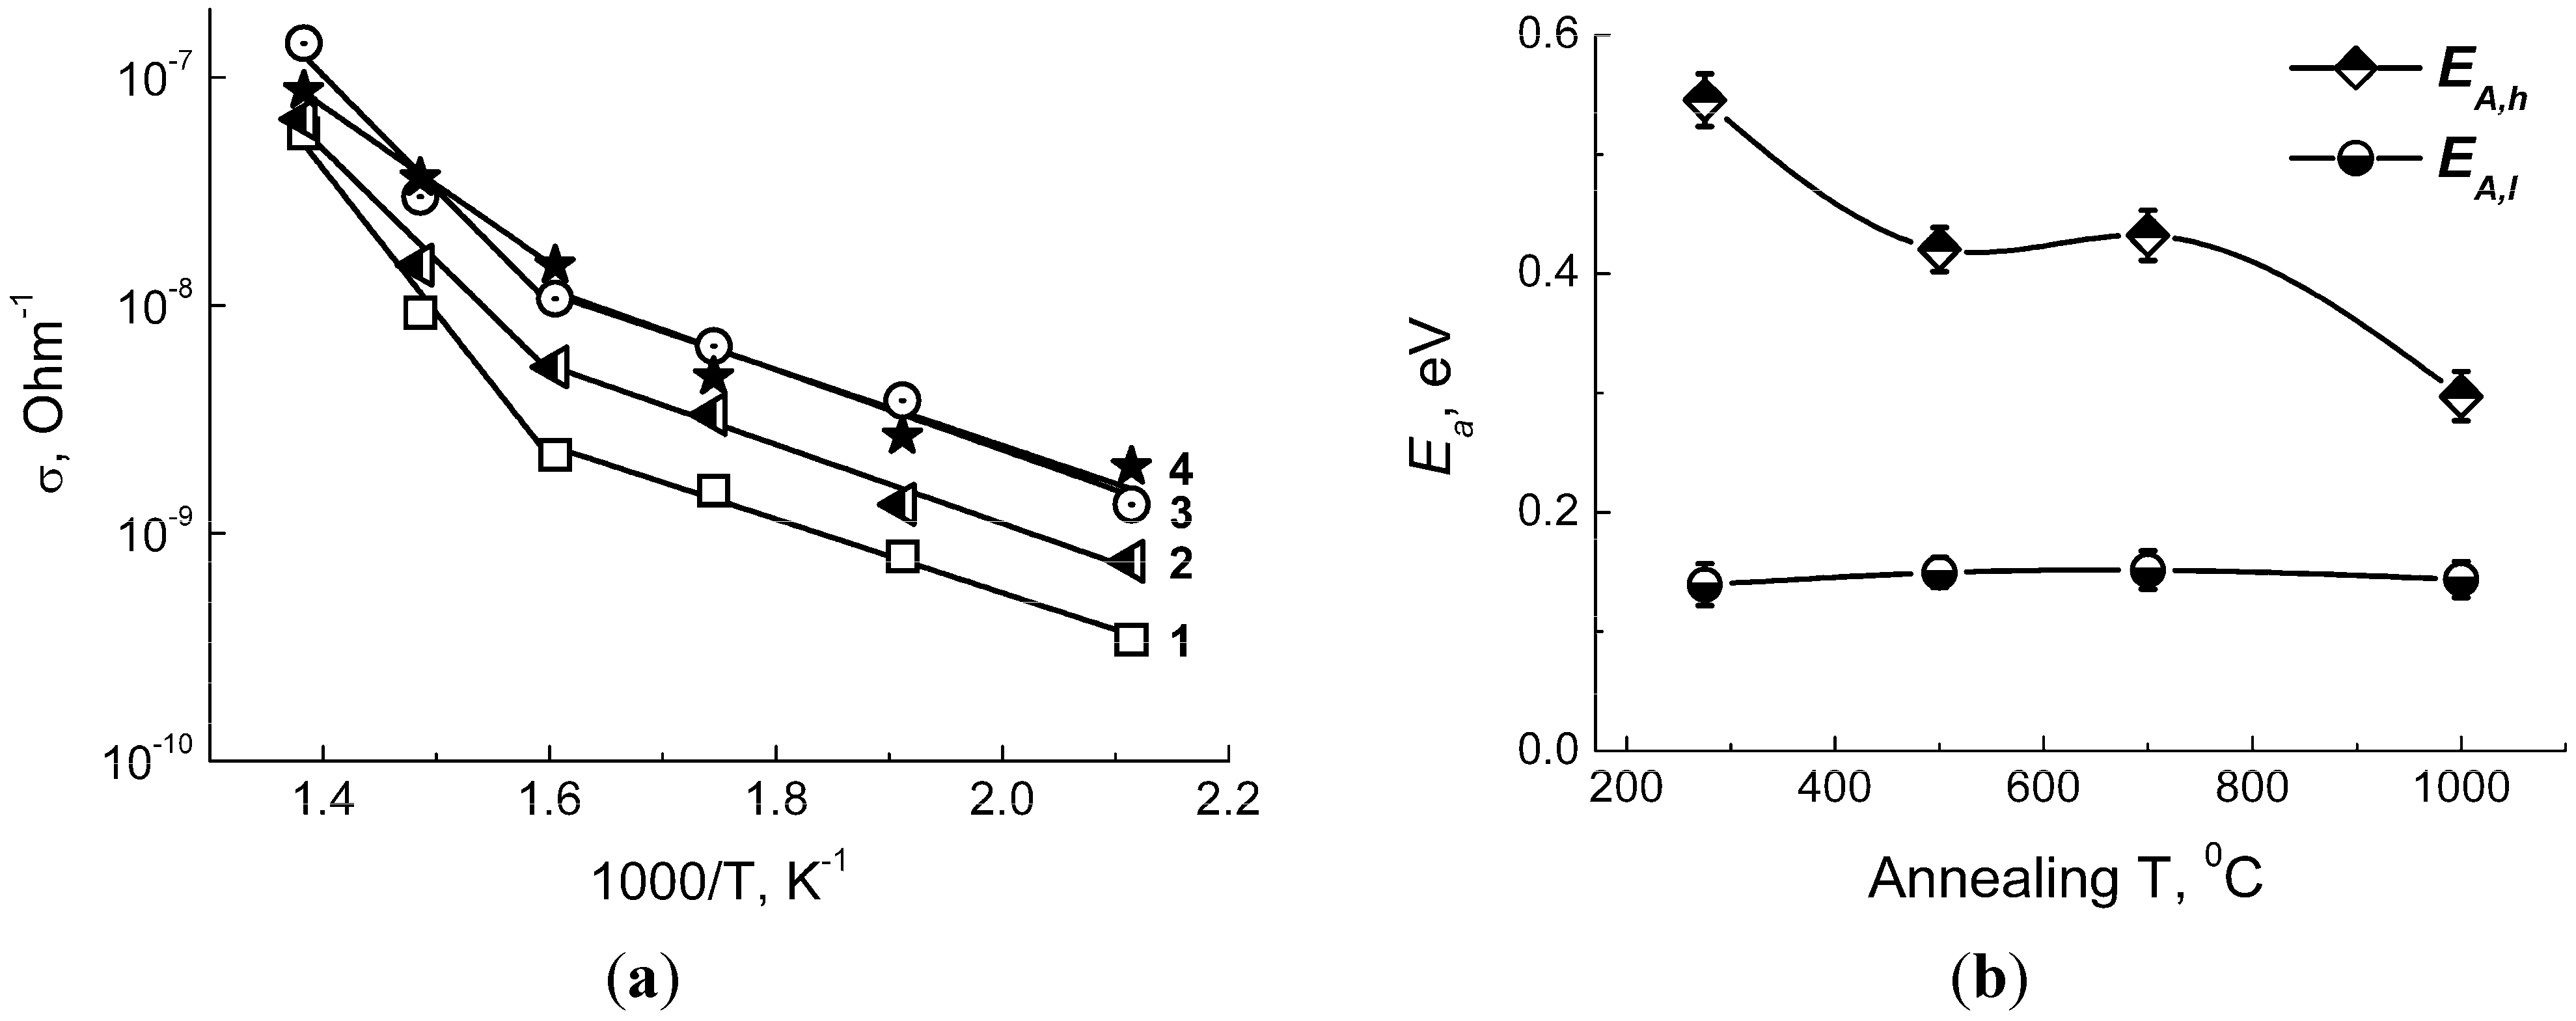
Figure 3a shows the plot of DC-conductance (σ)
vs. reciprocal temperature for BaSnO
3-based sensors measured under the atmosphere of purified air. Two regions of conductance with different activation energy values could be outlined from the linear lgσ-1/T dependences (
Figure 4a): the lower-temperature one at 150–300 °C and the higher-temperature one at 350–450 °C. Such an effect at close threshold temperature but with different activation energy values was observed in other studies by DC-conduction as well as impedance measurements [
16,
22]. The lower-temperature activation energy has low value of
EA,l = 0.14–0.15 eV and is independent on annealing temperature of the samples (
Figure 4b). According to literature, it corresponds to the conduction via electron hoping by tin cations [
16]. The higher-temperature activation energy (
EA,h) tends to decrease in the range ~0.5–0.3 eV with the increase of annealing temperature of BaSnO
3 from 275 °C to 1000 °C (
Figure 4b). Its average value is close to the reported ionization level of double-charged oxygen (V
O••) vacancies (0.37 eV below Fermi level) in barium stannate [
19]. The decrease of
EA,h values with the increase of annealing temperature might result from the improved crystallinity that inhibits the formation of deep defect-state levels.
Figure 4.
(a) Temperature dependence of DC-conductance (σ) of BaSnO3 samples annealed at different temperatures: (1) −275 °C, (2) −500 °C, (3) −700 °C, and (4) −1000 °C. (b) Activation energy for conductance in relation with annealing temperature of BaSnO3. EA,h is activation energy at higher-temperature (350–450 °C) and EA,l is activation at lower-temperature (150–300 °C) intervals.
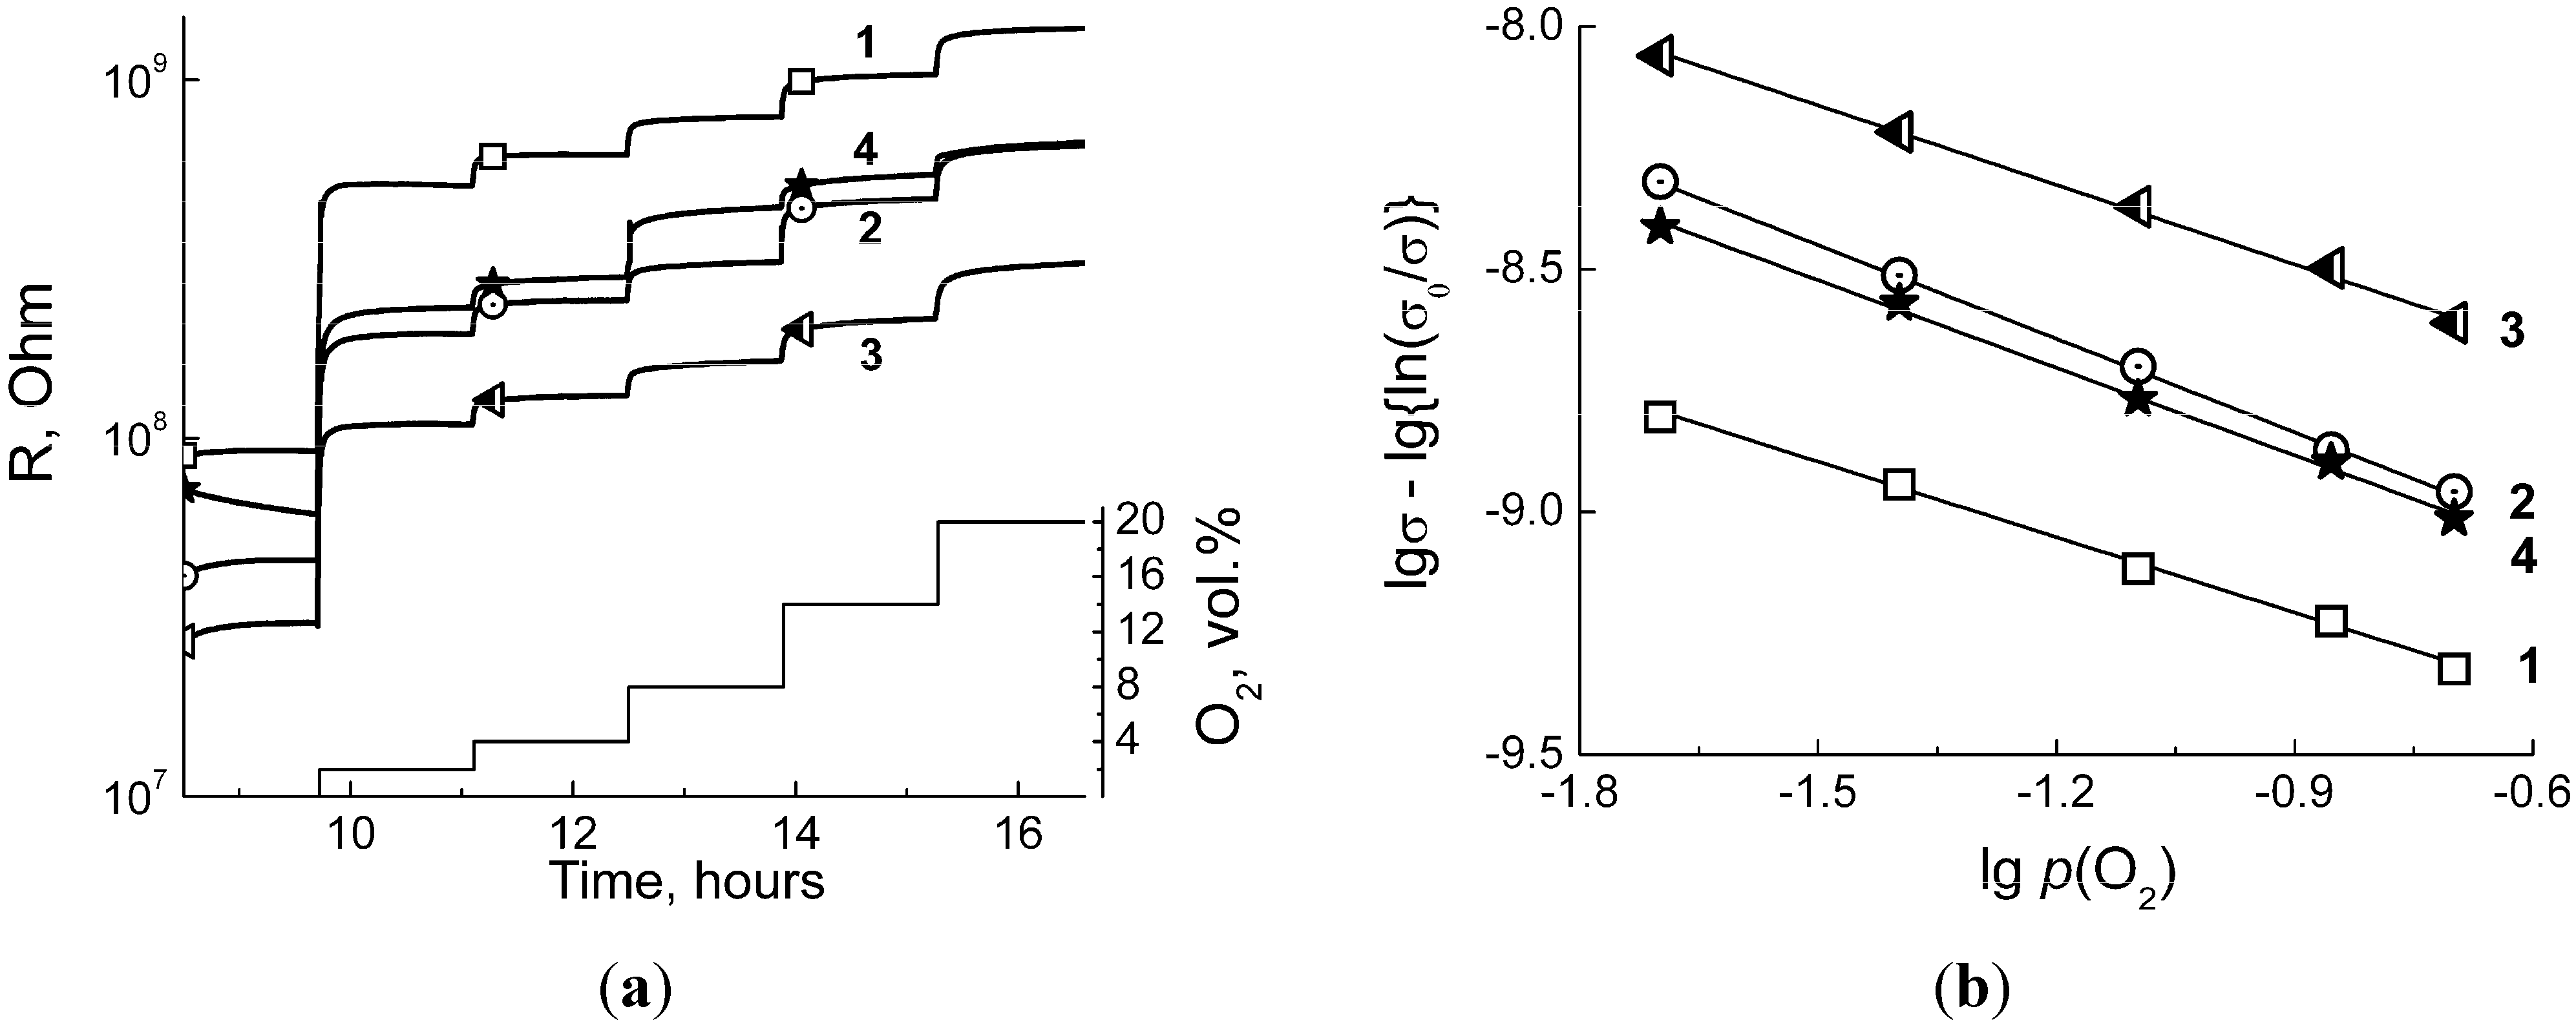
By the resistance measurements at variable oxygen concentration, it was verified that at temperature 150–450 °C barium stannate exhibited
n-type sensor response. It was evidenced by resistance increase on raising the concentration of O
2 (oxidative gas) in Ar:air mixture (
Figure 5a). At lower temperatures, the samples resistance exceeded the limit of measurements of the electrometer and could not be registered. From the conductance dependence on O
2 partial pressure the predominant type of ionosorbed oxygen was estimated. To perform it, the data were treated using the ionosorption model developed in [
36,
37]. According to this, the ionosorption can be considered as the gas molecule interaction with charge carriers at the semiconductor surface:
In a stationary state when the conductance is stabilized, its value depends on the concentration of electrons able to reach the semiconductor surface (
ns), which is dependent on both O
2 gas partial pressure
p(O
2) and the type of ionosorbed species (
α,
β coefficients) [
36]:
where
kads and
kdes are the rate constants of oxygen ionosorption and desorption, respectively, and Θ is the surface coverage by ionosorbed species. Applying complicated expressions for surface coverage to two model approximations, the conductance should be linearly dependent on oxygen partial pressure in logarithmic coordinates [
37]
where
σ is conductance in presence of oxygen and
σ0 is conductance in Ar in absence of oxygen. The approximation (i) is applied to fully depleted semiconductor particles with radius less than Debye length, while the case (ii) refers to large enough particles with size larger than Debye length and, hence, with the separation between depleted surface and not depleted bulk regions. Here it is assumed that the effect of ionosorption on electron mobility is minor in comparison with that on electron concentration [
37]. Parameter
m = β/2α is relevant to the type of ionosorbed species. For example, on the surface of tin dioxide the ionosorption route is known to be dependent on temperature: (
a) at 100–170 °C it yields mainly molecular O
2− species, (
b) at 200–350 °C—atomic O
− and (
c) at higher temperatures—fully ionized O
2− ionosorbates [
36].
The logarithmic plots of barium stannate conductance
vs. oxygen partial pressure could be adequately fitted only using Equation (4),
i.e. in the approximation to large grains (
Figure 5b). This seems reasonable regarding BaSnO
3 crystallite sizes in
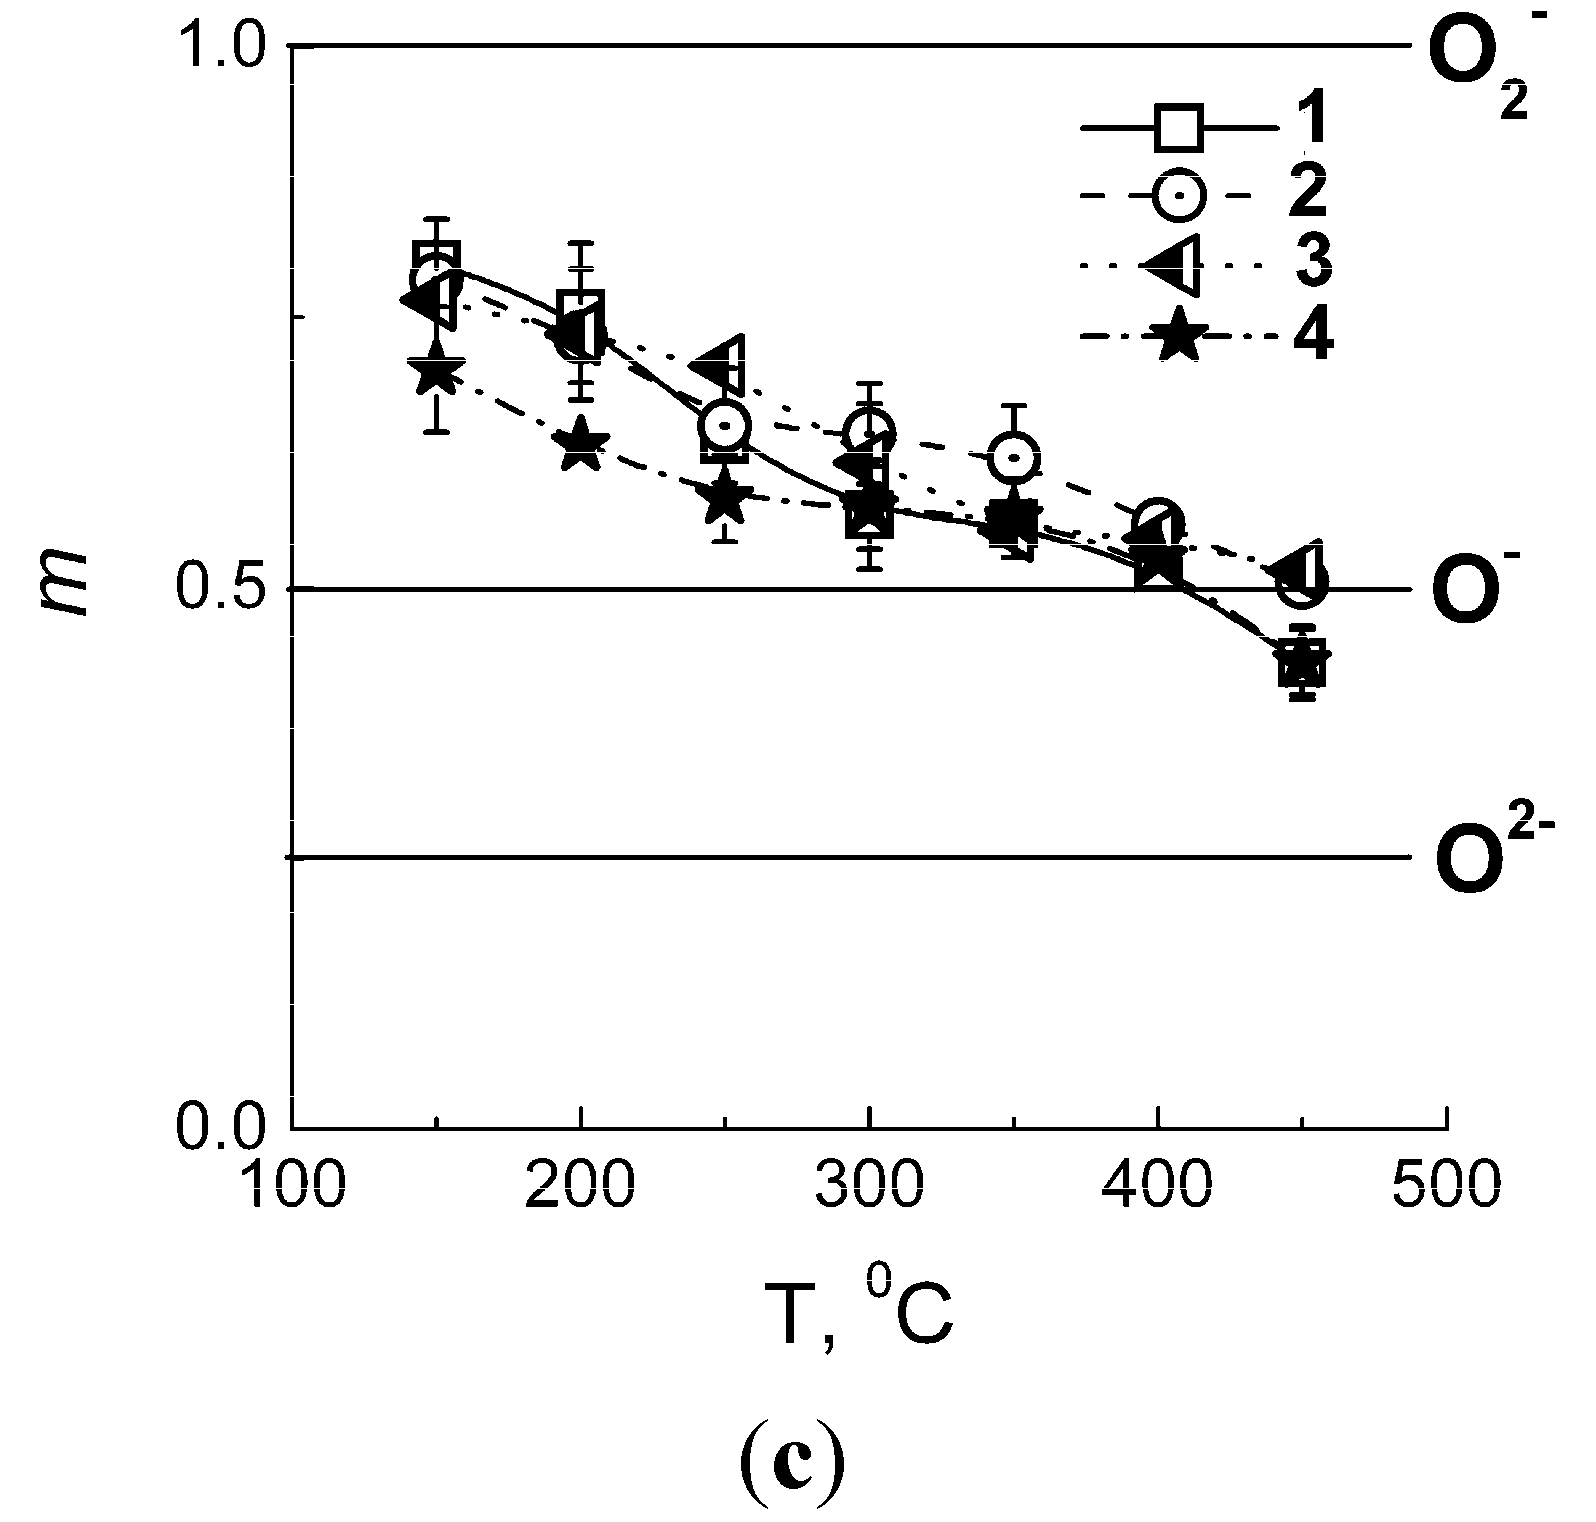
Table 1, yet no data were found in literature for the Debye length of this material. In
Figure 5c, the calculated slope values (
m) are summarized with the attribution to the type of ionosorbed oxygen species. As can be seen, within the fitting errors the ionosorption mode was similar for all BaSnO
3 samples and independent on annealing temperature. It was, however, dependent on the temperature value at which the interaction with gas phase was investigated. The decrease of slope value from
m = 0.7–0.8 (at 150–200 °C) to
m ≈ 0.5 (at 300–400 °C) could be interpreted as the transformation of ionosorbed oxygen from mixed O
2−/O
− to predominantly atomic O
− species following the increase of temperature (
Figure 5c). This trend partially coincides with that considered above for tin dioxide. At 450 °C, the slope shifted to
m ~ 0.4, probably due to appearance of atomic O
2− ionosorbates on the surface at high temperature.
Figure 5.
Resistance response to increasing O2 concentration measured at 300 °C (a); logarithmic conductance vs. oxygen partial pressure plot in coordinates of Equation (4) (b); and coefficient m (Equation (4)) attributed to the type of ionosorbed oxygen species as a function of operating temperature (c) for BaSnO3 samples annealed at different temperatures: (1) −275 °C, (2) −500 °C, (3) −700 °C, and (4) −1000 °C.
2.3. Gas Sensitivity of BaSnO3 in Comparison with SnO2
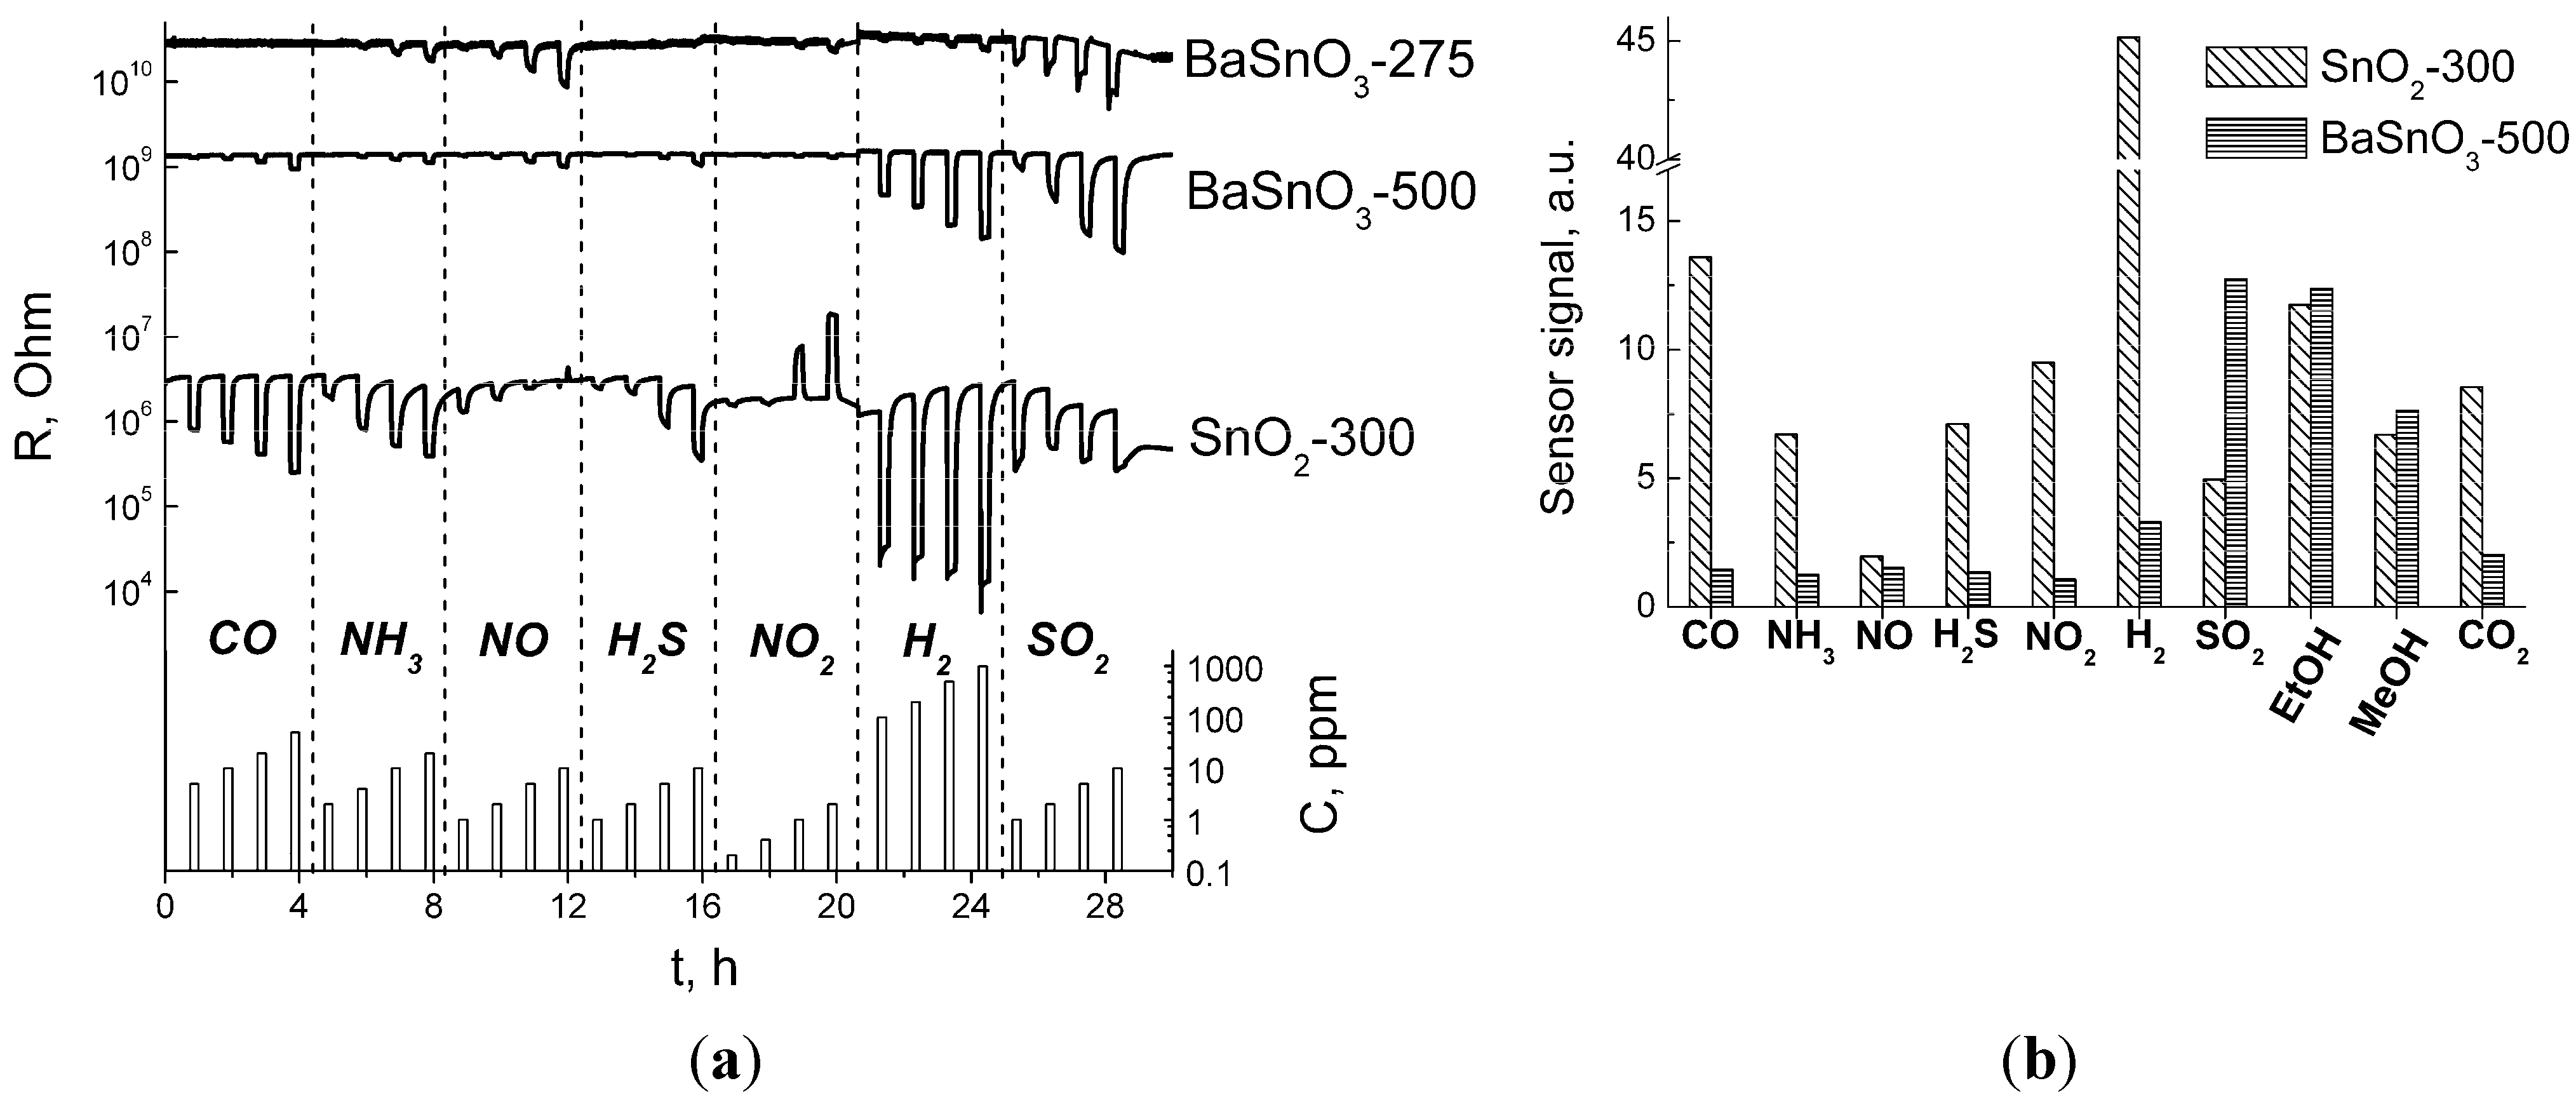
Figure 6a shows the dynamic response for BaSnO
3-based sensors and SnO
2-300 reference sensor to ppm-range concentrations of various target gases measured at 300 °C. (The data for BaSnO
3-700 are not shown, since its resistance intersected in some cases with that of SnO
2-300, which would sophisticate the representation. However, its sensing behavior was quite similar to that of BaSnO
3-500. The sample BaSnO
3-1000 was almost insensitive to target gases.) Both materials demonstrated
n-type response,
i.e., resistance decreases in presence of reductive target gases. Taking into account that BaSnO
3 and SnO
2 behave as
n-type semiconductors because of anion vacancies V
O••, similar sensing mechanism could be anticipated for the interaction with reductive gases as it had been done elsewhere [
7,
38]. In principle, this process includes oxygen ionosorption during exposure in air and subsequent partial reduction of the ionosorbed species when the surface gets in contact with target gas molecules. Yet, barium stannate did not display any resistance growth on exposure to NO
2 that would have been expected for an
n-type sensing material (
Figure 6a). The contrast with SnO
2 may be due to smaller charge carrier concentration in BaSnO
3 and/or lower energy of the donor-state level. Actually, the position of V
O•• defect level at 0.114–0.140 eV below Fermi level was reported for bulk tin dioxide [
39], which is less than that in barium stannate (0.37 eV [
19]). Taking into account that its work function (>5 eV [
40,
41]) is also higher in comparison with SnO
2 (4.8 eV [
42]), the deeper position of V
O•• donor level could prevent the ionosorption of oxidizing NO
2 molecules on barium stannate.
Figure 6b compares the sensor signal values of BaSnO
3-500 and SnO
2-300 to a fixed concentration of the target gases tested at 300 °C. In general, the gas sensitivity of barium stannate was lower than that of tin dioxide. The sensor signal values of BaSnO
3 to CO, NO, H
2 and NO
2 are well below
S = 5, which is in agreement with previous works [
7,
8,
9,
10,
31,
38]. The higher sensitivity of tin dioxide observed in most cases must be contributed by its much larger dispersity in comparison with BaSnO
3 (
Table 1). A comparable sensitivity was noted in the detection of alcohols (
Figure 6b). The response to NO having close values at 300 °C was distinct at lower temperature: the sensitivity of SnO
2 increased strongly at lower temperature 100–200 °C (Supplementary data). It was only to SO
2 that barium stannate demonstrated evidently higher sensitivity than tin dioxide (
Figure 6b).
Figure 6.
(a) Dynamic resistance plot of BaSnO3-275, BaSnO3-500 and SnO2-300 sensors to the increasing concentrations of various target gases in air measured at 300 °C. (b) Sensor signals of BaSnO3-500 and SnO2-300 to target gases in air: CO (50 ppm), NH3 (20 ppm), NO (10 ppm), H2S (2 ppm), NO2 (2 ppm), H2 (100 ppm), SO2 (10 ppm), EtOH (20 ppm), MeOH (20 ppm) and CO2 (1%); T = 300 °C.
Regarding the selectivity parameter, it is appropriate to compare the sensor signals to close concentrations of target gases. From
Figure 6b it can be concluded that unlike SnO
2, the sensitivity of barium stannate is much more dependent on the chemical nature of the target gas molecule, rather than on its concentration. Among the tested gases BaSnO
3 was more sensitive to SO
2 and alcohols (
Figure 6b). In contrast to it, tin dioxide displayed highest signals to hydrogen since it had the highest concentration (100 ppm), then to CO (50 ppm) and lower signals to other gases with lower concentrations. The exceptions from such a correlation are the tests to H
2S, which is highly adsorptive and reactive gas, NO
2 (since it is an oxidative gas) and CO
2 (the gas with neither reductive, nor oxidative properties). The increased sensitivity of barium stannate to EtOH in comparison to CO, H
2, LPG and benzene was reported in [
31], which is consistent with the present results. The novel finding in this work is that the sensitivity of BaSnO
3 to SO
2 (10 ppm) exceeds its sensitivity to EtOH (20 ppm), despite the latter was tested in a higher concentration. Thus, it can be outlined that barium stannate possessed selectivity to SO
2 in comparison to other target gases tested, however to confirm it the experiments on the detection of mixtures of target gases would be needed. It should be noted that there is a potential to improve selectivity of barium stannate-based sensors via it surface modification by catalytic (noble metal) clusters or acid/base (transition metal oxides) additives, doping of BaSnO
3 via cation substitution in Ba or Sn sites that would modify surface reactivity, or by depositing filtering membranes (alumina, silica,
etc.). For example, it was shown that modification by Pt increases the selectivity to LPG [
9], while using Al
2O
3 additive the selectivity of barium stannate to benzene was improved [
38].
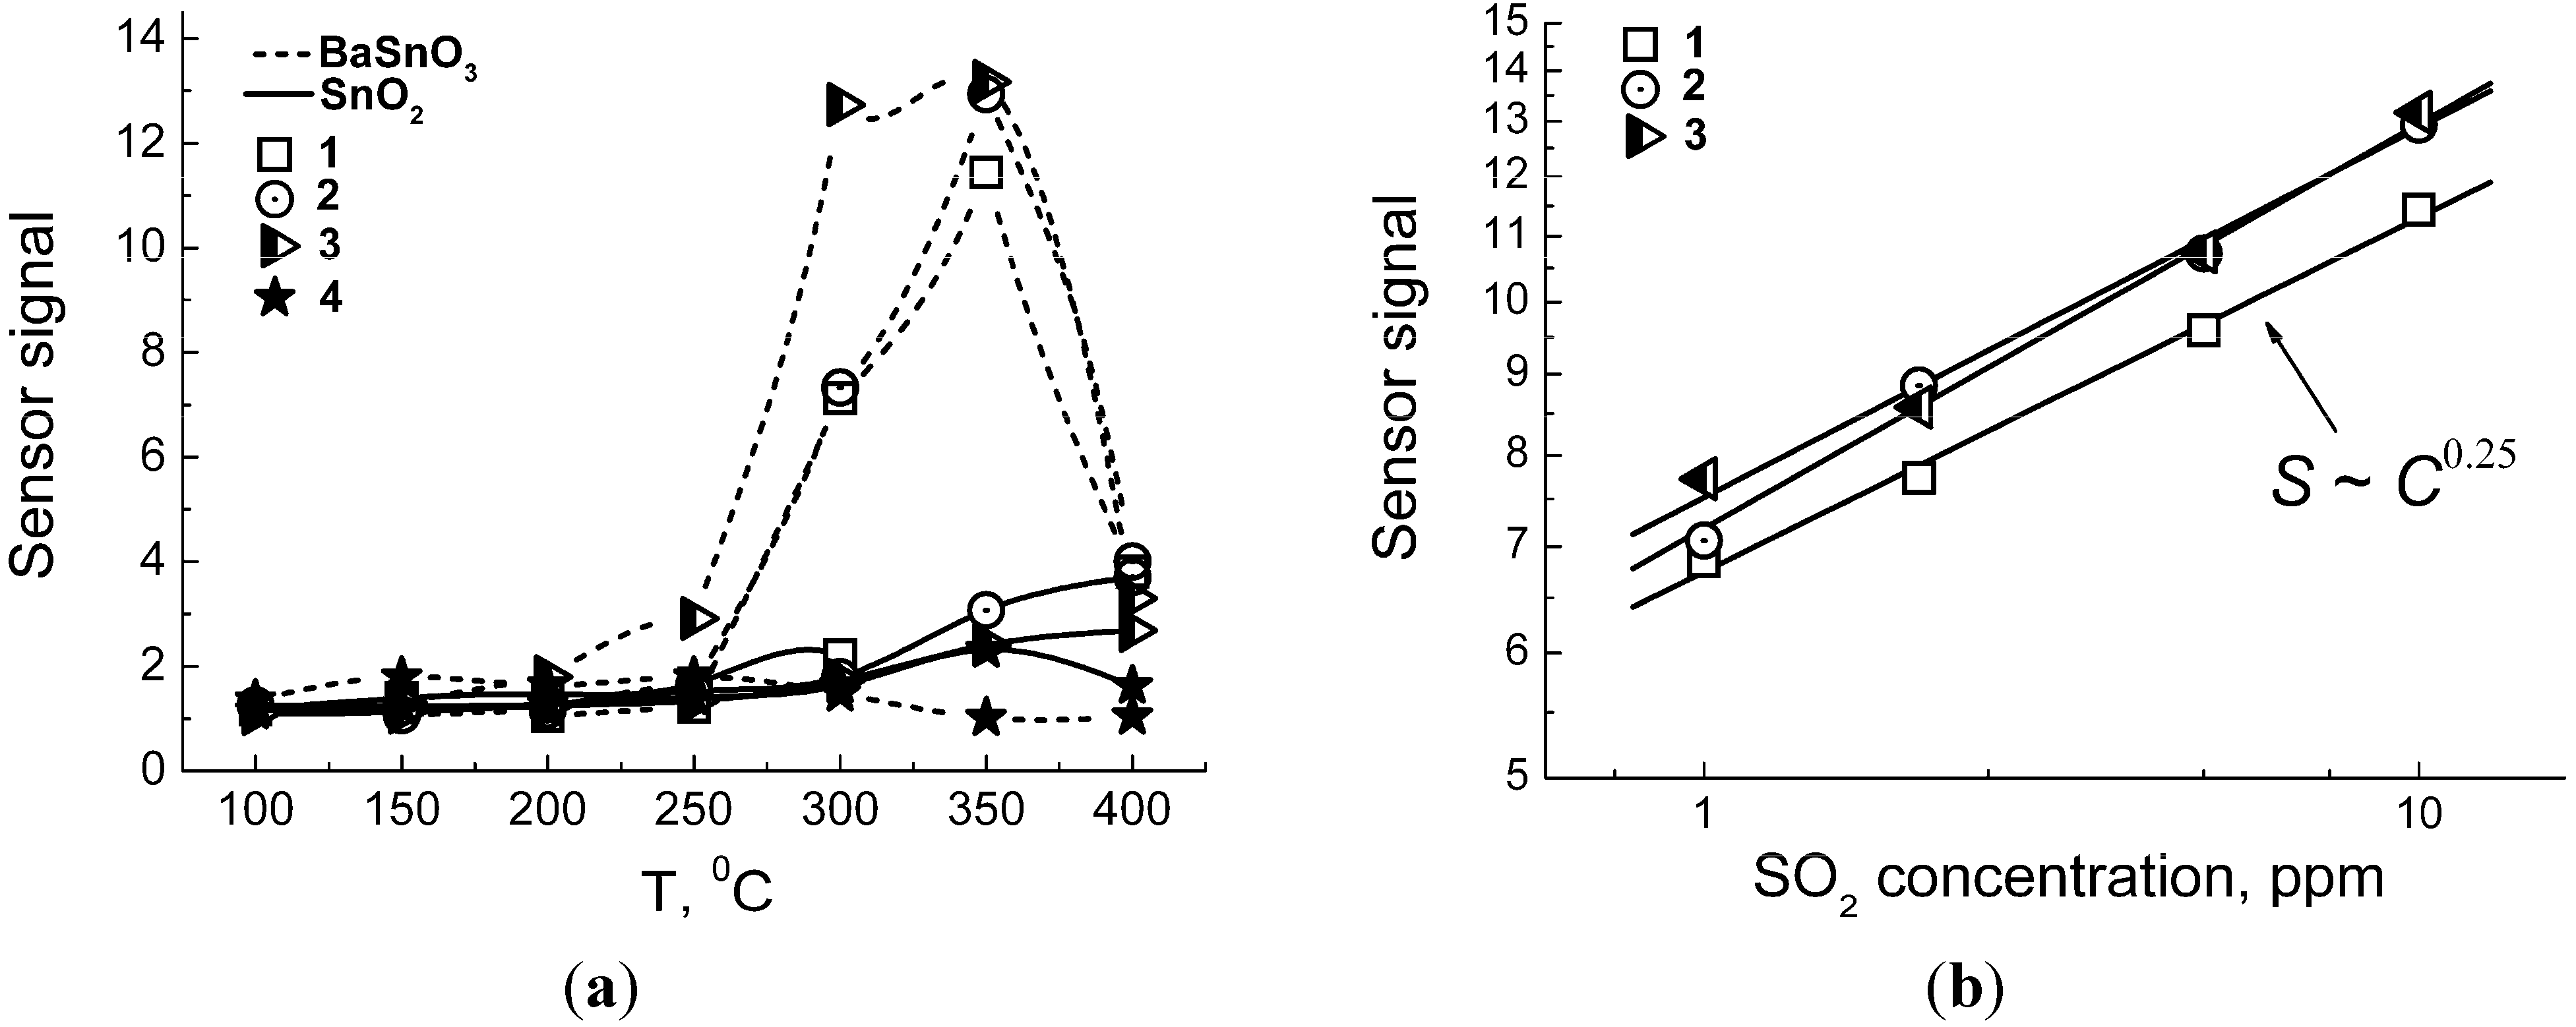
In
Figure 7a, the temperature plots of sensor signals to SO
2 are summarized for all materials studied. Barium stannate samples annealed at 275–700 °C displayed close responses with the maximum at 300–350 °C. Some improvement of sensitivity was noted with the increase of BaSnO
3 annealing temperature to 700 °C. The lack of sensitivity of BaSnO
3-1000 could be due to its too low surface area. It could be noted that carbonate impurity that inhibited BaSnO
3 particle size growth likely played a favorable role for the gas sensitivity of samples annealed at 275–700 °C. In this context, it is important that the impurity is inactive it the process of interaction with the target gases, as is discussed below. The most interesting observation was that the responses of BaSnO
3 annealed at 275–700 °C exceeded in several times those of SnO
2 samples, despite the latter were favored by up to one order of magnitude larger BET surface area and smaller particle size (
Table 1). The sensor signal of BaSnO
3 follows the exponential dependence on SO
2 concentration (
Figure 7b).
Figure 7.
(a) Temperature dependence of sensor signals to SO2 (10 ppm) for BaSnO3 and SnO2 samples. (b) Logarithmic plot of sensor signals measured at 350 °C vs. SO2 concentration for BaSnO3 samples annealed at different temperatures: (1) −275 °C, (2) −500 °C, (3) −700 °C, and (4) −1000 °C.
Figure 7.
(a) Temperature dependence of sensor signals to SO2 (10 ppm) for BaSnO3 and SnO2 samples. (b) Logarithmic plot of sensor signals measured at 350 °C vs. SO2 concentration for BaSnO3 samples annealed at different temperatures: (1) −275 °C, (2) −500 °C, (3) −700 °C, and (4) −1000 °C.
To conclude, the sensitivity of barium stannate to most target gases tested is in general lower than that of tin dioxide. This is most likely because the latter possessed much larger surface area available to interact with the gas phase. Taking into account the simpler aqueous deposition route to obtain SnO
2 with BET surface area of the order 100 m
2/g than the hydrothermally-assisted synthesis of barium stannate giving materials with BET surface area up to 10 m
2/g, BaSnO
3-based materials have limited perspectives to be applied in gas sensing field and tin dioxide would remain being the most utilized sensing material in the detection of common atmospheric pollutants (CO, H
2S, NH
3, hydrocarbons). However, in the detection of SO
2 traces in air, BaSnO
3 turns out to be significantly more sensitive and selective than SnO
2. This advantage can possibly be enhanced by increasing the dispersity of BaSnO
3 and modifying its surface by catalytic additives of noble metals. Noteworthy, among the materials studied for SO
2 detection, tin dioxide and, to a lesser extent tungsten oxide, were previously regarded as the most efficient ones, their sensitivity increasing due to surface modification by Ag, Pd and Pt additives [
43].
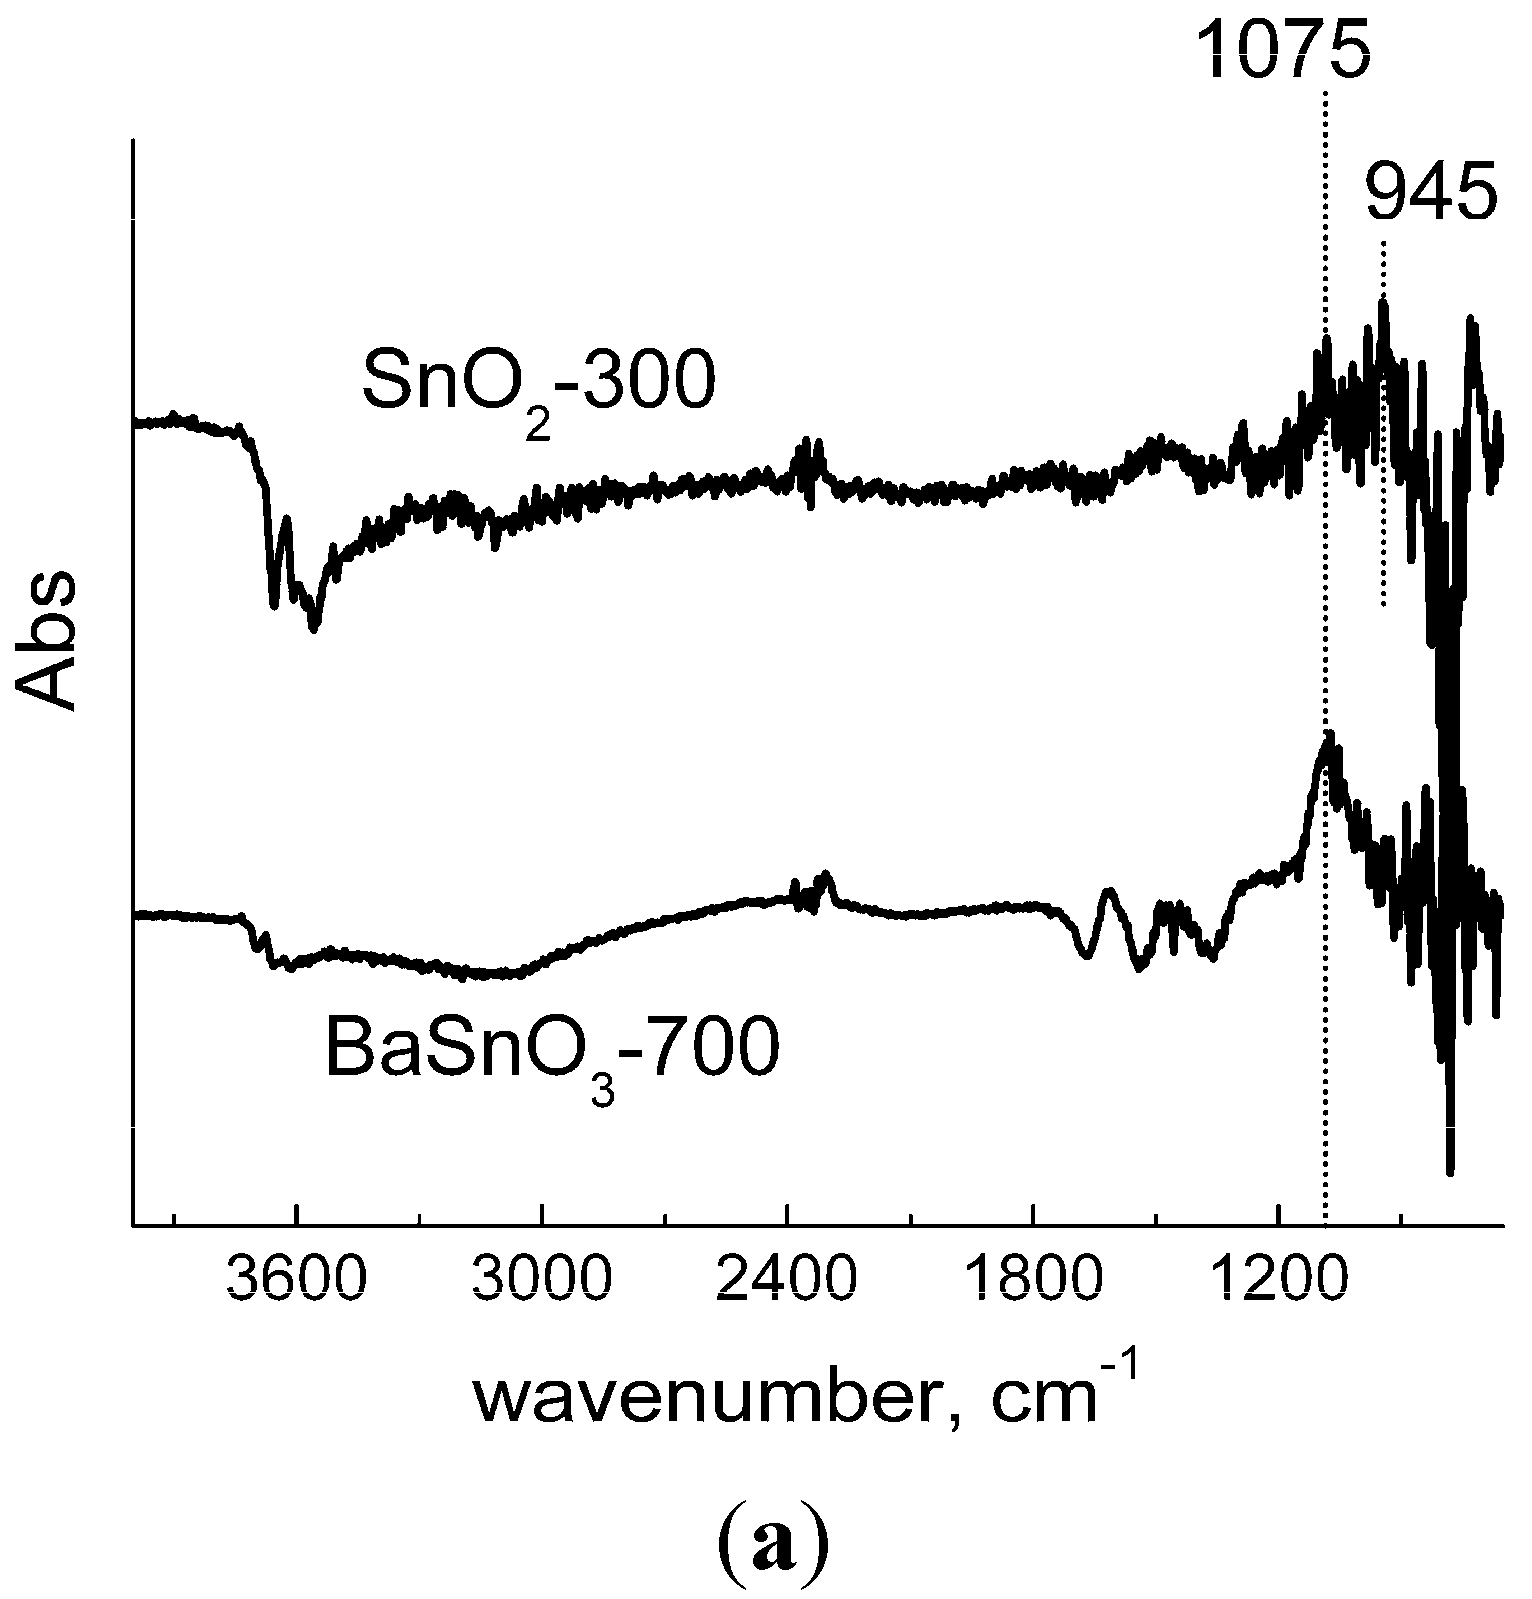
2.4. DRIFT Study of the Materials Interaction with SO2
The reason for increased SO
2 sensitivity of barium stannate was found from
in situ study of the materials interaction with the target gas by means of diffuse reflectance Fourier-transform infrared spectroscopy (DRIFT). The interaction was investigated on the example of BaSnO
3-700 and SnO
2-300 samples as the most sensitive ones, at room temperature (adsorption regime) and at 300 °C (reaction regime). From the spectra of samples exposed to 40 ppm SO
2 at room temperature (
Figure 8a), it could be inferred that the adsorption proceeds in a not dissimilar manner on both materials. In presence of target gas, the peak arises at 1075 cm
−1, which is more pronounced for BaSnO
3. It can be ascribed to chemisorbed SO
2 [
44] as well as to
v3 asymmetric stretching vibrations of S-bound sulfite species [
45]. The peak of O-bound sulfite (945 cm
−1 [
45]) was also prominent on the spectrum of SnO
2 (
Figure 8a). Thus, molecular chemisorption (e.g., on cation sites) along with sulfite species formation due to SO
2 bonding with oxide anions took place on the surface of BaSnO
3 and SnO
2 at room temperature. The depletion in OH-stretching vibration region (3600–3200 cm
−1) could result from surface hydroxyls elimination due to competitive SO
2 chemisorption.
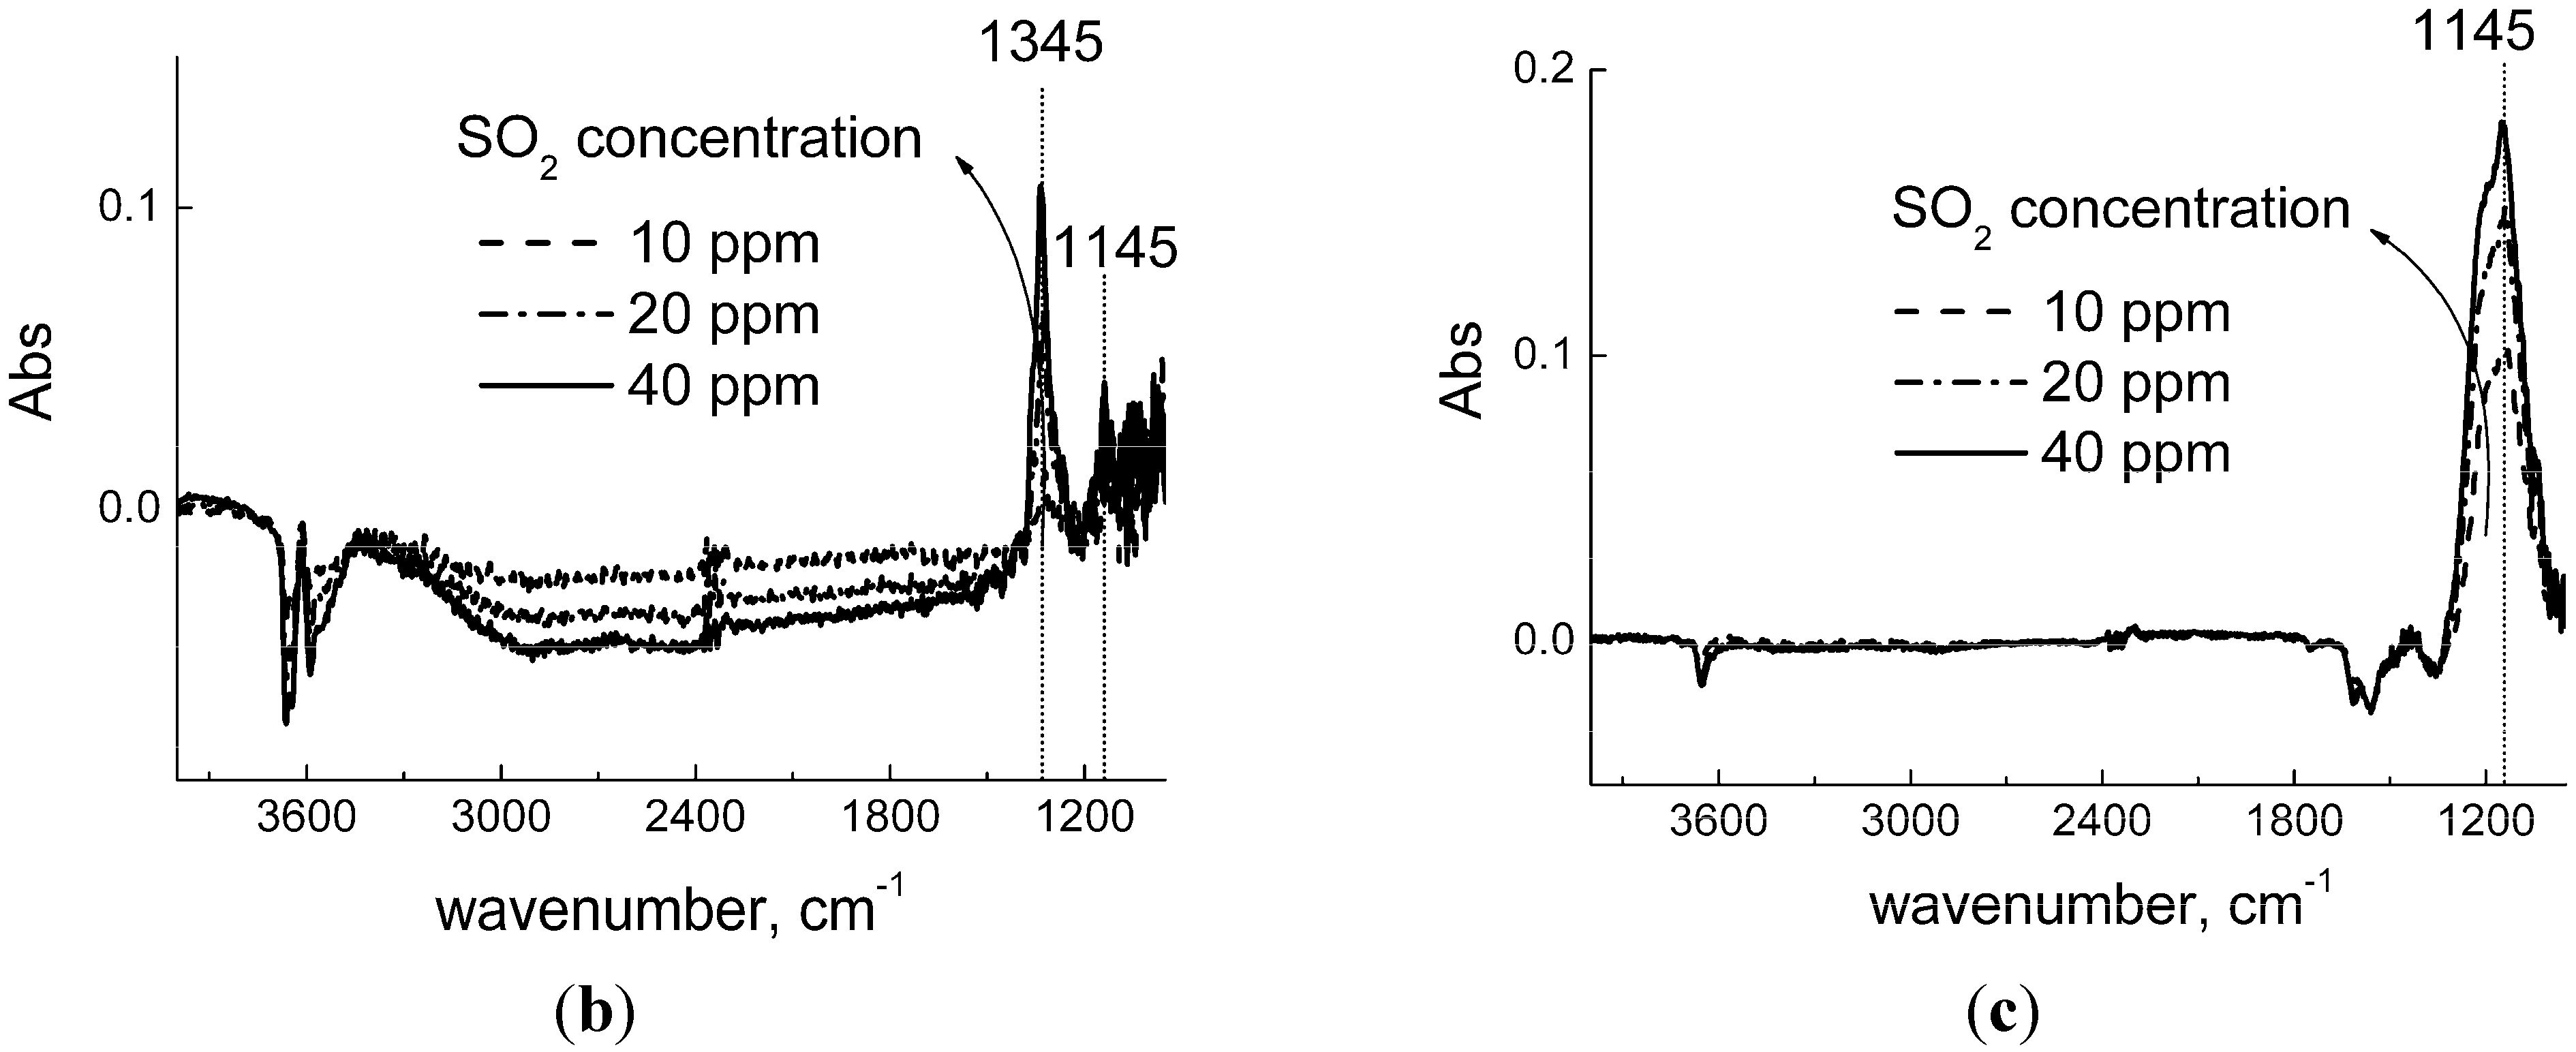
The gas-solid interaction routes, however, were strongly distinct at raised temperature. On the surface of SnO
2, molecular SO
2 adsorption was the predominant interaction route at 300 °C, as deduced from the evolvement of the peaks at 1345 cm
−1 and 1145 cm
−1 (
Figure 8b). This doublet is characteristic of asymmetric (
v3) and symmetric (
v1) stretching bands, respectively, of adsorbed SO
2 [
46]. The weak adsorption character is indicated by a little shift of the peaks centers to lower wavenumbers in comparison with gas-phase molecule (
v3 = 1360 cm
−1,
v1 = 1151 cm
−1 [
46]). The alteration of SO
2 adsorption mode on tin dioxide surface can be explained by weakening the molecule-to-surface binding at raised temperature that prevents strong chemisorption, which was observed at room temperature. On the other hand, desorption of hydroxyl species was as well intensified at raised temperature, as follows from the increased depletion of OH-stretching band at 3600–3400 cm
−1 (
Figure 8b). This could provide more adsorption sites for SO
2 and account for the increased target gas adsorption in comparison with room-temperature situation, as follows from the comparison of S-O bands intensities at 1350–900 cm
−1 in
Figure 8a,b.
Figure 8.
DRIFT spectra of SnO2-300 and BaSnO3-700 samples exposed to SO2 (40 ppm) at room temperature (a) DRIFT spectra of SnO2-300 sample (b) and BaSnO3-700 sample (c) exposed to increasing concentration of SO2 (10–20–40 ppm) at 300 °C.
Figure 8.
DRIFT spectra of SnO2-300 and BaSnO3-700 samples exposed to SO2 (40 ppm) at room temperature (a) DRIFT spectra of SnO2-300 sample (b) and BaSnO3-700 sample (c) exposed to increasing concentration of SO2 (10–20–40 ppm) at 300 °C.
The main feature on the DRIFT spectra of barium stannate interacting with SO
2 at 300 °C was the evolution of a strong band centered at 1145 cm
−1 with a shoulder at ~1200 cm
−1 and a satellite at 1050 cm
−1 (
Figure 8c). In contrast to SnO
2, the absence of a peak at 1340–1350 cm
−1 ruled out that molecular adsorption took place on BaSnO
3 surface. According to [
45,
47], this wavenumber region corresponds to asymmetric (
v3) stretching vibration band of sulfate ions. The doublet of 1145 cm
−1 and 1050 cm
−1 peaks is an indicative of monodentate sulfate, while the shoulder at 1200 cm
−1 suggests the presence of bidentate species as well [
45]. Moreover, the set of the three peaks is typical to bulk BaSO
4 [
48]. Hence, SO
2 oxidation is the predominant process on the surface of BaSnO
3 at raised temperature. In comparison with tin dioxide, the presence of Ba
2+ cations seems to play the key role in determining the interaction route. Bulk BaSO
4 is known as a stable compound. The formation of its lattice fragments might be the driving force for promoting SO
2 gas oxidation on the surface of BaSnO
3. This is believed to be the reason for increased sensitivity of barium stannate to SO
2 at raised temperature. With respect to oxygen ionosorption type (
Figure 5c), the following scheme could be suggested for the improved sensing process at the temperature of maximum sensitivity (300–350 °C):
Although a weak negative peak of hydroxyl groups was still observed at 3640 cm
−1, no depletion in carbonate-vibration range (~1450 cm
−1) was detected (
Figure 8c). This indicates that the impurity of BaCO
3 was not involved in the interaction of barium stannate with SO
2. Noteworthy, no sulfate-related phases could be found after gas–solid interaction by XRD analysis.


