Article

Pendulum Search Algorithm: An Optimization Algorithm Based on Simple Harmonic Motion and Its Application for a Vaccine Distribution Problem

by
Nor Azlina Ab. Aziz
1,* and
Kamarulzaman Ab. Aziz
2
1
Faculty of Engineering & Technology, Multimedia University, Melaka 75450, Malaysia
2
Faculty of Business, Multimedia University, Melaka 75450, Malaysia
*
Author to whom correspondence should be addressed.
Algorithms 2022, 15(6), 214; https://doi.org/10.3390/a15060214
Submission received: 15 May 2022 / Revised: 9 June 2022 / Accepted: 13 June 2022 / Published: 17 June 2022
(This article belongs to the Special Issue Metaheuristic Algorithms and Applications)

Abstract

:
The harmonic motion of pendulum swinging centered at a pivot point is mimicked in this work. The harmonic motion’s amplitude at both side of the pivot are equal, damped, and decreased with time. This behavior is mimicked by the agents of the pendulum search algorithm (PSA) to move and look for an optimization solution within a search area. The high amplitude at the beginning encourages exploration and expands the search area while the small amplitude towards the end encourages fine-tuning and exploitation. PSA is applied for a vaccine distribution problem. The extended SEIR model of Hong Kong’s 2009 H1N1 influenza epidemic is adopted here. The results show that PSA is able to generate a good solution that is able to minimize the total infection better than several other methods. PSA is also tested using 13 multimodal functions from the CEC2014 benchmark function. To optimize multimodal functions, an algorithm must be able to avoid premature convergence and escape from local optima traps. Hence, the functions are chosen to validate the algorithm as a robust metaheuristic optimizer. PSA is found to be able to provide low error values. PSA is then benchmarked with the state-of-the-art particle swarm optimization (PSO) and sine cosine algorithm (SCA). PSA is better than PSO and SCA in a greater number of test functions; these positive results show the potential of PSA.

1. Introduction

Optimization problems occur in all branches of studies, from engineering to health science to logistics planning to computer science to finance, and many others. Optimization problems often involve maximization of gain or/and minimization of lost with respect to some constraints. Many of these problems are complex and solving them using exact optimization algorithms is impractical due to the computational cost and time taken.
Metaheuristics provide the answer of this problem. Metaheuristics are approximation algorithms that provide optimal or near-optimal solutions within reasonable time and computational constraints. Metaheuristics are general purpose and can be adapted to various problems.
Much research has been conducted in this field and many algorithms have been proposed. The majority of the algorithms proposed are nature-inspired. In fact, the state of the art and most researched algorithms–namely the genetic algorithm (GA) [1], ant colony optimization (ACO) algorithm [2], and particle swarm optimization (PSO) [3]–are all inspired by nature. The GA is inspired by genetic evolution like the selection of the fittest, mutation, and crossover to generate a new and superior generation. Meanwhile, the ACO is inspired by the foraging behavior of ants where a trail of pheromones is left as information for the colony’s members. PSO, on the other hand, is inspired by the social behavior observed among flock of birds, swarm of bees, and school of fishes. PSO mimics how the cognitive and social factors influence the individuals’ decision.
Although many metaheuristic algorithms have been proposed in recent years–for example the sine cosine algorithm (SCA) [4], gravitational search algorithm (GSA) [5], bat algorithm (BA) [6], artificial bee colony (ABC) [7], grey wolf optimization (GWO) [8], and many others–the no free lunch theorem (NFL) motivates researchers to keep introducing new algorithms or improving those existing. NFL states that no supreme algorithm that can provide the best solution for all optimization problems exists. An algorithm might be able to give the best solution for a set of problems but not for another set.
In this work, a new metaheuristic named the Pendulum Search Algorithm (PSA) is proposed. PSA is a population-based algorithm where the solution of an optimization problem is searched for by a group of agents. The agents in PSA move around the search space looking for the optimal solution according to pendulum harmonic motion. A pendulum centered at a pivot point swings in a harmonic motion, with the amplitude of the swing decreasing with time. The proposed algorithm is validated using 13 multimodal test functions and benchmarked with PSO and SCA. The findings show that PSA is a good optimization algorithm, outperforming PSO in 8 out of 13 functions and 12 out of 13 for SCA. PSA is then applied for the optimization of vaccine distribution using the case of Hong Kong’s 2009 H1N1 influenza endemic. The distribution percentage found by PSA is better in lowering the number of infections when compared with three traditional strategies usually used in health science.
This paper is divided into five sections. The following section investigates existing algorithms with similar framework. The PSA is introduced in Section 3. Section 4 presents the experiment conducted including details of the H1N1′s extended SEIR and the findings obtained. Finally, the work is concluded in Section 5.

2. Related Works

Metaheuristic algorithms are iterative procedure where search agents repeatedly evaluate and improve their solution in each iteration. The success of a metaheuristic algorithm depends on the ability of the search agents to explore or expand their search area and to exploit or fine-tune the search around the current search area [9]. Many research show that exploration is desired at the early stage of the iterative procedure while exploitation is important towards the end of the iteration [10]. Exploration widens the search area of an agents so that a region containing an optimal solution is identified, whereas exploitation narrows down the search within the identified region so that the location with an optimal solution is found.
A time decreasing inertia weight is an example of a mechanism frequently adopted by researchers to control agents’ behaviour to favour exploration at the start of the search before switching to exploitation [11,12,13]. The time decreasing inertia weight reduces the step size as the iteration increases. Among the common patterns applied by researchers are linearly decreasing and exponentially decreasing inertia weight [12].
Metaheuristic search agents often face the challenge of premature convergence where the agents are trapped in local optima [14]. In [15], crossover operation is introduced to the cat swarm optimization algorithm to overcome the local optima trap and increase diversity. Meanwhile, in [16] a simple re-initialization method is proposed for PSO. Mutation is also a popular method to avoid premature convergence, where various mutation strategies have been adopted by researchers [17,18]. Overall, all these strategies are introduced to create a disturbance to the agents’ convergence so that the premature convergence can be avoided.
The most relevant algorithm to this work is SCA. Mirjalili adopted the sine cosine function to guide the search for the optimal solution by fluctuating around the best solution. To ensure convergence, SCA envelopes the sine and cosine function using a linearly decreasing function mirrored by the time axis. However, despite the fluctuation and linearly decreasing envelope, both [19,20] listed premature convergence as the drawback of SCA. Additionally, [21] highlighted that the solution update equations of SCA result in a bias towards the origin, causing SCA to work very well for optimization problems where the global solution is located at the origin. The performance declines with shifted problems. Three random numbers are needed in SCA.
In this work, a physical phenomenon–namely the harmonic motion of a pendulum–is mimicked to move the search agents so that an optimal solution is achieved. Unlike SCA, the harmonic motion of the pendulum slows down with exponential function. Exponential function had been observed to provide good exploration–exploitation balance in metaheuristics [22,23]. The PSA agents do not randomly select between sine and cosine functions; rather, they follow the harmonic motion function. The harmonic motion function determines the maximum limit for the random numbers that controls the PSA agents’ stochastic search, with respect to current solution and best solution.

3. Pendulum Search Algorithm

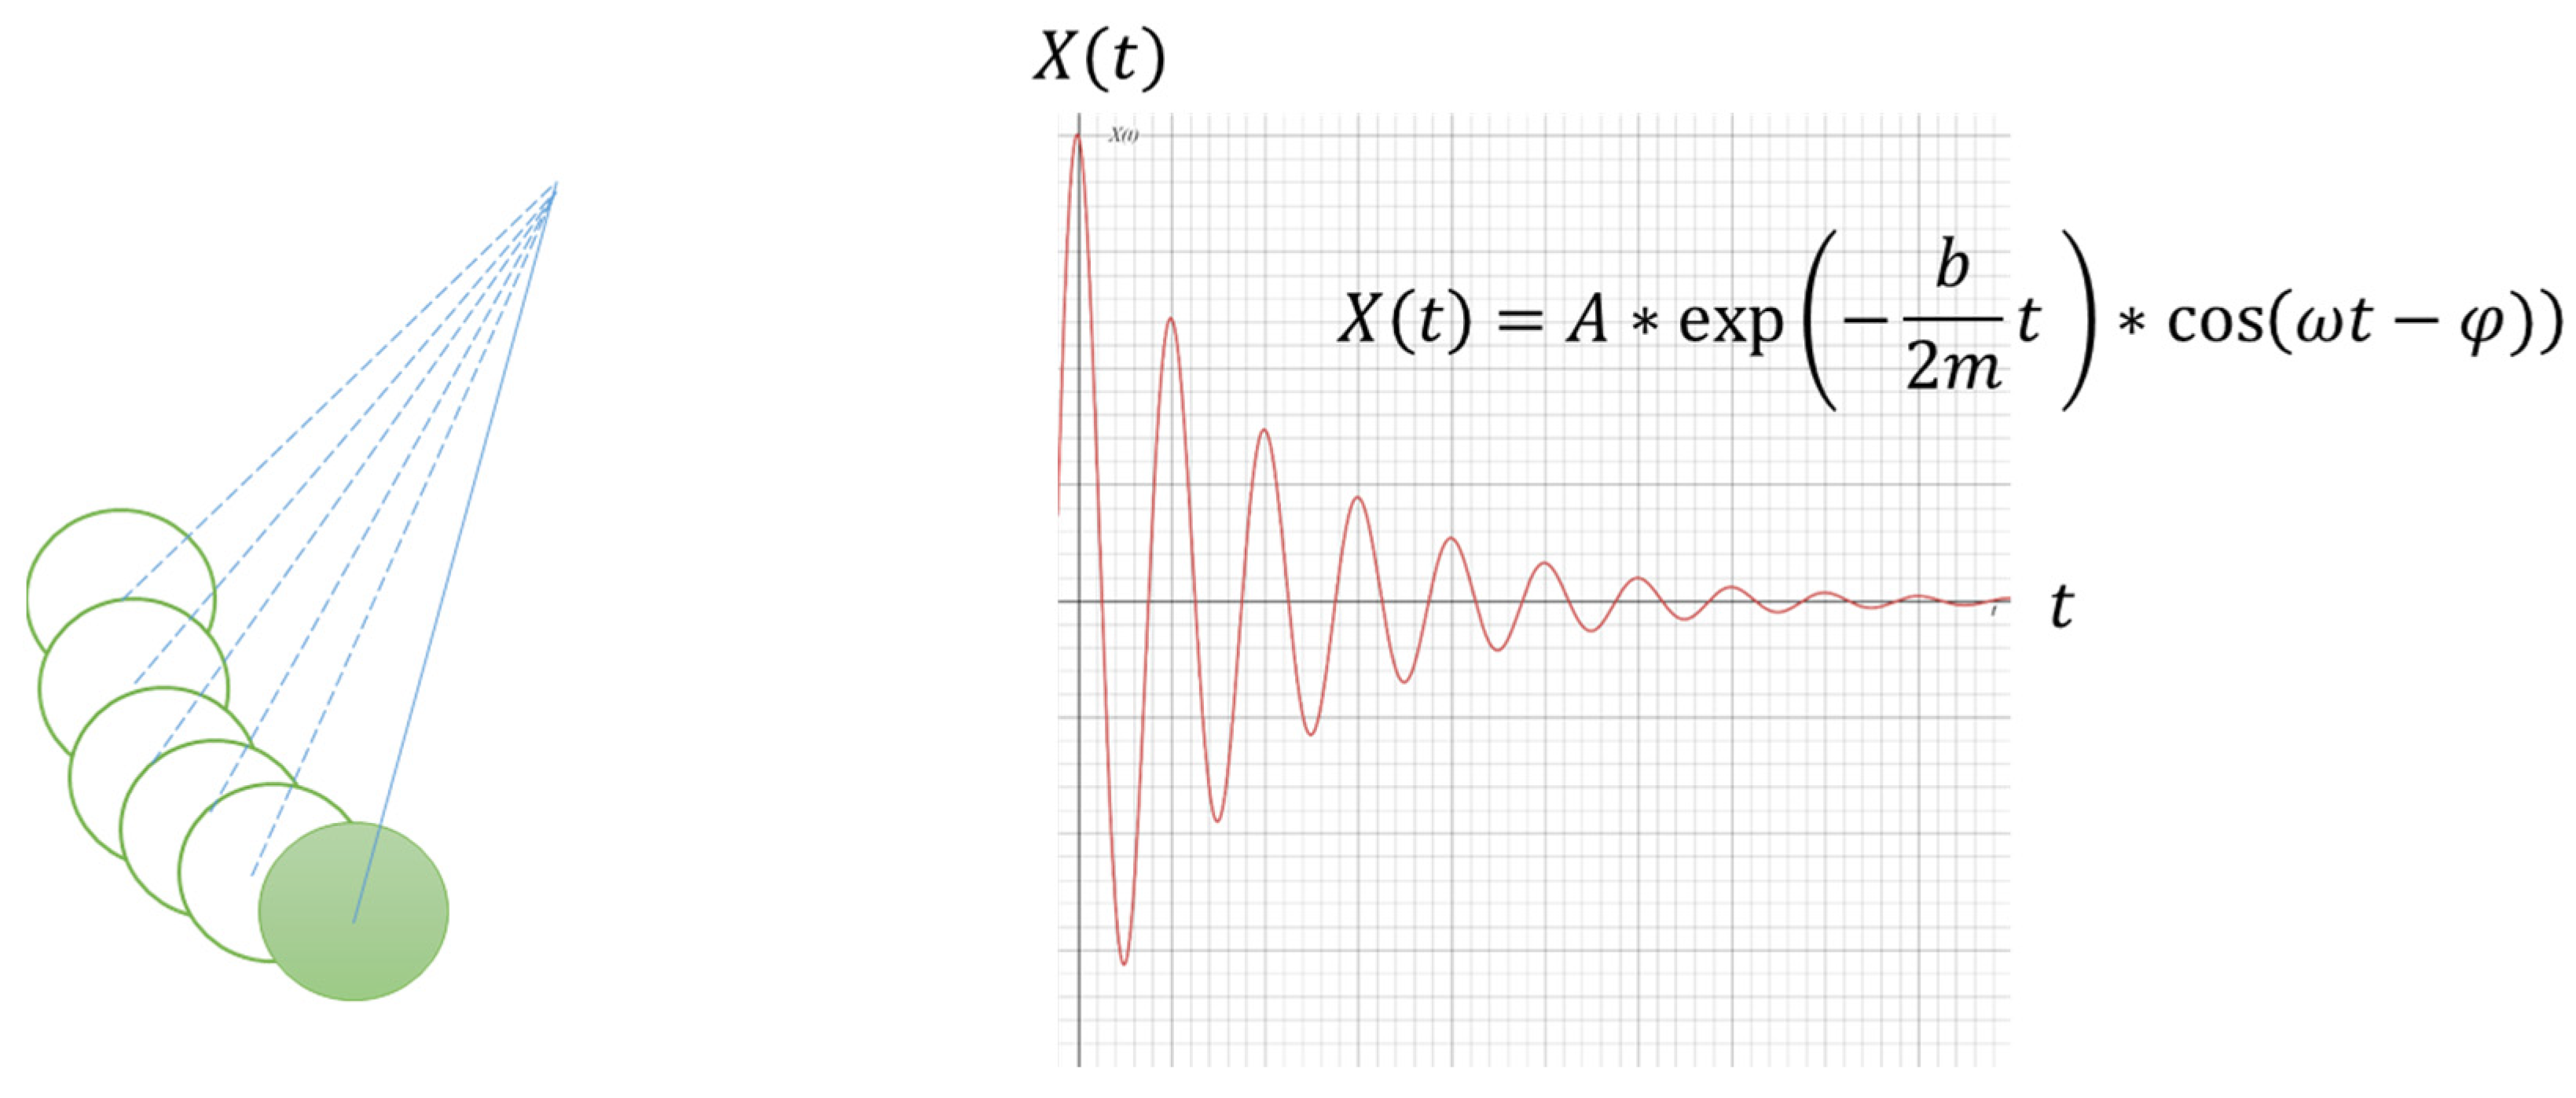
3.1. Source of Inspiration

An idealized pendulum swings left and right with equal height endlessly. However, this is unrealistic, as fluid drag causes by air dampens the pendulum’s movement, which eventually reach to a standstill [24].
Pendulum damped harmonic motion is the inspiration for PSA. The weight swings back and forth, while the oscillation amplitude declines with time until equilibrium is reached. The air resistance dampens and slows down the pendulum motion. Figure 1 illustrate a swinging pendulum hanged by a string and its typical harmonic oscillation. The harmonic oscillation equation is also shown in the figure. The maximum displacement from the equilibrium is represented as A, the angular frequency is ω, and φ is the initial phase.
The pendulum harmonic motion is chosen here to control the search step of PSA agents due to the oscillating pattern observed. This pattern that expands and contracts alternately while decreasing the amplitude throughout the time is desirable. This behaviour is predicted to support agents’ exploration at the beginning, and to be balanced by exploitation as the search progress.

3.2. The Algorithm

PSA is a population-based metaheuristic, where the search for the optimal solution is driven by a group of agents. In PSA, each of the agents acts like a pendulum with independent parameters. They move around the search space looking for the optimal solution, driven by the pendulum movement that centres around their own current position.
The agent’s position updated equation is shown in Equation (1):
P i d ( t ) = P i d ( t 1 ) + p e n d i d ( t ) ( B e s t d P i d ( t 1 ) )
where P i d ( t ) represents position of agent i th at dimension d th for time t th, while B e s t d is the best solution found so far since the start of the search by the entire population. The agent moves towards or away from the best solution based on p e n d i d ( t ) , which is a random number with maximum amplitude oscillates obeying the pendulum harmonic equation as illustrated in Figure 2. Different agents have a different p e n d i d ( t ) value. The p e n d i d ( t ) is calculated according to Equation (2).
p e n d i d ( t ) = 2 exp ( t / t m a x ) ( cos ( 2 π * r a n d ) )
This equation mimics the harmonic equation, t m a x is the maximum number of iterations, and r a n d is a random number between 0 to 1.0 drawn from uniform distribution. The maximum displacement amplitude 2 is chosen so that exploration is favoured during the early iterations. Once the p e n d i d ( t ) is below 1, the agents switch to favour exploitation. Additionally, p e n d i d ( t ) oscillates between the positive and negative range. A positive value p e n d i d ( t ) encourages an agent to move towards the direction of the best solution, while a negative p e n d i d ( t ) drives the agents towards the opposite direction from the best solution.
There are only two simple mathematical equations employed in PSA with two parameters to be selected, namely the number of agents and maximum number of iterations. This makes PSA a very simple optimization algorithm with low computational cost. The pseudocode of PSA is shown in Algorithm 1.
Algorithm 1 Pseudocode of PSA
Initialize the agents’ parameters and positions randomly.
For i = 1: maximum iteration
  For each agent
    Update agents using Equation (1) & (2)
    Evaluate agent’s fitness
  End
  Identify the best agent
End
Solution: best agent

4. Experiment, Results & Discussion

4.1. Optimization of Benchmark Problems

The performance of the proposed PSA is studied using 13 multimodal functions from the CEC2014 benchmark test suite, function 4–16. These functions are minimization problems that are shifted and rotated from their original basic functions. The shift and rotation avoids the issue of origin bias. Multimodal functions have many local optima and one ultimate global optimum. Multimodal functions are suitable to observe whether an algorithm is able to perform and avoid premature convergence or not, as well as observing the algorithm’s exploration and exploitation ability. Therefore, only the 14 multimodal functions are adopted here. The names and ideal fitness of the functions are listed in Table 1; other details of the 13 benchmark functions such as their mathematical functions can be found in [25]. In this work, the dimension of the functions is set to 10.

4.1.1. Number of Agents

There are only two parameters to be selected for PSA. The first is the number of iterations. This is related to the computational ability of the computing platform and the complexity of the problems. Hence, for this experiment the number of iteration is set to 1000. The second parameter is the number of agents. In this section the effect of the number of agents is investigated. The number of agents tested are 10, 20, 30, 40, and 50. All the settings are run 30 times; the best results of the run are tabulated in Table 2. Since the benchmark functions are minimization problems, the best results are the minimum value from the 30 runs of each setting. It can be seen that there is no one number of agents that works best for all test functions. However, the number of agents equal to 50 obtained a higher number of best results compared to the others.
The Friedman signed rank test of 1 × N is then conducted to identify the best number of agents using this set of benchmark functions. The Friedman signed rank test is a statistical method commonly used to provide an unbiased analysis of metaheuristics’ performance [26,27,28]. The lower the Friedman rank of an algorithm, the better the algorithm is. A 1 × N test compares the best-ranked algorithm with the other algorithms. If the Friedman statistic value–which is distributed according to χ 2 with   k 1 degrees of freedom, where k is the number of test (here k = 5 , i.e.,: 5 number of agents tested)–has p-value of lesser than the significance level adopted, α , then the null hypothesis that states that all settings tested are on par with each other is rejected. In order to identify the significant difference, a post hoc procedure known as the Holm post hoc procedure is adopted. In this work, α = 0.05 is adopted. Other than 0.05, 0.1 is also commonly used by researchers. The smaller the value, the stricter the statistical test in accepting the null hypothesis.
In this work, the statistical test is carried using Knowledge Extraction based on Evolutionary Learning (KEEL), which is an open-source tool with statistical analysis modules [26]. KEEL is a user friendly software developed by a group of researchers for research and academic purposes [26,27,28].
The Friedman ranks are listed in the last row of Table 2. The Friedman statistical value (distributed according to χ 2 with 4 degrees of freedom) is 28.030769 and its p-value is 0.000012, which is less than a significance level of 0.05. Therefore, a significant difference exists among the five settings. The Holm post-hoc is used to determine which setting is on par or worse than the best-ranked number of agents. Table 3 shows the p-value and Holm value of the post hoc test. The Holm’s procedure rejects those hypotheses that have a p-value < Holm. Hence, a number of agents equal to 10 is significantly worse than 50, and the others are on par with each other. Thus, it can be concluded that a number of agents above 20 is recommended for PSA.
Figure 3 further illustrates the results of the experiment. The results are converted into error values for better graph representation. The error value is the difference between the fitness of the solution found with the ideal fitness. At the top left of the figure is the close-up of the graph. Similar to what is observed in Table 2, it can be seen that the number of agent equal to 50 gives the least error in most of the functions, but not in all functions.

4.1.2. PSA vs PSO and SCA

The PSA is benchmarked with PSO and SCA. PSO is selected due to its reputation as the state-of-the-art metaheuristic algorithm. Additionally, like PSA, PSO also only has two mathematical equations to be updated at each iteration. Thus, both algorithms have similar computational complexity. The SCA is chosen due to its similarity with PSA as discussed before. Based on the findings from the previous section, all three algorithms are run with 50 agents and for 1000 iterations. Since the algorithms are stochastic algorithms with randomness incorporated into them, the algorithms are run 30 times. In addition to the best result found–i.e., the minimum value; the lower the value, the better the result–the maximum, mean and standard deviation of the algorithms are recorded and tabulated in Table 4, and their convergence curves are presented in Figure 4. Similar to the last section, statistical analysis is conducted using the best results.
The results from the 13 functions found that the best solution of PSA is better than PSO and SCA in 8 functions. This is followed by PSO (= 4) and SCA (= 1). The Friedman test ranked PSA the best with the lowest average rank; this is followed by PSO and SCA. The ranks are listed in the last row of Table 4. Friedman statistic (distributed according to χ 2 with 2 degrees of freedom) is obtained at 14.923077 and the p-value computed by the Friedman Test is 0.000575. Hence, with a significance level of 0.05, it is found that there is significant different between the algorithms. Further analysis with Holm post hoc shows that PSA is on par with PSO and significantly better than SCA. This is indicated by the p-value and Holm value in Table 5.
The standard deviation of PSA is less than 1 for 8 out of the 13 test functions. Low standard deviation shows the consistency of the algorithm’s performance. This is also seen for the state-of-the-art PSO. On the other hand, SCA has a greater number of standard deviations bigger than 1. The same findings are observed through the small difference between the maximum and minimum solution of PSA.
The convergence curves of PSA show that PSA converges gradually at the beginning and found its best solution faster than PSO and SCA. This pattern shows that further improvement focusing on enhancing agents’ exploration is needed

4.2. PSA for Vaccine Distribution Optimization

During a pandemic, an efficient vaccine distribution strategy is important to ensure that objectives such as achieving heard immunity and lowering the transmissibility rate is achieved. As observed during the current COVID-19 pandemic as well as the 2009 H1N1 outbreak, vaccination is an important measure to combat the outbreak of infectious diseases. However, vaccine production is frequently costly and time-consuming, causing limited supply [29]. Therefore, the distribution of vaccines to susceptible persons must be optimized in order to achieve the optimum effects [30].
In this work, we proposed the application of PSA for vaccine distribution optimization. The 2009 Hong Kong’s H1N1 epidemic [31] is used here as the case study. In [31], an extended SEIR model with vaccination (SEIR-V) is proposed. The SEIR model where, S—susceptible, E—exposed, I—infected, and R—recovered, is a compartmental mathematical model frequently adopted to model dynamics of infectious diseases. The SEIR model can be extended to include other aspects such as vaccination effect (V), death (D), and hospitalization (H). The model adopted here characterizes the infection dynamics according to five age groups and the contact rate of the individuals. The SEIR-V model is represented by nonlinear differential Equations (3)–(7).
d S g d t = ( λ g ) · ( S g Δ v g ) + ( Δ v g )
d E g d t = ( γ ) · E g + λ g · ( S g Δ v g )
d I g d t = ( τ ) · I g + γ · E g
d R g d t = τ · I g
d V g d t = Δ v g
The subscript g in the equations represents age group, where g = { 1 , 2 , 3 , 4 , 5 } . The population is divided to five age groups as follows; A 1 ( 5 14 ) ,     A 2 ( 15 24 ) ,   A 3 ( 25 44 ) ,   A 4 ( 45 64 ) , and A 5 ( 65 + ) . Children between the age of 0–4 are not included as they do not have independent social contact. The contact frequency matrix, C = { c g 1 , g 2 | g 1 , g 2 ( 1 , 5 ) } , between individuals from different and same age groups is presented in Table 6. The numbers are decided based on the work conducted in [32].
In Equation (3), (4), and (7), Δ v g is the amount of vaccine released in the current step. Meanwhile, λ g represents infection risk of the susceptible individuals in group A g which is formulated in Equation (8).
λ g = 1 5 · ( j = 1 5 ( c g ,   g 2 · I g 2 P g 2   ) ) · S g P g · β g
The size of population according to age group is represented by P g while β g is the age-based infection rate. γ and τ represent the incubation and recovery rate. These parameters are set according to the setting of [31], which is shown in Table 7.
The objective of the PSA is to minimize the total infections by minimizing the peak of the infection curve. The position of PSA’s agent, P i g , represents the distribution percentage of the vaccine according to age group, g . The dimension of the agent follows the number of age group. The objective function is as shown in Equation (9).
f i t i = m i n ( i = 1 5 I g ( p e a k ) ) subject   to :   g = 1 5 V g = V m a x ,       V g = P i g × V m a x g = 1 5 P i g = 1 1 p e a k e n d o b
where f i t i is fitness of agent i , I g ( p e a k ) is the peak of infection number from the start of the outbreak to the end of the outbreak, e n d o b . V m a x is the total number of vaccines available. The infection number is calculated using Equation (5). Since day of the outbreak, t , is a discrete value ( t ( 1 ,   e n d o b ) ), the differential equation is approached using the discrete calculus method, where the I is calculated using summation.
The performance of the PSA in solving the vaccine distribution problem is compared with the three traditional strategies implemented in [31], which are based on transmissibility (S1), vulnerability (S2), and infection risk (S3). Three conditions are used here, where the number of vaccines is set to small, medium, and large quantity which are 5%, 10%, and 20% of the total population. The vaccine is assumed to be given during the infection dispersing stage, which is at day 50. The duration of the outbreak is e n d o b = 300 days and the initial exposed individual are 30 from A 2 . The experimental parameter settings are tabulated in Table 8.
The results of vaccine distribution using PSA are illustrated in Figure 5, Figure 6 and Figure 7. The results show that for small and medium vaccination coverage, PSA can find much better vaccination distribution percentages that the other three traditional strategies. The peaks of the infection outbreak are lowest using the percentage determined by PSA compared to the other strategy. Meanwhile, when the number of vaccines is large, the performance of PSA, S2, and S3 are close to one another.
Overall, the findings show that PSA is a good optimization algorithm that can solve a complex nonlinear differential problem like the vaccination distribution problem. In addition, it is observed that increasing the number of vaccines lowers and flattens the infection curve faster.

5. Conclusions

A new metaheuristic algorithm, PSA, is proposed in this work. PSA is a population-based algorithm where the agents move in the search space by mimicking pendulum movement. The performance of the algorithm is studied using 13 multimodal mathematical functions. The findings found that the algorithm is able to look for a good solution and performs as well as the state-of-the-art PSO and significantly better than SCA. The PSA is then applied to the vaccine distribution optimization problem. Three conditions are tested and the results of PSA are better than that of traditional strategies. Nonetheless, convergence curves show that PSA converges faster than PSO. This contributes to PSO obtaining better results in the functions where it outperformed PSA. Hence, further work should focus on improving the exploration ability of PSA so that a better performance can be achieved. For example, a move towards a randomly selected agent by some agents may be incorporated to encourage exploration. In addition, a mechanism that allows the algorithm to self-adapt the number of agents as well as the iteration number is desirable. Finally, the work also points to the potential benefits in developing smart decision support systems that can enhance authorities’ ability to take the most optimum strategic decisions when addressing complex problems such as vaccine distribution to combat a pandemic.

Author Contributions

Conceptualization, N.A.A.A. and K.A.A.; Formal analysis, K.A.A.; Funding acquisition, N.A.A.A.; Investigation, N.A.A.A. and K.A.A.; Methodology, N.A.A.A. and K.A.A.; Writing–original draft, N.A.A.A.; Writing—review & editing, K.A.A. All authors have read and agreed to the published version of the manuscript.

Funding

This research was funded by Ministry of Higher Education, Malaysia under the Fundamental Research Grant Scheme, FRGS/1/2019/ICT02/MMU/02/15.

Institutional Review Board Statement

Not applicable.

Informed Consent Statement

Not applicable.

Data Availability Statement

Not applicable.

Conflicts of Interest

The authors declare no conflict of interest.

References

  1. Holland, J.H. Genetic Algorithms. Sci. Am. 1992, 267, 66–73. Available online: http://www.jstor.org/stable/24939139 (accessed on 15 March 2022). [CrossRef]
  2. Dorigo, M.; Birattari, M.; St, T. Ant Colony Optimization. IEEE Comput. Intell. Mag. 2006, 1, 28–39. [Google Scholar] [CrossRef]
  3. Kennedy, J.; Eberhart, R. Particle swarm optimization. In Proceedings of the IEEE International Conference on Neural Networks, Houston, TX, USA, 12 June 1997; Volume 4, pp. 1942–1948. [Google Scholar] [CrossRef]
  4. Mirjalili, S. SCA: A Sine Cosine Algorithm for solving optimization problems. Knowl.-Based Syst. 2016, 96, 120–133. [Google Scholar] [CrossRef]
  5. Rashedi, E.; Nezamabadi-pour, H.; Saryazdi, S. GSA: A Gravitational Search Algorithm. Inf. Sci. 2009, 179, 2232–2248. [Google Scholar] [CrossRef]
  6. Yang, X.S. A New Metaheuristic Bat-Inspired Algorithm. In Nature Inspired Cooperative Strategies for Optimization (NICSO 2010); Gonzalez, J.R., Ed.; Springer: Berlin/Heidelberg, Germany, 2010; pp. 65–74. [Google Scholar]
  7. Karaboga, D. An Idea Based on Honey bee Swarm for Numerical Optimisation; Technical Report; Computer Engineering Department, Erciyes University: Kayseri, Turkey, 2005. [Google Scholar]
  8. Mirjalili, S.; Mirjalili, S.M.; Lewis, A. Grey Wolf Optimizer. Adv. Eng. Softw. 2014, 69, 46–61. [Google Scholar] [CrossRef] [Green Version]
  9. Yang, X.S.; Deb, S.; Fong, S. Metaheuristic Algorithms: Optimal Balance of Intensification and Diversification. Appl. Math. Inf. Sci. 2014, 8, 977–983. [Google Scholar] [CrossRef]
  10. Olorunda, O.; Engelbrecht, A.P. Measuring exploration/exploitation in particle swarms using swarm diversity. In Proceedings of the 2008 IEEE Congress on Evolutionary Computation (IEEE World Congress on Computational Intelligence), Hong Kong, China, 1–6 June 2008; pp. 1128–1134. [Google Scholar] [CrossRef]
  11. Eberhart, R.; Shi, Y. Comparing Inertia Weights and Constriction Factors in Particle Swarm Optimization. In Proceedings of the 2000 Congress on Evolutionary Computation, La Jolla, CA, USA, 16–19 July 2000; pp. 84–88. [Google Scholar]
  12. Bansal, J.C.; Singh, P.K.; Saraswat, M.; Verma, A.; Jadon, S.S.; Abraham, A. Inertia weight strategies in particle swarm optimization. In Proceedings of the 2011 Third World Congress on Nature and Biologically Inspired Computing, Salamanca, Spain, 19–21 October 2011; pp. 633–640. [Google Scholar] [CrossRef] [Green Version]
  13. Elkhateeb, N.A.; Badr, R.I. Employing Artificial Bee Colony with dynamic inertia weight for optimal tuning of PID controller. In Proceedings of the 2013 5th International Conference on Modelling, Identification and Control (ICMIC), Cairo, Egypt, 31 August–2 September 2013; pp. 42–46. [Google Scholar]
  14. Yang, X.S. Review of Metaheuristics and Generalized Evolutionary Walk Algorithm. arXiv 2011, arXiv:1105.3668. Available online: http://arxiv.org/abs/1105.3668 (accessed on 6 November 2014).
  15. Sarangi, A.; Sarangi, S.K.; Panigrahi, S.P. An approach to identification of unknown IIR systems using crossover cat swarm optimization. Perspect. Sci. 2016, 8, 301–303. [Google Scholar] [CrossRef] [Green Version]
  16. Binkley, K.J.; Hagiwara, M. Balancing Exploitation and Exploration in Particle Swarm Optimization: Velocity-based Reinitialization. Trans. Jpn. Soc. Artif. Intell. 2008, 23, 27–35. [Google Scholar] [CrossRef] [Green Version]
  17. Jancauskas, V. Empirical Study of Particle Swarm Optimization Mutation Operators. Balt. J. Mod. Comput. 2014, 2, 199–214. [Google Scholar]
  18. Li, C.; Yang, S.; Korejo, I. An Adaptive Mutation Operator for Particle Swarm Optimization. In Proceedings of the 2008 UK Workshop on Computational Intelligence, Leicester, UK, 10–12 September 2008; pp. 165–170. [Google Scholar]
  19. Abualigah, L.; Diabat, A. Advances in Sine Cosine Algorithm: A Comprehensive Survey; Springer: Berlin/Heidelberg, Germany, 2021; Volume 54. [Google Scholar]
  20. Gabis, A.B.; Meraihi, Y.; Mirjalili, S.; Ramdane-Cherif, A. A Comprehensive Survey of Sine Cosine Algorithm: Variants and Applications; Springer: Berlin/Heidelberg, Germany, 2021; Volume 54. [Google Scholar]
  21. Askari, Q.; Younas, I.; Saeed, M. Critical evaluation of sine cosine algorithm and a few recommendations. In Proceedings of the 2020 Genetic and Evolutionary Computation Conference Companion, Cancún, Mexico, 8–12 July 2020; pp. 319–320. [Google Scholar] [CrossRef]
  22. Aziz, N.H.A.; Ibrahim, Z.; Aziz, N.A.A.; Mohamad, M.S.; Watada, J. Single-solution Simulated Kalman Filter algorithm for global optimisation problems. Sādhanā 2018, 43, 103. [Google Scholar] [CrossRef] [Green Version]
  23. Rahman, T.A.B.; Ibrahim, Z.; Aziz, N.A.A.; Zhao, S.; Aziz, N.H.A. Single-Agent Finite Impulse Response Optimizer for Numerical Optimization Problems. IEEE Access 2018, 6, 9358–9374. [Google Scholar] [CrossRef]
  24. Mongelli, M.; Battista, N.A. A swing of beauty: Pendulums, fluids, forces, and computers. Fluids 2020, 5, 48. [Google Scholar] [CrossRef] [Green Version]
  25. Liang, J.J.; Qu, B.Y.; Suganthan, P.N. Problem Definitions and Evaluation Criteria for the CEC 2014 Special Session and Competition on Single Objective Real-Parameter Numerical Optimization; Technical report; Zhengzhou University: Zhengzhou, China; Nanyang Technological University: Singapore, 2013. [Google Scholar]
  26. Alcalá-Fdez, J.; Sánchez, L.; García, S.; del Jesus, M.J.; Ventura, S.; Garrell, J.M.; Otero, J.; Romero, C.; Bacardit, J.; Rivas, V.M.; et al. KEEL: A software tool to assess evolutionary algorithms for data mining problems. Soft Comput. 2009, 13, 307–318. [Google Scholar] [CrossRef]
  27. Triguero, I.; González, S.; Moyano, J.M.; García, S.; Alcalá-Fdez, J.; Luengo, J.; Fernández, A.; del Jesús, M.J.; Sánchez, L.; Herrera, F. KEEL 3.0: An Open Source Software for Multi-Stage Analysis in Data Mining. Int. J. Comput. Intell. Syst. 2017, 10, 1238. [Google Scholar] [CrossRef] [Green Version]
  28. Alcalá-Fdez, J.; Fernández, A.; Luengo, J.; Derrac, J. KEEL data-mining software tool: Data set repository, integration of algorithms and experimental analysis framework. J. Mult.-Valued Log. Soft Comput. 2011, 17, 255–287. [Google Scholar]
  29. Ulmer, J.B.; Valley, U.; Rappuoli, R. Vaccine manufacturing: Challenges and solutions. Nat. Biotechnol. 2006, 24, 1377–1383. [Google Scholar] [CrossRef] [PubMed]
  30. Hu, X. Optimizing Vaccine Distribution for Different Age Groups of Population Using DE Algorithm. In Proceedings of the 2013 Ninth International Conference on Computational Intelligence and Security, Emeishan, China, 14–15 December 2013; pp. 21–25. [Google Scholar] [CrossRef]
  31. Liu, J.; Xia, S. Toward effective vaccine deployment: A systematic study. J. Med. Syst. 2011, 35, 1153–1164. [Google Scholar] [CrossRef] [PubMed]
  32. Mossong, J.; Hens, N.; Jit, M.; Beutels, P.; Auranen, K.; Mikolajczyk, R.; Massari, M.; Salmaso, S.; Tomba, G.S.; Wallinga, J. Social contacts and mixing patterns relevant to the spread of infectious diseases. PLoS Med. 2008, 5, 381–391. [Google Scholar] [CrossRef] [PubMed]
Figure 1. Pendulum Harmonic Motion.
Algorithms 15 00214 g001
Figure 2. p e n d i d ( t ) Magnitude of Oscillation.
Algorithms 15 00214 g002
Figure 3. Fitness error of the benchmark functions with different number of agents.
Algorithms 15 00214 g003
Figure 4. Convergence Curves.
Algorithms 15 00214 g004
Figure 5. Infection dynamic for 5% vaccination coverage.
Algorithms 15 00214 g005
Figure 6. Infection dynamic for 10% vaccination coverage.
Algorithms 15 00214 g006
Figure 7. Infection dynamic for 20% vaccination coverage.
Algorithms 15 00214 g007
Table 1. List of Benchmark Functions.
Function NameIdeal Fitness
f4Shifted and Rotated Rosenbrock’s Function400
f5Shifted and Rotated Ackley’s Function500
f6Shifted and Rotated Weierstrass Function600
f7Shifted and Rotated Griewank’s Function700
f8Shifted Rastrigin’s Function800
f9Shifted and Rotated Rastrigin’s Function900
f10Shifted Schwefel’s Function1000
f11Shifted and Rotated Schwefel’s Function1100
f12Shifted and Rotated Katsuura Function1200
f13Shifted and Rotated HappyCat Function1300
f14Shifted and Rotated HGBat Function1400
f15Shifted and Rotated Expanded Griewank’s plus Rosenbrock’s Function1500
f16Shifted and Rotated Expanded Scaffer’s F6 Function1600
Table 2. Effect of Number of Agents.
Number of Agents
Function Name1020304050
f4400.0557400.0003400.001400.0008400.0013
f5519.997519.996519.9923519.983519.9913
f6601.5922601.0678600.3217600.3587600.0771
f7700.0595700.027700.0418700.0591700.0517
f8801.9904800800800800
f9905.9708905.9698904.9748905.9698904.9748
f101007.0311000.3751000.251003.6021000.25
f111247.4311226.781140.2381222.4931131.949
f121200.0591200.0061200.0121200.011200.017
f131300.1381300.1321300.11300.0431300.137
f141400.1711400.1441400.1231400.0791400.052
f151500.941500.5751500.4991500.5781500.417
f161602.2631602.0721602.0321601.5111601.108
Friedman Rank52.96152.34622.57692.1154
Table 3. Holm Post Hoc for Number of Agents.
iNumber of AgentspHolm
4100.0000030.0125
3200.1724470.016667
2400.456750.025
1300.7098150.05
Table 4. Performance of PSA vs PSO and SCA.
PSAPSOSCA
MinMaxMeanStd DevMinMaxMeanStd DevMinMaxMeanStd Dev
f4400.01438.72421.3017.32400.15442.94429.5816.54431.09490.65458.4614.61
f5519.83520.00519.990.03520.11520.45520.290.08517.81520.56520.320.48
f6600.03606.29602.331.46600.00606.87601.351.51604.51609.45606.501.30
f7700.03700.66700.220.16700.03700.23700.130.06706.04718.41711.083.57
f8800.00802.98800.830.79800.99803.98802.500.96827.23855.40839.577.99
f9902.98924.87911.185.96903.98916.47909.303.21935.95957.31943.536.08
f101003.411140.721026.8140.761003.721365.821133.64113.591744.352388.441994.61173.71
f111225.662166.991574.51214.471106.891881.691482.65198.601658.502876.792400.37279.23
f121200.031200.241200.110.061200.081201.401200.610.381200.911201.721201.300.19
f131300.131300.481300.290.111300.061300.221300.130.041300.501300.841300.620.08
f141400.071400.841400.320.201400.071400.321400.150.061400.381401.521400.920.34
f151500.451503.311501.540.761500.491502.691501.160.451505.011513.121507.421.64
f161601.241603.221602.390.561600.741603.141602.150.481602.721603.791603.370.22
Friedman Rank1.3846 1.7692 2.8462
Table 5. Holm Post Hoc for Number of Agents.
iAlgorithmpHolm
2SCA0.0001940.025
1PSO0.32680.05
Table 6. Contact frequency matrix.
A 1 A 2 A 3 A 4 A 5
A 1 8.271.3954.1651.510.715
A 2 1.3955.652.3851.830.895
A 3 4.1672.3856.553.4251.383
A 4 1.511.833.4254.22.055
A 5 0.7150.8951.3832.0552.66
Table 7. Parameters of 2009 Hong Kong’s H1N1 epidemic.
Age Group Population   P i Infection   Rate   β i Incubation   Rate   γ Recovery   Rate   τ
A 1 0.94 m0.4340.250.334
A 2 0.94 m0.1580.250.334
A 3 2.30 m0.1180.250.334
A 4 1.86 m0.0460.250.334
A 5 0.85 m0.0460.250.334
Table 8. Experimental parameter settings.
ParameterValue
No. of vaccine(0.3 m = 5%, 0.6 m = 10%, 1.2 m = 20%)
Administered day50
Outbreak duration300
Initial   exposed   individuals   { E 1 E 2 ,   E 3 ,   E 4 ,   E 5 } {0, 30, 0, 0, 0}
Publisher’s Note: MDPI stays neutral with regard to jurisdictional claims in published maps and institutional affiliations.

