Article

Pedestrian Detection Based on Feature Enhancement in Complex Scenes

1
School of Electrical Engineering, Xinjiang University, Urumqi 830000, China
2
School of Control Science and Engineering, Dalian University of Technology, Dalian 116023, China
*
Author to whom correspondence should be addressed.
Algorithms 2024, 17(1), 39; https://doi.org/10.3390/a17010039
Submission received: 8 November 2023 / Revised: 13 January 2024 / Accepted: 15 January 2024 / Published: 18 January 2024

Abstract

:
Pedestrian detection has always been a difficult and hot spot in computer vision research. At the same time, pedestrian detection technology plays an important role in many applications, such as intelligent transportation and security monitoring. In complex scenes, pedestrian detection often faces some challenges, such as low detection accuracy and misdetection due to small target sizes and scale variations. To solve these problems, this paper proposes a pedestrian detection network PT-YOLO based on the YOLOv5. The pedestrian detection network PT-YOLO consists of the YOLOv5 network, the squeeze-and-excitation module (SE), the weighted bi-directional feature pyramid module (BiFPN), the coordinate convolution (coordconv) module and the wise intersection over union loss function (WIoU). The SE module in the backbone allows it to focus on the important features of pedestrians and improves accuracy. The weighted BiFPN module enhances the fusion of multi-scale pedestrian features and information transfer, which can improve fusion efficiency. The prediction head design uses the WIoU loss function to reduce the regression error. The coordconv module allows the network to better perceive the location information in the feature map. The experimental results show that the pedestrian detection network PT-YOLO is more accurate compared with other target detection methods in pedestrian detection and can effectively accomplish the task of pedestrian detection in complex scenes.

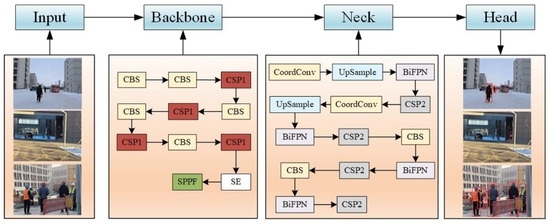
Graphical Abstract

1. Introduction

Target detection mainly accomplishes the function of classifying and localizing objects in scenes. Target detection is the basis of target tracking [1] and intelligent vehicle obstacle avoidance [2]. In addition, target detection has been widely used in areas such as military defense and security surveillance [3,4,5]. Pedestrian detection is designed to accurately recognize and detect pedestrians in various scenes [6,7,8,9]. Pedestrian detection technology plays a key role in some areas, such as pedestrian abnormal behavior analysis and intelligent robotics [10].
Pedestrian detection methods include traditional pedestrian detection methods and deep learning pedestrian detection methods. The traditional pedestrian detection method is based on the traditional feature extraction and classifier method in the field of computer vision. Traditional pedestrian detection methods use histogram of oriented gradients (HOG) [11] and Haar-like [12] to extract features such as the local gradient, textures, edges, etc., from the image, thereby describing the shape and appearance of the pedestrian. Classifiers, such as support vector machines, are used to learn the relationship between the features and labels of the samples to classify and discriminate between pedestrians and non-pedestrians. Because traditional methods mainly rely on manually designed features and classifiers, their adaptability to complex scenes, attitude changes and occlusions is poor and they are prone to misdetection and false detection. Meanwhile, traditional methods need to compute and process a large number of features in the training and inference process, which is time-consuming.
Deep learning methods for pedestrian detection have made significant progress. Common pedestrian detection methods in deep learning are based on convolutional neural networks. Convolutional neural networks can automatically learn rich features from original images to achieve accurate pedestrian detection. To reduce the computational complexity and speed up the detection process, we commonly use the regional proposal network, which can generate the position and size of the candidate box to complete pedestrian detection. Commonly used pedestrian detection frameworks in deep learning methods include Faster R-CNN [13], you only look once (YOLO) [14], etc. These frameworks can accurately perform the pedestrian detection task. However, deep learning pedestrian detection methods require a large amount of data for training and also require the computer to have good computational performance. A large number of studies show that the detection accuracy of deep learning pedestrian detection methods is better than that of traditional pedestrian detection methods. Therefore, deep learning pedestrian detection methods are mainstream detection methods at present. With the improvement in the detection network, detection performance has been improved to some extent. Despite the progress made, there are still challenges in pedestrian detection, such as low detection accuracy, missed detection, and false detection [15].
To effectively solve the problems of low accuracy, missed detection, and the false detection of pedestrians in different scenes, in this paper the pedestrian detection network PT-YOLO based on the YOLOv5 is proposed, and the detection accuracy of the network is significantly improved by reconfiguring the network. The pedestrian detection network PT-YOLO contains input, a backbone, a neck, and a head. To enhance the feature extraction, the SE module is added to the backbone. Then, the pedestrian detection network PT-YOLO utilizes the BiFPN as the feature fusion module to combine features from different scales. The WIoU loss function is designed to improve the generalization ability of the network and improve the detection accuracy of the network. Finally, the coordconv module is added to the neck to enable the network to accurately localize the pedestrian’s position.
The main contributions of this paper are as follows:
  • To solve the problem of missing pedestrians caused by occlusion, we add the SE module to the backbone of the pedestrian detection network PT-YOLO so that the network can learn the key feature information of pedestrians and reduce the missed detection rate.
  • To solve the problem of low accuracy in pedestrian detection caused by scale changes in the environment, we use the BiFPN module in the neck to realize the information exchange and fusion between different feature layers, which improves the accuracy of pedestrian detection.
  • To reduce the loss of the network, we use the WIoU loss function in the head to reduce the regression loss of the boundary box.
  • To highlight the detailed information of pedestrians and reduce the feature loss, the coordconv module is introduced into the pedestrian detection network PT-YOLO to enhance the spatial information of the network and ensure the accuracy of pedestrian detection.
The rest of the paper is organized as follows: Section 2 reviews the previous work related to this research. In Section 3, we provide a detailed description of the PT-YOLO pedestrian detection network. Section 4 derives the experimental results to show the performance of the PT-YOLO pedestrian detection network. The conclusions are drawn in Section 5.

2. Related Work

2.1. Traditional Target Detection Method

Traditional target detection methods include three main steps: region selection (sliding window), feature extraction, and classification. Region selection typically refers to the process of selecting subsets with specific regional attributes from a dataset in fields such as data analytics and machine learning. Feature extraction is the extraction of representative and discriminative features from raw data for subsequent data analysis and machine learning tasks. Classification primarily involves analyzing and learning from data to predict the categories of the data. Typically, a decision tree is used for region selection. A HOG, deformable part models [16], local binary patterns [17] and haar-like features are used for feature extraction. Then, the extracted features are classified using classifiers such as support vector machines (SVM) [18] and adaboost [19].
Felzenszwalb et al. proposed the use of deformable part models to deal with changes in object appearance and shape. Selective search uses a combination of exhaustive search and segmentation to ensure search diversity and improve efficiency [20]. Oxford-mlk combines the advantages of a histogram of oriented gradient features and cascaded support vector machines to achieve target detection [21]. Nlpr-hogllbp captures the detailed information and texture features of face images to improve the accuracy and robustness of face recognition [22]. Liu et al. [23] proposed a self-learning pedestrian reliability detection method. Firstly, the motion regions in the scene are localized, and then support vector machines are used to extract features on the motion regions. Finally, self-learning is performed on the false targets that appear in the classification stage. Through the above steps, the experiment finally reduces the false detection rate and improves the detection accuracy, and the detection accuracy is 92.4%.

2.2. Deep Learning Target Detection Method

Deep learning target detection methods are broadly divided into two categories. One classification is the single-stage algorithm, which directly takes the image as the input and produces the corresponding bounding box for the category. This approach is exemplified by the YOLO algorithm introduced by Redmon et al. in 2016. The YOLO network is a collective term for a large target detection network. The YOLO network includes different detection models, such as YOLOv1, YOLOv2, YOLOv3, YOLOv4, YOLOv5, YOLOv7, etc., instead of presenting each the YOLO network individually. Another classification is the two-stage algorithm, where the algorithm first generates region proposals and then utilizes convolutional neural networks for classification and localization to obtain bounding boxes. Representative examples of this category include a faster region-based convolutional neural network (Faster R-CNN) and a fast region-based convolutional neural network (Fast R-CNN) [24].
Redmon et al. proposed the YOLO network. The network takes the whole image as an input to the network, and the output is the category and position of the regression target box. The detection speed is significantly improved. Gong et al. [25] proposed an improved object detection method based on the idea of feature fusion, which improves the detection accuracy and detection speed of the network by fusing the outputs of different layers. Woo et al. [26] introduced the convolutional block attention module (CBAM), which enhanced both the channel and spatial information; thereby, the CBAM module can further improve the feature extraction capability of the network. Hu et al. [27] proposed the squeeze-and-excitation (SE) module, which enables the network to focus on important features while suppressing unnecessary ones. Liu et al. [28] introduced the Swin-Transformer module, which utilizes different down sampling feature maps at different stages to output multi-scale feature information. Chen et al. [29] reconstructed the backbone network of the YOLOv5 network using Res2Block to improve the fine-grained feature fusion capability of the network. Xu et al. [30] proposed a pedestrian detection method based on a small sample dataset. The mosaic data enhancement method was used to increase the number of datasets. This method improves the comprehensive performance of the model without changing the number of existing data sets and networks, and its detection accuracy is 91.97%. Chen and Guo [31] designed a multi-scale feature fusion pedestrian detection network based on a transformer. In the detection phase, the transformer can capture global information, effectively solve the long-distance dependency mechanism between image pixels, and improve the pedestrian detection effect. The detection accuracy is 78.5%.
In previous research, pedestrian detection mainly includes traditional detection methods and deep learning detection methods. Traditional detection methods are relatively simple to train and use. However, because traditional detection methods need to perform redundant traversal operations on images, the time needed to use them and their complexity are high. Deep learning detection methods have a simple structure, high efficiency and high precision. However, deep learning methods require a large amount of data for training and also require the computer to have good computational performance. A large number of studies show that the detection accuracy of deep learning pedestrian detection methods is better than that of traditional pedestrian detection methods. Therefore, deep learning pedestrian detection methods are mainstream detection methods at present. However, because pedestrians on the scene will be affected by factors such as occlusion, scale transformation, lighting changes, and posture changes, the detection results have problems such as low accuracy, missed detection, and false detection.
To effectively solve the problem of low accuracy, missed detection, and the false detection of pedestrians in different scenes, this paper presents a pedestrian detection network PT-YOLO based on the YOLOv5. The pedestrian detection network PT-YOLO contains inputs, a backbone, a neck, and a head. Different parts of the pedestrian detection network PT-YOLO complete different tasks.

3. PT-YOLO Pedestrian Detection Network

3.1. Framework

To address the challenges of low pedestrian detection accuracy and misdetection due to scale variations in different environments, we propose the pedestrian detection network PT-YOLO based on the YOLOv5 [32]. The structure of the pedestrian detection network PT-YOLO is illustrated in Figure 1.
The pedestrian detection network PT-YOLO consists of an input, a backbone, a neck, and a head. The input module resizes the input image and bounding box computation. The backbone completes the feature extraction task through the combination of five CBS (convolutional batchnorm silu) modules, four CSP (cross-stage partial network) modules, an SE module, and an SPPF (spatial pyramid pooling-fast) module. The neck network consists of two CBS modules, two coordconv modules, four CSP modules, two upsample modules and four BiFPN modules. The neck mainly fuses the features extracted from the backbone network. Finally, the head is mainly responsible for predicting pedestrians of different sizes. Additionally, we design a WIoU loss function at the head to reduce the regression error.

3.2. Backbone: Feature Extraction

The role of the backbone is to extract features from the input image to capture the most important visual information in the image. The backbone of the pedestrian detection network PT-YOLO consists of multiple layers of convolutional neural networks, with each convolutional layer performing specific feature extraction operations to better capture important features.

3.2.1. CBS Module and CSP Module

The CBS module in the pedestrian detection network PT-YOLO is composed of convolutional, batchnorm, and silu modules as shown in Figure 2. We extract features with semantic information from the original image using convolutional operations. The batchnorm operation can alleviate the problem of a vanishing gradient and speed up the convergence. Silu functions are utilized after convolution and batchnorm operations to enhance the expressive power of the network. The main function of the CBS module is to exchange and fuse information between feature maps at different scales to improve the accuracy and performance of pedestrian detection. The CSP module is an important part of the pedestrian detection network PT-YOLO. The structure of the CSP module is shown in Figure 3. Each feature channel consists of three convolution layers. First, the convolution results of the first and second layers are combined, and then a convolution operation is performed with the third layer. Its main function is to increase the depth and receptive field of the network.
For the pedestrian detection network PT-YOLO proposed in this paper, we use the CBS module in combination with the CSP module, naming it the CCS module. The pedestrian detection network PT-YOLO uses a four-layer CCS module that takes the output of the previous layer’s results as the input to the next layer of the network, which ultimately processes the input image to a size of 512 × 20 × 20 for better feature extraction. The CSP1 module is applied to the backbone section. Since the backbone represents a deeper network, the residual structure is introduced to increase the depth and expressiveness of the network and to mitigate the problem of vanishing network gradients. The CSP2 module is primarily used in the neck. Due to the neck being relatively straightforward, removing the residual module can help to reduce computational overhead.

3.2.2. SE Module

In our method, the SE module is added after the CSP module of the feature extraction network and before the SPPF module. The structure of the SE module is shown in Figure 4.
After completing the CSP module, we obtain a feature map with a size of 512 × 20 × 20 , and a new feature vector y is obtained by global average pooling. The new feature vector   y is then subjected to an activation operation to obtain a weight value between 0 and 1. Finally, the weight value y is adjusted to the same size as the input feature map x and multiplied by the input feature map x to obtain the final output feature map. The features of each channel are affected by feature scaling, which enhances the expression of important features and enables the network to better capture and distinguish pedestrians.

3.2.3. SPPF Module

In order to improve the network’s ability to detect pedestrians at different scales, the SPPF module is added to the backbone network. First, the feature map output from the SE module is subjected to a 1 × 1 convolution operation to obtain the feature map x 1 . Then, multiple maxpool operations are performed through the maxpooling layer to obtain feature maps y 1 , y 2 , and y 3 at different scales as shown in Figure 5.
Finally, the data obtained from y 1 , y 2 , and y 3 , as well as the data not subjected to maxpool operations, are concatenated, and the final output feature map is obtained after a 1 × 1 convolutional layer. In summary, the main function of the SPPF module is to obtain more information about the input feature map through maxpool operations at different scales and to fuse it into the output feature map. Therefore, adding the SPPF module can improve the network’s ability to detect objects at different scales.

3.3. Neck: Feature Pyramid

The neck is located between the backbone and the head. The main role of the neck is to further extract feature information from the output of the backbone. At the same time, the neck performs multi-scale feature fusion and feature enhancement on the features extracted from the backbone. Finally, the processed features are passed to the head.

3.3.1. BiFPN Module

Due to the complex image background of pedestrian detection and the scale transformation of the pedestrian, so the accuracy of pedestrian detection is low. Figure 6 shows the PAN structure, which introduces a top-down channel and bottom-up channel to fuse features and pays too much attention to feature information interaction between layers. The PAN module can realize pedestrian feature fusion, but the detection effect is not good. In our method, in order to better solve the above problems, we propose the BiFPN module to improve on the FPN. The BiFPN module builds on the PAN module by adding contextual information and multiplying each edge by the corresponding weight [33], and the formula is shown below:
  O = i ω i ε + j ω j · I i
where   i and j represent the number of input layers of the feature fusion node and ω i and ω j are the weights of each input feature layer, ε denotes the very small value learning rate of the constrained numerical oscillations, I i is the input feature value of the node, and O is the output value after fusion by the weighted features. The structure diagrams of the PAN and BiFPN modules are shown in Figure 6 [34].
In this paper, the BiFPN module is improved on the basis of the PAN module to accomplish the fusion of image features. The point of improvement is the addition of a skip connection operation between the input and output nodes. The pedestrian detection network first performs a 1 × 1 convolution operation and an upsample operation on the neck input to obtain the feature map. The input feature map is then multiplied with the corresponding weight values, and a summing operation is performed. Finally, the output feature map is obtained by 1 × 1 convolution and silu activation operations. The BiFPN_Add3 module is similar to BiFPN_Add2, except the input adds a feature map and an additional term in the multiplication of the weight values. After, the above operation can enhance the transmission of neck feature information between different network layers and improve the fusion efficiency.

3.3.2. Coordconv Module

To help the network better sense the position information in the feature graph, we introduce the coordconv module, which can sense spatial information. The coordconv module is an extension of the standard convolutional layer, and its role is mainly to introduce coordinate information in the standard convolutional layer. The coordconv module extracts the spatial information in the features as additional channels to be spliced with the original features, and the added channels are the i coordinate and j coordinate. Both coordinates are subjected to the relevant linear transformations and normalized to the range [−1,1]. The i   coordinate and j coordinate can effectively reflect the spatial location information in the feature, including the horizontal and vertical information of the feature edges. The coordconv module can highlight details, reduce feature loss and enhance boundary information. The standard convolution and the coordconv module are shown in Figure 7. Where h , w , and   c represent the height, width, and number of channels of input features, and h 1 , w 1 , and c 1 represent the height, width, and number of channels after the convolution.

3.4. Head: Detection

The head of the pedestrian detection network PT-YOLO is mainly responsible for generating the predicted bounding box during the detection process, as well as classifying and adjusting the position of the bounding box. Our method uses 20 × 20, 40 × 40, and 80 × 80 detection heads to detect pedestrians of different sizes. In summary, the output of the pedestrian detection network PT-YOLO can provide information such as the locations, sizes, and categories of pedestrians in the image.
The YOLOv5 network employs complete intersection over union (CIoU) [35] as the default loss function for bounding box regression. The loss function consists of three components: classification loss, confidence loss and regression loss, which primarily consider three parameters: the overlap area, center point distance and aspect ratio. c represents the diagonal distance of the minimum closure area that contains both the prediction box and the ground truth, and ρ represents the distance between the two center points of the prediction box and ground truth. The formula is as follows:
  { v = 4 π ( a r c t a n w g t h g t a r c t a n w h ) 2 α = v ( 1 I o U ) + V L o s s C I o U = 1 I O U + ρ 2 ( b , b g t ) c 2 + α v                                            
where w gt / h gt represents the aspect ratio of the real frame, and w / h represents the aspect ratio of the predicted frame. b and b g t represent the center points of the prediction box and ground truth box, respectively. The weight parameter is denoted as α , and the similarity of aspect ratios is measured using a parameter labeled as v . However, the CIoU aspect ratio describes relative values, so there is a certain ambiguity. Meanwhile, CIoU does not consider the balance of difficult and easy samples, which leads to inaccurate prediction frames and thus inaccurate or missed detection results. Therefore, in this paper, the WIoU [36] loss function with a dynamic non-monotonic focusing mechanism is introduced as a bounding box regression loss calculation to solve the sample imbalance problem. The formula is as follows:
  { L W I o U = γ e x p ( ( x x g t ) 2 + ( y y g t ) 2 ( W g 2 + H g 2 ) * ) L I o U L I o U = 1 W i H i ω h + ω g t h g t W i H i γ = β δ α β δ β = L I o U L I o U ¯ [ 0 , )
In the equation, x and y represent the horizontal and vertical coordinates of the centre of the prediction frame, and w and h represent the width and height of the prediction frame. x g t and y g t represent the horizontal and vertical coordinates of the center point of the real frame, and ω g t and h g t represent the width and height of the real frame. W g and H g are the sizes of the smallest the bounding box. W i and H i are the width and height of the area where the prediction box overlaps the real box. L I o U denotes the monotonic focusing factor, L I o U ¯ denotes the average of the degree of overlap between the target frame and the predicted frame, γ denotes the non-monotonic focusing factor, β is the outlier, and α and δ are hyper-parameters.

4. Experiments and Analysis

4.1. Experimental Detail

The pedestrian detection network PT-YOLO is deployed on a Linux server. The GPU model of the server is RTX3080 with 24 GB of memory. The experimental environment includes CUDA 11.0, Cudnn 8.0.5, PyTorch 1.8.1 versions, and Python 3.8 versions. The relevant parameter settings used for training are shown in Table 1.
We chose the JRDB dataset [37] to complete this experiment. Firstly, the JRDB dataset is preprocessed by using code to convert the .json files into the YOLO format required for this experiment. The JRDB dataset contains category information and location information. Then, the dataset is divided into a training set and a validation set in the ratio of 8:2 for this experiment.

4.2. Evaluation Metrics

In this paper, the precision rate, recall rate, and mean average precision rate are used to evaluate the indexes [34]. The formula is as follows:
  P = T P T P + F P × 100 %    
where P represents the precision rate, T P is the same number of samples of the detected target class and the actual target class, and   F P represents the target of detection error. The precision rate reflects the number of true targets predicted by the network as a percentage of all detected targets. The recall rate is calculated as follows:
  R = T P T P + F N × 100 %              
where R represents the recall rate, and F N represents the number of samples not detected. The recall rate reflects the number of real targets predicted by the model as a percentage of all real detected targets. The MAP value reflects the overall detection accuracy of the network. The formula is as follows:
  A P = 0 1 P ( R ) d R          
  M A P = i = 1 K P ( R ) d R K        
The average precision A P and the M A P are calculated with Equations (6) and (7).

4.3. Data Training

In this paper, we focus on pedestrian detection in complex scenes. So, the loss mainly includes confidence loss and regression loss, and the classification loss is not considered. The loss function results for the YOLOv5 and the pedestrian detection network PT-YOLO are shown in Figure 8.
As shown in Figure 8, the experimental results demonstrate that when the iteration count reaches 150, the YOLOv5 network achieves a stable regression loss value of around 0.0357 and a stable confidence loss value of around 0.0289. The proposed network PT-YOLO in this paper achieves a stable regression loss value of around 0.0328 and a stable confidence loss value of around 0.0259. The total loss of the PT-YOLO pedestrian detection network is 0.59% lower than that of the network YOLOv5. This shows that the PT-YOLO pedestrian detection network has better performance.
According to Table 2, since the WIoU loss function can solve the bounding box regression balancing problem between better and poorer quality samples, the pedestrian detection network PT-YOLO has a higher detection accuracy than the YOLOv5 in pedestrian detection. The precision of the pedestrian detection network PT-YOLO was improved from 93.8% to 95.2% and the average precision of [email protected] value has increased from 90.9% to 93.4%. Therefore, the pedestrian detection network PT-YOLO is effectively optimized based on the YOLOv5 network.
To improve the accuracy of the network in detecting pedestrians in scenes, an attention mechanism is added to the pedestrian detection network PT-YOLO. Different scenes attentional mechanisms have different effects on the network. Table 3 shows a comparison of the effectiveness of different attention mechanisms in this experiment.
As shown in Table 3, we introduce the currently dominant attention mechanism into the pedestrian detection network PT-YOLO for pedestrian detection. The comparison shows that the MAP values increase after adding the attention mechanism. For this experiment, the SE module was the most effective. The MAP of the network increased from 90.9% to 91.4%. Therefore, this experiment chooses to incorporate the SE module to complete the pedestrian detection task.

4.4. Ablation Experiments

To further validate the effectiveness of the pedestrian detection network PT-YOLO proposed in this paper, the following ablation experiments were designed. The training results on the dataset are shown in Table 4. The SE module focused on important features while suppressing irrelevant ones. The BiFPN module enhanced feature fusion. The WIoU loss function reduced regression errors and the coordconv module allowed the network to better perceive the location information in the feature map.
As shown in Table 4, we found that with the addition of the SE module, the MAP and precision of the PT-YOLO pedestrian detection network have been improved compared to the benchmark network YOLOv5. The experiments show that the SE module can make the pedestrian detection network pay more attention to the important features and suppress the unimportant features, which in turn improves the feature extraction capability of the pedestrian detection network. In this paper, the MAP is further improved after improving the neck network to the BiFPN module. The experiments show that the network strengthens the feature fusion precision of the pedestrian detection and improves the precision of pedestrian detection by using the BiFPN module. The optimization of the loss function reduces the regression loss of the network and at the same time improves the MAP of the network. The coordconv module is added to the neck to enable the network to accurately localize the pedestrian’s position.
In summary, the pedestrian detection network PT-YOLO proposed in this paper combined the SE module, the BiFPN module, the coordconv module, and the WIoU loss function to improve the detection effect of the network, and the precision, recall, and MAP of the detection results were 95.2%, 85.2% and 93.4%.
Figure 9 shows the training results of each round. The horizontal axis represents the number of training iterations, while the vertical axis represents the MAP at an IoU threshold of 0.5 and IoU thresholds ranging from 0.5 to 0.95 with a step size of 0.05. Different colored curves represent different networks.
In a word, compared to the benchmark network or using specific modules alone, the pedestrian detection network PT-YOLO demonstrates improved performance in pedestrian detection across various scenes. The precision has increased from 93.8% to 95.2%, the recall has improved from 81.2% to 85.2%, and the MAP has risen from 90.9% to 93.4%. Additionally, the loss function has decreased from 0.064 to 0.054. Therefore, the pedestrian detection network PT-YOLO proposed in this paper has a better detection effect in pedestrian detection.
As shown in Figure 10, we present the test results of the benchmark network YOLOv5, and the PT-YOLO pedestrian detection network proposed in this paper. The left image is the original image, the middle image is the YOLOv5 detection result, and the right image is the PT-YOLO detection result.
As shown in Figure 10, pedestrians in different scenes are visualized using the YOLOv5 network and pedestrian detection network PT-YOLO. The detection results (a) demonstrate that when the distance between pedestrians is relatively large and the target size is small, the detection performance of the pedestrian detection network PT-YOLO surpasses that of the YOLOv5 network. The detection result in (b) shows that when the scenes are more complex, false detection may occur. From the detection result in (b), it can be seen that the YOLOv5 network detects the pedestrian at the corner of the building incorrectly, while the PT-YOLO pedestrian detection network can detect it correctly. Detection result (c) shows that the pedestrian detection network PT-YOLO is capable of accurate detection in crowded and complex scenes. Therefore, it is verified by the visualization results that the pedestrian detection network PT-YOLO can accomplish pedestrian detection more accurately.
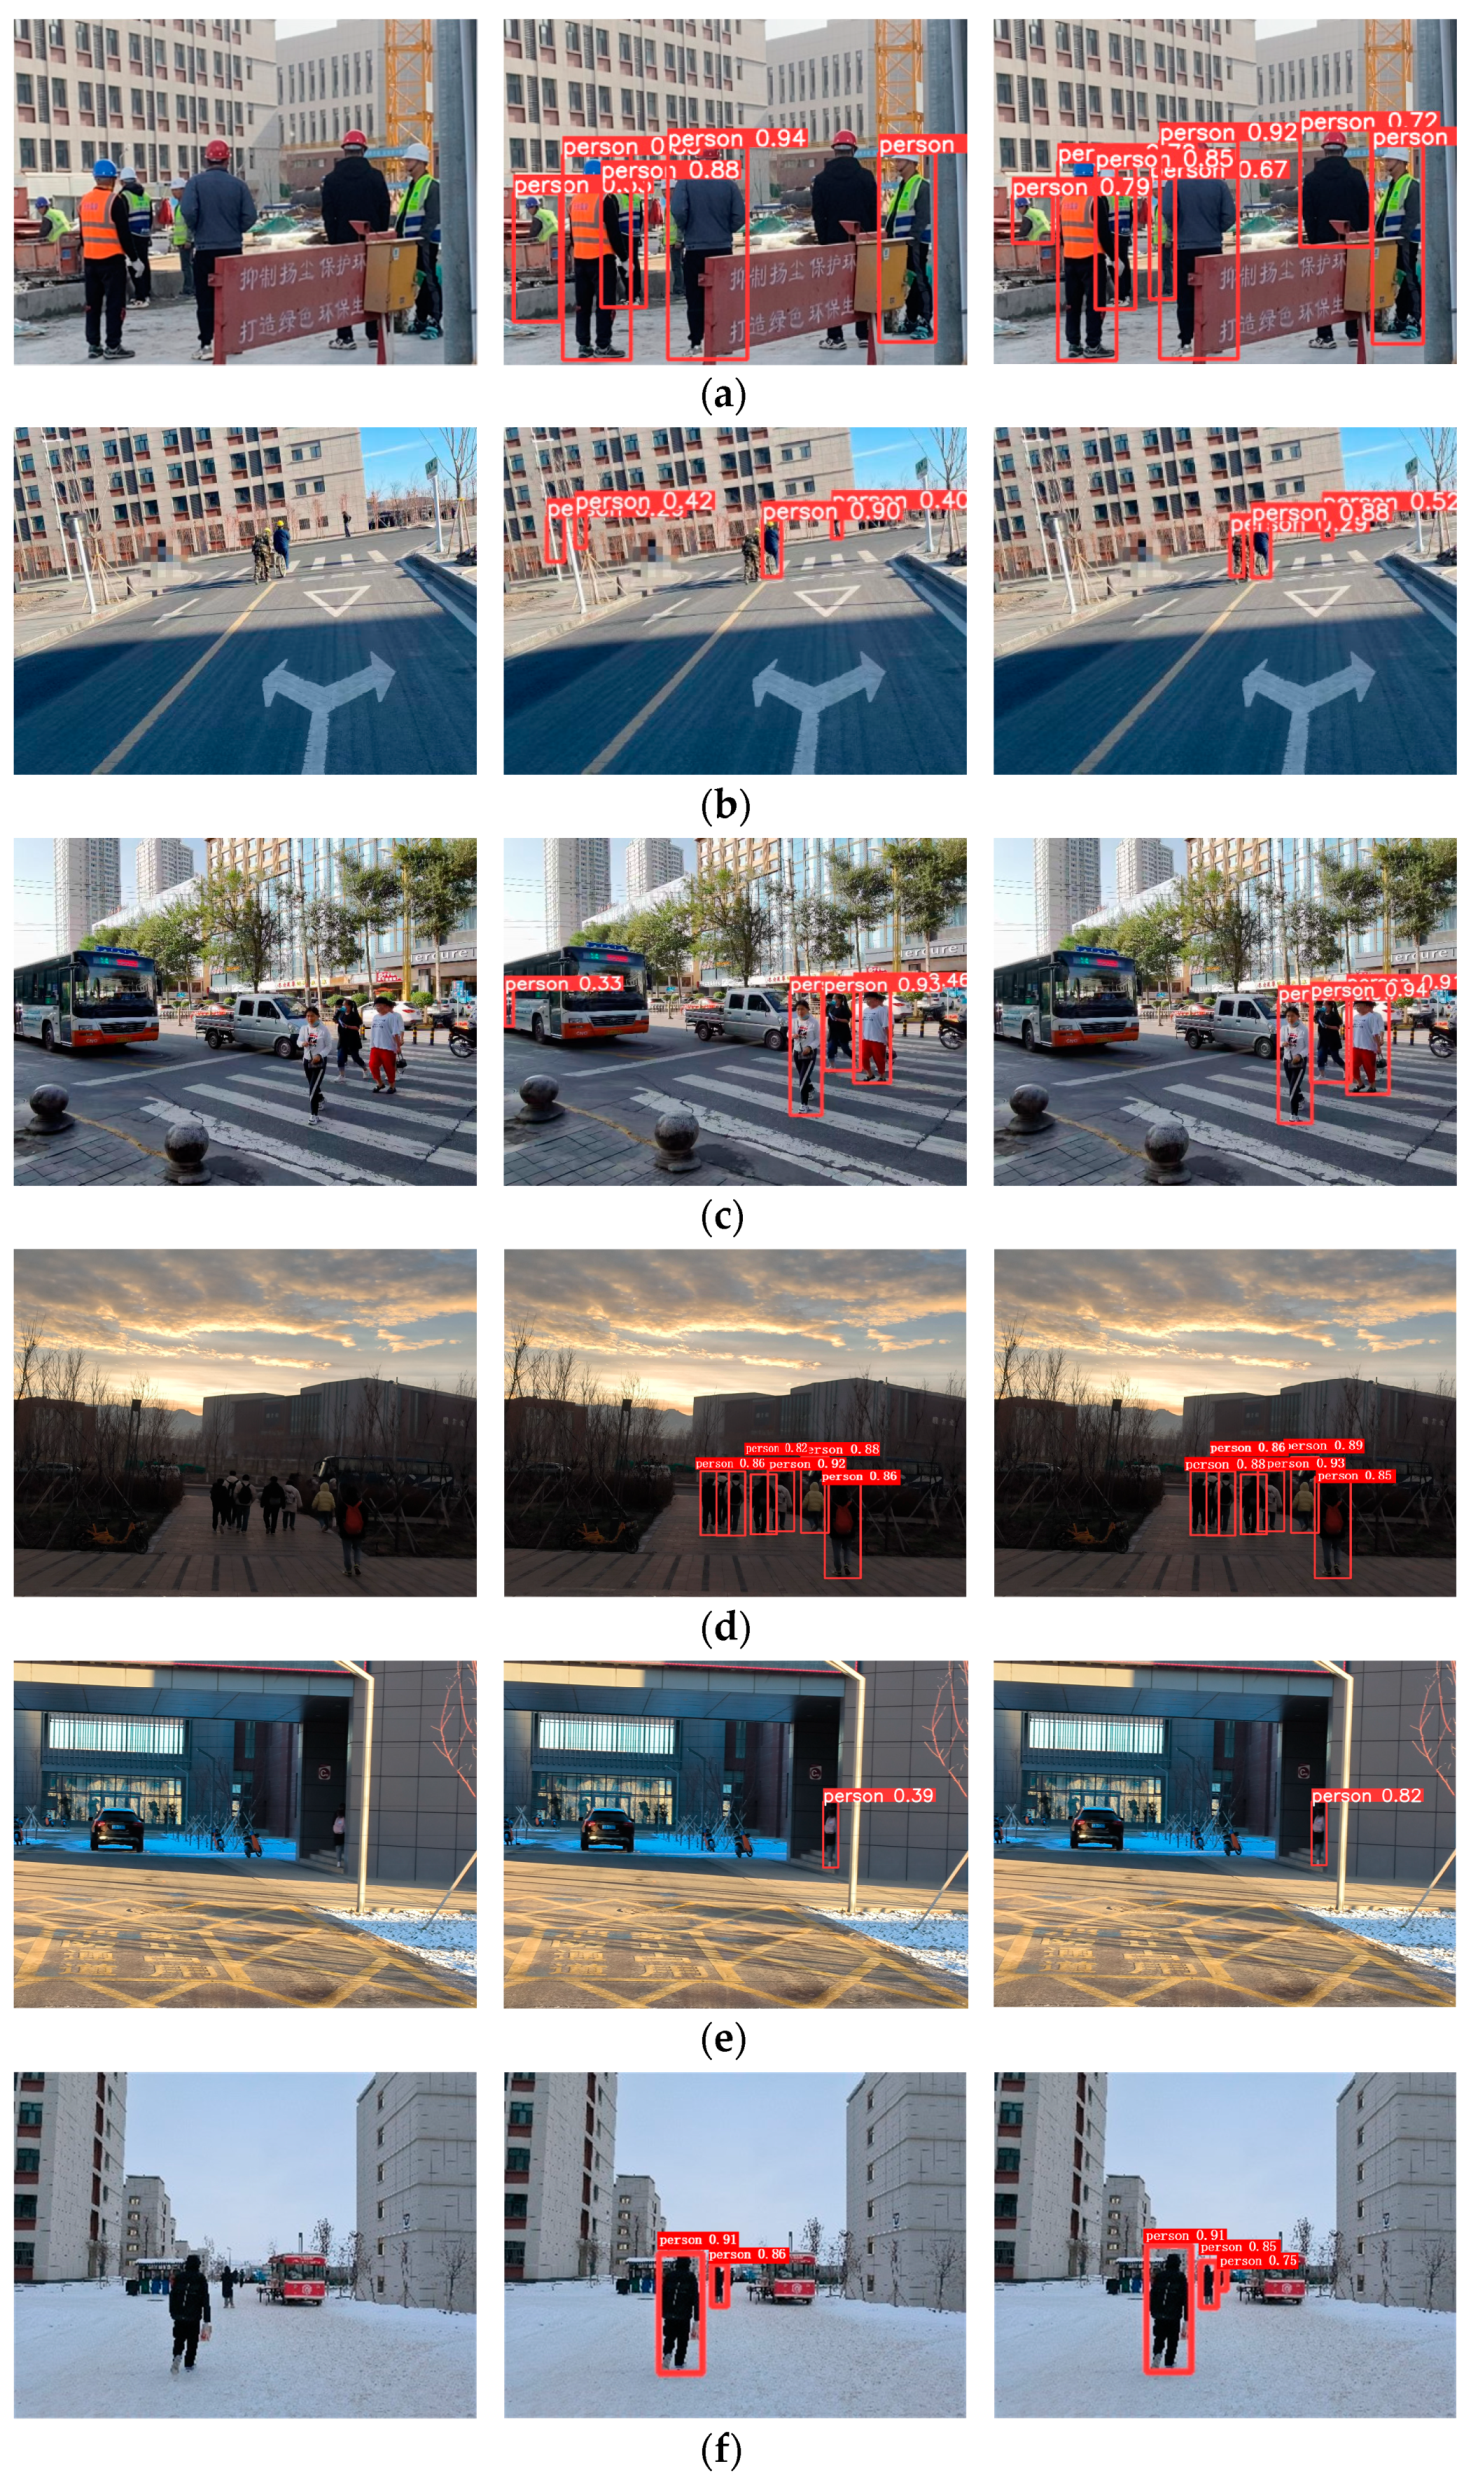
In this paper, the public dataset JRDB was chosen as the dataset for this experiment. The JRDB dataset is a dataset specifically set up for pedestrian detection and tracking, therefore contains large-scale pedestrian scenes. This experiment was completed by using 8434 images from the dataset as the training set and 2109 images as the testing set to obtain the experimental results. Because JRDB is an open dataset, the experiments were conducted using publicly available images during training. Moreover, the location of the experiment cannot be chosen. To integrate proposed the pedestrian detection network PT-YOLO with real-life situations, we validated it by collecting real-life data. Due to the large number of people in the school, the network can collect pedestrians at different scenes at different times, which can meet our requirements for experimental data collection. Therefore, the experimental data were collected on the campus of Xinjiang University. More than 100 photos were taken during the data collection process. Each photo was then processed and filtered. Finally, we chose the photographs where the target pedestrians were occluded or where the pedestrians were smaller as the data for this experiment to complete the validation of the problem to be solved. The experimental results are shown in Figure 11. The left side is the original image, the center is the YOLOv5 network detection result, and the right side is the pedestrian detection network PT-YOLO result. Also, the results show that the pedestrian detection network PT-YOLO can accomplish the pedestrian detection task more accurately.

4.5. Comparison Experiments

In order to verify the detection performance and effectiveness of the pedestrian detection network PT-YOLO proposed in this paper, we compare the detection results of the network PT-YOLO with those of other mainstream networks. In this paper, the Faster R-CNN network, SSD network, YOLOv3 network, YOLOv7 network and YOLOv8 network were chosen to complete the comparison experiment. The experimental results are shown in Table 5.
The experiments demonstrate that the pedestrian detection network PT-YOLO exhibits superior overall performance compared to other object detection algorithms. The PT-YOLO pedestrian detection network achieves the highest MAP and the lowest loss. However, the detection accuracy of the SSD network is slightly higher than that of the pedestrian detection network PT-YOLO, and the analysis reveals that the SSD network uses several feature maps at different scales for pedestrian detection. The SSD network predicts the location and category of the target on the feature map at different levels so that it can better adapt to the different sizes of the target. In contrast, the pedestrian detection network PT-YOLO uses single-scale feature mapping, which may limit its detection performance for small or large objects. Because the YOLOv7 network uses more convolutional layers, the YOLOv7 network achieves better results in detection precision and recall, but it has higher losses and flops. We found that the YOLOv8 network also has good detection but with larger parameters. A comparison of the experimental results revealed that our proposed method is optimal. The network PT-YOLO can obtain accurate detection results with low complexity.

5. Conclusions

In this paper, we propose a new pedestrian detection network PT-YOLO, which aims to improve the accuracy of pedestrian detection in different scenes. The pedestrian detection network PT-YOLO introduces SE modules in the backbone to enhance the feature extraction capability of the network. The BiFPN module is introduced in the neck to enhance the fusion efficiency of different features at different scales. The WIoU loss function is used to reduce the regression error and improve the performance of the pedestrian detection network. Finally, the coordconv module is added to the neck to enable the network to accurately localize the pedestrian’s position. The experiments show that the pedestrian detection network PT-YOLO outperforms other mainstream networks in pedestrian detection. Its detection precision reached 95.2%, and the MAP reached 93.4%, which can effectively complete the pedestrian detection task in various scenes and achieve ideal detection results. In the future, this detection network will be further studied in pedestrian tracking.

Author Contributions

Conceptualization, J.S., Y.A., and K.Z.; methodology, J.S., Y.A., and J.W.; software, J.S.; validation, J.S. and K.Z.; formal analysis, J.W.; data curation, K.Z. and J.W.; writing—original draft preparation, J.S.; writing—review and editing, Y.A.; visualization, J.W.; supervision, Y.A.; project administration, Y.A. All authors have read and agreed to the published version of the manuscript.

Funding

This work was supported in part by the National Natural Science Foundation of China under grants 62173055 and 61673083, in part by the Natural Science Foundation of Liaoning Province under grant 2023-MS-093, and in part by the Science and Technology Major Project of Shanxi Province under grant 20191101014.

Data Availability Statement

All data used to support the findings of this study are included within the article.

Acknowledgments

The authors gratefully appreciate the anonymous reviewers for their valuable comments.

Conflicts of Interest

The authors declare no conflicts of interest.

References

  1. Ji, Q.; Yu, H.; Wu, X. Hierarchical-Matching-Based Online and Real-Time Multi-Object Tracking with Deep Appearance Features. Algorithms 2020, 13, 80. [Google Scholar] [CrossRef]
  2. Hu, W.; Xiao, X.; Xie, D.; Tan, T. Traffic accident prediction using 3-D model-based vehicle tracking. IEEE Trans. Veh. Technol. 2004, 53, 677–694. [Google Scholar] [CrossRef]
  3. Yang, H.; Shao, L.; Zheng, F.; Wang, L. Recent advances and trends in visual tracking: A review. Neurocomputing 2011, 74, 3823–3831. [Google Scholar] [CrossRef]
  4. Zotov, M.; Anzhiganov, D.; Kryazhenkov, A.; Barghini, D.; Battisti, M.; Belov, A.; Bertaina, M.; Bianciotto, M.; Bisconti, F.; Blaksley, C.; et al. Neural Network Based Approach to Recognition of Meteor Tracks in the Mini-EUSO Telescope Data. Algorithms 2023, 16, 448. [Google Scholar] [CrossRef]
  5. Zhang, L.; Xiong, N.; Pan, X.; Yue, X.; Wu, P.; Guo, C. Improved Object Detection Method Utilizing YOLOv7-Tiny for Unmanned Aerial Vehicle Photographic Imagery. Algorithms 2023, 16, 520. [Google Scholar] [CrossRef]
  6. Qu, H.; Wang, M.; Zhang, C.; Wei, Y. A Study on Faster R-CNN-Based Subway Pedestrian Detection with ACE Enhance-ment. Algorithms 2018, 11, 192. [Google Scholar] [CrossRef]
  7. Ghari, B.; Tourani, A.; Shahbahrami, A. A Robust Pedestrian Detection Approach for Autonomous Vehicles. In Proceedings of the 2022 8th Iranian Conference on Signal Processing and Intelligent Systems (ICSPIS), Mazandaran, Iran, 28–29 December 2022; pp. 1–5. [Google Scholar]
  8. Liu, L.; Ke, C.; Lin, H.; Xu, H. Research on pedestrian detection algorithm based on MobileNet-YoLo. Comput. Intell. Neurosci. 2022, 2022, 1–12. [Google Scholar] [CrossRef] [PubMed]
  9. Esfandiari, N.; Bastanfard, A. Improving accuracy of pedestrian detection using convolutional neural networks. In Proceedings of the 2020 6th Iranian Conference on Signal Processing and Intelligent Systems (ICSPIS), Mashhad, Iran, 23–24 December 2020; pp. 1–6. [Google Scholar]
  10. Zhang, Y.; Zhu, Q. Neural Network-Enhanced Fault Diagnosis of Robot Joints. Algorithms 2023, 16, 489. [Google Scholar] [CrossRef]
  11. Dalal, N.; Triggs, B. Histograms of oriented gradients for human detection. In Proceedings of the 2005 IEEE Computer Society Conference on Computer Vision and Pattern Recognition, San Diego, CA, USA, 20–25 June 2005; Volume 1, pp. 886–893. [Google Scholar]
  12. Chen, W.; Zhu, Y.; Tian, Z.; Zhang, F.; Yao, M. Occlusion and multi-scale pedestrian detection A review. Array 2023, 19, 100318. [Google Scholar]
  13. Ren, S.; He, K.; Girshick, R.; Sun, J. Faster r-cnn: Towards real-time object detection with region proposal networks. In Proceedings of the Advances in Neural Information Processing Systems 28 (NIPS 2015), Montreal, QC, Canada, 7–12 December 2015. [Google Scholar]
  14. Redmon, J.; Divvala, S.; Girshick, R.; Farhadi, A. You Only Look Once: Unified, Real-Time Object Detection. In Proceedings of the Conference on Computer Vision and Pattern Recognition, Las Vegas, NV, USA, 27–30 June 2016; pp. 779–788. [Google Scholar]
  15. Mita, T.; Kaneko, T.; Hori, O. Joint haar-like features for face detection. In Proceedings of the Tenth IEEE International Conference on Computer Vision, Beijing, China, 17–21 October 2005; Volume 2, pp. 1619–1626. [Google Scholar]
  16. Felzenszwalb, P.F.; Girshick, R.B.; McAllester, D.; Ramanan, D. Object detection with discriminatively trained part-based models. IEEE Trans. Pattern Anal. Aachine Intell. 2009, 32, 1627–1645. [Google Scholar] [CrossRef] [PubMed]
  17. Wang, X.; Han, T.X.; Yan, S. An HOG-LBP human detector with partial occlusion handling. In Proceedings of the International Conference on Computer Vision, Kyoto, Japan, 29 September–2 October 2009; pp. 32–39. [Google Scholar]
  18. Chen, P.H.; Lin, C.J.; Schölkopf, B. A tutorial on ν-support vector machines. Appl. Stoch. Models Bus. Ind. 2005, 21, 111–136. [Google Scholar]
  19. Freund, Y.; Schapire, R.E. A decision-theoretic generalization of on-line learning and an application to boosting. J. Comput. Syst. Sciences 1997, 55, 119–139. [Google Scholar]
  20. Uijlings, J.R.; Van De Sande, K.E.; Gevers, T. Selective search for object recognition. Int. J. Comput. Vis. 2013, 104, 154–171. [Google Scholar]
  21. Vedaldi, A.; Gulshan, V.; Varma, M.; Zisserman, A. Multiple kernels for object detection. In Proceedings of the International Conference on Computer Vision, Kyoto, Japan, 29 September–2 October 2009; pp. 606–613. [Google Scholar]
  22. Yu, Y.; Zhang, J.; Huang, Y.; Zheng, S.; Ren, W.; Wang, C. Object Detection by Context and Boosted HOG-LBP. In Proceedings of the ECCV Workshop on PASCAL VOC, Crete, Greece, 11 September 2010. [Google Scholar]
  23. Liu, T.; Cheng, J.; Yang, M.; Du, X.; Luo, X.; Zhang, L. Pedestrian detection method based on self-learning. In Proceedings of the 2019 IEEE 4th Advanced Information Technology, Electronic and Automation Control Conference (IAEAC), Chengdu China, 20–22 December 2019; Volume 1, pp. 2161–2165. [Google Scholar]
  24. Girshick, R. Fast r-cnn. In Proceedings of the IEEE International Conference on Computer Vision, Santiago, Chile, 7–13 December 2015; pp. 1440–1448. [Google Scholar]
  25. Gong, H.; Li, H.; Xu, K.; Zhang, Y. Object detection based on improved YOLOv3-tiny. In Proceedings of the 2019 Chinese Automation Congress (CAC), Hangzhou, China, 22–24 November 2019; pp. 3240–3245. [Google Scholar] [CrossRef]
  26. Woo, S.; Park, J.; Lee, J.Y.; Kweon, I.S. Cbam: Convolutional block attention module. In Proceedings of the European Conference on Computer Vision, Munich, Germany, 8–14 September 2018; pp. 3–19. [Google Scholar]
  27. Hu, J.; Shen, L.; Sun, G. Squeeze-and-excitation networks. In Proceedings of the IEEE Conference on Computer Vision and Pattern Recognition, Salt Lake City, UT, USA, 18–23 June 2018; pp. 7132–7141. [Google Scholar]
  28. Liu, Z.; Hu, H.; Lin, Y. Swin transformer v2: Scaling up capacity and resolution. In Proceedings of the Conference on Computer Vision and Pattern Recognition, New Orleans, LA, USA, 18–24 June 2022; pp. 12009–12019. [Google Scholar]
  29. Chen, Y.; Lin, W.; Yuan, X. CA-YOLOv5 for crowded pedestrian detection. Comput. Eng. Appl. 2022, 58, 238–245. [Google Scholar]
  30. Xu, Z.; Pan, S.; Ma, X. A Pedestrian Detection Method Based on Small Sample Data Set. In Proceedings of the 2023 IEEE International Conference on Image Processing and Computer Applications (ICIPCA), Kuala, Lumpur, 8–11 October 2023; pp. 669–674. [Google Scholar]
  31. Chen, H.; Guo, X. Multi-scale feature fusion pedestrian detection algorithm based on Transformer. In Proceedings of the 2023 4th International Conference on Computer Vision, Image and Deep Learning (CVIDL), Zhuhai, China, 12–14 May 2023; pp. 536–540. [Google Scholar]
  32. Murthy, J.S.; Siddesh, G.M.; Lai, W.C.; Hemalatha, K.L. Object detect: A real-time object detection framework for advanced driver assistant systems using yolov5. Wirel. Commun. Mob. Comput. 2022, 2022, 1–10. [Google Scholar] [CrossRef]
  33. Chen, J.; Mai, H.; Luo, L.; Chen, X.; Wu, K. Effective feature fusion network in BIFPN for small object detection. In Proceedings of the 2021 IEEE International Conference on Image Processing, Anchorage, AK, USA, 19–22 September 2021; pp. 699–703. [Google Scholar]
  34. Lin, M.; Wang, Z.; Huang, L. Analysis and Research on YOLOv5s Vehicle Detection with CA and BiFPN Fusion. In Proceedings of the 2022 IEEE 4th Eurasia Conference on IOT, Communication and Engineering, Yunlin, Taiwan, 28-30 October 2022; pp. 201–205. [Google Scholar]
  35. Zheng, Z.; Wang, P.; Ren, D. Enhancing geometric factors in model learning and inference for object detection and instance segmentation. IEEE Trans. Cybern. 2021, 52, 8574–8586. [Google Scholar] [CrossRef] [PubMed]
  36. Tong, Z.; Chen, Y.; Xu, Z.; Yu, R. Wise-IoU: Bounding Box Regression Loss with Dynamic Focusing Mechanism. arXiv 2023, arXiv:2301.10051. [Google Scholar]
  37. Martín-Martín, R.; Patel, M.; Rezatofighi, H.; Shenoi, A.; Gwak, J.; Frankel, E.; Sadeghian, A.; Savarese, S. Jrdb: A dataset and benchmark of egocentric robot visual perception of humans in built environments. IEEE Trans. Pattern Anal. Mach. Intell. 2021, 45, 6748–6765. [Google Scholar] [CrossRef] [PubMed]
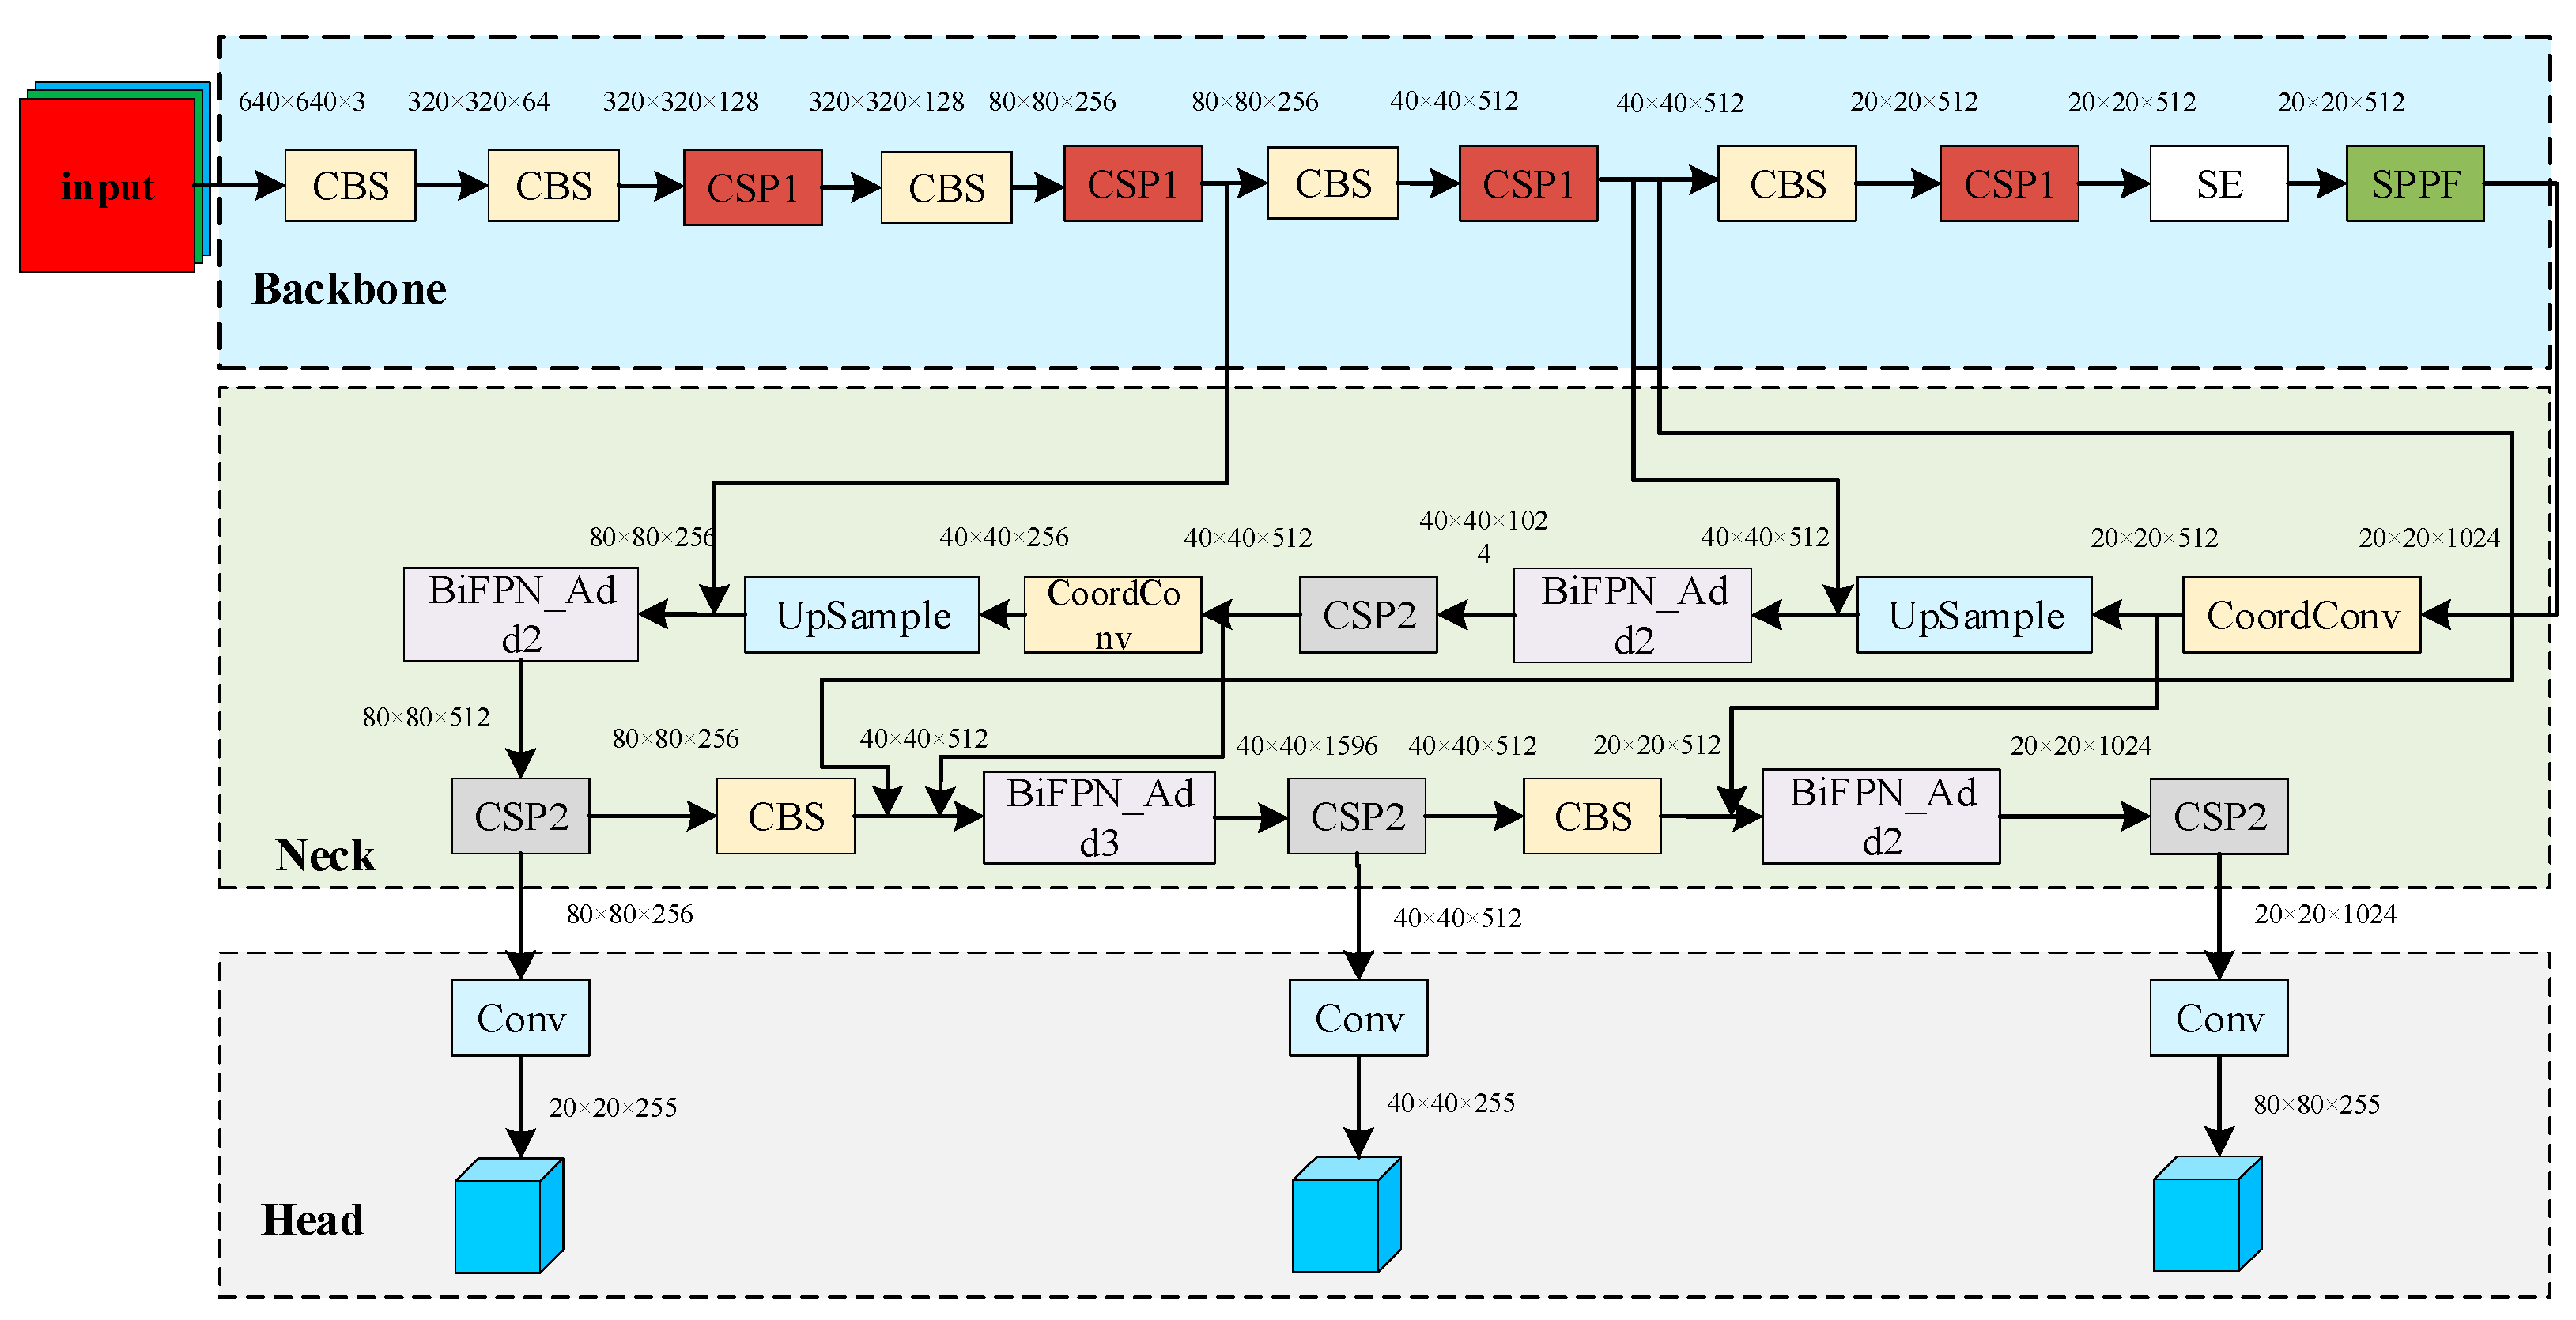
Figure 1. PT-YOLO network structure.
Algorithms 17 00039 g001
Figure 2. Structure of the CBS module.
Algorithms 17 00039 g002
Figure 3. Structure of the CSP module.
Algorithms 17 00039 g003
Figure 4. Structure of the SE module.
Algorithms 17 00039 g004
Figure 5. Structure of the SPPF module.
Algorithms 17 00039 g005
Figure 6. Structure of the modules. (a) PAN module; (b) BiFPN module.
Algorithms 17 00039 g006
Figure 7. Structure of the modules. (a) standard convolutional module; (b) coordconv module.
Algorithms 17 00039 g007
Figure 8. Different network loss functions. (a) box_loss of the YOLOv5; (b) obj_loss of the YOLOv5; (c) box_loss of the PT-YOLO; (d) obj_loss of the PT-YOLO.
Algorithms 17 00039 g008
Figure 9. Comparison of the ablation experiment MAP @0.5 and MAP @0.5_0.95.
Algorithms 17 00039 g009
Figure 10. Pedestrian detection results in the dataset. (a) Small object; (b) False drop; (c) Personnel intensive.
Algorithms 17 00039 g010
Figure 11. Pedestrian detection results in actual scenes. (a) scene 1; (b) scene 2; (c) scene 3; (d) scene 4; (e) scene 5; (f) scene 6.
Algorithms 17 00039 g011
Table 1. Training parameters.
Parameter NameParameter Value
Batchsize40
Epochs150
Momentum0.9370
Learning_rate0.0100
Weight_decay0.0005
Table 2. Comparison of loss function results.
ModelsLoss Function TypesResults
MAP0.5%MAP0.5–0.95%Precision%
YOLOv5CIoU90.967.493.8
YOLOv5WIoU91.667.794.4
PT-YOLOWIoU93.472.895.2
Table 3. Results of different attention mechanisms on the module.
ModelsPrecision%Recall%[email protected]%[email protected]–0.95%
YOLOv593.881.290.967.4
YOLOv5 + Swin_Transformer93.881.191.468.1
YOLOv5 + CBAM94.281.991.469.0
YOLOv5 + CA94.480.790.967.6
YOLOv5 + SE94.481.291.470.4
Table 4. Comparison of ablation experiments.
ModelsPrecision%Recall%Loss[email protected]%[email protected]–0.95%
YOLOv593.881.20.06490.967.4
YOLOv5 + SE94.481.20.06491.470.4
YOLOv5 + SE + BiFPN94.483.10.06092.270.0
YOLOv5 + SE + BiFPN + WIoU95.283.10.05593.072.2
PT-YOLO (YOLOv5 + SE + BiFPN + WIoU + coordconv)95.285.20.05493.472.8
Table 5. Comparison of the mainstream detection network.
ModelsPrecision%Recall%MAP@ MAP 0.5LossParametersFlops
Faster R-CNN39.9472.9365.140.6269,988,75626.7
SSD95.6143.6368.141.6487,987,02116.2
YOLOv393.8082.2092.000.0619,308,90223.4
YOLOv593.8082.0090.930.0637,022,32615.9
YOLOv794.2085.1092.100.07737,196,556105.1
YOLOv894.9085.1092.300.06711,097,85328.7
PT-YOLO95.2085.2093.400.05410,810,49522.7
Disclaimer/Publisher’s Note: The statements, opinions and data contained in all publications are solely those of the individual author(s) and contributor(s) and not of MDPI and/or the editor(s). MDPI and/or the editor(s) disclaim responsibility for any injury to people or property resulting from any ideas, methods, instructions or products referred to in the content.