Article

Advancing Pulmonary Nodule Diagnosis by Integrating Engineered and Deep Features Extracted from CT Scans

1
Computer Science and Engineering Department, University of Louisville, Louisville, KY 40208, USA
2
Mathematics and Computer Science Department, Louisiana State University of Alexandria, Alexandria, LA 71302, USA
*
Author to whom correspondence should be addressed.
These authors contributed equally to this work.
Algorithms 2024, 17(4), 161; https://doi.org/10.3390/a17040161
Submission received: 21 March 2024 / Revised: 15 April 2024 / Accepted: 16 April 2024 / Published: 18 April 2024
(This article belongs to the Special Issue Algorithms for Computer Aided Diagnosis)

Abstract

:
Enhancing lung cancer diagnosis requires precise early detection methods. This study introduces an automated diagnostic system leveraging computed tomography (CT) scans for early lung cancer identification. The main approach is the integration of three distinct feature analyses: the novel 3D-Local Octal Pattern (LOP) descriptor for texture analysis, the 3D-Convolutional Neural Network (CNN) for extracting deep features, and geometric feature analysis to characterize pulmonary nodules. The 3D-LOP method innovatively captures nodule texture by analyzing the orientation and magnitude of voxel relationships, enabling the distinction of discriminative features. Simultaneously, the 3D-CNN extracts deep features from raw CT scans, providing comprehensive insights into nodule characteristics. Geometric features and assessing nodule shape further augment this analysis, offering a holistic view of potential malignancies. By amalgamating these analyses, our system employs a probability-based linear classifier to deliver a final diagnostic output. Validated on 822 Lung Image Database Consortium (LIDC) cases, the system’s performance was exceptional, with measures of 97.84 % , 98.11 % , 94.73 % , and 0.9912 for accuracy, sensitivity, specificity, and Area Under the ROC Curve (AUC), respectively. These results highlight the system’s potential as a significant advancement in clinical diagnostics, offering a reliable, non-invasive tool for lung cancer detection that promises to improve patient outcomes through early diagnosis.

1. Introduction

In men, lung cancer follows prostate cancer as the second most prevalent type, constituting 12 % of anticipated new cases. Similarly, among women, it ranks as the second most frequent cancer type after breast cancer, accounting for 13 % of projected cases. Lung cancer presently stands as the primary cause of cancer-related fatalities in the USA, contributing to 21 % of deaths from cancer among both genders in 2023 [1] and claims about as many lives each year than pancreatic, breast, and prostate cancer combined [1].
Low Dose Computed Tomography (LDCT) has significantly improved lung cancer diagnosis accuracy, leading to a roughly 20 % reduction in mortality rates [2]. However, the widespread adoption of this screening method poses a substantial challenge to healthcare professionals due to the abundant volume of data generated from CT scans, necessitating exhaustive analysis.
Furthermore, lung nodules often present similarities in shape and texture, irrespective of their benign or malignant nature, complicating the classification process and prolonging it. In response to the need to mitigate the cost, time, and risks associated with invasive treatments, automated Computer-Aided Diagnosis (CAD) systems have been proposed [3,4]. Raza et al. [5] suggested a new method to predict lung cancer called Lung-EffNet. Lung-EffNet is structured using EfficientNet as a base which was changed by adding layers on top to help improve the classification results. Lung-EffNet was tested using five different versions of EfficientNet (B0 to B4) on an open source dataset called the Iraq-Oncology Teaching Hospital/National Center for Cancer Diseases (IQ-OTH/NCCD) that has information about lung cancer patients, whether they have benign nodules, malignant nodules, or normal nodules. To make sure the results are fair, the data imbalance problem was fixed by using different methods of data augmentation. Thakur et al. [6] used CapsNet which is a supervised deep-learning model that is intended to mimic humans to find lung cancer nodules. Then, they used a pre-trained FixEfficientNet to decide if CT images show cancer or not. They trained these methods using the LUng Nodule Analysis 2016 (LUNA-16) and the Lung Image Database Consortium and Image Database Resource Initiative (LIDC-IDRI) open-source datasets and tested them out on different sets of these datasets. Shafi et al. [7] developed a CAD system that can find both normal and abnormal changes in lung cancer tissues in cross-sectional views. First, the authors aimed to teach the model to recognize lung cancer by comparing certain features in CT images from both patients with lung cancer and those without. Then, they tested the model on new CT scans from both groups that the framework had not seen before. The algorithm was validated on 888 CT scans from the LIDC-IDRI database that have been marked by experts.
Tehnan et al. [8] introduced a combination of a hybrid metaheuristic and Convolutional Neural Network (CNN) algorithm. Firstly, they created a CNN structure and then calculated its solution vector. This vector was then given to the Ebola Optimization Search Algorithm (EOSA) to find the best weights and biases for training the CNN to solve classification problems. Dodia et al. [9] proposed a Bi-level Lung Cancer Classification System on CT Scans. They introduced a new preprocessing technique called Boosted Bilateral Histogram Equalization (BBHE) that they applied prior to inputting the scans into the neural networks. For Level-1 classification, which distinguishes between nodules versus non-nodules, they introduced a Cauchy Black Widow Optimization-based CNN (CBWO-CNN). The weight updating in the CBWO-CNN employs Cauchy mutation to minimize the error rate, consequently enhancing accuracy while reducing computation time. For Level-2 classification, which distinguishes between benign and malignant nodules, they proposed a hybrid CNN model with shared parameters. This model, named SE-Xception combines the Squeeze-and-Excitation Network (SE-Net) with Xception. The weight parameters of the SE-Xception model are shared with the CBWO-CNN. Xu et al. [10] trained a You Only Look Once version 3 (YOLOv3) network with multi-layer feature fusion on a publicly available dataset to identify lung nodules. Subsequently, a CNN underwent training to distinguish between benign and malignant pulmonary nodules. Adopting the concept of ensemble learning, the combined confidence probabilities of the aforementioned models and the labels within the training dataset were utilized as data features to construct a Logistic regression model. The authors tested their method on two separate test datasets (one public and one private), and the combined confidence probabilities outputted by the two models were amalgamated into the established logistic regression model to ascertain the nature of benign and malignant pulmonary nodules. The YOLOv3 network was trained to detect chest CT images within the test set. The author in [11] suggested utilizing augmentation techniques to enhance the precision of a CNN. Her method involved manipulating existing training data through transformations like scaling, contrast adjustments, and rotation to identify suitable training samples.
Bishnoi et al. [12] proposed a machine-learning technique to categorize lung images obtained from CT scans. They proposed two innovative characteristics: Gabor energy and Gabor entropy, alongside five grey-level co-occurrence matrix (GLCM) features. They stated that the Gabor energy and Gabor entropy attributes are unique and contribute to enhancing the performance of the classification system, resulting in improved accuracy. Damanyati et al. [13] proposed to use CNN and DenseNet methodologies to assist in identifying and categorizing lung cancer, as both methods have been proven effective in pattern recognition and medical imaging across different domains. The study utilized the radiology images of lung cancer patients to compile a dataset of medical lung images.
Vaiyapuri et al. [14] introduced a computer-aided diagnosis framework, titled CSO-CADLCC, for the classification of lung cancer. To begin, the CSO-CADLCC method undergoes an initial data preprocessing phase utilizing a Gabor filtering-based technique for noise removal. Subsequently, feature extraction from the processed images was carried out using the NASNetLarge model. This step was succeeded by the application of the CSO algorithm combined with a weighted extreme learning machine (WELM) model for lung nodules classification. Finally, the CSO algorithm was employed to fine-tune the parameters of the WELM model, resulting in enhanced classification performance. The experimental validation of the CSO-CADLCC framework was conducted using the Early Lung Cancer Action Program (ELCAP) Public Lung Image Database.
Yadlapalli et al. [15] proposed some transfer learning methods to intelligently classify lung nodules. Various CNN architectures (including MobileNet, DenseNet169, Visual Geometry Group network with 16 layers (VGG16), and Visual Geometry Group network with 19 layers (VGG19)) were used to configure the input and output layers of a dataset consisting of chest CT scan images. The dataset comprises normal chest CT scans alongside images from two types of lung cancer, namely squamous and adenocarcinoma.
Guo et al. [16] proposed an approach named Segmentation Attention Asymmetric Convolution Network (SAACNet) coupled with a Gradient Boosting Machine (GBM). Firstly, SAACNet incorporates Asymmetric Convolution (AC) to enhance feature extraction and robustness against object transformations, thereby boosting network performance. Secondly, the segmentation Attention Asymmetric Convolution (SAAC) block effectively captures the detailed multiscale spatial information while dynamically recalibrating attention weights across channels. Thirdly, GBM integrates nodule size, cropped nodule pixels, and depth features acquired by SAACNet to enhance the overall predictive accuracy. The authors conducted experiments using the LUNA16 dataset to validate the proposed methodology.
Wu et al. [17] developed a framework, termed Visual Attention Driven Self-Supervised Transfer Learning (VAD-STL) to distinguish between benign and malignant nodules in chest CT scans. This proposed framework suggests utilizing the entire nodule volumes as inputs to extract distinctive features, deviating from conventional methods that rely on 2D image-based transfer learning or building 3D models from scratch. In contrast to employing a single attention mechanism, the VAD-STL architecture incorporates a Multi-View Aggregative Attention (MVAA) module which recalibrates feature maps from multiple perspectives enhancing the resilience against background interference. The authors tested their algorithm on a newly constructed dataset named CQUCH-LND along with the public LIDC-IDRI dataset. Qiao et al. [18] proposed an ensemble learning method named Fuse-Long Short-Term Memory-Convolutional Neural Network (F-LSTM-CNN). Their approach combines visual attributes and deep features to distinguish between benign and malignant nodules. Initially, clinical data are used to derive attribute features, while deep features are extracted from the preprocessed CT images of the nodules. The Fuse-Convolutional Neural Network (F-CNN) model is then introduced to emphasize the importance of attributes in the classification process, integrating deep and attribute features via transposed convolution. Simultaneously, the Fuse-Long Short-Term Memory (F-LSTM) model is introduced to focus on specific deep features for classification utilizing affine transformation of attribute features. Subsequently, the early detection of malignant lung nodules is achieved by merging prediction scores from both F-LSTM and F-CNN models. The effectiveness of this approach was evaluated using the LIDC-IDRI public lung nodule dataset.
Within the current body of research surrounding CAD systems, numerous shortcomings have been highlighted: Firstly, some systems overlook the integration of morphological features, depending entirely on raw data for analysis. Secondly, there is a reliance on basic geometric attributes by certain models, which may lead to errors due to segmentation inconsistencies. Furthermore, a portion of these systems do not account for the voxel spatial interconnections, relying only on Hounsfield unit values to depict visual characteristics.
In response to the challenges and limitations observed in existing systems, our approach seeks to harness the strengths of both engineered and deep learning features. We introduce a novel technique, the 3D-Local Octal Pattern (LOP), designed to capture and analyze the complex three-dimensional relationships among nodule voxels. In addition, we utilize a 3D-CNN for deep feature extraction directly from pulmonary nodules. The classification probabilities obtained from these two types of features, alongside geometric attributes of the nodules, are integrated and processed through a softmax classifier. This comprehensive methodology culminates in the accurate final diagnosis of pulmonary nodules.

2. Materials and Methods

We present a novel, noninvasive methodology designed to classify lung nodules by integrating engineered and deep-learning-derived features, facilitating the accurate differentiation between benign and malignant nodules. This approach focuses on identifying critical attributes from individual CT scans. The diagrammatic representation and essential principles of this methodology are depicted in Figure 1, with further details and in-depth analysis provided in the subsequent sections of this manuscript.

2.1. Engineered Features

In medical imaging and the study of pulmonary nodules, the differentiation between benign and malignant nodules hinges on the analysis of growth rates and textural variations. Malignant nodules, characterized by their rapid and aggressive growth, exhibit more nonhomogeneous textures and irregular appearances compared to benign ones. These differences are quantifiable through the Hounsfield unit values in CT scans. To enhance the accuracy of texture representation, the 3D-LOP descriptor has been developed. It surpasses traditional LBP by accurately modeling the nodule’s texture while also considering the spatial information of neighboring voxels. This method effectively mitigates the impact of noise and captures the spatial inhomogeneity inherent in anatomical structures, thereby offering a rigorous approach to distinguishing malignancies based on texture analysis. The LOP descriptor’s introduction marks a significant advancement in utilizing imaging to assess the severity of lung nodules, leveraging textural irregularities as a reliable indicator of malignancy. This segment begins with a succinct summary of the conventional LBP descriptor, preceding an in-depth discussion on the recently introduced 3D-LOP descriptor.

2.1.1. Local Binary Pattern (LBP)

Since Ojala et al. introduced LBP [19], it has been recognized as a leading technique for texture classification. The standard methodology of LBP sets a threshold for the local neighborhood surrounding each pixel, determined by the central pixel’s value. This procedure generates a binary string, considered as a binary code, to which weights are subsequently allocated:
L B P N , R = i = 1 N 2 i 1 f ( g i g c )
In this context, g c denotes the intensity of the central pixel, g i signifies the intensity values of N adjacent pixels that are equidistantly distributed on a circumference with radius R encircling the central pixel, and lastly
f ( x ) = 1 if x 0 0 o t h e r w i s e
Given that the central pixel’s coordinates are set at the origin ( 0 , 0 ) , the positions of its N adjacent pixels, situated on a circular path with a radius R, are determined by the formula ( R s i n ( 2 π i / N ) , R c o s ( 2 π i / N ) ) . Should these coordinates not align precisely with the pixel grid for obtaining the grayscale value, bilinear interpolation is employed for the necessary estimation. Furthermore, the LBP approach can be adapted for three-dimensional contexts by including neighboring pixels located on a sphere with radius R.
The main challenge with the traditional LBP is being highly sensitive to noise and distortions in CT scans, which may arise due to various factors including photon count during the examination, slice thickness, and patient size. The reliance on a hard threshold within the conventional LBP framework exacerbates its sensitivity, undermining its robustness against noise. This characteristic renders traditional LBP less effective for applications such as nodule diagnosis, where precision is critical. Potential issues with employing traditional LBP include:
  • Nodule Misclassification: Traditional LBP’s sensitivity to noise may incorrectly identify benign nodules as malignant, affecting patient treatment and prognosis.
  • Diagnostic Accuracy Decline: Noise and distortions compromise LBP’s textural analysis, lowering the reliability of lung nodule diagnosis and potentially delaying appropriate treatment.
This highlights the necessity for advanced or modified methods capable of reducing noise impact and improving the accuracy of detecting and diagnosing nodules in CT imagery.

2.1.2. 3D-Local Octal Pattern (LOP)

The limitations identified previously have led us to develop a new 3D-LOP descriptor. This innovative descriptor focuses on both texture direction and magnitude. It is designed to capture highly discriminative features from nodule images by analyzing eight directional components derived from spatial derivatives in the x, y, and z axes. Additionally, the descriptor evaluates the texture’s magnitude by examining these spatial derivatives, thereby enhancing the detection of detailed edge features within the specified nodule region. This approach aims to improve the accuracy and reliability of nodule characterization in medical imaging studies.
Let the region of interest for a nodule be represented by N ( x , y , z ) . The introduced descriptor determines the first-order derivatives of the grayscale values for adjacent voxels along the x, y, and z axes, expressed as N r ( g c ) | r = x , y , z . Simultaneously, it calculates the first-order derivatives of the grayscale value for the central voxel in the directions of x, y, and z which are defined as follows:
N x ( g c ) = N ( g x ) N ( g c )
N y ( g c ) = N ( g y ) N ( g c )
N z ( g c ) = N ( g z ) N ( g c )
where g x , g y , and g z represent the grayscale intensities of voxels adjacent to the central voxel g c in the horizontal, vertical, and axial directions, respectively.

2.1.3. Texture Direction

By analyzing the first-order derivative values associated with the central voxel g c , its direction N d i r ( g c ) can be determined from Table 1.
The central voxel is characterized by one of eight distinct directions. This characterization facilitates the conversion of the volumetric data into eight unique values, where each is representative of a specific direction.
Within the framework that includes a 26-neighborhood system, the direction of the second-order derivative associated with the central voxel is delineated as follows:
N o r i e n t ( g c ) = ( Q 1 , Q 2 , , Q 26 )
Q i = 0 if N o r i e n t ( g c ) = N o r i e n t ( g i ) N o r i e n t ( g i ) o t h e r w i s e
where g i represents the i t h neighboring voxel in the collective of 26 voxels surrounding the central voxel g c .
Eventually, a detailed texture directional pattern was developed, containing 26 distinctive values that capture the variations in texture direction. This pattern is summarized in a histogram that clearly specifies the directions of surrounding voxels, thus concisely indicating each voxel’s direction within the volume. The development of this encoding for direction disparities required a thorough examination comparing the central voxel’s first-order derivative orientation values with those of its 26 neighboring voxels. The aggregation of these directional histograms from the voxel nodules forms the feature vector for the texture direction of the LOP descriptor. An illustrative example of computing the direction pattern is depicted in Figure 2.

2.1.4. Texture Magnitude

In the analysis of the texture patterns, while the significance of the directional information predominates the role of magnitude information, often overlooked in texture patterns, is nonetheless crucial. This magnitude information is instrumental in delineating edge and gradient structures, offering advantages over other texture descriptors, such as the original LBP. Inspired by the concept of LBP, we propose a novel magnitude pattern aimed at enhancing nodule diagnosis. Recognizing that essential texture information is predominantly aligned along the x, y, and z axes, our pattern’s primary objective is to investigate the interrelations among neighboring voxels and their immediate surroundings. This investigation leverages magnitude information across the x, y, and z directions.
The magnitude pattern (MP) is calculated from the magnitude of the first-order derivatives along the x, y, and z axes using the following equation:
M P = i = 1 N 2 i 1 f ( M N ( g i ) M N ( g c ) )
M N ( g c ) = N x ( g c ) 2 + N y ( g c ) 2 + N z ( g c ) 2
f ( x ) = 1 , if x 0 0 , o t h e r w i s e
In this context, f ( x ) denotes a function with x derived from the discrepancy in magnitude between the neighboring pixels and the central pixel, as delineated in Equation (8), where x = M N ( g i ) M N ( g c ) . An illustrative example of computing the magnitude pattern is depicted in Figure 3. The magnitude of the central voxel, M N ( g c ) = 177 is determined utilizing Equation (9). Concurrently, the magnitudes of the peripheral neighbors, M N ( g i ) are ascertained. For instance, the magnitude for the first neighboring pixel is M N ( g 1 ) = 264 , surpassing that of the central pixel, resulting in the initial bit of the magnitude pattern being encoded as 1. Similarly, with the magnitude of the second neighbor being M N ( g 2 ) = 200 , exceeding that of the central pixel, the corresponding bit in the magnitude pattern is also assigned a value of 1. Conversely, for the third neighbor with a magnitude of M N ( g 3 ) = 69 , which is below the central pixel’s magnitude, the magnitude pattern is encoded as 0. The encoding for the remaining bits, based on the magnitudes of neighboring pixels, yields a final magnitude pattern of 11010000011010010111101101.
In its current form, the texture magnitude descriptor lacks rotation invariance indicating that identical texture magnitudes when rotated will be encoded differently, potentially resulting in inaccuracies during the classification stage of diagnosis. To address this limitation, an approach was undertaken to standardize all rotated variants of a texture into a singular histogram bin. This was achieved by evaluating all possible 24 orientation codes, identifying the minimal code, and subsequently mapping various shifted combinations to this designated bin, thereby aiming to enhance classification accuracy in diagnostic procedures.

2.1.5. Model Deployment

The model for the classification task utilizes a neural network with 3D convolutional layers, employing ReLU for activation and max-pooling for feature reduction. It integrates convolutional blocks with 64, 128, and 256 filters, followed by a dense layer of 256 neurons. Optimized with Adam and employing Cross-Entropy for loss computation, this structure is optimized for binary categorization in medical imaging contexts.

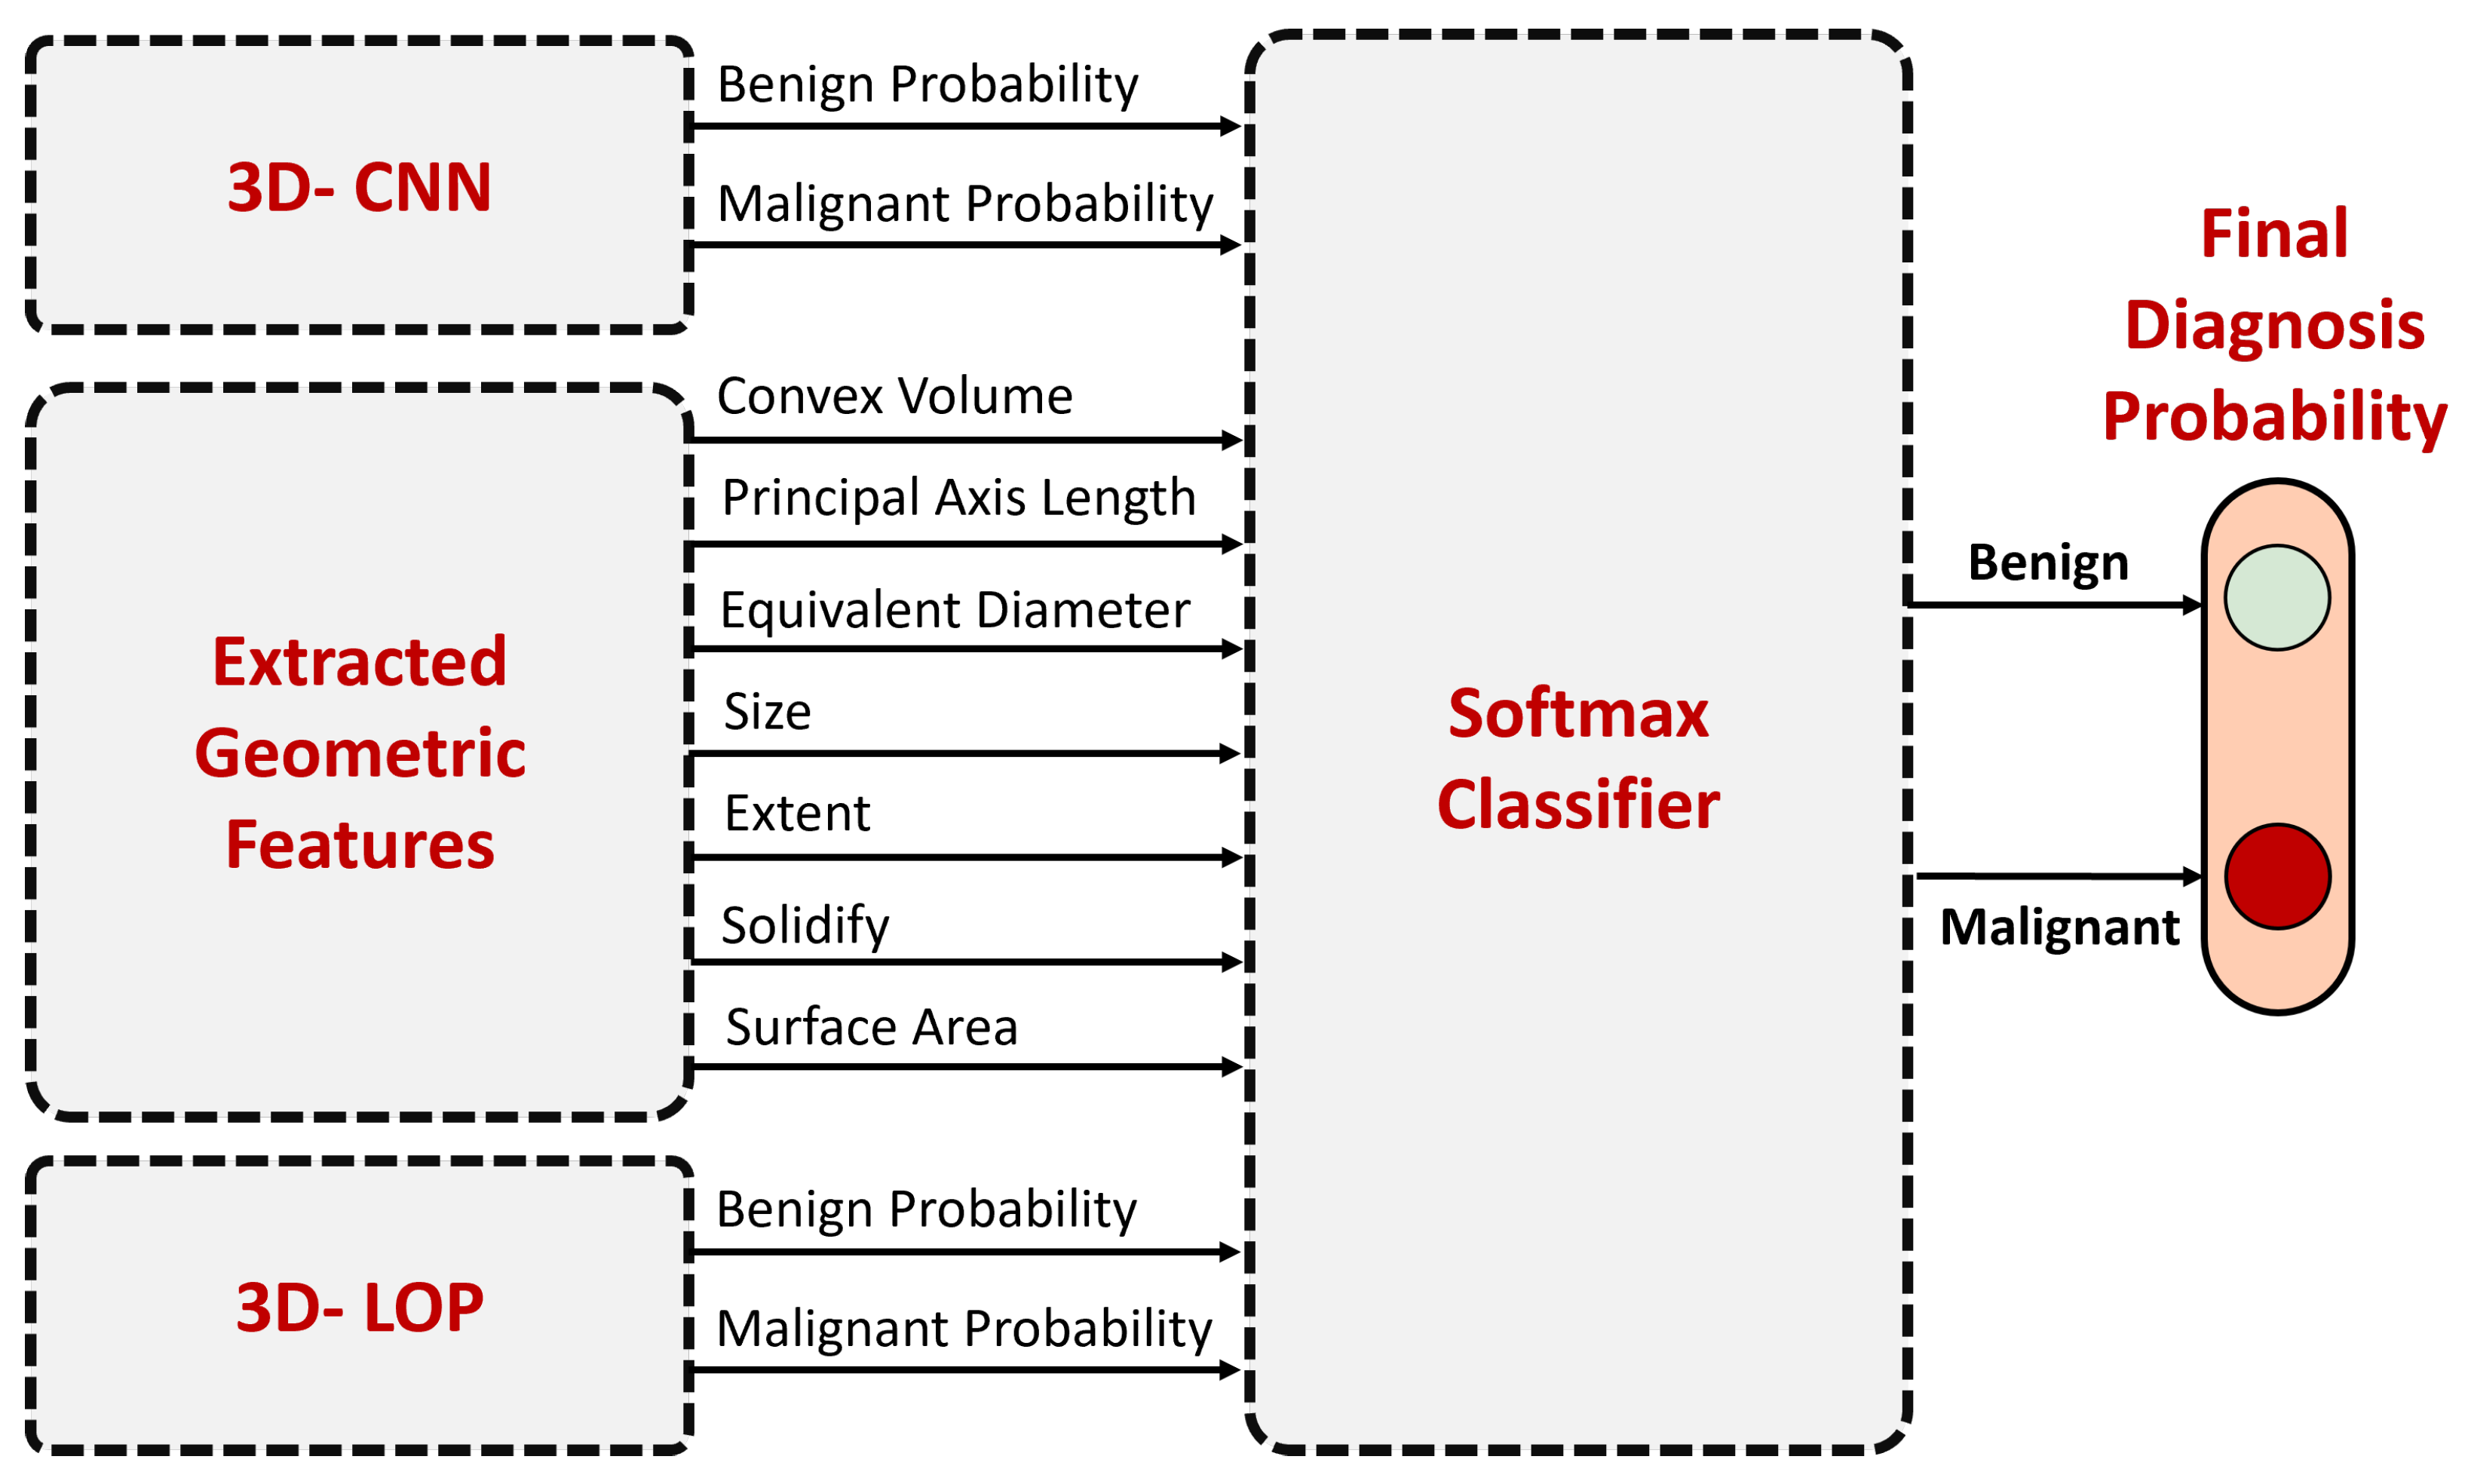
2.2. Deep Features and Fusion

In the developed neural network architecture, which is meticulously crafted for the pivotal role of classifying lung nodules as either benign or malignant, we utilize 3D convolutional layers. The architecture incorporates 3D convolutional layers, ReLU activation functions, and max-pooling processes within a structure consisting of three distinct convolutional blocks, all implemented in the PyTorch framework. In the initial convolutional layer, we apply 64 filters with dimensions of 3 × 3 × 3 , incorporating padding to maintain spatial integrity for single-channel input data. This is followed by layers utilizing 128 and 64 filters, respectively, in subsequent convolutional blocks ensuring the preservation of complex spatial relationships. Max-pooling operations with a kernel size of 2 × 2 × 2 are employed to reduce spatial dimensions while preserving critical features. To enhance the model’s adaptability, the architecture incorporates fully connected layers with the initial dense layer containing 512 neurons. During the training phase, the model utilizes the widely recognized Adam optimization algorithm, setting the learning rate at 0.0001 to achieve a stable rate of convergence. For the purpose of binary classification tasks, Cross-Entropy Loss is selected as the loss function due to its appropriateness in handling such problems. The design of the constructed network plays a crucial role, having been tailored for processing volumetric data through linear transformations of flattened feature maps, resulting in a model well-suited for the classification of lung nodules. Characterized by its parameterization, which includes a single input channel and two output classes, this architecture aims to improve the accuracy of lung nodule classification significantly, thereby advancing diagnostics within the field of medical imaging. The outlined CNN architecture is summarized in Table 2.
The differentiation between malignant and benign pulmonary nodules is significantly influenced by their geometric properties. It is commonly observed that nodules of smaller dimensions are predominantly benign, whereas larger nodules are more inclined to be malignant. In this investigation, we calculate a range of geometric features derived from the segmented nodules, encompassing:
  • Convex Volume ( V convex ):
    Equation: V convex = i = 1 N convex v i
    Description: The sum of voxels ( v i ) within the nodule’s convex hull.
  • Volume (V):
    Equation: V = i = 1 N nodule v i
    Description: The total count of voxels ( v i ) composing the nodule.
  • Equivalent Diameter ( D eq ):
    Equation: D eq = 2 × 3 V 4 π 1 3
    Description: Diameter of an equivalent-volume sphere.
  • Surface Area ( A surface ):
    Equation: [Complex calculations involving voxel neighborhood assessments]
    Description: Total area surrounding the nodule’s boundary.
  • Solidity (S):
    Equation: S = V V convex
    Description: Ratio of voxel count within the nodule to that within its convex hull.
  • Principal Axis Length:
    Equation: Derived from the eigenvalues ( λ i ) of the covariance matrix.
    Description: Major axes lengths of the corresponding ellipsoid.
  • Extent (E):
    Equation: E = V V bbox
    Description: Proportion of nodules’ voxels to total voxels in the bounding box.
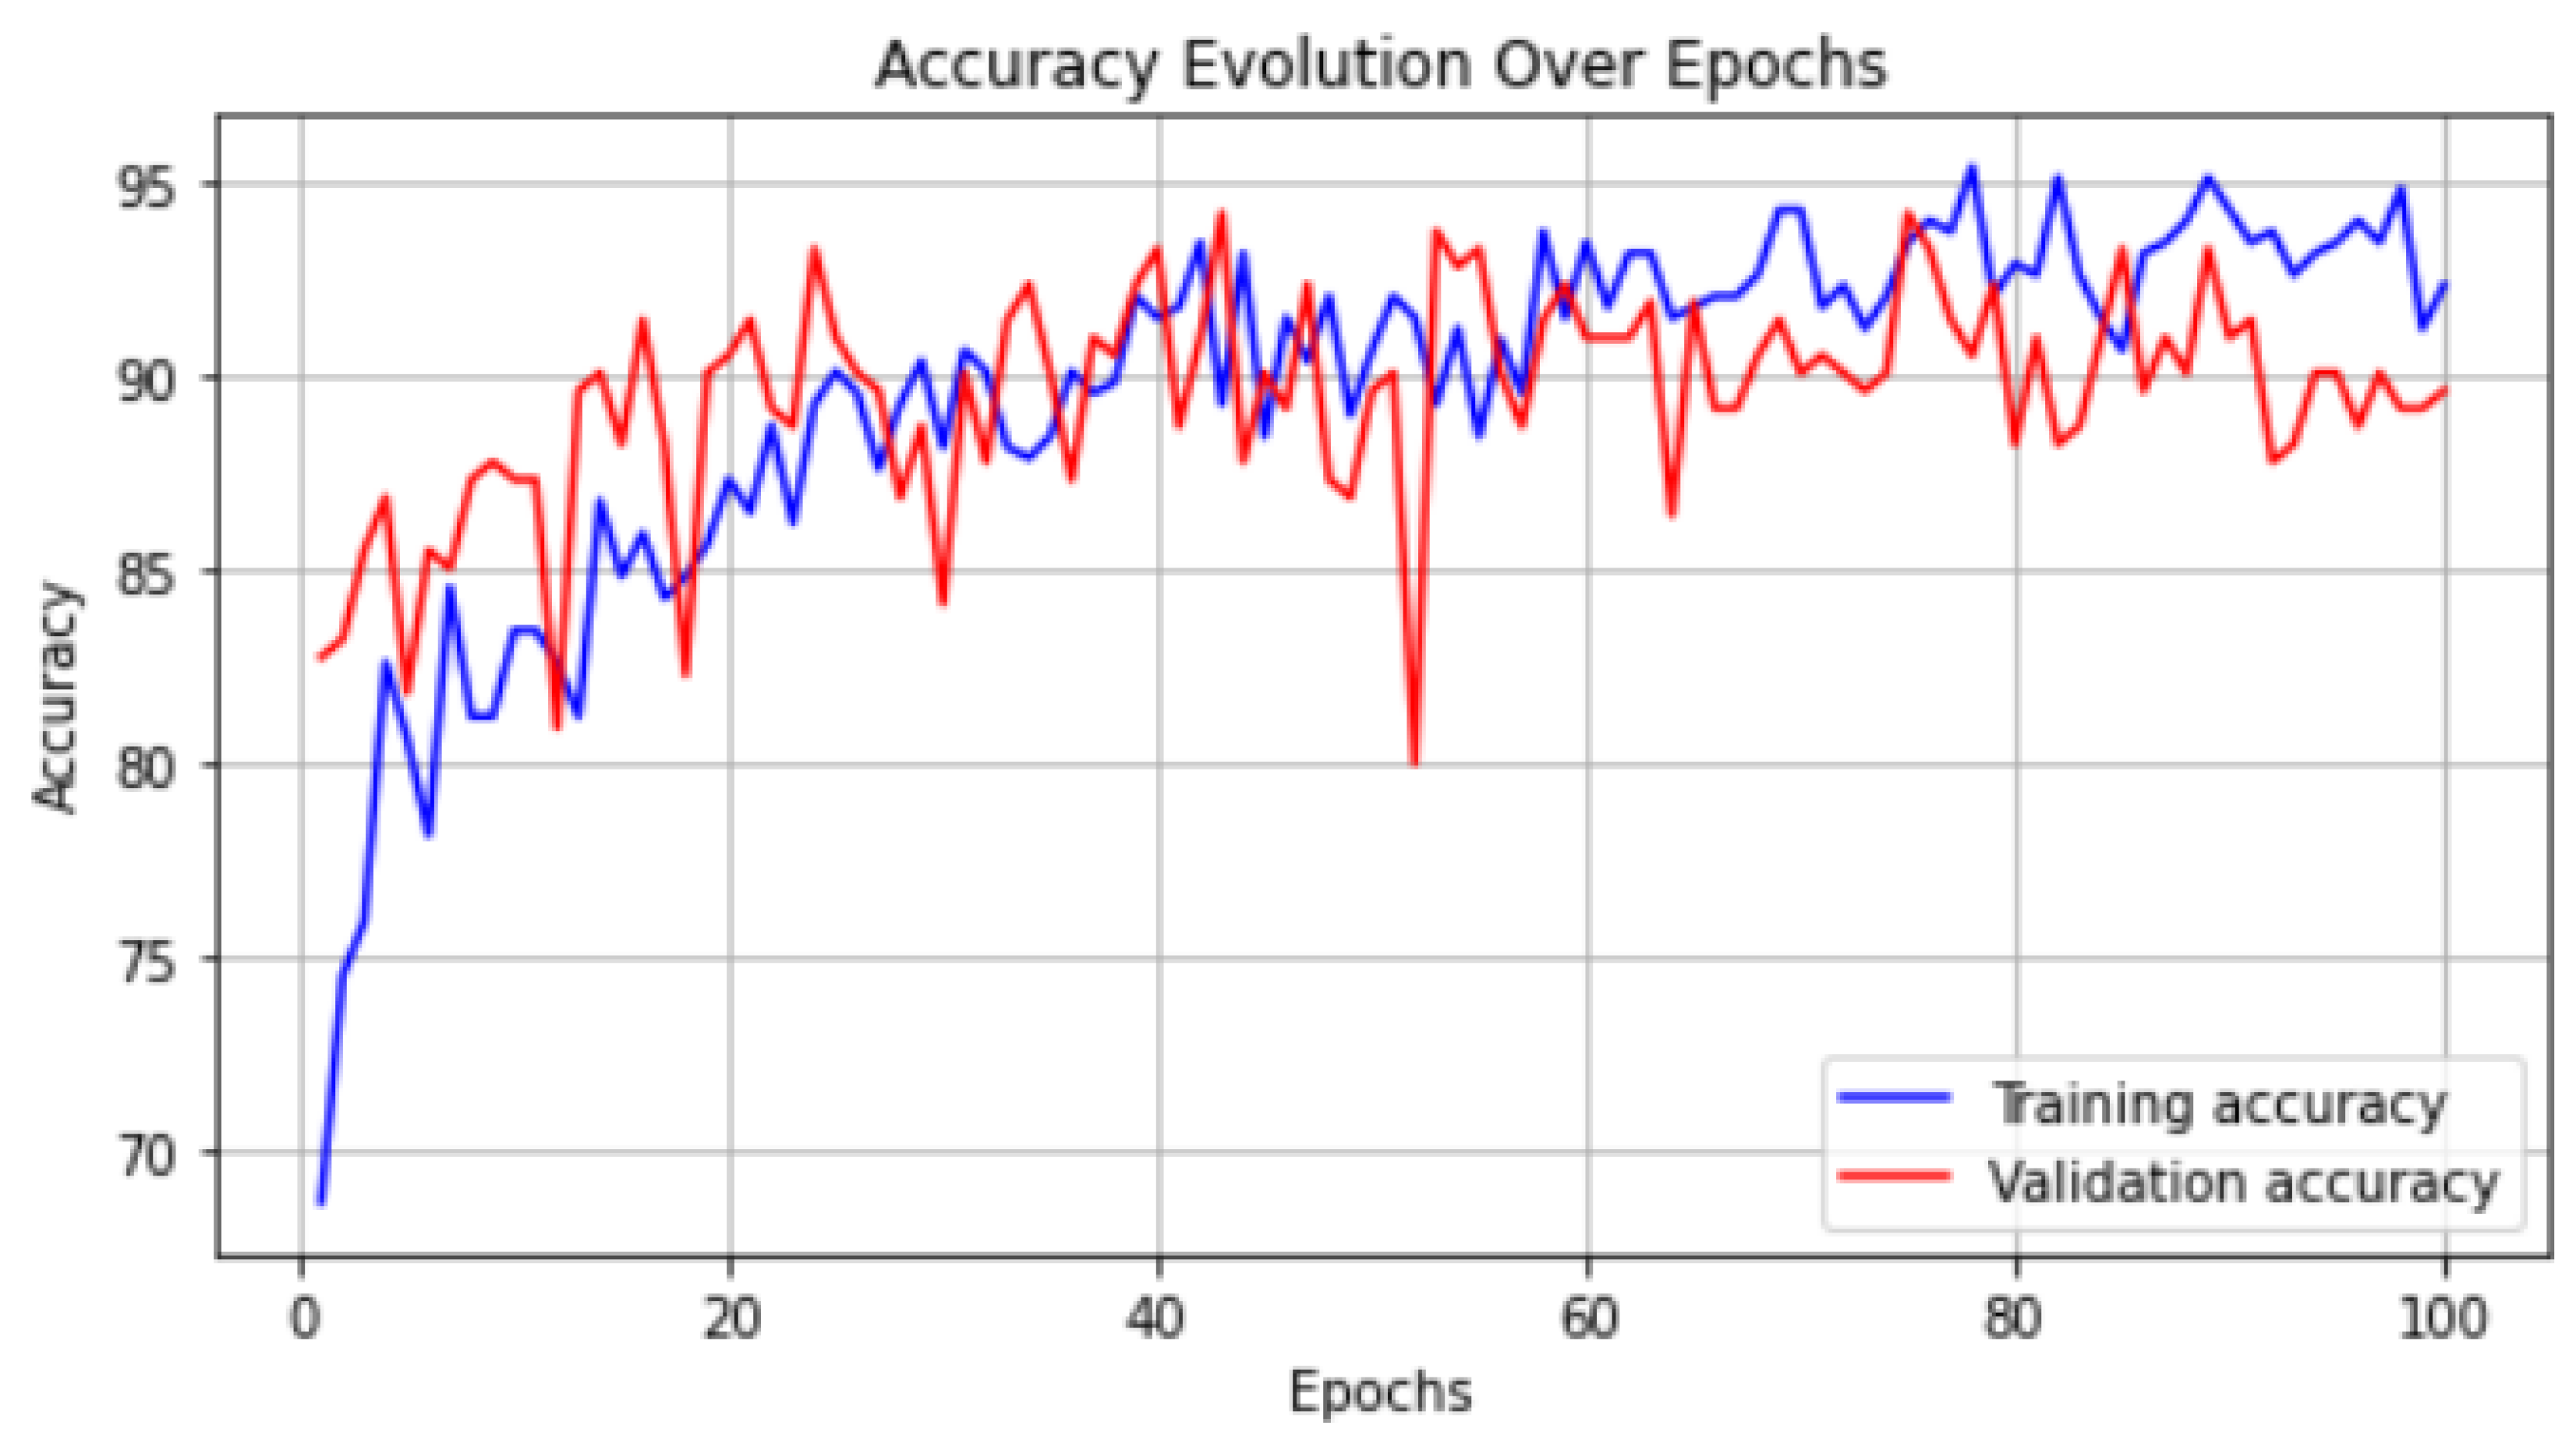
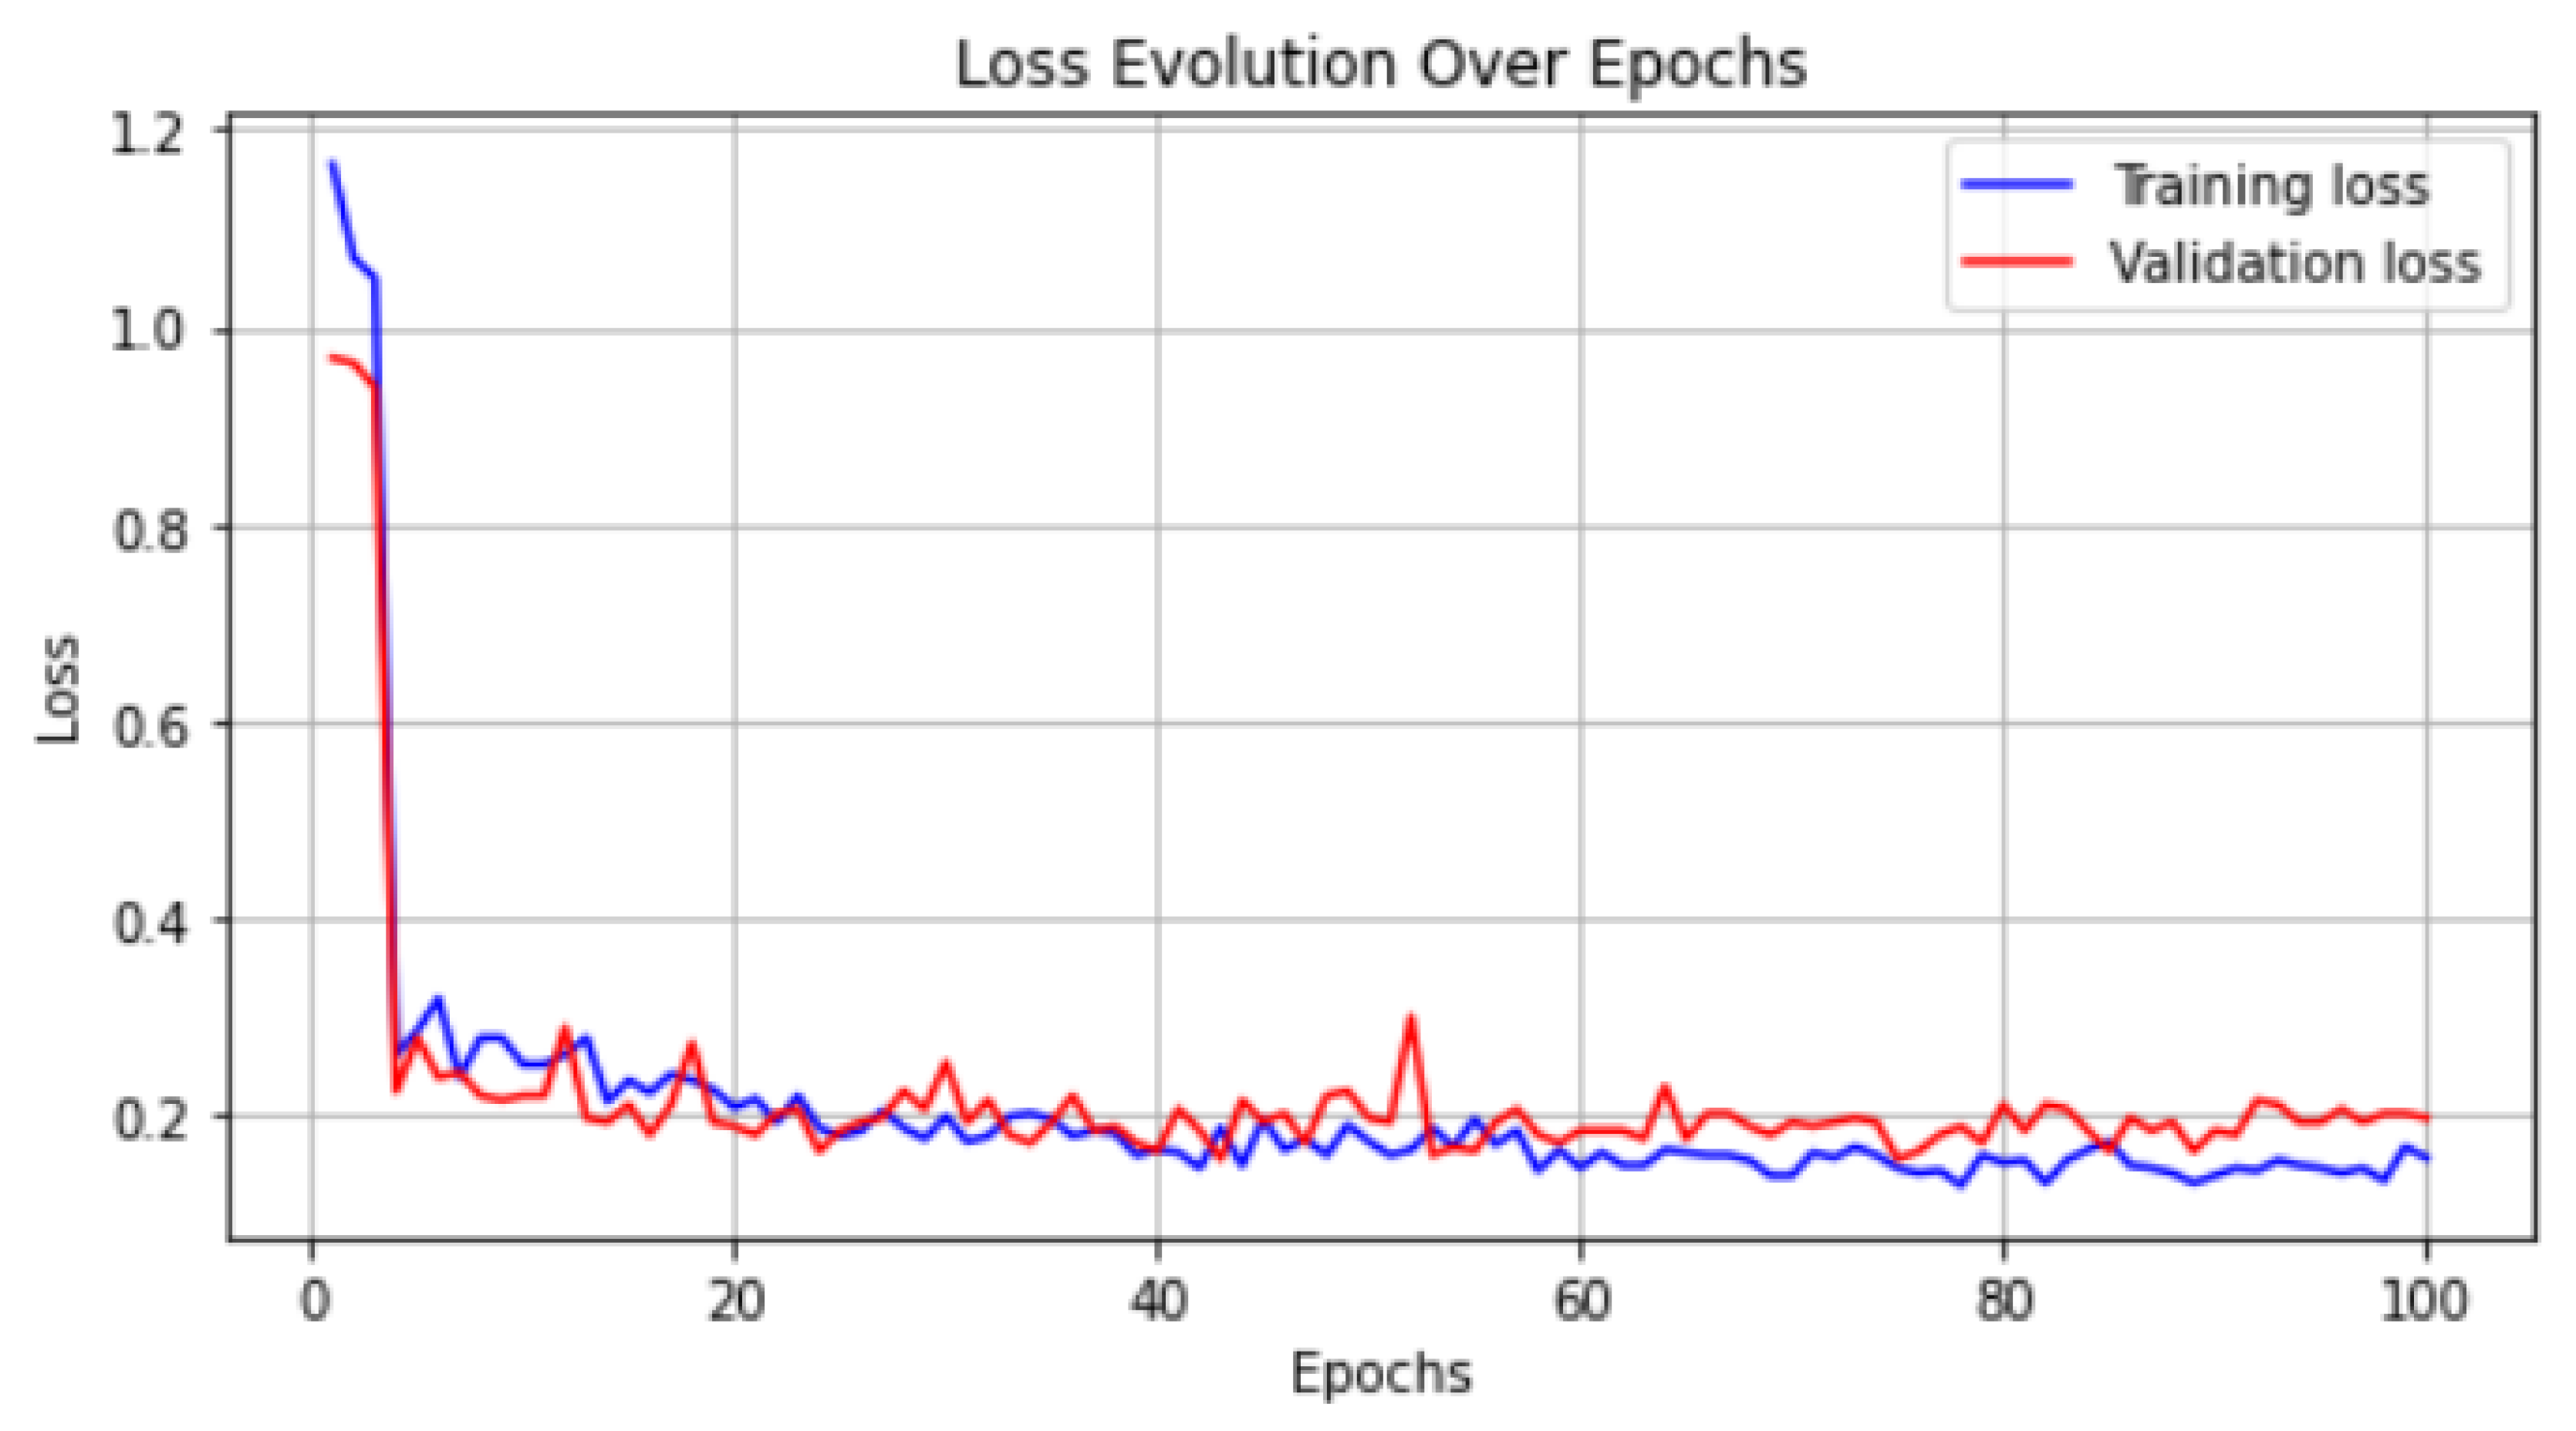
For an in-depth exploration of these characteristics, the reader is referred to the work of Olson et al. [20]. To facilitate a more efficient analysis, the volumes of the nodules are normalized to a cube with each side measuring 40 mm and undergo isotropic resampling in three-dimensional space. This process obviates the necessity for continuous recalibrations due to pixel spacing or resolution differences.

3. Results

The effectiveness of the proposed models was thoroughly assessed utilizing the dataset from the Lung Image Database Consortium and Image Database Resource Initiative (LIDC-IDRI) [21]. The LIDC dataset [21] is recognized as a cornerstone for research in lung cancer diagnosis, encompassing 1018 CT scans, each paired with an XML file. During preprocessing, scans exhibiting a slice thickness exceeding 2.5 mm, as well as those lacking slices or exhibiting inconsistent slice spacing were excluded. This filtration process yielded a refined collection of 888 CT scans. The scans retained in this selection showcase nodules with minimum diameters of 3 mm, annotated by four radiologists who provided malignancy scores on a scale from 1 (indicative of likely benignity) to 5 (indicative of likely malignancy). While nodules receiving unanimous scores from all radiologists would be ideal for analysis, adhering to such stringent selection criteria would drastically diminish the dataset’s volume. To preserve a comprehensive sample size for analysis, nodules were classified as benign with an average radiologist score of ≤ 1.5 , and as malignant with an average score of ≥ 3.5 . Employing this classification strategy, the curated version of the LIDC dataset for our study includes 491 malignant and 331 benign nodules.
Three separate experimental setups were devised and examined. The initial experiment was dedicated to differentiating between benign and malignant nodules by feeding raw CT scans into a deep learning framework that incorporates 3D-CNN. The second experiment pursued a similar classification goal, but it utilized magnitude and directional features derived from 3D-LOP extracted from the nodule volumes as inputs for the 3D-CNN architecture. The third experiment amalgamated these methodologies by merging the output probabilities from the preceding two experiments with essential geometric features delineated from the nodules’ morphology. This composite information was subsequently analyzed using a softmax classifier to render the ultimate diagnostic verdict. The aim behind integrating geometric characteristics with the probabilities from the initial experiments is to synergize the classification insights based on the nodules’ geometric attributes, enhancing the decision-making process beyond simple probabilistic multiplication. Figure 4 clearly illustrates this integration in a detailed diagram.
The development and assessment of the 3D-CNN model in this research were conducted through a carefully structured separation of the dataset. The data were divided into three specific subsets: training, validation, and testing, receiving 50 % (345 samples), 20 % (230 samples), and 30 % (247 samples) of the total dataset, respectively. This deliberate distribution aimed to facilitate a thorough evaluation of the model’s efficacy across diverse data.
In the model training phase, the 3D-CNN underwent an intensive learning regimen, processing image batches of 16 from the training dataset in each cycle. This batch-processing technique is recognized for enhancing learning efficiency and computational viability. Employed widely in deep learning methodologies, it strikes an optimal balance between managing memory limitations and achieving precise gradient approximations within the optimization landscape of the model.
During the model’s training phase, which encompassed numerous epochs, we observed a consistent improvement in accuracy for both the training and validation datasets. Figure 5 and Figure 6 illustrate the progression of training and validation accuracy across 100 epochs in two distinct experimental setups.
In the first experiment, the raw data were input into the CNN model as depicted in Figure 5 for accuracy and Figure 7 for loss. Conversely, Figure 6 presents the accuracy for the second experiment, wherein the CNN model processed a feature vector derived from 3D-LOP with the corresponding loss shown in Figure 8. This incremental advancement highlights the model’s capability to effectively learn from the input data.
More importantly, the continuous increase in validation accuracy and decrease in validation loss demonstrate the model’s ability to generalize well to new, unseen data—a critical aspect of the efficacy of predictive models. This generalization indicates that the identified patterns are not solely characteristic of the training data but also applicable in broader real-world scenarios, thereby validating our model’s utility in accurately classifying lung nodules.
To evaluate the effectiveness of the proposed 3D-LOP separately, its performance was compared not only with the original LBP but also with several of its variants, specifically Adjustable LBP, Resolved Ambiguity LBP, and the original Local Ternary Pattern (LTP). As indicated in Table 3, the 3D-LOP outperformed all compared versions of LBP in terms of accuracy.
Further analysis revealed that the original 3D-LBP displayed the lowest accuracy and specificity of all evaluated descriptors. This observation is consistent with expectations given the original LBP’s high sensitivity to noise, which proves suboptimal for identifying benign nodules due to their homogeneous texture. This sensitivity typically results in a higher rate of false positives, thereby diminishing the descriptor’s specificity.
In assessing the efficacy of our proposed model, we utilized several performance metrics, as outlined in Table 4. These evaluation criteria encompass accuracy, sensitivity, specificity, and the Area Under the Receiver Operating Characteristic (ROC) curve. Table 4 provides a detailed overview of these performance indicators, showcasing the superiority of our approach. The outcomes are detailed for each discrete experiment and also in an aggregated form, illustrating the model’s comprehensive performance.
Additionally, we performed a comparative analysis to juxtapose our methodology against existing approaches that have also engaged the LIDC dataset. Given the difficulty in finding studies with precisely matching criteria for selecting nodule samples, our comparison focused on studies that adopted similar, albeit stringent selection criteria and had a dataset size comparable to ours. This strategy of comparison serves to underscore the advantages of our proposed methodology while positioning it amidst the wider landscape of current research in this field as shown in Figure 9.

4. Discussion and Conclusions

Our research findings substantiate the benefits of preprocessing raw data prior to their analysis by a 3D-CNN for lung nodule diagnosis. Although extracting deep features from raw data yields notable accuracy, our analysis reveals that preprocessing markedly bolsters this accuracy. Importantly, integrating deep features with preprocessed data appears to exert a synergistic enhancement on diagnostic precision. This suggests that employing a dual-strategy that incorporates both raw and preprocessed data could significantly improve the reliability and accuracy of lung nodule detection, a critical factor in the early identification and management of pulmonary diseases. This holistic approach capitalizes on the strengths of both preprocessing and direct feature extraction, presenting a comprehensive solution for medical image analysis.
Our novel CAD system for the diagnosis of pulmonary nodules employs both 3D-LOP for texture orientation and magnitude analysis and deep learning techniques, leveraging a 3D-CNN to analyze a fusion of features derived from raw CT scans and 3D-LOP attributes characterizing nodule texture. The integration of these heterogeneous data sources fosters a more comprehensive diagnostic model, which combines preliminary diagnostic outcomes generated from both sets of features with the geometrical data of nodules, and utilizes a probability-based linear classifier to enhance diagnostic outcomes.
Compared to existing methods utilizing the LIDC dataset, our approach significantly enhances diagnostic precision by innovatively integrating feature fusion. Previous studies such as those by Bishnoi et al. [12] and Vaiyapuri et al. [14] primarily focus on extracting features directly from raw data. In contrast, works by Raza et al. [5], Thakur et al. [6], Yadlapalli et al. [15], and Guo et al. [16] employ conventional machine learning techniques without a robust fusion of feature types. Our system uniquely combines deep learning and texture-based features to provide a comprehensive analysis. This integration not only reduces false positives but also improves specificity, addressing common limitations found in prior models.
A major strength of this study is the utilization of both 3D-CNNs and 3D-LOP which synergistically enhance the accuracy and reliability of nodule diagnosis. This dual-use approach demonstrates that feeding a CNN with meaningful features—rather than raw data—can significantly improve classification performance. However, this method heavily depends on the quality of nodule detection which can vary widely and affect overall effectiveness. Additionally, while the model shows promising results on the LIDC dataset, its adaptability to other datasets or real-world scenarios remains to be extensively validated.
Future work will aim to validate our system using a diverse array of locally acquired datasets to ensure robustness across different scenarios. Additionally, we plan to integrate this diagnostic framework with other detection algorithms to develop a comprehensive CAD system. Further research will also investigate the incorporation of various types of data, including biomarkers, patient history, and demographic factors, to enhance the predictive accuracy of our model. Expanding the model’s capabilities to include multi-class classification of nodule types could offer more detailed diagnostics which would be instrumental in facilitating personalized medicine approaches.
In conclusion, this paper presents a cutting-edge CAD system that effectively combines 3D-LOP and 3D-CNN technologies to improve the accuracy and reliability of diagnosing pulmonary nodules through medical imaging. The system’s ability to integrate diverse data sources into a unified diagnostic tool demonstrates significant potential to enhance the precision and dependability of medical imaging diagnoses.

Author Contributions

Conceptualization, A.S. and W.S.; methodology, A.S. and W.S.; software, A.S. and W.S.; validation, A.S. and W.S.; formal analysis, A.S. and W.S.; investigation, A.S. and W.S.; resources, A.S. and W.S.; data curation, A.S. and W.S.; writing—original draft preparation, W.S; writing—review and editing, A.S. and W.S.; visualization, A.S.; supervision, A.S. All authors have read and agreed to the published version of the manuscript.

Funding

This research received no external funding.

Data Availability Statement

The data presented in this study are publicly available in the Lung Image Database Consortium image collection (LIDC-IDRI) at: https://wiki.cancerimagingarchive.net/display/Public/LIDC-IDRI, accessed on 15 July 2023.

Conflicts of Interest

The authors declare no conflicts of interest.

References

  1. Siegel, R.L.; Miller, K.D.; Wagle, N.S.; Jemal, A. Cancer statistics, 2023. CA Cancer J. Clin. 2023, 73, 17–48. [Google Scholar] [CrossRef] [PubMed]
  2. Team, N.L.S.T.R. Reduced lung-cancer mortality with low-dose computed tomographic screening. N. Engl. J. Med. 2011, 365, 395–409. [Google Scholar]
  3. Siddiqui, E.A.; Chaurasia, V.; Shandilya, M. Detection and classification of lung cancer computed tomography images using a novel improved deep belief network with Gabor filters. Chemom. Intell. Lab. Syst. 2023, 235, 104763. [Google Scholar] [CrossRef]
  4. El Hamdi, D.; Elouedi, I.; Slim, I. Computer-Aided Classification of Cell Lung Cancer Via PET/CT Images Using Convolutional Neural Network. Int. J. Image Graph. 2023, 2450040. [Google Scholar] [CrossRef]
  5. Raza, R.; Zulfiqar, F.; Khan, M.O.; Arif, M.; Alvi, A.; Iftikhar, M.A.; Alam, T. Lung-EffNet: Lung cancer classification using EfficientNet from CT-scan images. Eng. Appl. Artif. Intell. 2023, 126, 106902. [Google Scholar] [CrossRef]
  6. Thakur, S.K.; Singh, D.P.; Choudhary, J. Lung cancer: Detection and classification of malignancies. In Proceedings of the Artificial Intelligence and Sustainable Computing: Proceedings of ICSISCET 2020; Springer: Berlin/Heidelberg, Germany, 2022; pp. 451–463. [Google Scholar]
  7. Shafi, I.; Din, S.; Khan, A.; Díez, I.D.L.T.; Casanova, R.d.J.P.; Pifarre, K.T.; Ashraf, I. An effective method for lung cancer diagnosis from ct scan using deep learning-based support vector network. Cancers 2022, 14, 5457. [Google Scholar] [CrossRef] [PubMed]
  8. Mohamed, T.I.; Oyelade, O.N.; Ezugwu, A.E. Automatic detection and classification of lung cancer CT scans based on deep learning and ebola optimization search algorithm. PLoS ONE 2023, 18, e0285796. [Google Scholar] [CrossRef] [PubMed]
  9. Dodia, S.; Annappa, B.; Padukudru, M.A. A novel bi-level lung cancer classification system on CT scans. In Proceedings of the Annual Conference On Medical Image Understanding and Analysis; Springer: Berlin/Heidelberg, Germany, 2022; pp. 578–593. [Google Scholar]
  10. Xu, Y.; Wang, S.; Sun, X.; Yang, Y.; Fan, J.; Jin, W.; Li, Y.; Su, F.; Zhang, W.; Cui, Q.; et al. Identification of benign and malignant lung nodules in CT images based on ensemble learning method. Interdiscip. Sci. Comput. Life Sci. 2022, 14, 130–140. [Google Scholar] [CrossRef] [PubMed]
  11. AR, B. A deep learning-based lung cancer classification of CT images using augmented convolutional neural networks. ELCVIA Electron. Lett. Comput. Vis. Image Anal. 2022, 21, 130–142. [Google Scholar] [CrossRef]
  12. Bishnoi, V.; Goel, N.; Tayal, A. Automated system-based classification of lung cancer using machine learning. Int. J. Med. Eng. Inform. 2023, 15, 403–415. [Google Scholar] [CrossRef]
  13. Damayanti, N.P.; Ananda, M.N.D.; Nugraha, F.W. Lung cancer classification using convolutional neural network and DenseNet. J. Soft Comput. Explor. 2023, 4, 133–141. [Google Scholar] [CrossRef]
  14. Vaiyapuri, T.; Liyakathunisa; Alaskar, H.; Parvathi, R.; Pattabiraman, V.; Hussain, A. Cat swarm optimization-based computer-aided diagnosis model for lung cancer classification in computed tomography images. Appl. Sci. 2022, 12, 5491. [Google Scholar] [CrossRef]
  15. Yadlapalli, P.; Bhavana, D.; Gunnam, S. Intelligent classification of lung malignancies using deep learning techniques. Int. J. Intell. Comput. Cybern. 2022, 15, 345–362. [Google Scholar] [CrossRef]
  16. Guo, Z.; Yang, J.; Zhao, L.; Yuan, J.; Yu, H. 3D SAACNet with GBM for the classification of benign and malignant lung nodules. Comput. Biol. Med. 2023, 153, 106532. [Google Scholar] [CrossRef] [PubMed]
  17. Wu, R.; Liang, C.; Li, Y.; Shi, X.; Zhang, J.; Huang, H. Self-supervised transfer learning framework driven by visual attention for benign–malignant lung nodule classification on chest CT. Expert Syst. Appl. 2023, 215, 119339. [Google Scholar] [CrossRef]
  18. Qiao, J.; Fan, Y.; Zhang, M.; Fang, K.; Li, D.; Wang, Z. Ensemble framework based on attributes and deep features for benign-malignant classification of lung nodule. Biomed. Signal Process. Control. 2023, 79, 104217. [Google Scholar] [CrossRef]
  19. Ojala, T.; Pietikainen, M.; Maenpaa, T. Multiresolution gray-scale and rotation invariant texture classification with local binary patterns. IEEE Trans. Pattern Anal. Mach. Intell. 2002, 24, 971–987. [Google Scholar] [CrossRef]
  20. Olson, E. Particle shape factors and their use in image analysis part 1: Theory. J. Gxp Compliance 2011, 15, 85. [Google Scholar]
  21. Armato III, S.G.; McLennan, G.; Bidaut, L.; McNitt-Gray, M.F.; Meyer, C.R.; Reeves, A.P.; Zhao, B.; Aberle, D.R.; Henschke, C.I.; Hoffman, E.A.; et al. The lung image database consortium (LIDC) and image database resource initiative (IDRI): A completed reference database of lung nodules on CT scans. Med. Phys. 2011, 38, 915–931. [Google Scholar] [CrossRef] [PubMed]
  22. Shaffie, A.; Soliman, A.; Khalifeh, H.A.; Ghazal, M.; Taher, F.; Keynton, R.; Elmaghraby, A.; El-Baz, A. On the integration of ct-derived features for accurate detection of lung cancer. In Proceedings of the 2018 IEEE International Symposium on Signal Processing and Information Technology (ISSPIT), Louisville, KY, USA, 6–8 December 2018; pp. 435–440. [Google Scholar]
  23. Shaffie, A.; Soliman, A.; Khalifeh, H.A.; Taher, F.; Ghazal, M.; Dunlap, N.; Elmaghraby, A.; Keynton, R.; El-Baz, A. A novel ct-based descriptors for precise diagnosis of pulmonary nodules. In Proceedings of the 2019 IEEE International Conference on Image Processing (ICIP), Taipei, Taiwan, 22–25 September 2019; pp. 1400–1404. [Google Scholar]
  24. Alksas, A.; Shaffie, A.; Ghazal, M.; Taher, F.; Khelifi, A.; Yaghi, M.; Soliman, A.; Bogaert, E.V.; El-Baz, A. A novel higher order appearance texture analysis to diagnose lung cancer based on a modified local ternary pattern. Comput. Methods Programs Biomed. 2023, 240, 107692. [Google Scholar] [CrossRef] [PubMed]
  25. Bhende, M.; Thakare, A.; Saravanan, V.; Anbazhagan, K.; Patel, H.N.; Kumar, A. Attention layer-based multidimensional feature extraction for diagnosis of lung cancer. BioMed Res. Int. 2022, 2022, 3947434. [Google Scholar] [CrossRef] [PubMed]
  26. He, W.; Li, B.; Liao, R.; Mo, H.; Tian, L. An ISHAP-based interpretation-model-guided classification method for malignant pulmonary nodule. Knowl.-Based Syst. 2022, 237, 107778. [Google Scholar] [CrossRef]
  27. Jiang, H.; Shen, F.; Gao, F.; Han, W. Learning efficient, explainable and discriminative representations for pulmonary nodules classification. Pattern Recognit. 2021, 113, 107825. [Google Scholar] [CrossRef]
  28. Zheng, B.; Yang, D.; Zhu, Y.; Liu, Y.; Hu, J.; Bai, C. 3D gray density coding feature for benign-malignant pulmonary nodule classification on chest CT. Med. Phys. 2021, 48, 7826–7836. [Google Scholar] [CrossRef] [PubMed]
  29. Saied, M.; Raafat, M.; Yehia, S.; Khalil, M.M. Efficient pulmonary nodules classification using radiomics and different artificial intelligence strategies. Insights Imaging 2023, 14, 91. [Google Scholar] [CrossRef] [PubMed]
Figure 1. Diagrammatic representation of the computer-aided diagnostic (CAD) system developed for diagnosing lung nodules.
Algorithms 17 00161 g001
Figure 2. Illustrative example of computing the texture direction pattern.
Algorithms 17 00161 g002
Figure 3. Illustrative example of computing the magnitude pattern.
Algorithms 17 00161 g003
Figure 4. Integration of Initial Outputs from 3D-CNN and 3D-LOP with Geometric Features.
Algorithms 17 00161 g004
Figure 5. Raw data 3D-CNN model accuracy evolution over epochs.
Algorithms 17 00161 g005
Figure 6. 3D-LOP model accuracy evolution over epochs.
Algorithms 17 00161 g006
Figure 7. Raw data 3D-CNN model loss evolution over epochs.
Algorithms 17 00161 g007
Figure 8. 3D-LOP model loss evolution over epochs.
Algorithms 17 00161 g008
Figure 9. Comparative performance analysis of our proposed system against established models [24,25,26,27,29].
Algorithms 17 00161 g009
Table 1. Central voxel direction based on its first-order derivative.
Direction N x ( g c ) 0 N y ( g c ) 0 N z ( g c ) 0
1
2
3
4
5
6
7
8
Table 2. Proposed 3D-CNN architecture for the raw CT scan.
LayerOutput Shape
Input(1, 64, 64, 64)
Conv1(64, 64, 64, 64)
ReLU1(64, 64, 64, 64)
MaxPool1(64, 32, 32, 32)
Conv2(128, 32, 32, 32)
ReLU2(128, 32, 32, 32)
MaxPool2(128, 16, 16, 16)
Conv3(256, 16, 16, 16)
ReLU3(256, 16, 16, 16)
MaxPool3(256, 8, 8, 8)
Flatten(256 × 8 × 8 × 8)
Fully connected 1(512,)
ReLu4(512,)
Fully connected 22
Table 3. Comparative Analysis of Various 3D-Local LBP Descriptor Variations.
Evaluation Metrics
AccuracySensitivitySpecificity
Original 3D-LBP89.3392.4383.56
Adjustable 3D-LBP [22]91.7494.6289.60
Resolved Ambiguity 3D-LBP [23]92.2090.3293.60
3D-LTP [24]92.1993.3391.21
Proposed 3D-LOP96.2397.5593.71
Table 4. Classification results.
Evaluation Metrics
AccuracySensitivitySpecificityAUC
3D-LOP96.2397.5593.710.9894
3D-CNN93.5295.5789.890.9697
Fusion97.8498.1194.730.9912
Bhende, et al. [25]92.7090.9094.50-
He, et al. [26]87.3086.2088.500.873
Jiang, et al. [27]90.7785.3795.04-
Alksas, et al. [24]96.1797.1495.330.9832
Zheng, et al. [28]93.1790.38-0.9753
Saied, et al. [29]90.3990.3293.650.96
Disclaimer/Publisher’s Note: The statements, opinions and data contained in all publications are solely those of the individual author(s) and contributor(s) and not of MDPI and/or the editor(s). MDPI and/or the editor(s) disclaim responsibility for any injury to people or property resulting from any ideas, methods, instructions or products referred to in the content.

