1. Introduction
Automatic logo detection is the process by which logotypes are identified in the body of documents presented as images. In this document, a new expert system for the automatic detection of logos is proposed and tested. This expert system is designed to solve the detection of logos in documents.
To achieve this goal, human expert knowledge of logo search is inferred by the system, defining areas and features where a logo can be printed. The knowledge-based system, which learns about the feature vector, is trained to discriminate a logo. The objective of this work is to solve the bi-class problem of automatically deciding whether a document has at least a logotype or not, but not the recognition of the type of logo. This process has many applications, such as in logo-based surveillance, marketing analysis, or document identification. For example, in marketing analysis, logotype detection applied to public pictures uploaded by users may reveal important information about their preferred brands, interests, tastes, and needs. In particular, in the domain of document identification, logo-detection research revolves around the importance of being able to identify the source of a document. For example, a system may decide whether to explore or not the textual information in a document after the document logo has been recognized. The difficulties in the automatic process are due to the high variability in logo shapes and the low quality that scanned documents usually have. A logo-detection method should be able to cope with low-quality logos and, at the same time, be fast enough to process as many documents as possible in the shortest time.
To obey these requirements, we propose a novel expert system defined as a multi-stage detection framework based on the application of four stages: image binarization and noise filtering; candidate regions computed using a new longest increasing run algorithm to reduce the scanned area per document; an extension of a feature rectangle expansion method with forward checking, optimized for logos with multiple parts; and finally, a C4.5 decision tree trained and tested against a set of 1291 official documents to evaluate its performance. The combination and adjustment of different techniques of computer vision, which are used to infer the knowledge base, are the main contribution defined as a hierarchical approach to the detection of logos.
The paper is structured as follows:
Section 1 provides an introduction to the topic of logo detection and its relevance, laying the groundwork for subsequent discussions.
Section 2, offers a comprehensive review of existing literature pertaining to logo-detection techniques and artificial intelligence methods. In
Section 3, we detail our logo-detection approach, which builds upon an extension to the feature rectangles method (FR). Specifically, we describe how an FR, defined as a rectangle with a minimum inner area encompassing at least one foreground pixel and surrounded by background pixels, forms the basis of our methodology.
Section 4 presents experimental results showcasing the precision of our approach on the Tobacco database. Finally,
Section 5 concludes the paper, summarizing key findings and outlining avenues for future research.
2. Related Work
Automatic logo recognition has received special attention from previous research efforts, in particular as a special case of the more general problem of shape recognition.
Logo detection represents a specialized branch within the broader scope of object detection. Its objective revolves around identifying instances of predefined logo classes in images or videos [
1]. This section aims to delve into the current forefront of logo-detection methodologies.
Prior to the advent of deep learning, early approaches to logo detection relied on hand-crafted visual features (e.g., SIFT and HOG) coupled with traditional classification models (e.g., SVM) [
2,
3,
4,
5]. For instance, in 2013, Ref. [
6] introduced a logo-matching system utilizing SIFT for logo detection and recognition. Their system not only facilitated the recognition and matching of multiple reference logos within an image, but also demonstrated efficacy in detecting similar logos. Nonetheless, these conventional methods exhibit certain limitations: (1) The region-selection search algorithm, predicated on sliding windows, lacks specificity, particularly with regard to high time complexity. (2) Hand-designed features exhibit limited robustness in accommodating variations in logo diversity.
Shape descriptors can be classified as internal descriptors, if they code the boundary of a shape, or external descriptors, if they code the area enclosed by a boundary. A logotype is a rectangular region defined by a set of characteristics, which come from the pixel information and region shape, with values that differ from those of the text. These descriptors are used to discriminate logotypes from text. One of the first proponents of internal descriptors was [
7], who used moments of area for shape description. Moments perform well for small and simple objects, but they tend to perform worse as objects become more complex or bigger.
Regarding logotype recognition, some authors follow a statistical approach. For example, Ref. [
8] investigated logotype indexing and matching using invariant moments and the histogram of edge directions. Ref. [
9] proposed a logo-recognition method based on scale-invariant shape descriptors, considering logotypes as a distribution of points in 2D. A trademark-detection method based on a size function was presented by [
10]. They tested the approach on a big set of trademark images with good results, but the authors pointed out that logos in noisy images are poorly detected. Our method tries to overcome that limitation.
Other authors, like [
11], follow a more structural approach where logotypes are first decomposed into sets of closed contours, each of which is coded according to chain-code information. Then, a string-matching algorithm is applied to compute similarities between the contours. Ref. [
12] used a hierarchical contour representation and string-matching algorithms to detect trademark pictograms. The downside of this method is that it is only appropriate when logotypes have the same hierarchical contour representation, which is rare.
Neural networks were proposed in the context of logo recognition by authors like [
13,
14]. The idea of this approach is to represent a logo using a structured representation called a contour tree. Contour trees associate a node with contour information extracted from logotype examples. Each node in the contour tree is labeled by a feature vector describing its curvature, perimeter, and other geometric properties. Then, a neural network is trained to learn from the examples represented by contour trees. The main advantage of this method is that it is very robust to changes in scale and imperfections. In our proposed method, we do not require a very high number of training examples, as a neural network does.
Some authors, like [
15], proposed a hybrid approach to logotype recognition using both global and local invariants. In their work, the use of global invariants serves to prune the logotype database initially, and then, the use of local invariants helps obtain a more precise match. Local features, in general, involve very precise and convolutional operations applied over the logo contour, which makes this kind of method very coupled with a particular environment. As another example of these hybrid approaches, Ref. [
16] used curvature and the distance to the centroid as local features and Zernike moments as global features. Then, similarities are computed using the Euclidean distance. Ref. [
17] described logos using a variant of shape context descriptors and indexing over a database. Ref. [
18] used several kinds of descriptors (Fourier transform, chain coded strings, etc.) to index and match over a trademark logotype database. As before, this approach did not perform well when occluded logos were present. Ref. [
19] presents a logo-spotting framework applied to spotting logo images in document images and focused on the document-categorization and document-retrieval problems. This method is focused in terms of searching for matches between all interest points of the query logo images and of document images. From the images, the interest points are extracted. The local feature vectors are described by local detectors and local descriptors. The experiments showed that blob detectors and spectra descriptors are the most suitable description technique to represent logos. They validated the performance of their approach on both standard and private databases, including the Tobaco800 set, and achieved significantly better performance than prior methods for logo spotting. More recent works, such as the one presented in [
20], also show very promising results using a Siamese neural network.
Logo detection, which is the extraction of logotypes inside a document with respect to letters and other graphical elements like signatures, has not received much attention from the research community, as far as we know. Ref. [
21] used feature vectors with statistics about the connected components in the logo to construct a rule-based system that performed the classification. The main problem of this approach is deriving the rules to be applied. Ref. [
22] is based on the segmentation and calculation of the spatial density of foreground pixels in document images. Ref. [
23] presented a method for logo detection exploiting contour-based features using a learning-based method to score the strings of contours and used some rules to localize and correct the logo.
The works of [
24,
25] present a simple, dynamic approach to logo detection and recognition based on the boundary extension of feature rectangles in document images with a framework that reorganizes the structure of the logo-detection and -recognition procedures and integrates them. We consider this technique very promising for its simplicity and the good results it yields, but it still has problems when noisy or low-quality logos are used. Because of this deficiency, we focus the research by providing a new strategy to cope with these problems, which is structured into four steps, this being the main contribution of the paper.
Authors such as [
26] have shown good results in terms of detection recall and recognition accuracy for the Tobacco database. However, during training, they used a manually chosen subset of 100 images as representative of all logos and their locations, and therefore, it is not a fully automated system.
In [
27], logo detection was performed by preprocessing the input document, searching for connected components, and classifying these components into logo and non-logo candidates.
The article [
28] serves as a crucial benchmark in the field of logo detection using deep learning techniques. Through a comprehensive and systematic review, the authors comprehensively addressed the most relevant approaches, promising neural network architectures, and significant datasets in this domain. Moreover, they provided a critical analysis of current challenges and outlined future trends, positioning this work as a fundamental resource for researchers, academics, and professionals in the fields of computer vision and image processing.
3. Materials and Methods
Our logo-detection approach is based on an extension to the feature rectangles method (FR) proposed by [
24]. As defined by their work, an FR is a rectangle with a minimum inner area that surrounds at least one foreground pixel, and its four edges consist of background pixels. The process of computing FRs can be summarized in the following list of steps:
Extract a set of every foreground pixel in the input image.
Place a 3 × 3 window around each pixel.
If not all pixels in the top window border are background pixels, expand the top edge by one pixel and repeat this step. If every pixel is a background pixel, go to step 4.
If not all pixels in the bottom window border are background pixels, expand the bottom edge by one pixel and repeat this step. If every pixel is a background pixel, go to step 5.
If not all pixels in the left window border are background pixels, expand the left edge by one pixel and repeat this step. If every pixel is a background pixel, go to step 6.
If not all pixels in the right window border are background pixels, expand the right edge by one pixel and repeat this step. If every pixel is a background pixel, the region is considered a candidate region
Our main enhancements with respect to this method reside in two aspects. First, we do not scan the entire document looking for logotypes, so the number of false positives is reduced. Instead, we segment the document into regions with a high probability of containing a logotype, and we only expand the rectangles from those regions. Second, documents are pre-classified according to their level of image noise, and we apply specific morphological operations to those whose noise exceeds a given threshold. This reduces the number of FRs without impacting recognition, providing a look-ahead value, which we will introduce later, used before closing a rectangle.
One of the situations where the standard FR method does not perform well is when the logo is formed by two or more components separated by a small margin. Typically, one of those components is the logotype itself, and the other is the name of the company, organization, or group that the logo represents. The standard FR method has problems detecting these X-Y separated logos, as mentioned by [
24]. With that method, only one part of the logo is detected, the graphical part, with no text, as we can see in
Figure 1a. With our method, the full logo (image, picture, and text) is detected. We accomplish this by proposing that a region edge does not stop expanding when it is formed exclusively by background pixels. Instead, it may expand from one or many or its sides, depending on the initial shape of the region.
Figure 1b is an example of the result of the modified extended rectangle method. Using the modified extended rectangle method, the logotype includes its text label, whereas in the original method, only the graphical part of the logotype is included. This is our main modification to the FR method, which we will describe along with the rest of our proposed detection framework in the following subsections.
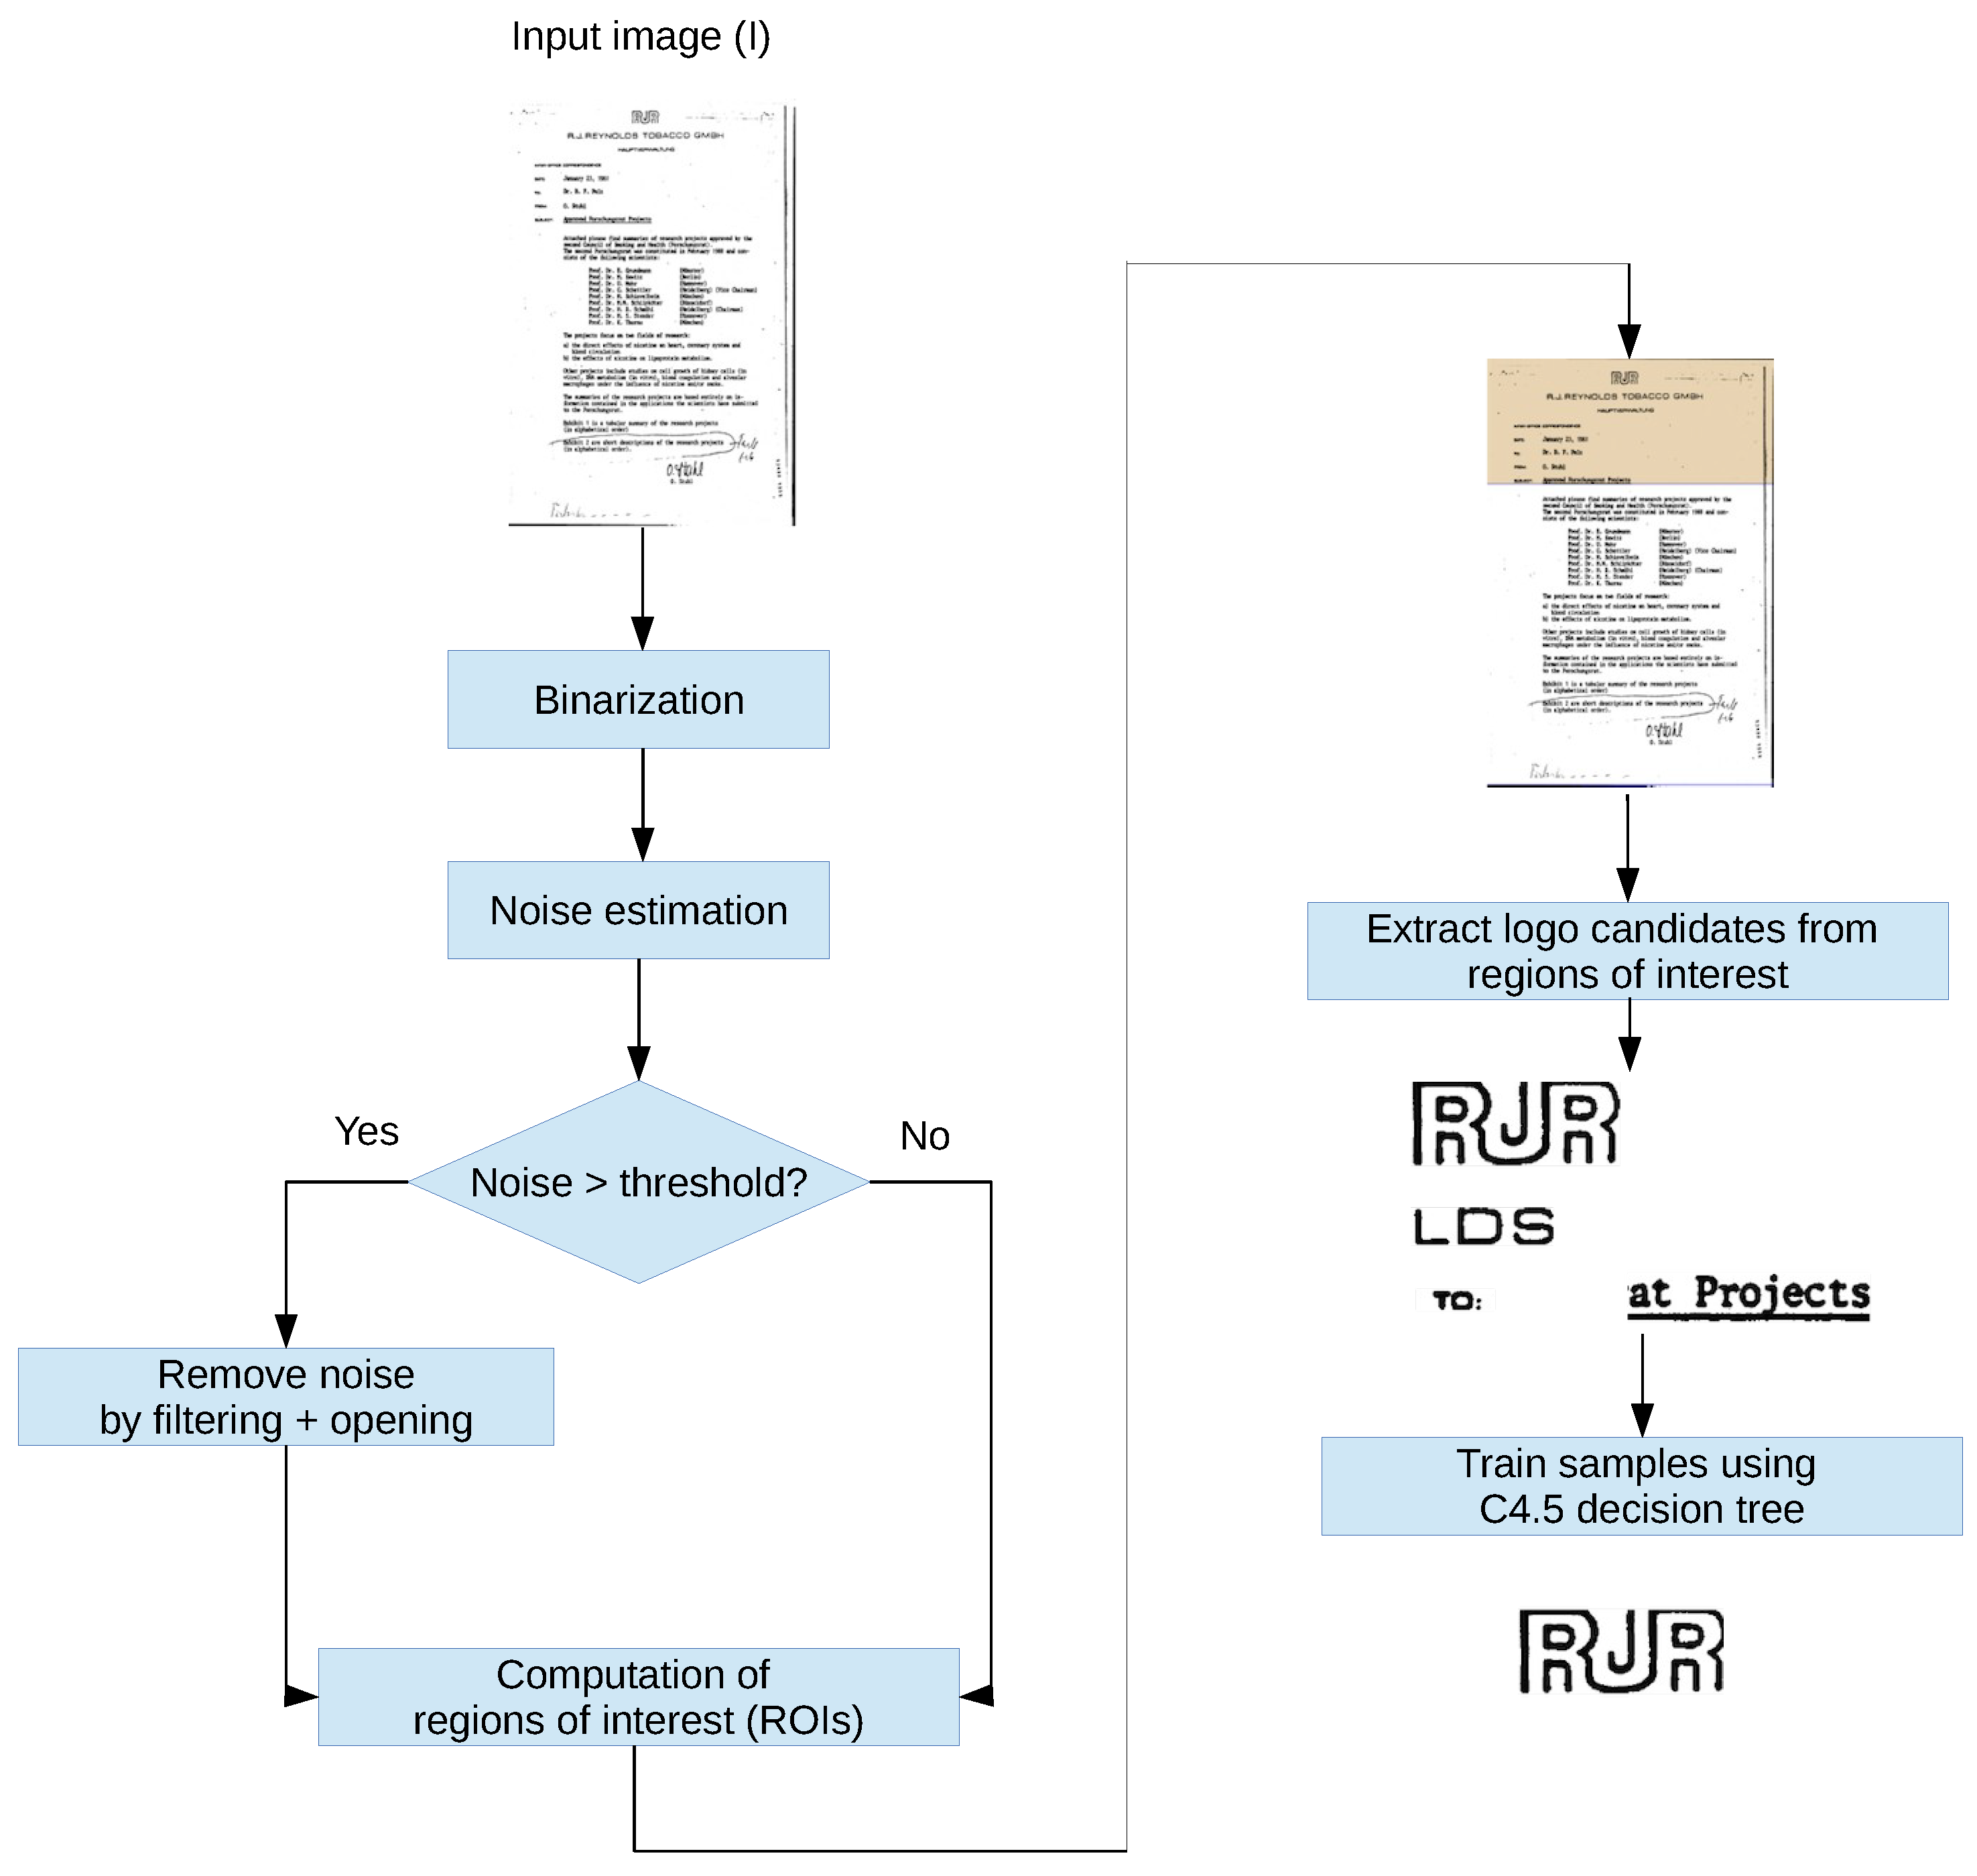
In short, our method consists of the following steps:
Binarization: Images are binarized using the Otsu method [
29].
Noise estimation and image enhancement: document noise level estimation and reduction.
Computation of regions of interest (ROIs): extraction of consecutive image rows with a very low number of foreground pixels at the top and bottom.
Extended feature rectangles with look-ahead: a modified feature rectangles expansion method.
Region feature vectors: A C4.5 decision tree is applied to train and test the system against a collection of documents.
The complete workflow is depicted in the flow diagram of
Figure 2, and a detailed explanation of each stage of our method is presented next.
3.1. Binarization
As a first step, the images are binarized using the well-known Otsu method [
29]. This method binarizes the image according to an automatically calculated threshold, generating a black and white image.
The selection of this threshold is based on [
30], where the Otsu algorithm was applied to the image difference result to extract the logo region and classify the logo type using the SURF function, k-means grouping, and a support vector machine (SVM). In [
31], the Otsu algorithm assumes that the image includes two different kinds of pixels: one is an object (pixels in the foreground), and the other is the background (background pixels). Then, it finds the optimal threshold using an averaging method to separate the object from the background and obtain a binary image. Binarization is a previous step to the design of the algorithm and has been chosen due to its simplicity and speed.
3.2. Noise Estimation and Image Enhancement
Noise is one of the main impediments for a logotype-extraction algorithm to perform well with certain input images. In this context, noise is defined as spurious foreground pixels that can prevent true logos from being recognized, because a great part of the logotype extraction methods available in the literature is based on some properties of foreground pixels. Additionally, this high number of extraneous foreground pixels also makes the algorithm consume more processing time than necessary. On the other hand, image enhancement cannot be applied uniformly to the entire image set because noise is, by nature, a non-uniform feature of images.
Our proposal for image enhancement is preceded by a split of the image set into two categories: images with a high level of random noise and images with a low level of random noise. Image-enhancement techniques for reducing image noise are only applied to images in the first set, not the second one.
The first step considered in order to attempt the normalization of the image is to apply Local Normalization. Local Normalization tends to uniformize the mean and variance of an image around a local neighborhood [
32]. In order to estimate the level of noise in an image, we use the method presented first by [
33]. A second derivative Laplacian operator
K, used in contour extraction, is applied to the entire image:
The standard deviation of the noise,
, is calculated as the sum of the absolute values of the intensity image convolved with this Laplacian operator. We use the coefficients proposed by [
33] to compute the scaled-down value, where
W and
H are the image width and height, respectively:
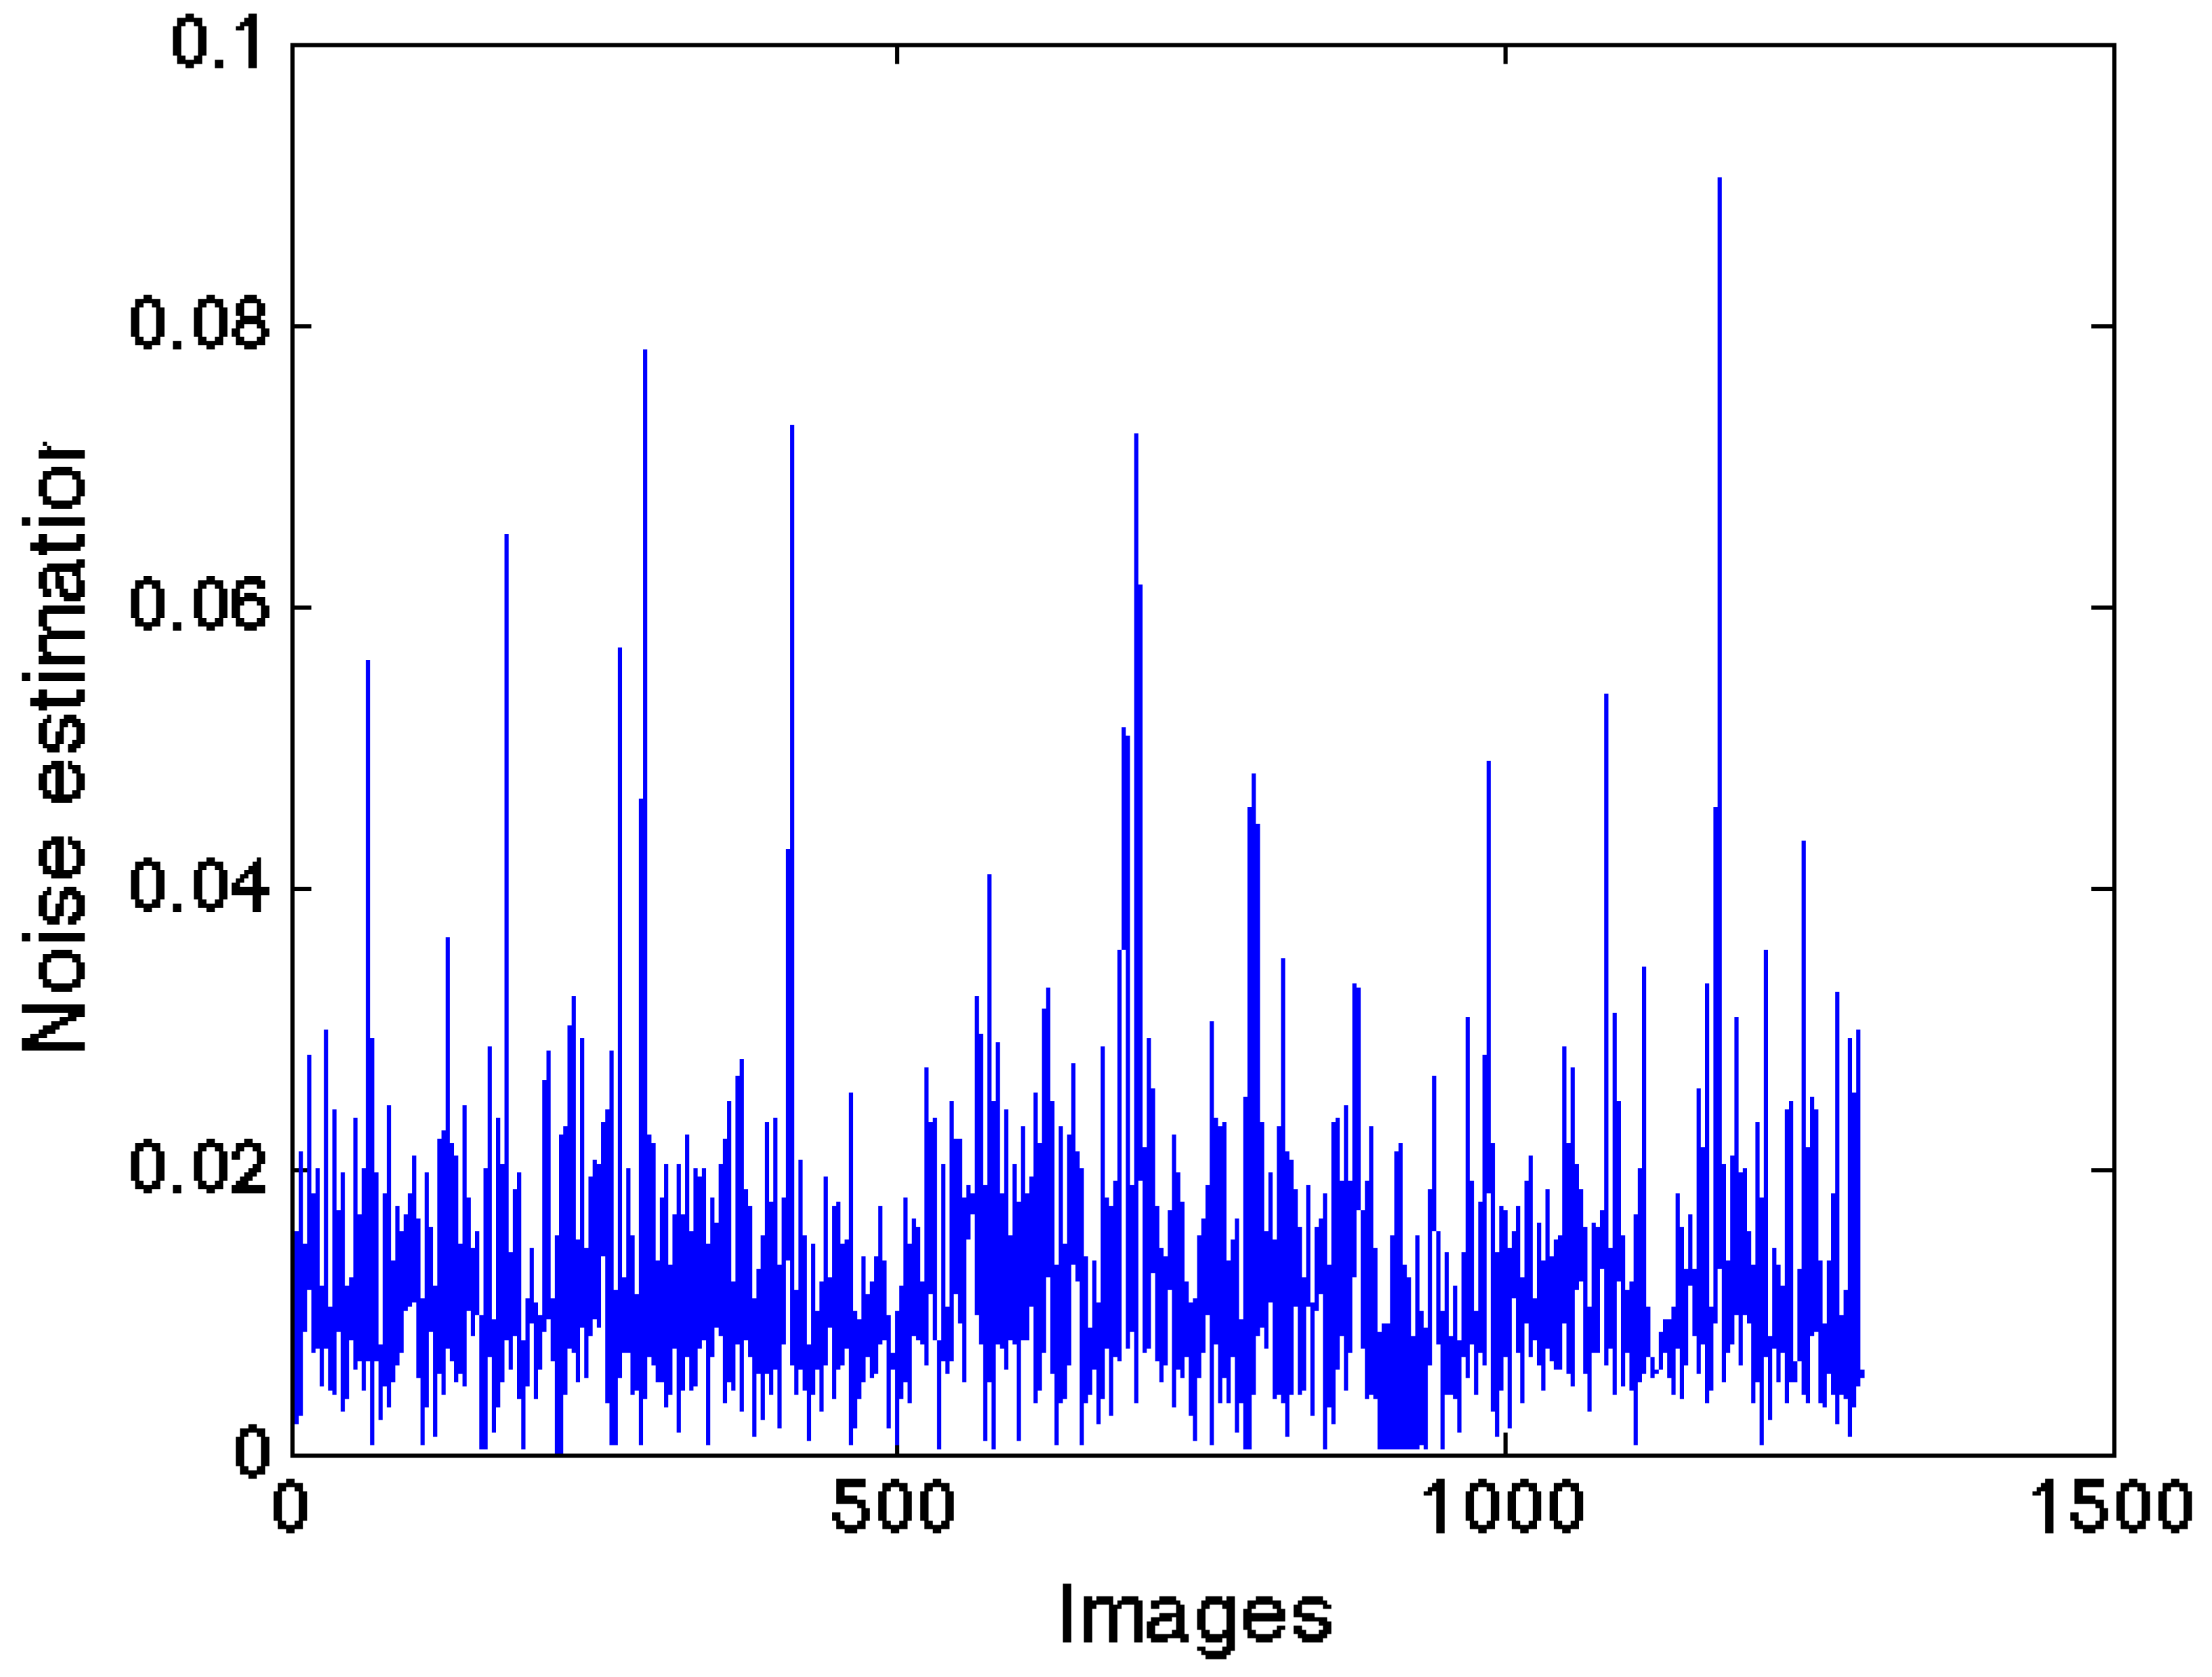
Immerkaer’s noise-estimation algorithm is applied to the image set in order to obtain an estimation of the standard deviation of the noise for each image. We assume that images with a high level of noise can be considered outliers in a random document test set. Thus, the set of standard deviations of the noise is processed using Thompson’s Tau criterion [
34] to detect outliers. The threshold is set to the median of the outliers, and the group of images is divided in two categories, one for “noisy” documents (those with a
value greater than the threshold) and one for “non-noisy” documents (those with a
value less than or equal to the threshold).
Images in the “noisy” category are enhanced by the application of the following operations:
A bilateral filter operation, which is a non-linear, edge-preserving and noise-reducing filter, is first applied to the raw image. We used it with a spatial spread of 10 and a pixel value spread of 0.2, in order to reduce the number of noise spots that will interfere with the extended feature rectangle algorithm. Bilateral filtering was selected because of its property of smoothing images while preserving edges, which are very important for the logos to be correctly extracted. According to our experimentation, a spatial spread value of 10 better respected the logotype edges and smoothed larger features of the image. A pixel value spread of 0.2 reduced false positives by 2% with respect to larger values.
Next, an opening operation (erosion followed by dilation) is applied on the inverted image, where the background appears in black and the logo, noise, and text in white, using a disk-shaped structuring element. This operation will eliminate elements from the image whose radius is less than the radius of the structuring element. The structuring element that we used was a disk of radius 5. We chose that circular element because we consider the geometric forms of image noise to be random, so there is no strong evidence to use a particular shape over the others. Moreover, it acts equally in all spatial directions where noise can appear. Experimental results have demonstrated that a disk of size 5 suffices for the document resolution. Sizes greater than 5 are overly aggressive, removing parts of the candidate logos. On the contrary, sizes less than 5 still preserve undesired noisy parts. A trade-off is required between the size of the structuring element and the image resolutions, so that the main parts of the logo are preserved, although some parts of the text are damaged. This is achieved with the proposed size of the structuring element.
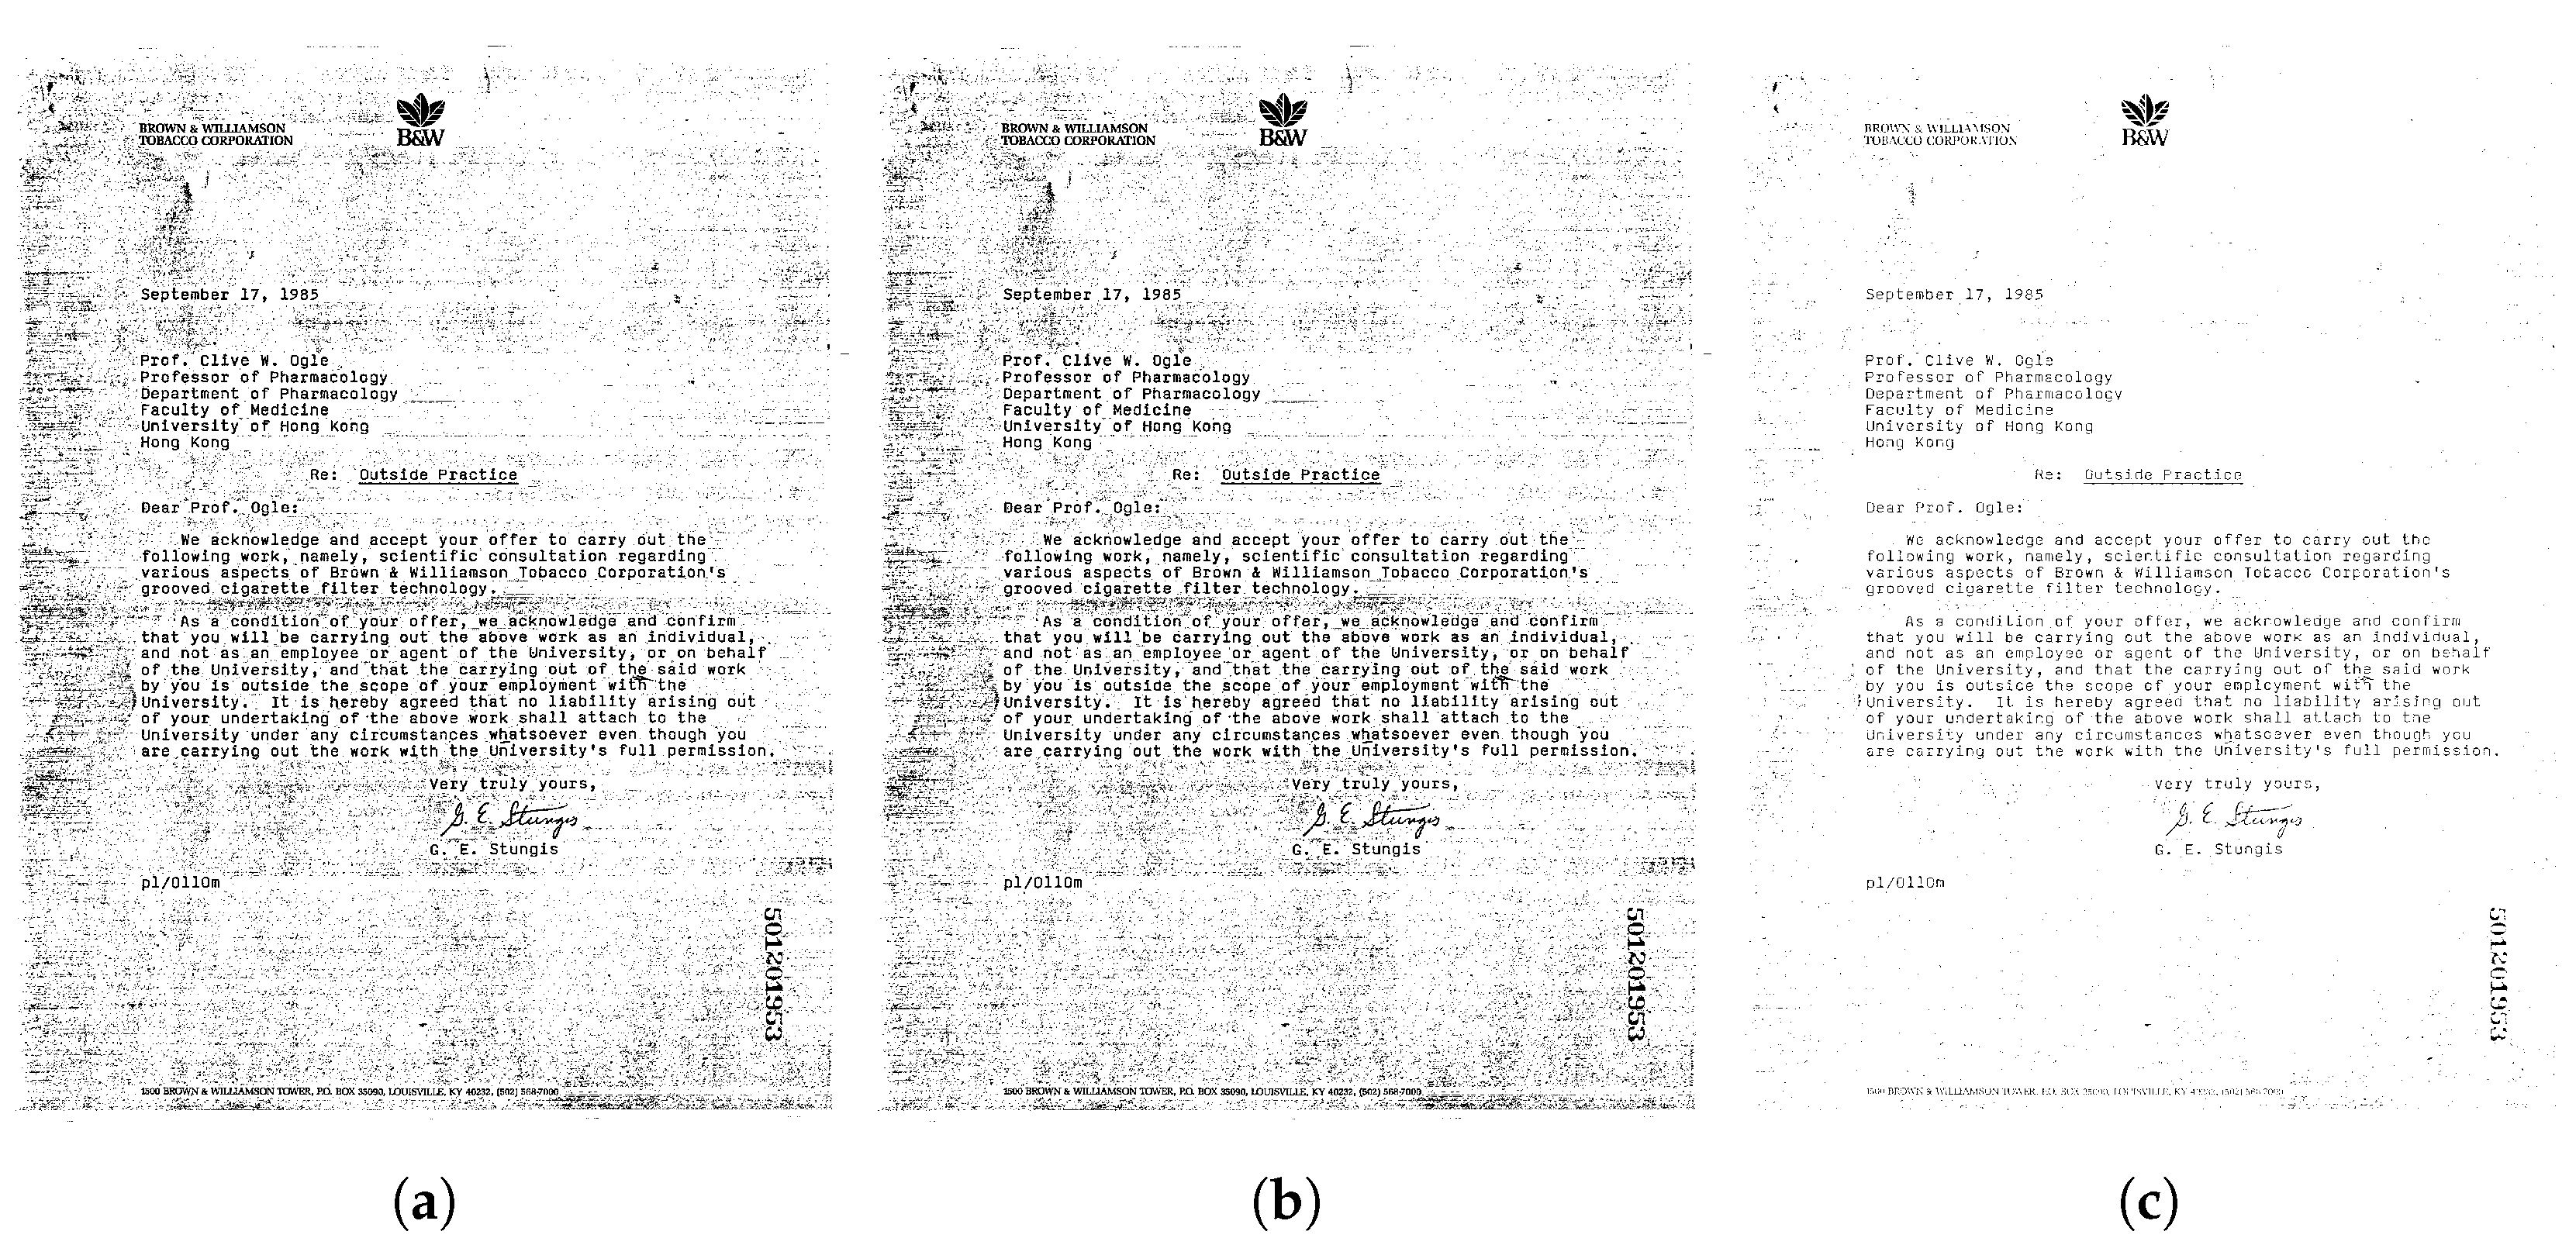
Figure 3a shows a sample document from the training set.
Figure 3b shows the same document, slightly smoothed after bilateral filtering has been applied.
Figure 3c shows the result of the opening operation, which is a more relevant operation than bilateral filtering.
The output of this phase is the input of the ROI calculation phase, described next.
3.3. Computation of Regions of Interest (ROIs)
The next step of the process involves using a heuristic based on human observation, derived from the characteristics of official documents, to compute regions of interest where a logo is expected to be placed with higher probability. If the logo is not in this region, it will not be detected. Given the nature of official documents, where the central part is dedicated to textual information, we can certainly expect the logo to not be placed close to the central part.
In order to accurately extract an upper and lower region from the document and, at the same time, keep a high probability for those regions to contain a logo, we apply an algorithm for the classical longest increasing run problem, with the additional restriction that we only consider runs of consecutive integers. We should distinguish between the longest increasing subsequence, where the elements need not be consecutive, and the longest increasing run, where the elements must be consecutive. In our problem, the numbers in the sequence are the row numbers of those rows in the image that contain background pixels exclusively, and the longest increasing run is the biggest block of consecutive rows exclusively formed by background pixels. Our idea is that, as logos are meant to be noticeable, logo and non-logo elements in a document are separated by big blocks of background pixels.
The longest increasing consecutive run problem is a well-studied problem in computer science and can be formally defined as follows:
Definition 1. The longest increasing consecutive run of a sequence of m integers is a subsequence of k elements, where and .
The solution to this problem, applied to the particular context of logo spatial identification, is defined in Algorithm 1.
| Algorithm 1 Longest increasing consecutive run algorithm to extract ROIs |
- 1:
function ExtractROI (Image) - 2:
vector V← empty - 3:
for all row in Image do - 4:
if then - 5:
Store in vector V - 6:
← 0 - 7:
← 0 - 8:
for ← 2 to do - 9:
if then - 10:
← +1 - 11:
else - 12:
= 0 - 13:
if then - 14:
← - 15:
← - - 16:
return
|
The algorithm works as follows:
The algorithm receives an image from which it extracts the largest block of consecutive rows with a number of black pixels greater than 1%. To do this, it stores in vector V the index of all the rows that meet this property (lines 2 to 5) and, then, goes through said vector V measuring the size of the blocks, , and selecting the largest, , returning the index where said block begins (lines 6 to 16).
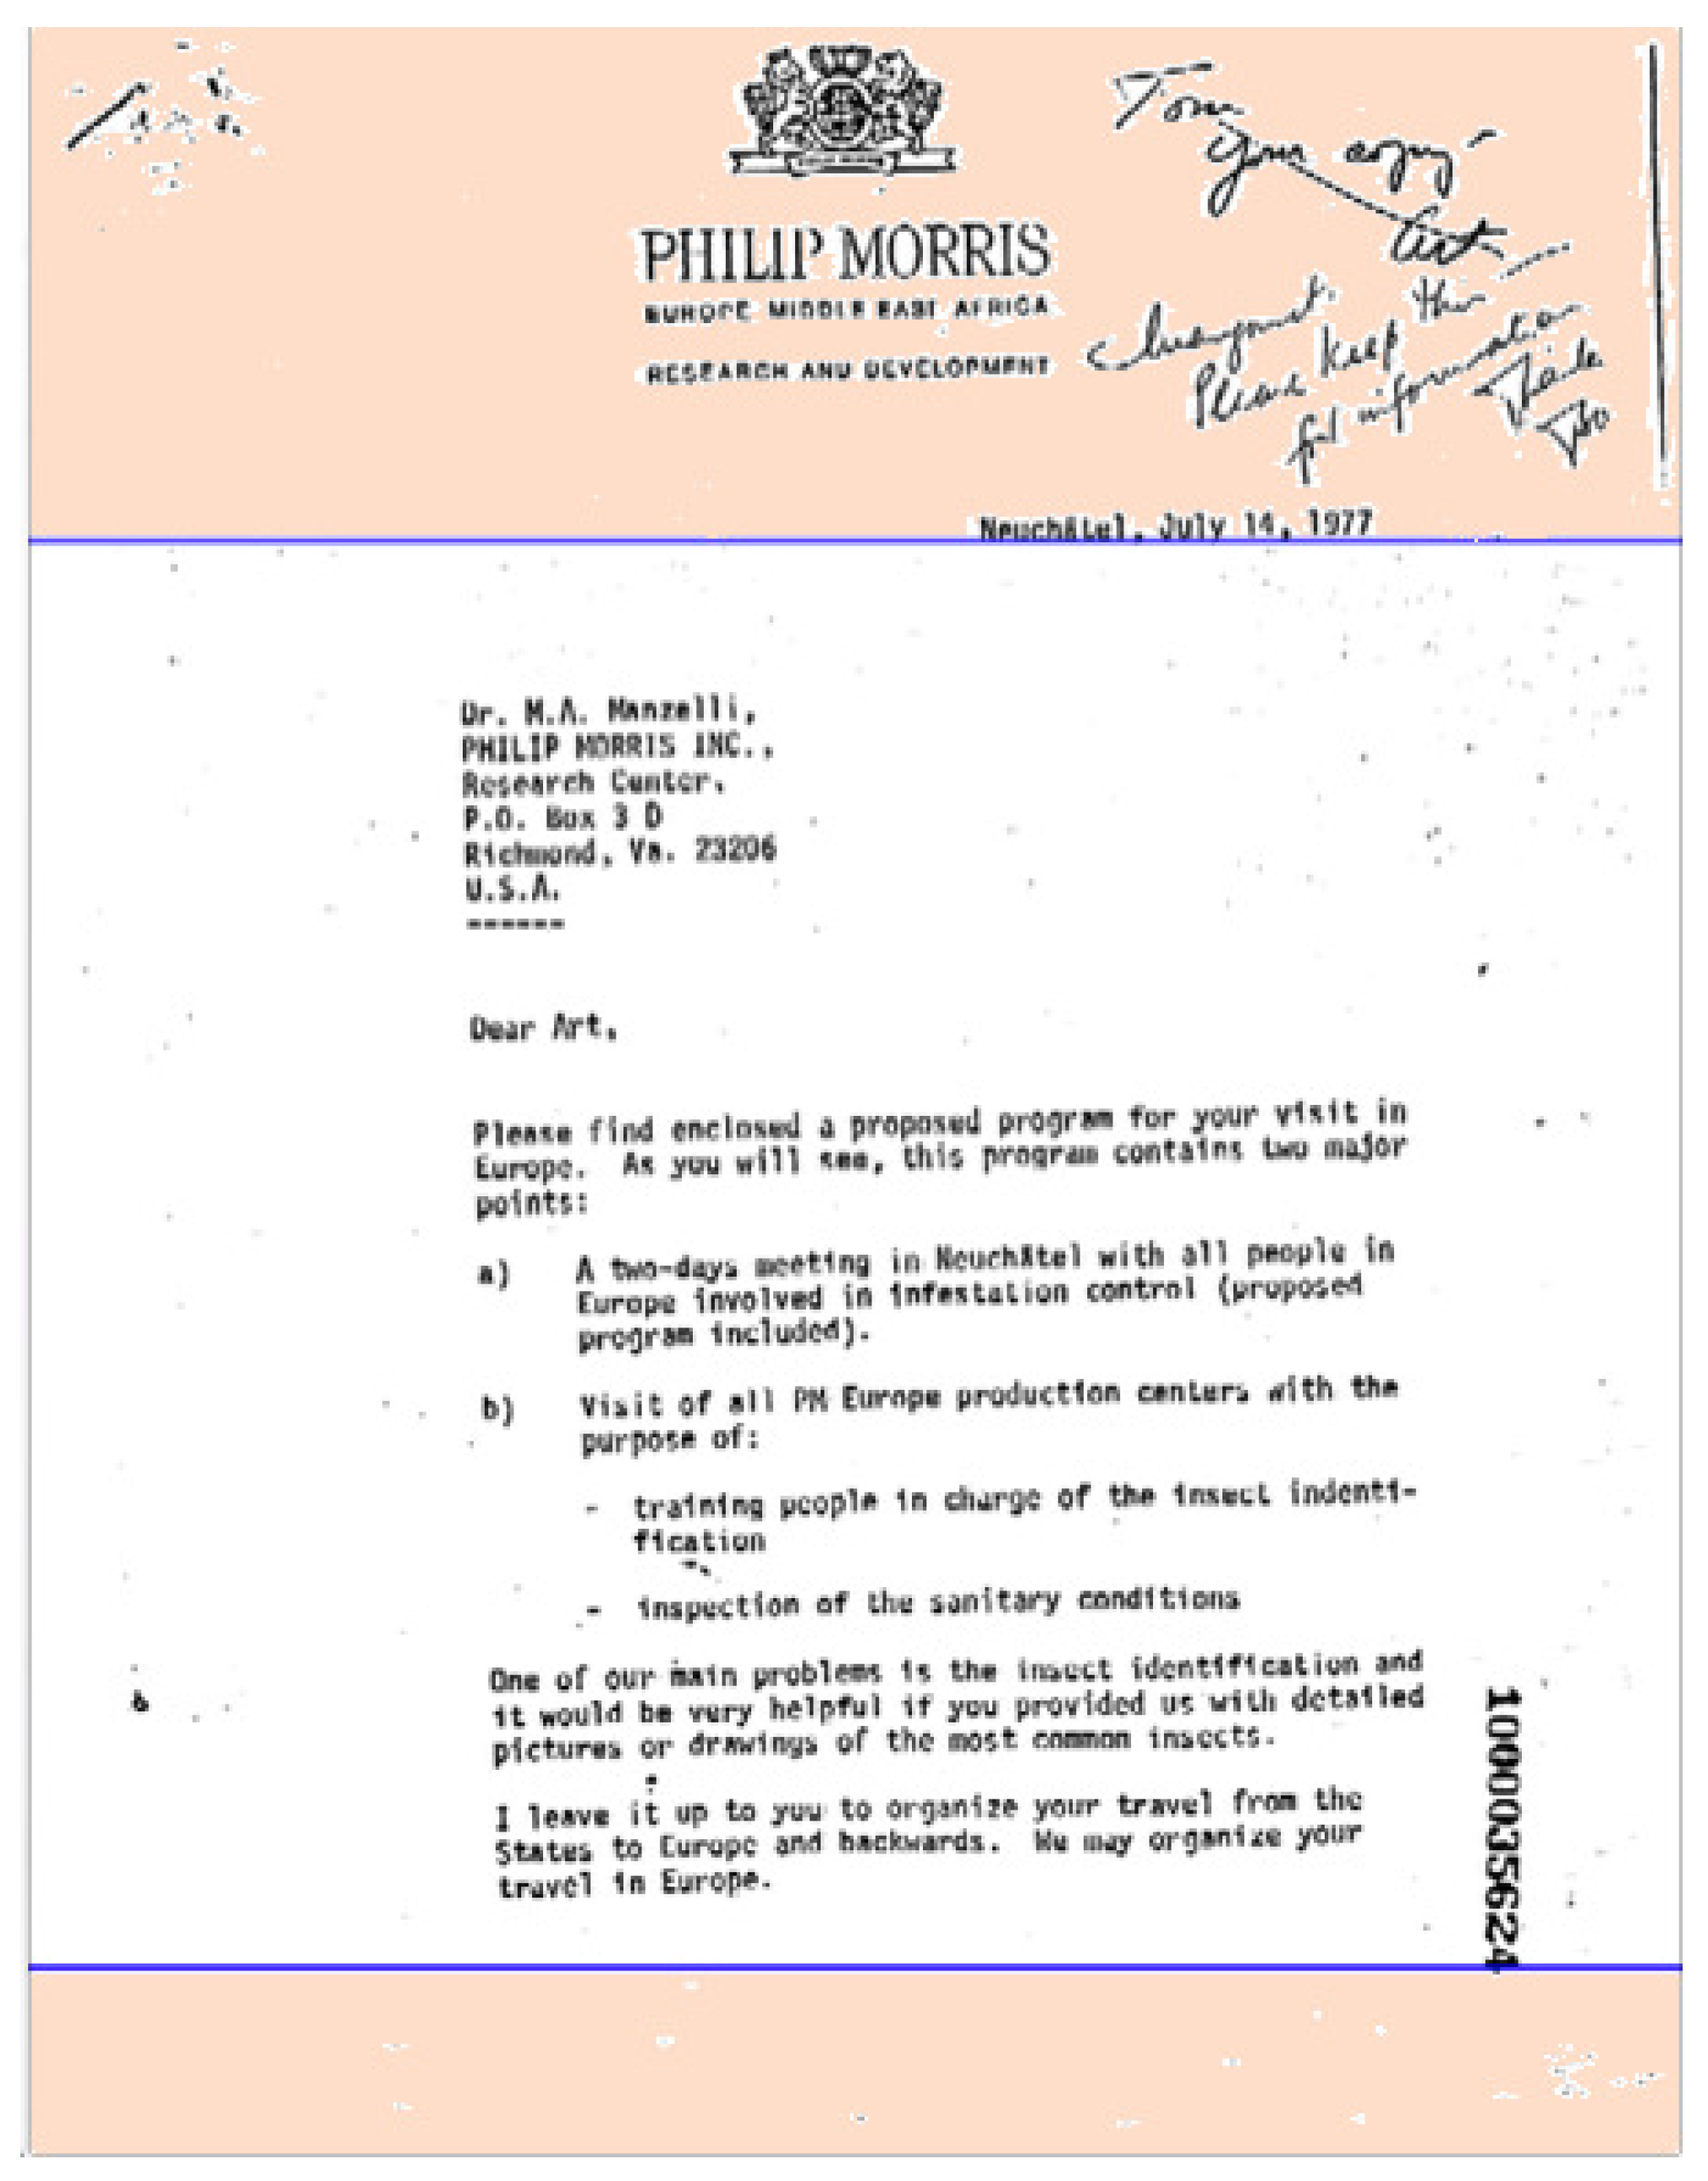
We apply this algorithm to both the upper half and lower half of the document. The output is, thus, a pair of
y-coordinates (one from each half of the document) that delimit the upper and lower regions where a logo is expected to be found with the most probability. A representative image, from the set of images analyzed, is displayed in
Figure 4. It shows, delimited with blue lines, once the proposed procedure has been applied, those regions in a document from the test set.
3.4. Extended Feature Rectangles with Look-Ahead
Once the regions of interest have been delimited, we modified the feature rectangles method (FR), explained at the beginning of this section, to select those regions that are candidates to be a logotype. When we first encounter the situation when an edge is formed entirely by background pixels, we record the width and height of the region so far and compute its height and width. This gives us an estimation of the general shape of the logotype, and we use that information to expand the initial logotype region from the sides. According to the height and width, we can distinguish between logotypes taller than wider, logotypes wider than taller, and almost square logotypes. Consequently, we have used the following expressions to compute the amount of pixels to expand the initial feature rectangle as a maximum. This is because we want our top and bottom limits to be linearly dependent on the region height and our left and right limits linearly dependent on the region width.
In our method, instead of stopping the edge expansion at the same point as the feature rectangles method, we iteratively check if the edge placed at one pixel of distance from the original one is formed entirely by background pixels, and we repeat this process at two pixels of distance, three pixels of distance, and so forth, until the top and bottom limits are reached. This gives the algorithm the opportunity to extract logotypes formed by multiple parts.
3.5. Region Feature Vectors
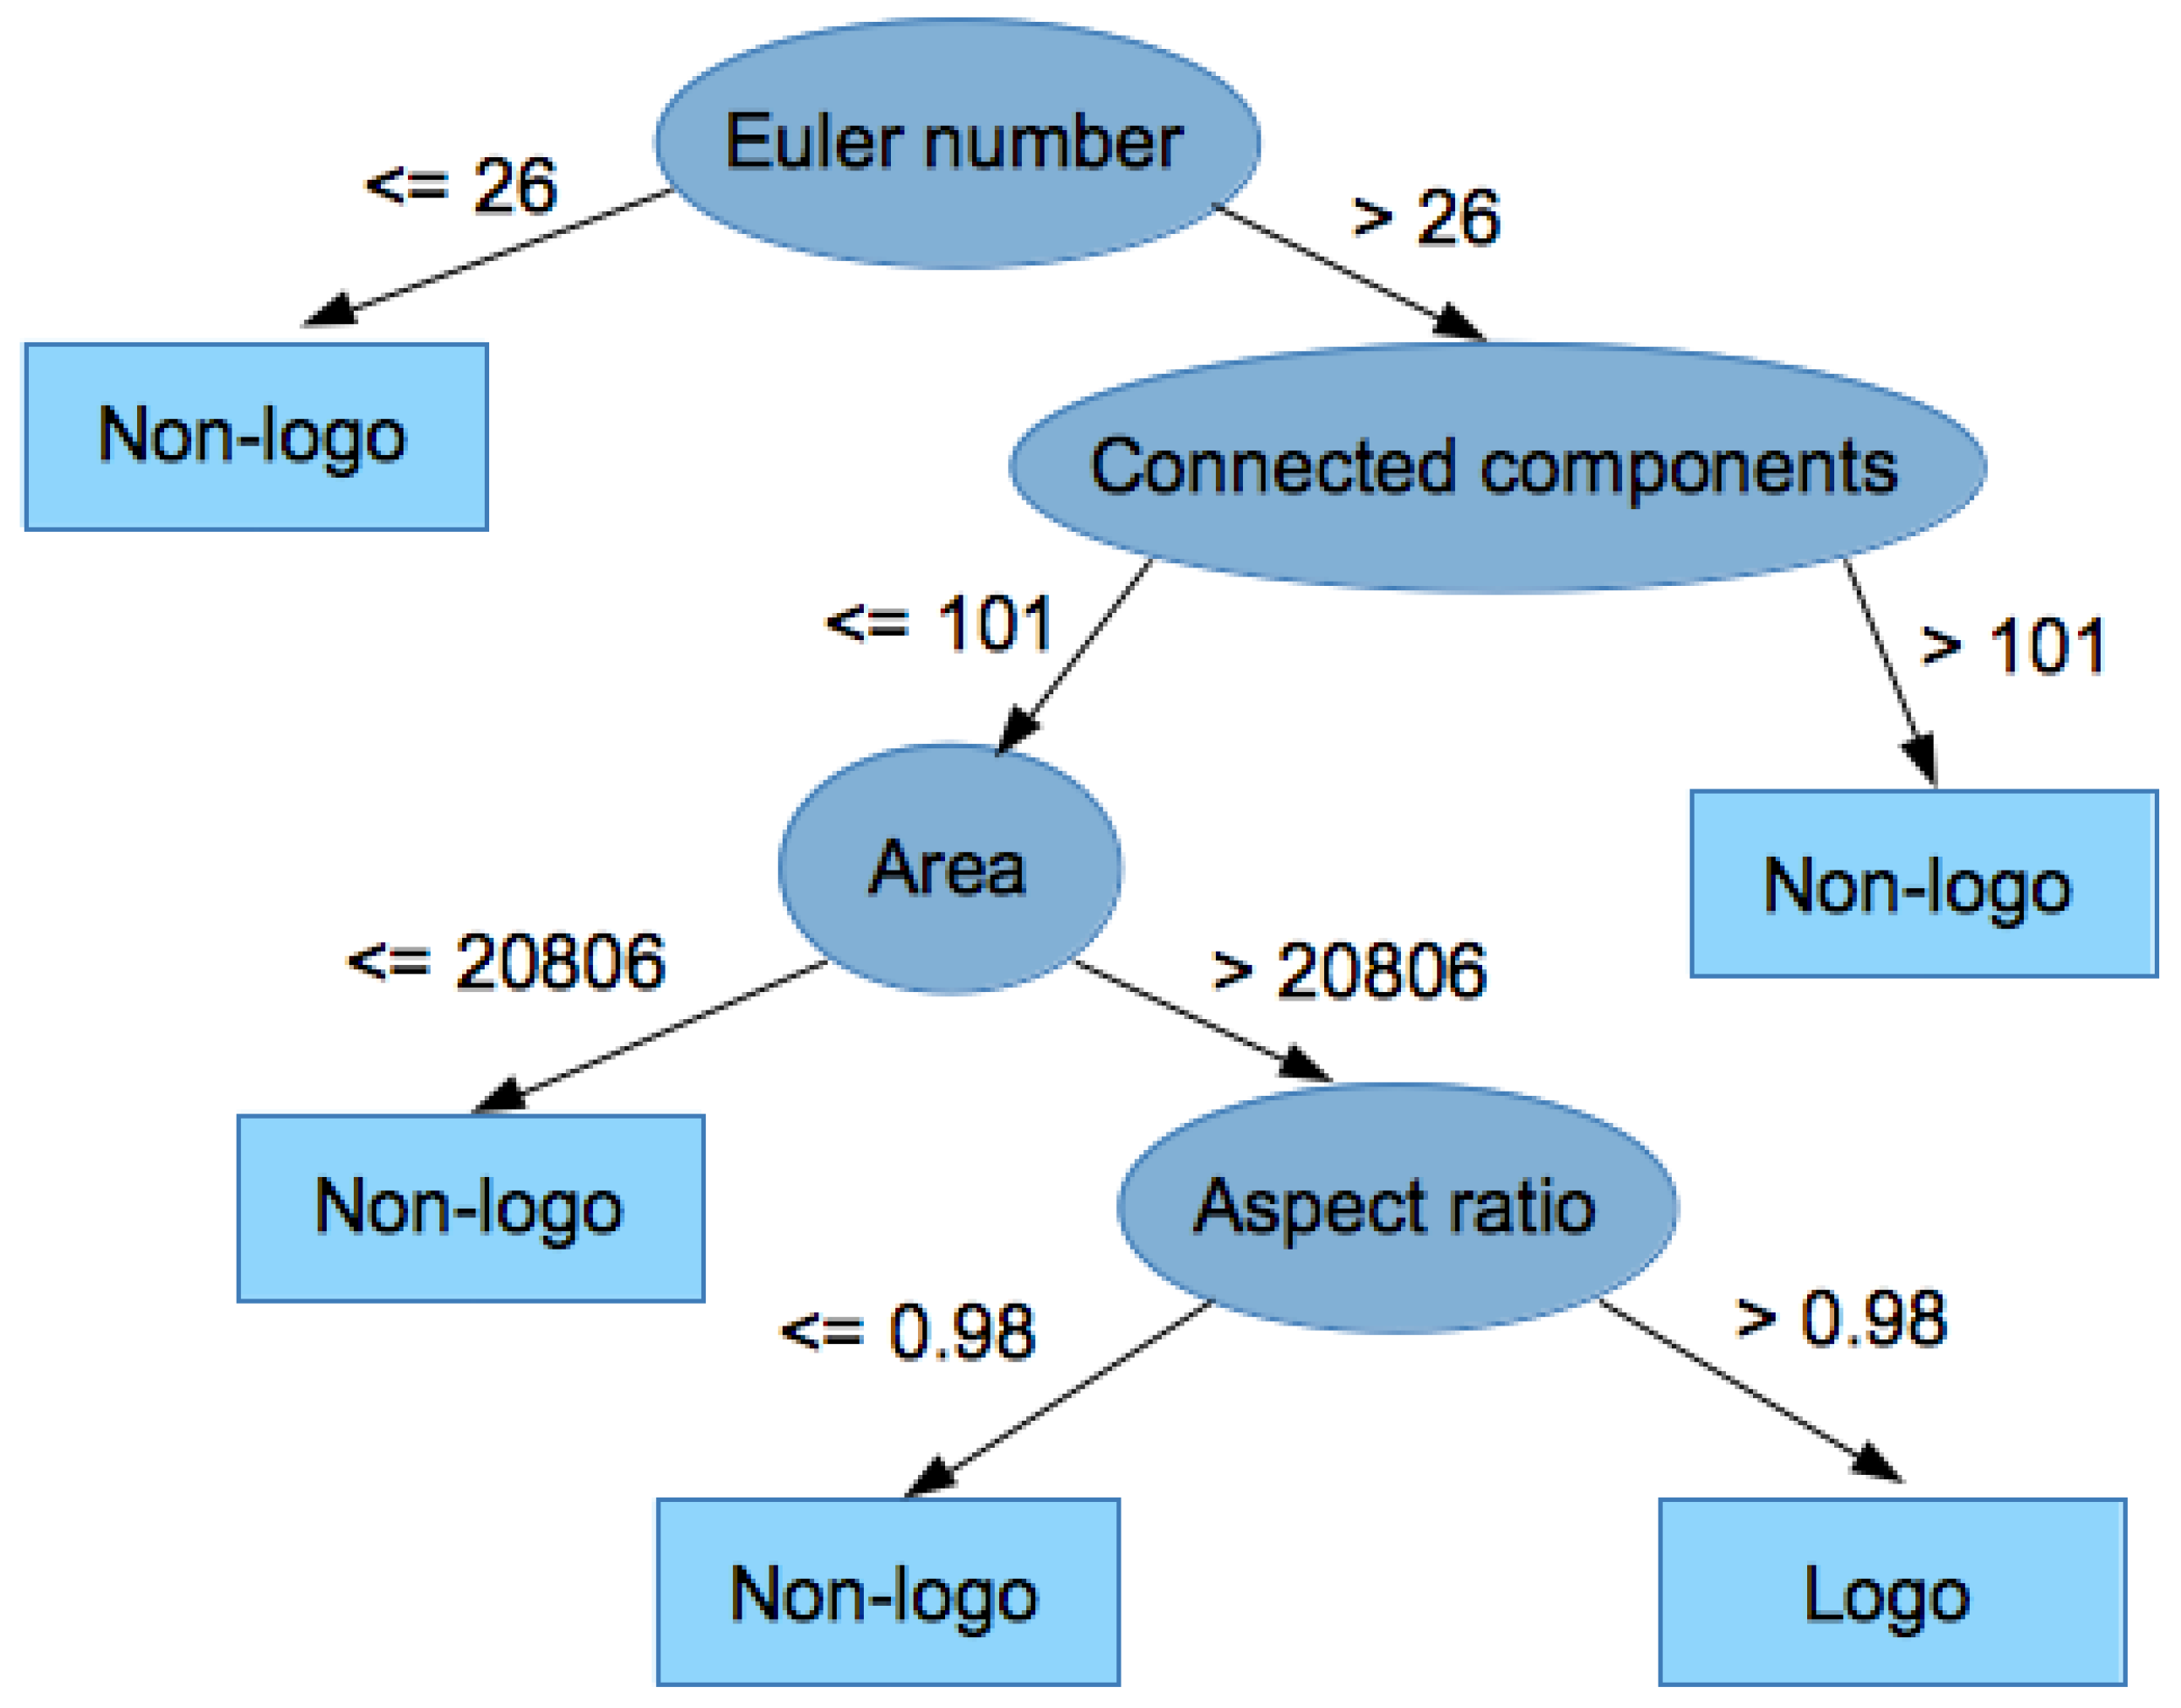
In order to perform classification over the test set, a feature vector for each candidate logo region was extracted. The features that we used for this vector were the Euler number, region area, connected components, and aspect ratio. These attributes are calculated based on relative measures and not absolute ones, making the size of the logo not relevant for its detection.
Euler number: The Euler number of a binary image is defined as the total number of objects in an image minus the total number of holes in those objects. The Euler number has been previously used in OCR applications [
35] to distinguish between letters and non-letters, and we use it in this paper to distinguish between logos and non-logos, which are expected to be formed by letters (signatures, body text, dates, etc.) with a very high probability because we are working in the domain of official documents.
Region area: We define the region area of a candidate as follows, where we used the value of the width and height of our region:
Connected components: Let B be a binary image, and let , where . Then, the pixel is connected to the pixel with respect to v if there is a sequence of pixels , all of them equal to , that forms a connected path from to . A connected component in B is a set of pixels .
A connected components labeling of B is another image in which the value of each pixel is the label of its connected component. In our experiment, we extracted connected components with a neighborhood of 8 pixels.
Aspect ratio: This is the relationship between the image width and height.
3.6. C4.5 Decision Tree
Logo classification could be performed with numerous expert systems, including neural networks or Bayesian networks. However, in the case of neural networks, they were initially discarded because they require a very large number of images for training, increasing the complexity of learning. Logo detection offers good results using simpler classifiers such as the C4.5-type decision tree [
36], as can be seen in this research. The configuration of the C4.5 classifier was as follows: a confidence factor of 0.25 and with a minimum number of instances per leaf of 2. We selected a decision tree, introducing the above attributes, for this problem because it is fast and can perform well in bi-class problems. Bayesian networks were also considered promising for solving our problem; however, they performed worse for our particular problem than a C4.5 decision tree, both in terms of precision, which was 3% worse, and recall, which was 2% worse.
We chose a low value for the confidence factor to prune the tree more aggressively. Higher values for this confidence factor led to keeping more leaves and branches in the tree, and that did not contribute to its predictive accuracy. For comparison purposes, we chose the well-known SVM bi-class classifier. It is a powerful tool for solving bi-classification problems and also allows a direct comparison against the also bi-class C4.5 classifier [
37]. A support vector machine (SVM) with a radial basis function kernel had a 2% worse precision and recall. The radial basis function was chosen because of its outperformance with respect to other classical kernels (linear, polynomial, and sigmoidal) [
38]. The regularization cost parameters involved in the SVM have been set after experimentation to a value of 2000, i.e., a value high enough, as reported in the literature [
39]. There is no consensus or unique criterion in the scientific community to set the value of this parameter.
The steps of our proposed logotype-detection algorithm are represented in
Figure 5, where the image in
Figure 5a is the input document. In
Figure 5b, we obtain the result after computing regions of interest marked in light brown, with the algorithm explained in
Section 3.3. In
Figure 5c, we applied the logo-detection method (
Section 3.4) exclusively to the regions of interest, where the candidates are marked in red. These candidates are extracted in
Figure 5d. Finally, in
Figure 5e, we obtain the valid logo using the feature vector described in
Section 3.5.
Figure 6 shows different documents, whereas, in
Figure 6a, the possible logos are marked in red and in
Figure 6b,c, the final result of the logos detected is shown.
5. Conclusions and Future Work
In this paper, we presented a new method for logotype detection. The extraction of candidates is based on the feature rectangles method because of its performance and simplicity. Our proposed method makes use of positional information about logotypes in official documents and enhances images with a high level of noise. The use of positional information speeds up the process significantly with a low risk of losing logo candidates. This also lets the system work with different parts of an image independently, potentially in parallel, increasing the rate of processing of documents. The regions of interest are selected efficiently using a horizontal profile from the image and blank line separations, making it possible to extend this idea to other kinds of computer vision processing over documents. In the classification stage, we used a simple and efficient decision tree, but we introduced the Euler number as a feature. According to our experiments, the Euler number is a feature that performs well in logotype-detection problems, especially when we want to quickly discard regions that are not a logotype.
Our algorithm offers a precision of 98.9% and a recall of 89.9% in logo detention, which corresponds to an increase of 3.5% and 5.3%, respectively, with respect to other similar methods available in the literature, which makes our method a good candidate for the logo-detection problem.
Possible future work could be the identification of more than one logotype in a document. Also, we have identified that occlusions are problematic because our proposed features depend on a clear view of a given logotype.


