Abstract
Transfer learning has gained significant traction in natural language processing due to the emergence of state-of-the-art pre-trained language models (PLMs). Unlike traditional word embedding methods such as TF-IDF and Word2Vec, PLMs are context-dependent and outperform conventional techniques when fine-tuned for specific tasks. This paper proposes an innovative hard voting classifier to enhance crash severity classification by combining machine learning and deep learning models with various word embedding techniques, including BERT, RoBERTa, Word2Vec, and TF-IDF. Our study involves two comprehensive experiments using motorists’ crash data from the Missouri State Highway Patrol. The first experiment evaluates the performance of three machine learning models—XGBoost (XGB), random forest (RF), and naive Bayes (NB)—paired with TF-IDF, Word2Vec, and BERT feature extraction techniques. Additionally, BERT and RoBERTa are fine-tuned with a Bidirectional Long Short-Term Memory (Bi-LSTM) classification model. All models are initially evaluated on the original dataset. The second experiment repeats the evaluation using an augmented dataset to address the severe data imbalance. The results from the original dataset show strong performance for all models in the “Fatal” and “Personal Injury” classes but a poor classification of the minority “Property Damage” class. In the augmented dataset, while the models continued to excel with the majority classes, only XGB/TFIDF and BERT-LSTM showed improved performance for the minority class. The ensemble model outperformed individual models in both datasets, achieving an F1 score of 99% for “Fatal” and “Personal Injury” and 62% for “Property Damage” on the augmented dataset. These findings suggest that ensemble models, combined with data augmentation, are highly effective for crash severity classification and potentially other textual classification tasks.
1. Introduction
Natural language processing (NLP) and artificial intelligence have provided new opportunities for acquiring knowledge from unstructured raw data. Text mining has become a promising tool to extract meaningful data in a world that generates 2.5 quintillion bytes every day [1]. Text mining involves constructing suitable models to retrieve effective, novel, valuable information scattered in the text to better organize information [2]. Several studies have been conducted to classify crash severity using statistical and machine learning methods. These methods can be divided into tabular/quantitative and textual/qualitative data approaches. The development in word embeddings such as TF-IDF [3] and Word2Vec [4] has facilitated text classification tasks. Furthermore, the recent emergence of pre-trained language models (PLMs) such as BERT [5], RoBERTa [6], and DeBERTa [7] has revealed promising results in text classification that outperformed traditional techniques such as TF-IDF and Word2Vec.
Transfer learning has recently become very popular in NLP applications [8]. It allows the model to utilize the knowledge captured from a source task to be fine-tuned to a downstream target task. Due to the data being scarce, inaccessible, or expensive to collect in some domains, transfer learning solutions provide a promising approach.
Most of the existing research focused on a single classifier to perform the classification task. Thus, incorporating multiple classifiers has been shown to improve many NLP applications. In particular, the ensemble technique has been proven to improve overall efficiency [9].
In transportation, NLP applications have attracted researchers in the last few years to carry out different tasks. For example, professional investigators determine crash severity through the available crash report derived from the crash scene. However, this process requires considerable effort, and expert subjectivity might affect the accuracy. The recent development in deep learning and NLP makes it possible to automate the analysis and classification of crash severity with a precision that may surpass human accuracy. Therefore, we aim to build a high-performance text classification model based on transfer learning that can be generalized for different traffic textual data.
The motivation for this research stems from the huge amount of textual data over the last few years. Further, recent studies point to the limitation of not considering the advancement of NLP tools. Another motivation is that previous work did not consider deploying several combinations of machine learning and NLP pairs to identify the most powerful combination. Moreover, an ensemble model is proposed in this work to improve the performance.
To the best of our knowledge, this is the first work that uses transfer learning and pre-trained transformers for crash severity classification. Further, our proposed ensemble strategy is the first of its kind applied to model crash severity classification and build an efficient model capable of dealing with noisy and informally written crash reports. Moreover, the previous studies in this domain have not compared a combination of different word embedding techniques with machine learning algorithms. Further, this study is the first use of BERT fine-tuned with Bidirectional Long Short-Term Memory (Bi-LSTM) for crash severity classification. The main contributions of this study are in the following aspects.
- We present an ensemble voting classifier for crash severity classification, which is constituted by machine learning and pre-trained transformers that are individually fine-tuned.
- We propose a comparison approach for crash severity classification using three feature extraction techniques (TF-IDF, Word2Vec, and BERT) combined with machine learning classifiers (random forest, XGBoost, and naive Bayes).
- We fine-tune the cutting-edge transformers BERT and RoBERTa using Bi-LSTM to model crash severity and analyze the performance.
- We demonstrate that the proposed ensemble technique outperforms the separate classifiers.
The rest of this paper is organized as follows. Section 2 presents the literature review. Section 3 gives an overview of the proposed methodology as well as a description of the dataset. Section 4 discusses the experiments. The results are discussed in Section 5, while the conclusions and future works are discussed in Section 6.
2. Literature Review
2.1. Transfer Learning and Pre-Trained Language Models
Transfer learning has been applied in different research areas such as image classification, video classification, sentiment analysis, and text classification among others [8]. This phenomenon allows the information gained in one domain to be used in another domain to improve the results of the target domain. Further, this task can be used in areas where the target training data are limited and using deep neural networks may result in overfitting. The concept of transfer learning resolved this issue by training deep neural networks on a very large dataset and using it on a similar target task with different data. These deep networks are known as pre-trained models and have been used in many domains for a long time [8]. In real life, there are many examples which relate to this concept. For example, a system that is trained to recognize large vehicles, with a little fine-tuning, can recognize small cars.
With the introduction of PLMs such as Bidirectional Encoder Representation from Transformers (BERT) [5] and its variants in 2018, transfer learning has become very popular in NLP PLMs work collaboratively, bidirectionally from left to right, on huge machines and large textual datasets to gain a deep language understanding and learn the context of the word based on the sentence and the surrounding words [10]. For example, BERT generates a different vector representation for the word “jam” in both the phrases “traffic jam” and “strawberry jam”, whereas TF-IDF and Word2Vec may have the same numeric representation which impacts the model understanding and performance. Therefore, PLMs were adapted to downstream tasks through fine-tuning methods and transfer learning.
Transformers overcome the computational bottleneck suffered by sequential text processing, such as convolutional neural networks and recurrent neural networks since they allow for parallelization which makes it possible to train a large amount of data. PLM-based models use deeper architecture compared with previous contextualized embedding and are fine-tuned on task-specific data [11]. Fine-tuning may involve freezing some layers and training the others, or in other scenarios, it may involve freezing the entire network and training the last classification layer [12]. These models have shown promising results in various NLP tasks compared with traditional techniques. The authors of ref. [13] stated that transfer learning performs much better than task-specific models. A variety of PLMs are found in the literature and have achieved promising results, such as DistilBERT, RoBERTa, and DeBERTa [8].
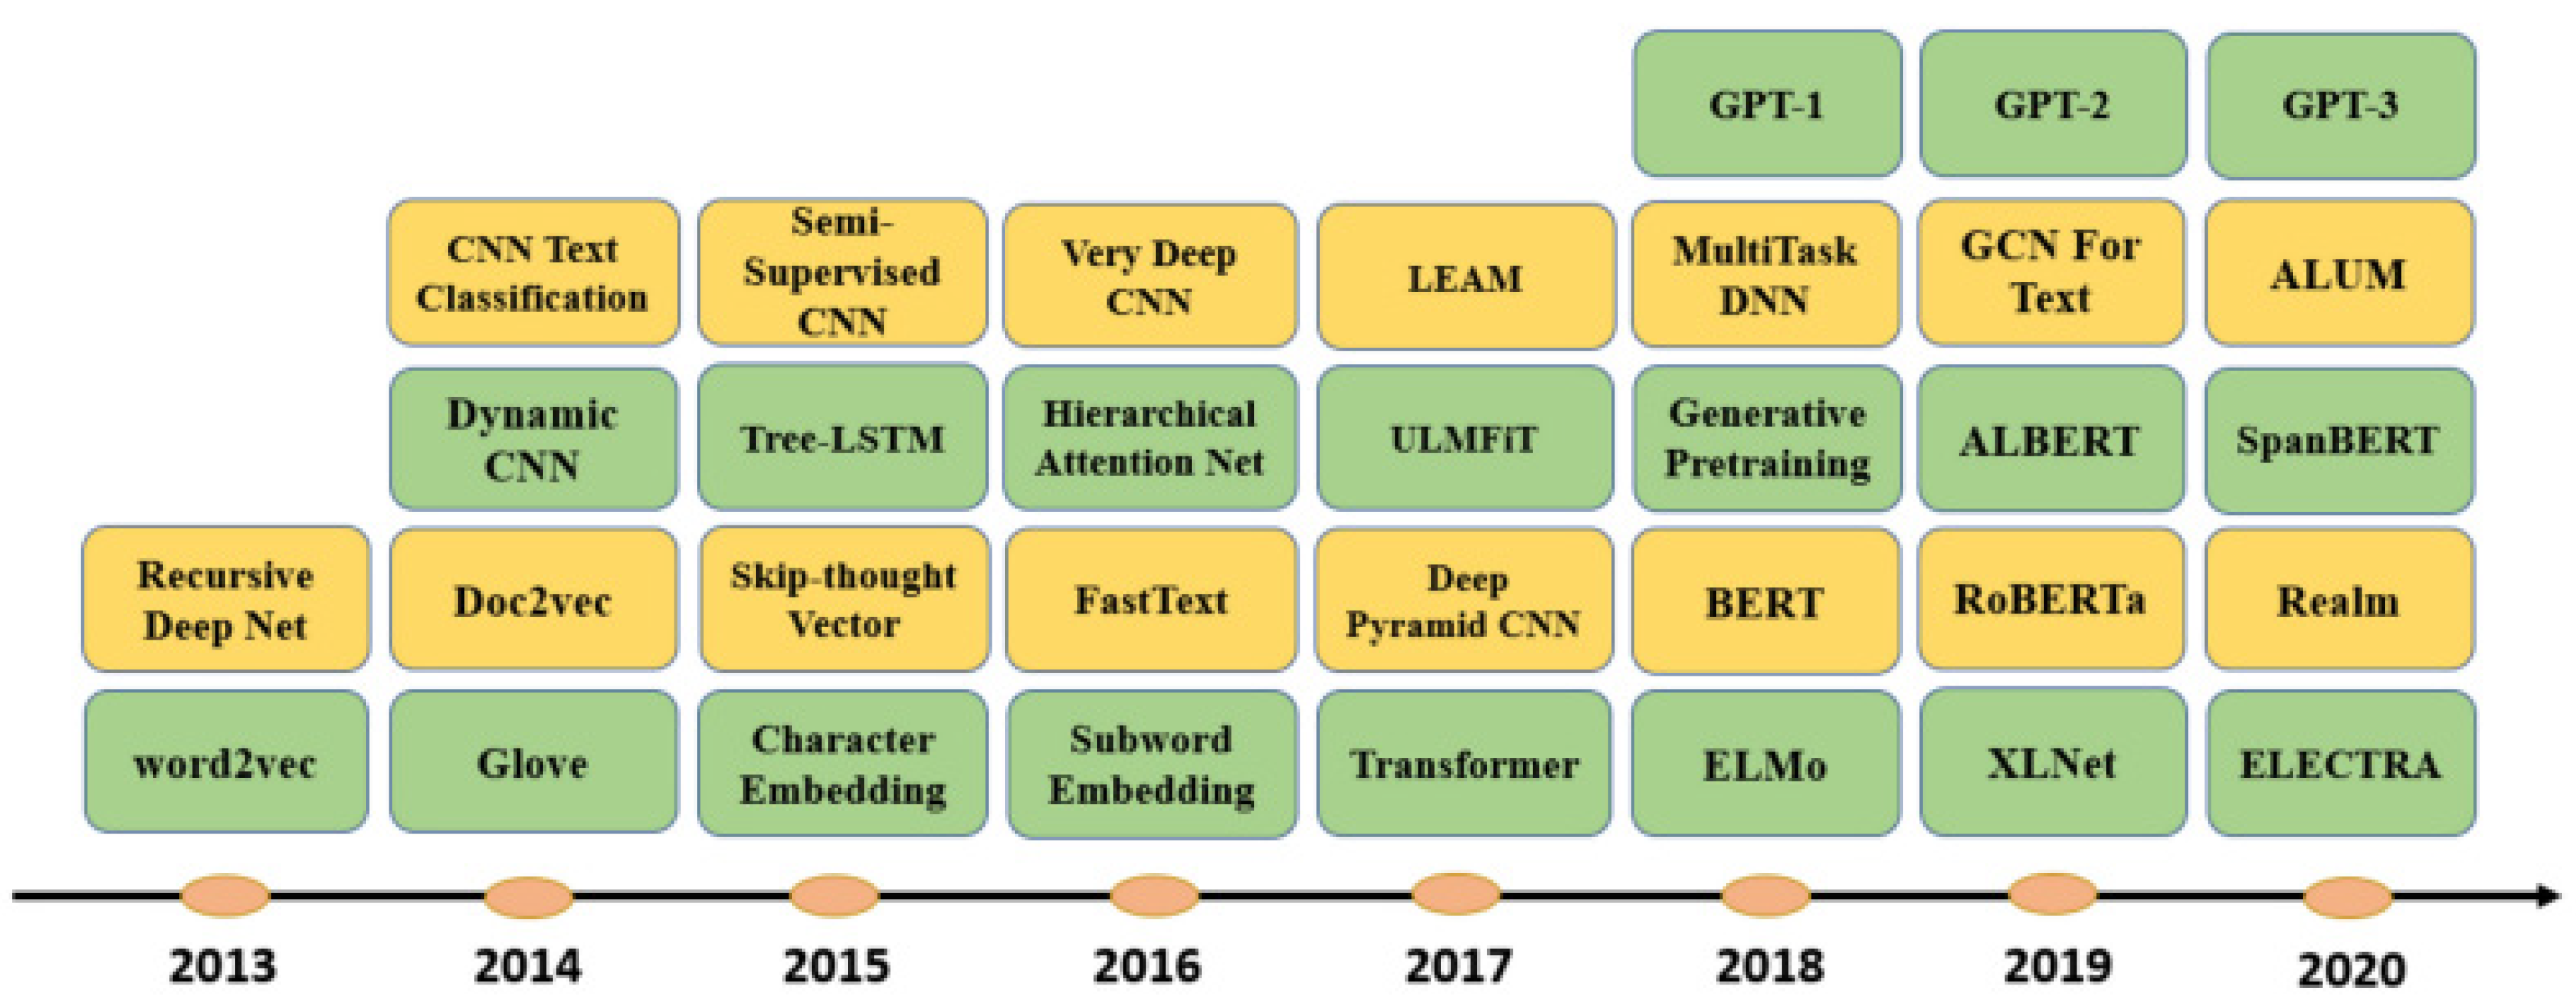
DistilBERT [14] is a pre-trained transformer-based language representation model which can be fine-tuned in a wide range of NLP tasks by adding a classification head on top of the model base. This model is a 40% smaller version of BERT, cheaper to train and 60% faster while retaining more than 97% of BERT’s capabilities. While operating large models remains a challenge and raises several concerns, these smaller versions have become more prevalent. RoBERTa [6] is an improved version of BERT pre-training with a careful consideration of hyperparameters and training size. This improved model exceeds BERT’s performance and outperforms state-of-the-art models. The improvement is due to the longer training time and larger dataset size with a higher batch size. DeBERTa [7] is a new model architecture that outperforms BERT and RoBERTa through applying novel training methods. This new model is trained on half of the training data and achieves a higher performance in different NLP tasks. This cutting-edge model outperforms human performance and boosts the overall results. Figure 1 shows the timeline for the most common deep learning-based text embedding and classification models. While DistilBERT and DeBERTa are mentioned as part of the broader evolution of NLP models, this study focuses on Word2Vec and BERT due to their efficiency and adequacy for the size and characteristics of the dataset used. Future research could explore the incorporation of these more advanced models to potentially enhance classification accuracy.

Figure 1.
Timeline for most common deep learning-based models for text embedding and classification models [11].
In the development of our methodology for crash severity classification, a critical decision was made to employ a comparative analysis of three distinct word embedding techniques: TF-IDF, Word2Vec, and BERT. This choice was driven by the need to balance computational efficiency with predictive performance across varying scales of data. TF-IDF was selected for its simplicity and effectiveness in representing text data within traditional machine learning frameworks. Word2Vec was chosen for its ability to capture semantic relationships between words in a way that is computationally feasible for moderate-sized datasets. BERT, representing the cutting-edge in contextualized word embeddings, was included to explore potential gains in model accuracy from deep learning advancements. These techniques provided a broad spectrum of capabilities, enabling a robust evaluation of methods from simple to complex without the computational overhead associated with more recent models like GPT-3.5 or newer versions. This strategic choice allowed for an extensive assessment of each technique’s utility in real-world applications where resources may be limited and also provided a foundational comparison that remains relevant despite rapid advancements in NLP technologies.
2.2. Related Work
The transportation domain has an enormous amount of unstructured textual data, including crash data narratives. These data sources can be utilized to generate deeper understanding and insights from the crash scene to improve traffic safety [15]. There are a limited number of studies that adopt crash narratives to classify crash severity. In general, the two main approaches in traffic research for crash severity classification are tabular and textual data approaches.
2.2.1. Tabular Data Approaches
A significant body of the literature is focused on statistical and machine learning approaches to study the factors associated with crash severity and predict crash severity levels. Both approaches significantly overlap since they deal with data analysis. A critical difference between statistical and machine learning approaches is that the former requires some assumptions about the predefined relations between the dependent and independent variables. In contrast, the latter does not require any previous assumptions [16]. Statistical models have been widely used since the 1980s and 1990s to model road accidents [17]. A common approach in these models is to use explanatory regressors such as driver information, weather, and road conditions, among others, as independent variables and crash severity as the dependent variable in binary (logit or probit) with two discrete outcomes [18,19,20] or multinomial models with multiple crash severity outcomes [21,22]. Regression models are the most common statistical modeling techniques to measure the level of severity of road crashes [23,24,25]. Apart from statistical methods, machine learning algorithms are booming in the transportation area because of their ability to model complex nonlinear functions without the need to understand the underlying mechanism [16,26]. Artificial neural networks are the most applied machine learning technique, followed by decision trees and support vector machines [27,28,29]. Also, Bayesian networks, random forests, boosting classifiers, and many other machine learning techniques have been used to model crash severity [30,31,32]. Deep learning approaches such as convolutional neural networks and recurrent neural networks have recently become widely used for prediction tasks in transportation research, demonstrating their outstanding performance [33,34].
2.2.2. Textual Data Approaches
Several recent domains have sought to apply text mining in unstructured data. For example, transportation studies utilized NLP and text mining techniques to extract insights from unstructured crash narratives. However, these studies focused primarily on addressing two research directions: (1) classification tasks and (2) extracting hidden trends from the unstructured data. The crash narratives may include valuable information that does not exist in the tabular analyses. This asset can provide contextual information by applying cutting-edge text mining techniques, resulting in a better understanding of crash severity outcomes to help policymakers develop prevention strategies. Remarkably, little research has focused on crash narratives to enhance the understanding of the factors influencing crash severity levels.
Advances in machine learning have contributed significantly to text classification. Several machine learning-based studies have been conducted for text classification in traffic narratives. For example, [35] proposed an approach that combines text mining with interpretable machine learning to identify causal factors associated with injury severity. They adopted a variety of text mining and machine learning models such as neural networks, support vector machines, the naive Bayes algorithm, random forests, XGBoost, and logistic regression to classify crash severity. The neural network showed the best performance among the tested models. This proposed approach showed a new analytic perspective to explain key factors associated with high-severity crashes which cannot be obtained through classification tabular data analysis. However, textual data were converted into numeric vectors using TF-IDF representation. In contrast to word frequency vectorization, the TF-IDF approach ignores the words with low importance to provide a meaningful explanation. This study’s limitation is that the bag-of-words method does not consider the contextual semantic relation between the words.
Another study used three machine learning algorithms to find vehicles involved in hydroplaning crashes [36]. This study demonstrated the capability of text mining to detect vehicle crashes and provided a platform to understand interpretability in machine learning. XGBoost was found to be the most effective classifier. The benefit of this study is that the accuracy could be improved, and extra crash variables could be included to improve model performance. The author of ref. [37] presented a text mining-based approach to reveal contextual relationships in motor vehicle crash narratives based on word frequency. The study used Queensland traffic accidents between 2004 and 2005 to extract the causes of the crashes and determine the leading causes of those crashes. Their results were interesting in that they can help policymakers to better assess road crashes. However, this study did not consider severity analysis interpretation.
In contrast to machine learning, deep learning models can extract complex characters from the word order of input data with superior classification accuracy. These models require word embeddings such as Word2Vec, a two-layer neural network. Word embeddings are capable of extracting semantic relations in the text [38].
The author of ref. [39] developed a verb-based text mining algorithm to identify and extract the main verbs associated with vehicles’ actions in a crash accident. The proposed approach was evaluated using 945 crash reports. The results showed that the extracted information is helpful for crash classifications and identifying the causes of the crash. The authors of ref. [40] conducted a study to predict secondary crashes. The authors developed a text mining approach to recognize secondary crashes from crash narratives. Four steps were used to process the data: tokenization, counting, vectorization, and normalization to convert the text narratives into vector structure. The logistic regression model achieved the highest accuracy of all the models used. This model is efficient in identifying keywords associated with secondary crashes. The authors of ref. [41] conducted a study to measure the injury severity of pedestrian and bicyclist trespassing crashes at non-crossings. The authors proposed a two-stage statistical and machine learning hybrid approach to extract information regarding the severity of trespassers’ injuries. This study focused on pedestrian trespassers and did not discuss the injury caused by all types of crashes. Moreover, the study focused on rail trespassing crashes. The authors of ref. [42] developed a classifier to discover missing classified work-zone crashes using the information in text narratives. The study used three years of crash narrative data (2017–2019). The classifier used key information from the crash textual data and proved to be efficient and effective in classifying road crashes.
The authors of ref. [43] conducted a study on NLP’s effectiveness in analyzing mine accident narratives. The authors developed nine models to classify mine safety narratives into nine accident types. The automatic classification process achieved an accuracy of 96%. The study demonstrated that NLP and text analysis could be powerful tools for analyzing textual data.
The authors of ref. [44] carried out a study to inspect road safety through applying Latent Dirichlet Allocation (LDA). The purpose of the study was to identify the safety issues on main roads. The paper showed how topic modeling can identify run-off-road crashes through highlighting the associated patterns embedded in the narratives. Topic modeling was able to divide the topics into two groups of problems and solutions. The study gathered crash reports over six years, reflecting 4011 km of Irish roads. The findings showed the importance of keywords related to “forgiving roadside” and “clear zone” topics. Moreover, the authors found that categories related to road safety were higher in the problem reports, which means that problems are discovered more easily than solution interventions. The study showed that the topic modeling methodology is appropriate to identify specific patterns related to traffic safety and road crashes. However, their approach was based on a bag-of-words representation, which does not consider semantic correlations between the words. Also, their study could be improved by considering other types of crashes, such as multi-vehicle crashes.
3. Material and Methods
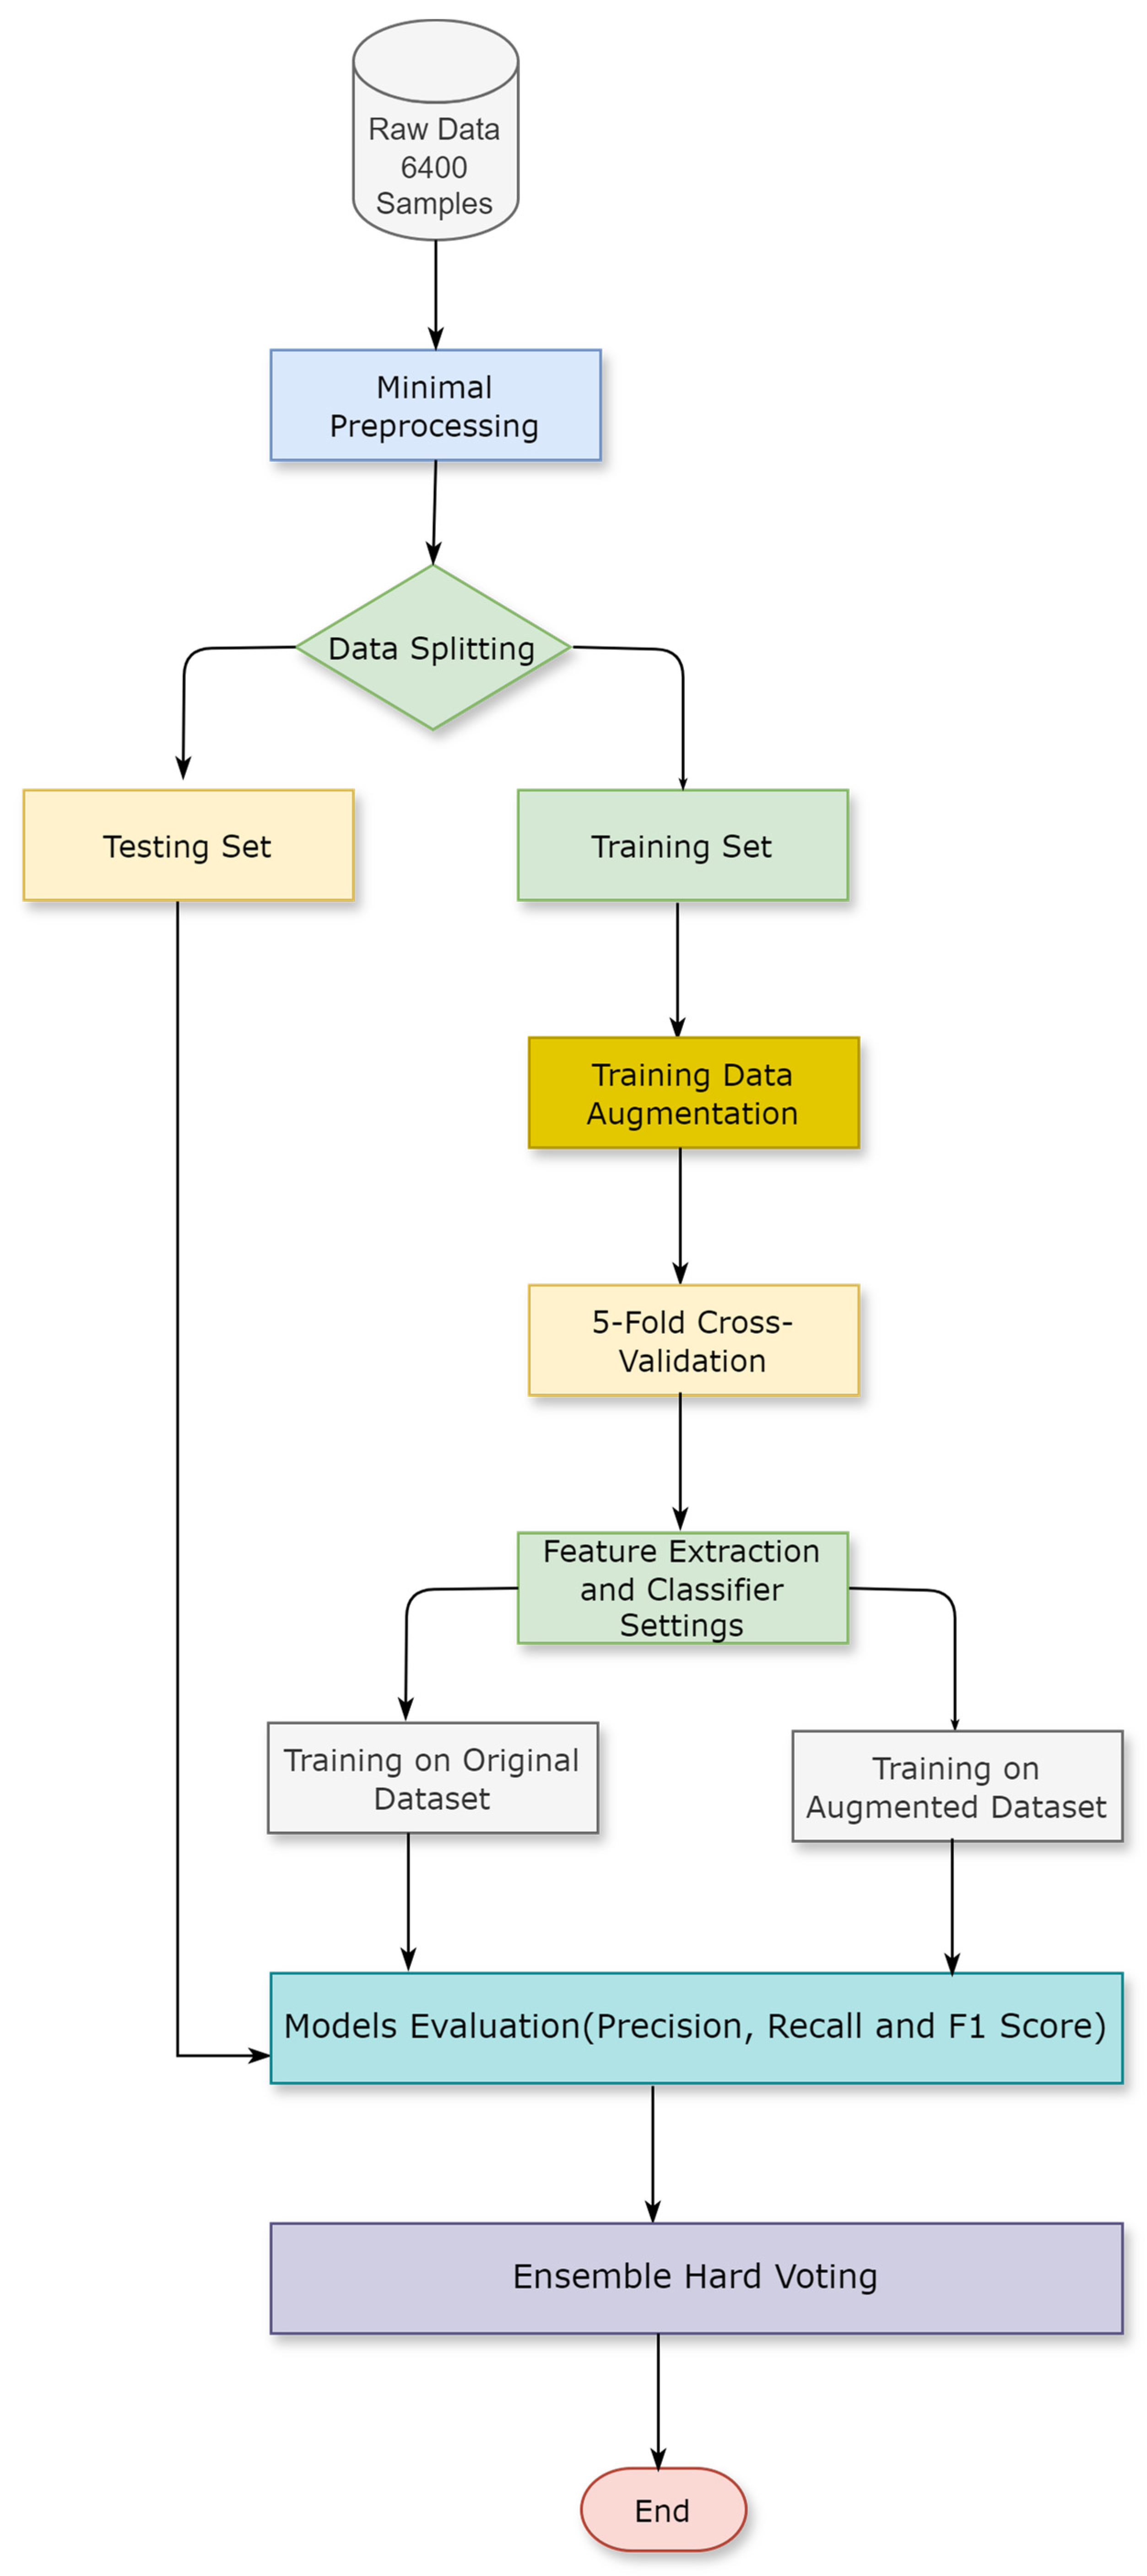
This section describes the dataset and the methodology used in this research. The proposed method involves four main stages: data augmentation, data preprocessing, comparing machine learning classifiers on different word embeddings, and building an ensemble classifier based on the three best-performing models. Figure 2 presents the architecture of the proposed methodology.

Figure 2.
Research methodology.
3.1. Data Augmentation
The original dataset for this research comprises 6400 crash accidents from the Missouri State Highway Patrol, recorded between 2019 and 2020. Each record is classified as “fatal”, “property damage”, or “personal injury” based on the crash severity. The dataset is notably imbalanced, with only 41 instances labeled as “property damage”.
The dataset was initially divided into separate training and testing sets to prevent information leakage. The testing set includes 588 records of “Personal Injury”, 48 records of “Fatal”, and 20 records of “Property Damage”. The remaining data were allocated to the training set, comprising 5295 records of “Personal Injury”, 428 records of “Fatal”, and 21 records of “Property Damage”.
Addressing the imbalance in the training set, we employed data augmentation techniques exclusively on the training data to upsample the minority classes. Specifically, the “Fatal” and “Property Damage” records were increased to 1000 each while maintaining the “Personal Injury” records at 5295. This augmentation was achieved by utilizing a BERT model, which generates new samples through techniques like insertion and substitution to create synthetically meaningful data. Table 1 details the class distributions of both the original and augmented training datasets alongside the testing set. We incorporated regularization techniques and dropout during model training to mitigate overfitting risks. Additionally, we applied 5-fold cross-validation to validate the model’s performance across various data subsets. This rigorous approach ensures the robustness of our models, preventing overfitting by assessing the model’s performance on multiple data partitions.

Table 1.
Distribution of training and testing datasets before and after augmentation.
3.2. Methodology
This research encompasses several key stages to enhance the classification efficiency and robustness of the models.
- Data Processing: We opted for minimal data preprocessing steps, such as basic text normalization and removing non-textual characters, instead of extensive preprocessing like tokenization, stop-word removal, or stemming, as these extensive steps may lead to the loss of important contextual information. Advanced word embedding techniques like BERT and RoBERTa are designed to handle raw text inputs effectively [5,6]. This approach preserves contextual information and reduces computational overhead, aligning with recent findings emphasizing the efficiency of using raw data with sophisticated models [45]. Modern learning models, particularly those involving transformer architectures, are highly robust and capable of learning from raw data [46].
- Data Splitting and Augmentation: To address the severe class imbalance in the dataset, data splitting was conducted using specific numbers for each class to ensure a balanced representation. The Missouri State Highway Patrol dataset was divided into training and testing sets based on a fixed number of instances per class for testing. The remaining samples were used for training. Data augmentation techniques were applied exclusively to the training set to upsample the minority classes by generating synthetic data. This step increased the representation of the minority classes, “Fatal” and “Property Damage” classes, thereby balancing the class distributions.
- Cross-Validation: To ensure the robustness of our results and mitigate the risk of overfitting, 5-fold cross-validation was employed during the training process. This approach validates the model’s performance across different subsets of the data, providing a comprehensive evaluation.
- Feature Extraction Techniques and Classifiers: We investigate multiple feature extraction techniques and machine learning classifiers. The classifiers used in this study include random forest (RF) [47], naive Bayes (NB) [48], and XGBoost (XGB) [49], each paired with various word embedding techniques such as TF-IDF [3], Word2Vec [4], and BERT [5]. Additionally, two state-of-the-art pre-trained language models, BERT [5] and RoBERTa [6], were fine-tuned with a Bidirectional Long Short-Term Memory (Bi-LSTM) classification model [50]. These selections are based on their demonstrated efficiency in various NLP tasks [30,31,32,35,44,51].
- Model Training: In the model training phase, we utilized a combination of traditional machine learning models and advanced deep learning techniques. Specifically, we paired three machine learning models—XGBoost (XGB) [49], naive Bayes (NB) [48], and random forest (RF) [47]—with three-word embedding techniques: TF-IDF [3], Word2Vec [4], and BERT [5]. Additionally, we fine-tuned two state-of-the-art pre-trained language models, BERT [5] and RoBERTa [6], with a Bidirectional Long Short-Term Memory (Bi-LSTM) classification model [50]. These models were trained separately on both the original and augmented datasets to comprehensively evaluate performance differences and the impact of data augmentation on model robustness and accuracy.
- Ensemble Hard Voting: In this study, we utilized a hard voting ensemble method to combine the predictions of three top-performing models: TF-IDF/XGB, BERT-LSTM, and RoBERTa-LSTM. This technique aggregates the predictions from each model and selects the majority vote as the final prediction, enhancing overall classification accuracy and robustness.
- Model Evaluation: Model evaluation was conducted using precision, recall, and F1 score metrics, particularly chosen to address the severe class imbalance in the dataset. Precision measures the accuracy of positive predictions, recall evaluates the ability to identify all relevant instances, and the F1 score provides a balance between precision and recall. These metrics ensure a reliable assessment of the model’s effectiveness in classifying crash severity, offering a more comprehensive evaluation than accuracy alone.
3.3. Text Embedding Approaches
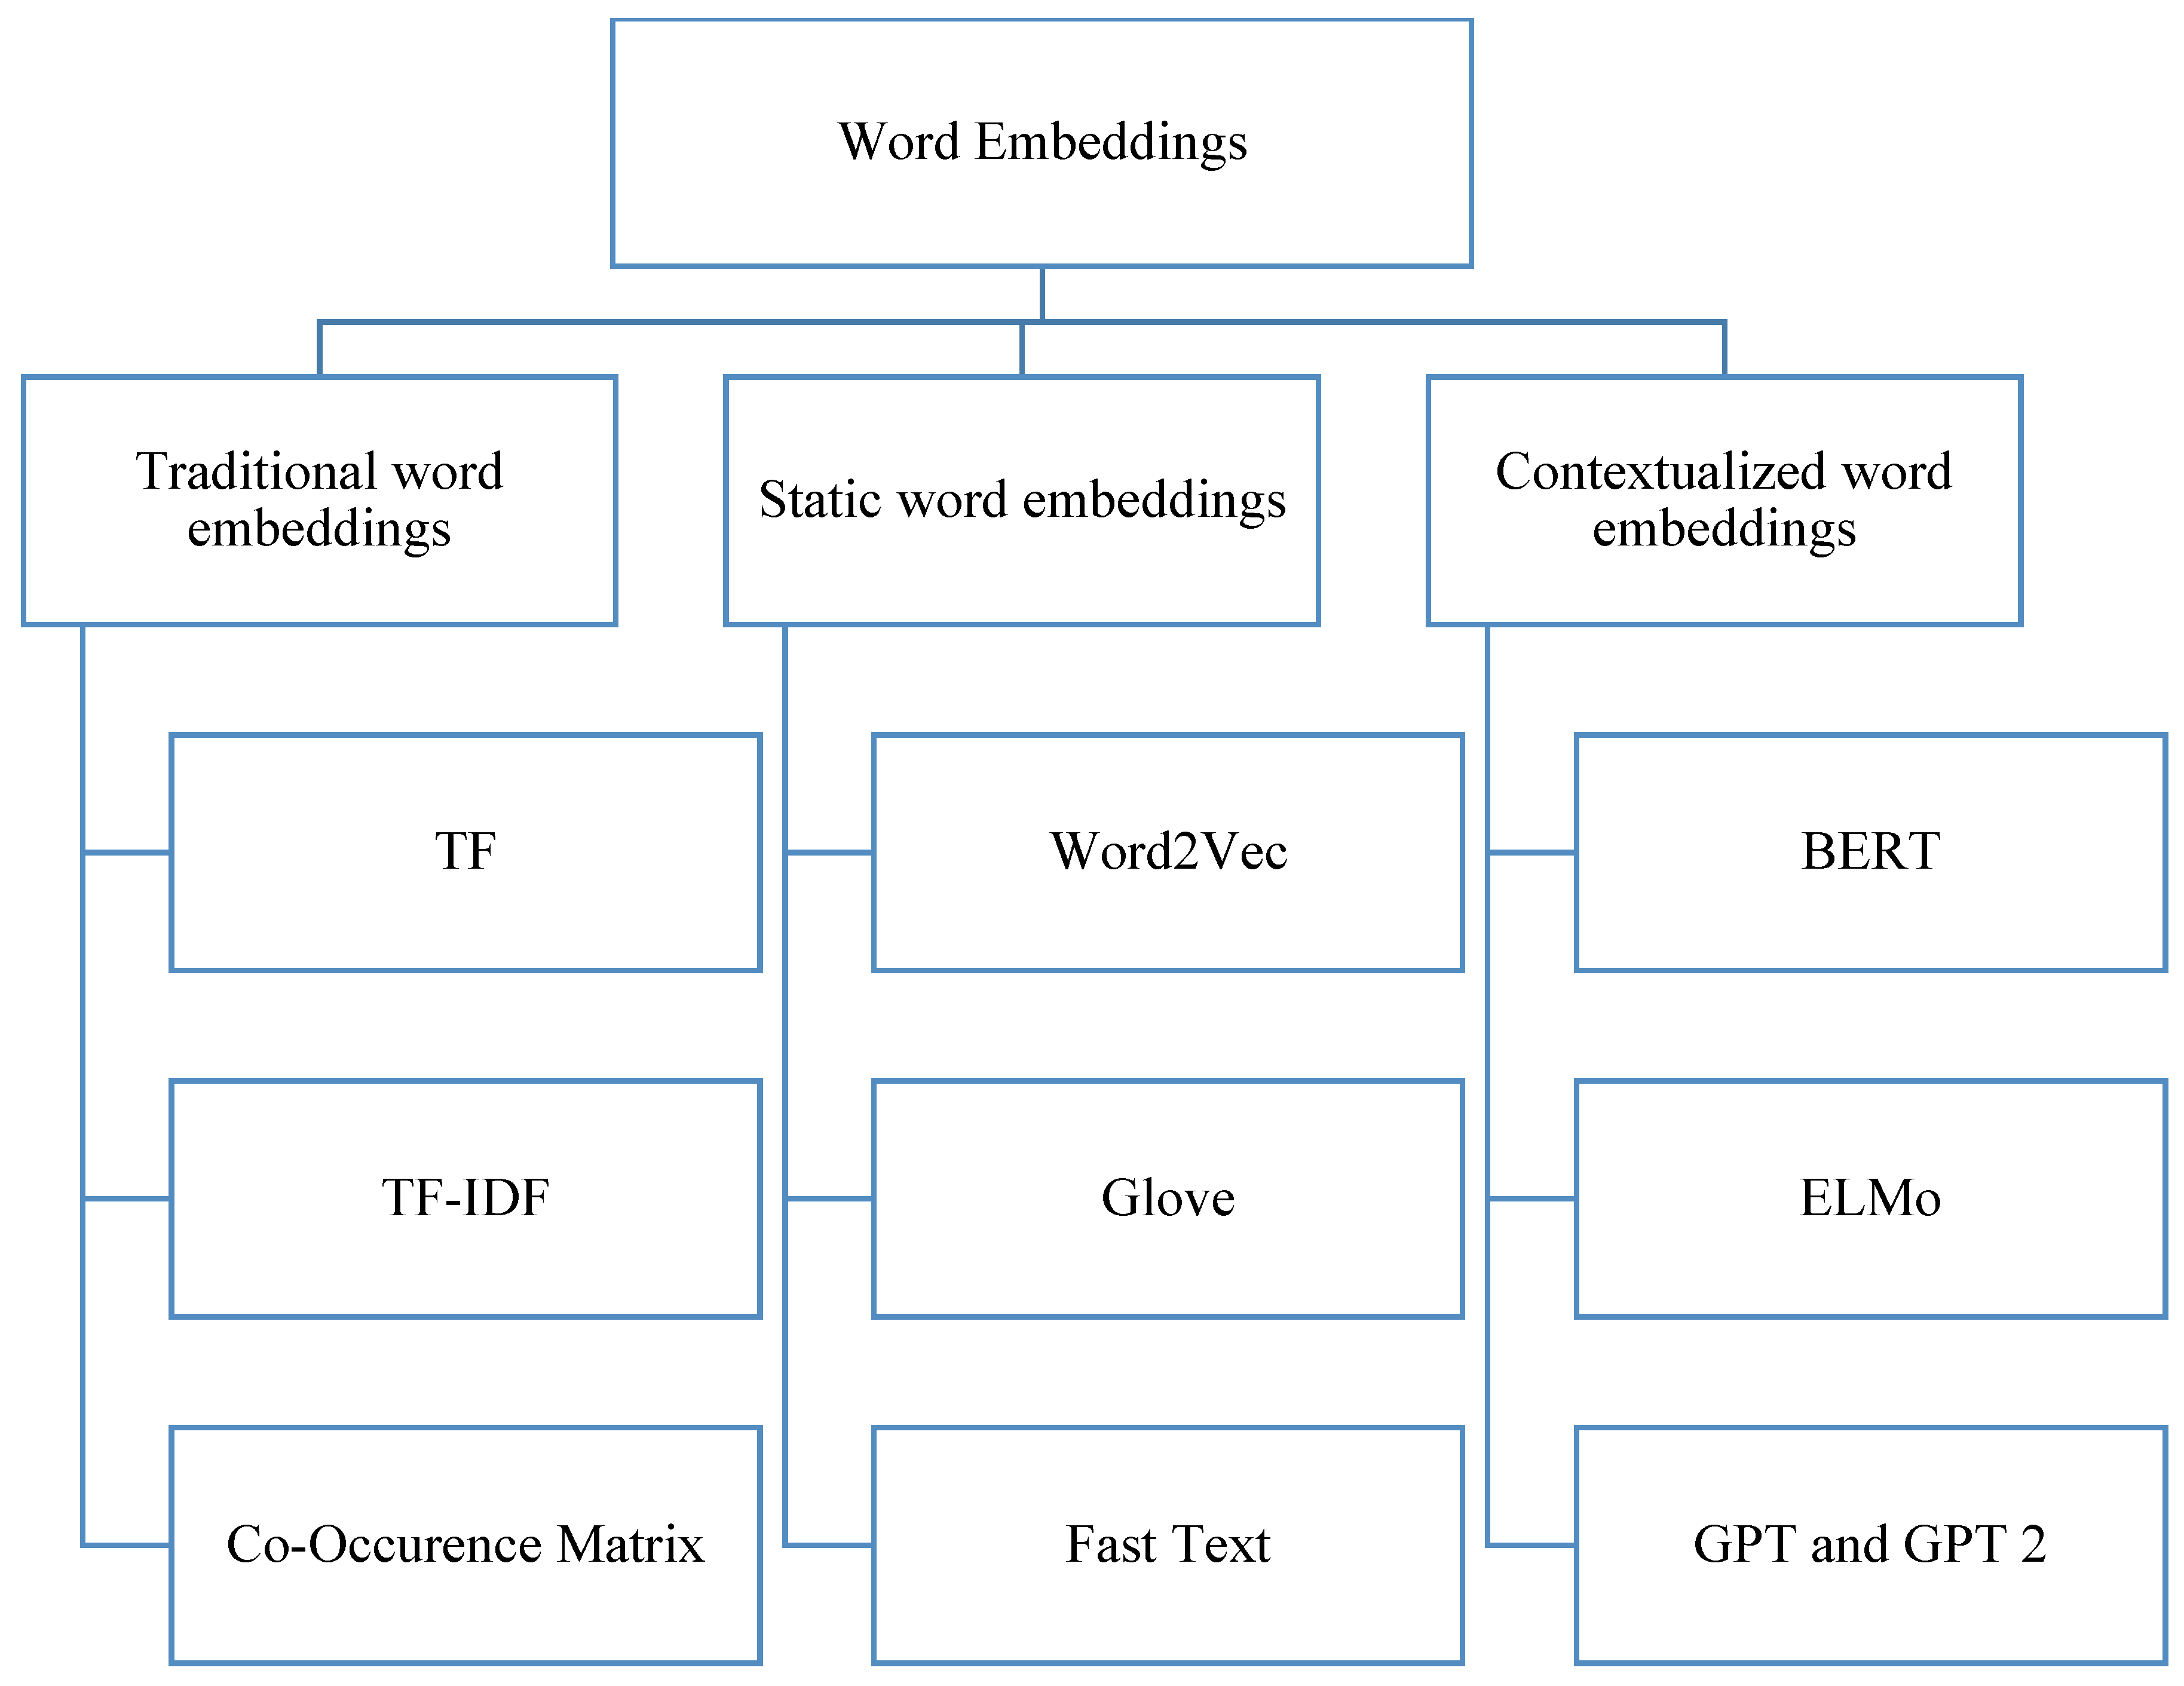
Machine learning models cannot deal with raw textual inputs. Text representation is a mandatory step to generate numeric vectors to be processed by the classification models. Word embeddings are numeric representations (vectors) in n-dimensional space that capture the word meanings. It is a technique used to map words in the text to vectors in the space. The evolution of word embedding techniques has facilitated text classification tasks. In the literature, three dominant word embeddings exist, namely traditional word embeddings, static word embeddings, and contextualized word embeddings [51]. Figure 3 shows the main three categories of word embedding methods.
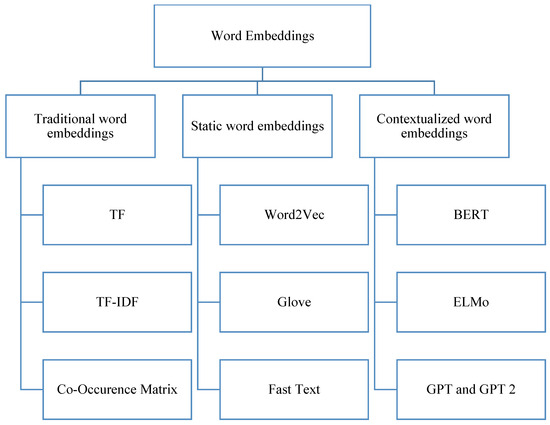
Figure 3.
Categories of word embedding methods.
We now describe the most commonly used feature extraction methods that exist in the literature, and which are deployed in our study, namely TF-IDF, Word2Vec, and BERT. TF-IDF is a popular method to convert text into features by giving calculated weights to words according to their importance in the corpus. It is used to measure the importance of words in the corpus. This measure is widely used in information retrieval to reflect how relevant a word is in each document. While the term frequency (TF) measures the number of times a certain word occurs in the document, all words are given the same importance. However, the inverse document frequency (IDF) rewards the rare words in the corpus as they may involve important information. For a given word, IDF = N/n, where N is the number of documents in the corpus, and n is the number of documents containing the word. Then, TF-IDF = TF × IDF, where TF is the term frequency of the word.
However, this method does not consider semantics as compared to other word embeddings. In contrast, Word2Vec pre-trained models that were trained by using Google News are another popular method for word representations capable of capturing word semantics [4]. This method generates a context-independent vectorized representation for the word regardless of an occurrence in which similar words are embedded in the same space. The shortcomings of previous approaches motivated the introduction of PLMs such as BERT and its successors such as RoBERTa and DeBERTa, which have revolutionized the performance of many NLP tasks.
In this study, we carefully selected one representative technique from each of the three primary categories of word embeddings to compare their performance in crash severity classification tasks. Specifically, from the category of traditional word embeddings, we utilized TF-IDF, which focuses on the frequency and rarity of terms across the documents without considering semantic relationships. From the static word embeddings group, we chose Word2Vec, which is particularly effective in capturing semantic and syntactic word relationships through its neural network-based model trained on Google News data [4]. Finally, from the contextualized word embeddings, we incorporated BERT, a transformer-based model that understands the context of a word based on all its surrounding words, significantly enhancing the model’s ability to discern the nuanced meanings of words in varied contexts. This comparative approach allows us to empirically determine which embedding technique provides the most robust feature set for enhancing the performance of our crash severity classification model.
3.4. Evaluation Metrics
Given the imbalanced nature of our dataset, accuracy alone is not a suitable metric for evaluating model performance [52,53]. Therefore, we prioritize precision, recall, and F1 score. Precision measures the proportion of true positive results among all positive predictions, recall measures the proportion of actual positives correctly identified, and the F1 score balances precision and recall. This approach provides a more accurate and reliable evaluation of the model’s effectiveness in handling imbalanced data. We consider that true positive (TP) is the number of positive cases predicted as positive, True Negative (TN) is the number of negative cases predicted as negative, False Negative (FN) is the number of positive cases predicted as negative, and False Positive (FP) is the number of negative cases predicted as positive. Here are the metrics upon which our evaluations rely.
- Precision measures the percentage of accurate positive predictions compared to the total number of samples classified as positive.
Precision = TP/(TP + FP)
- Recall measures the percentage of accurate positive predictions compared to the total number of actual positives.
Recall = TP/(TP + FN)
- The F1 score is a trade-off between precision and recall, which combines precision and recall assessing the performance of the model. It represents a better metric in the case of imbalanced classes.
F1 score = 2 × (Precision × Recall)/(Precision + Recall)
4. Experiments
The main objective of our work is to use the ensemble technique, which combines three best-performing machine learning and fine-tuned models. To achieve this goal, we conducted two experiments to evaluate models deploying the ensemble model. The first experiment compared various machine learning models and NLP word embeddings on the original dataset. The second experiment focused on evaluating the same models on the augmented dataset. Upon identifying the best classifiers in the two experiments, we deployed an ensemble voting model to improve performance by combining the three highest-performing base classifiers.
We used the same models on the original and augmented datasets to ensure consistency and fair comparison. This approach allowed us to analyze the impact of data augmentation on the performance of the models. The ensemble of the top three models was applied to both datasets, and the results were reported for each. Overall, the ensemble with hard voting on the augmented dataset showed a higher improvement in performance.
4.1. Experiment 1: Classification Using Machine Learning Models and Deep Learning on the Original Dataset
Three well-known machine learning models, namely the XGBoost classifier [49], random forest [47], and the naive Bayes algorithm [48], were combined with three embedding techniques (TF-IDF, Word2Vec, and BERT). Additionally, we assessed the performance of the fine-tuned BERT-LSTM and RoBERTa-LSTM models.
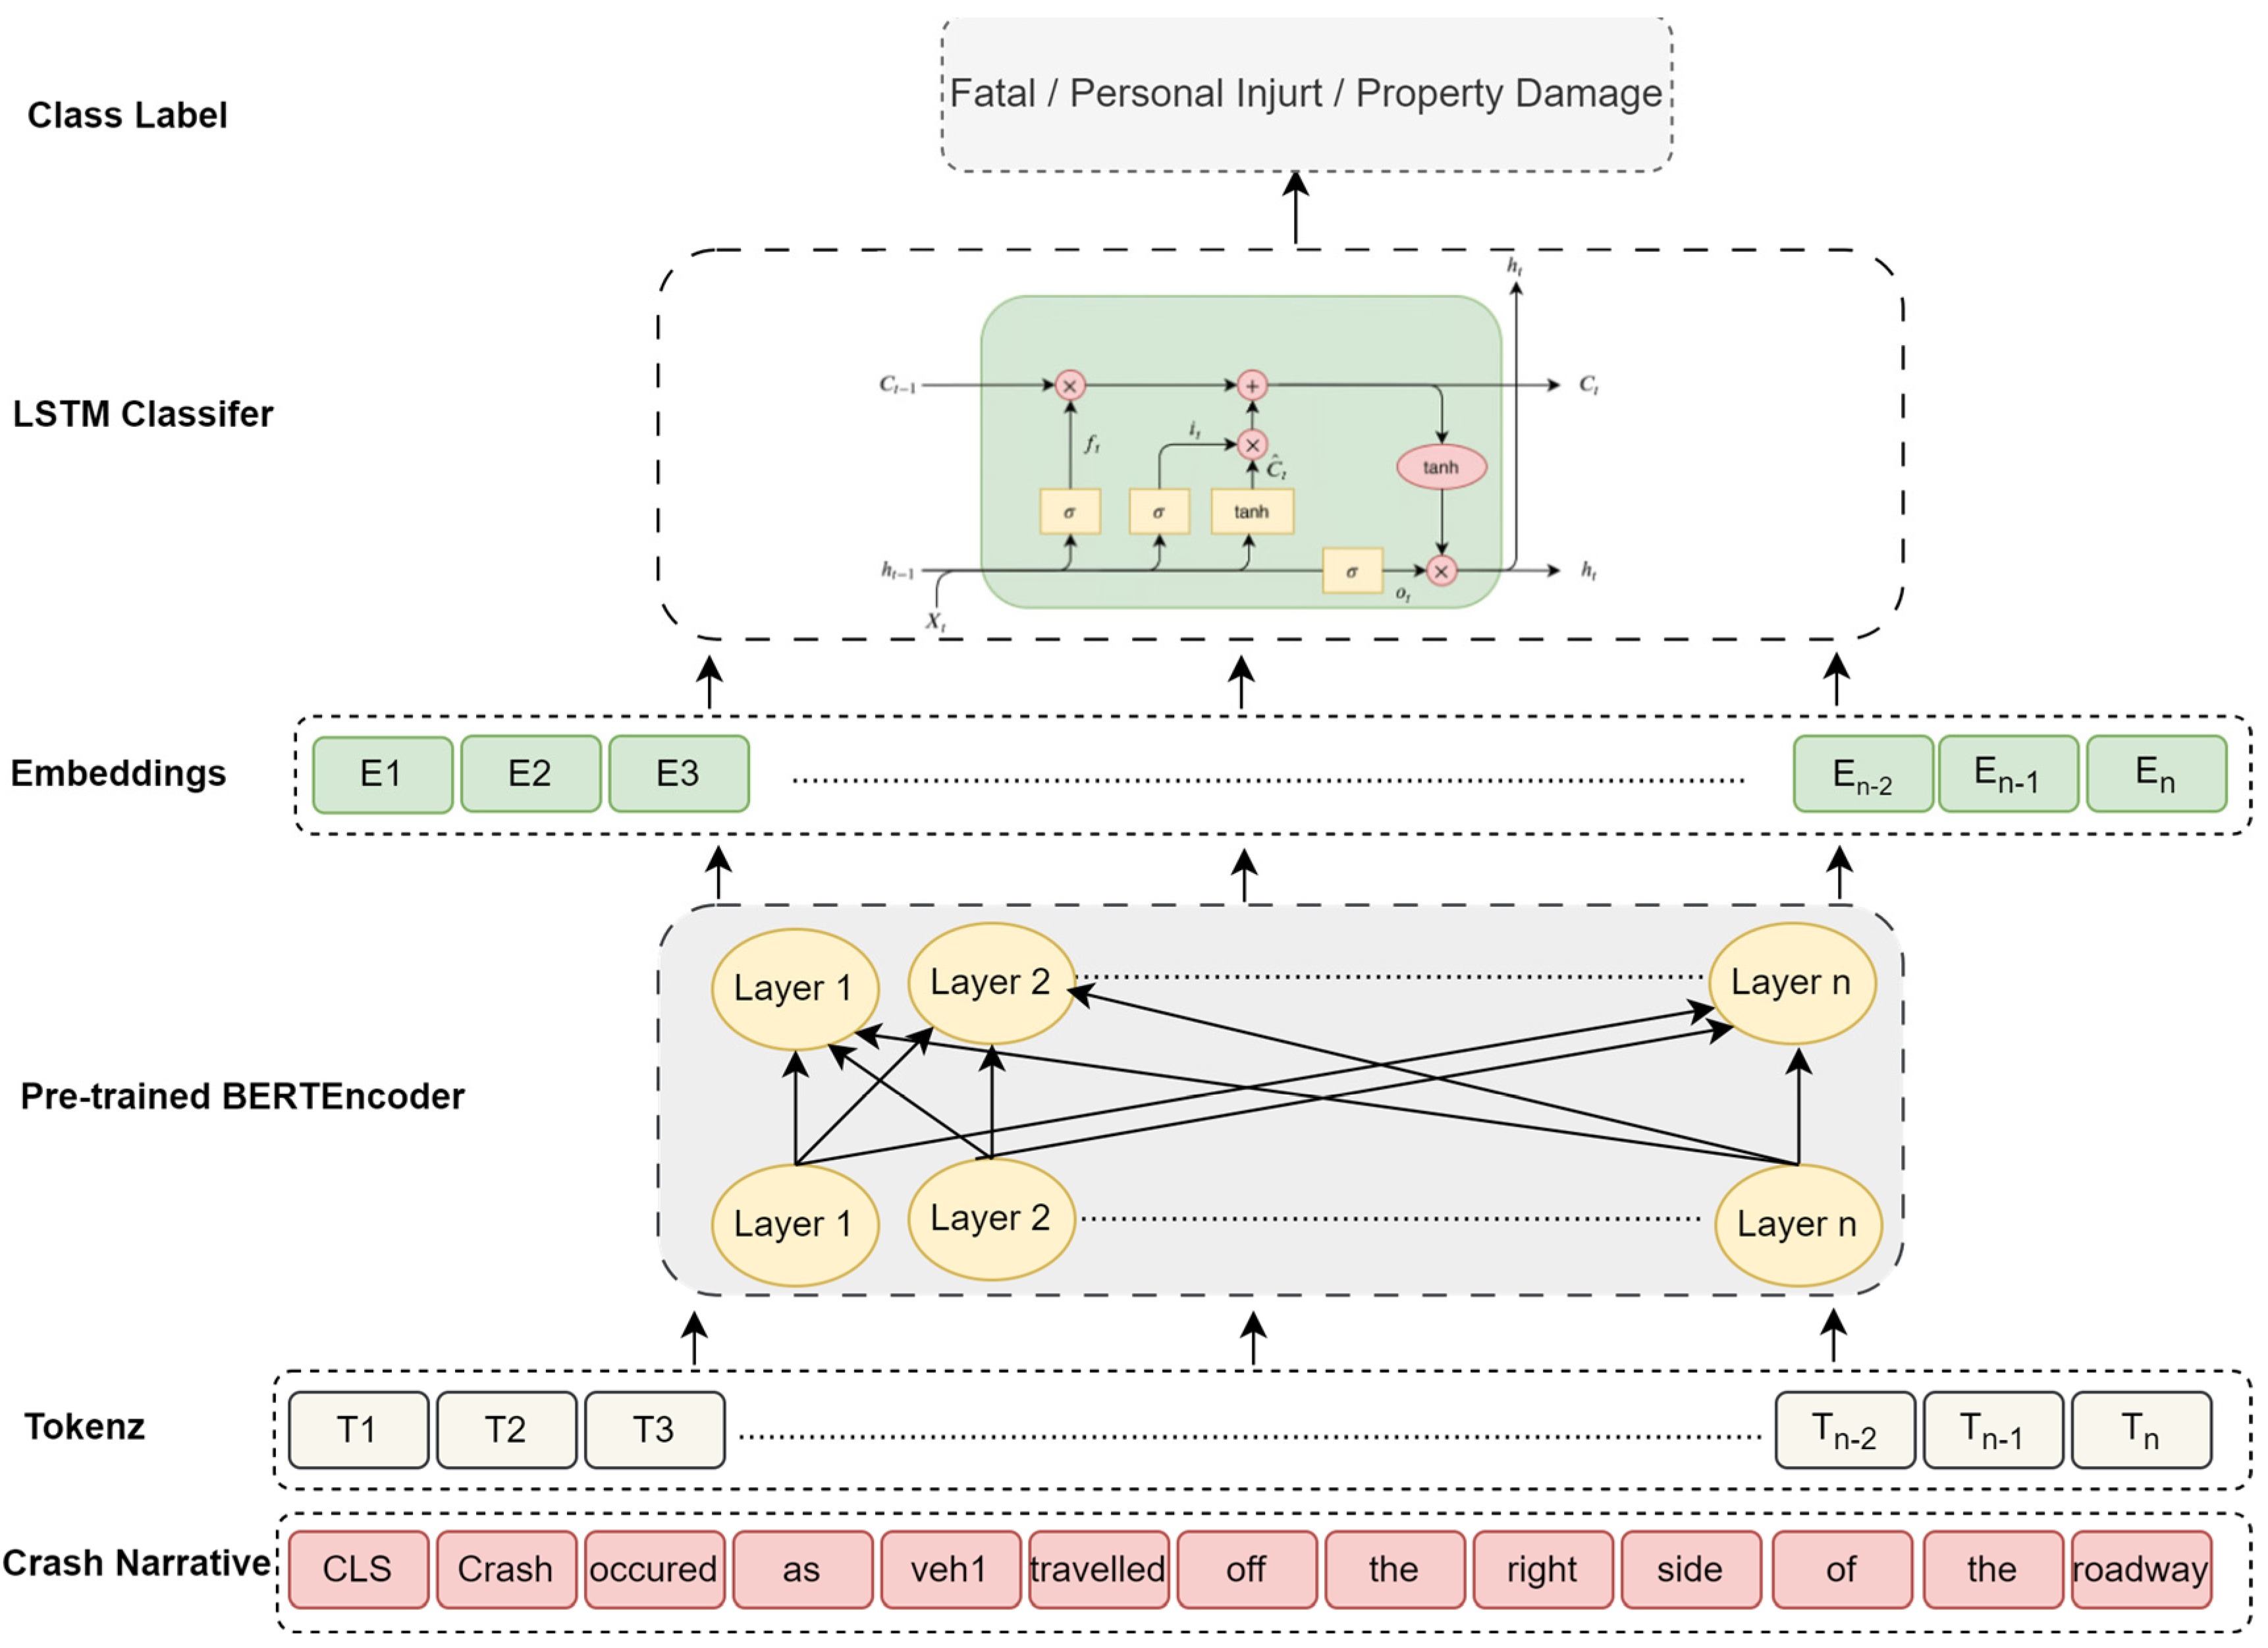
Bi-LSTM is a deep learning algorithm that is effective for sequence modeling, utilizing LSTM units capable of operating in both directions to retain semantic context. In this experiment, transformer versions BERT and RoBERTa (bert-large-uncased and roberta-base, respectively) were further fine-tuned on the target dataset by adding an additional Bi-LSTM layer for the classification task. Specifically, BERT and RoBERTa were used as embedding layers to capture contextual semantics and generate word vectors fed into the Bi-LSTM with the SoftMax network. The model architecture is shown in Figure 4.
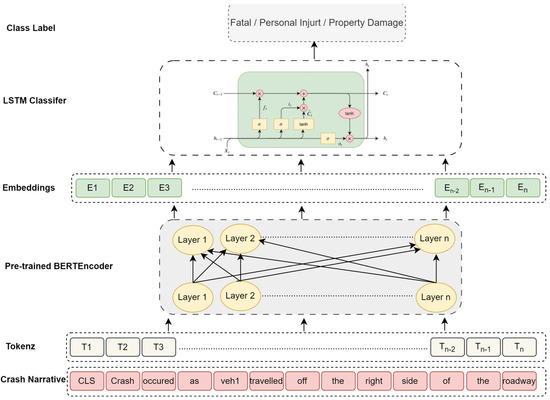
Figure 4.
P.L.M. combined with Bi-LSTM.
To optimize the model and test its performance, we divided the dataset into three subsets: training, validation, and testing. We used dense layers with ReLU activation and dropout layers to prevent overfitting, and the output layer was a 3-unit layer with the SoftMax activation function. The Adam optimizer and Cross-Entropy Loss were used as the loss functions. All model development was carried out using Python 3.7 and the TensorFlow framework.
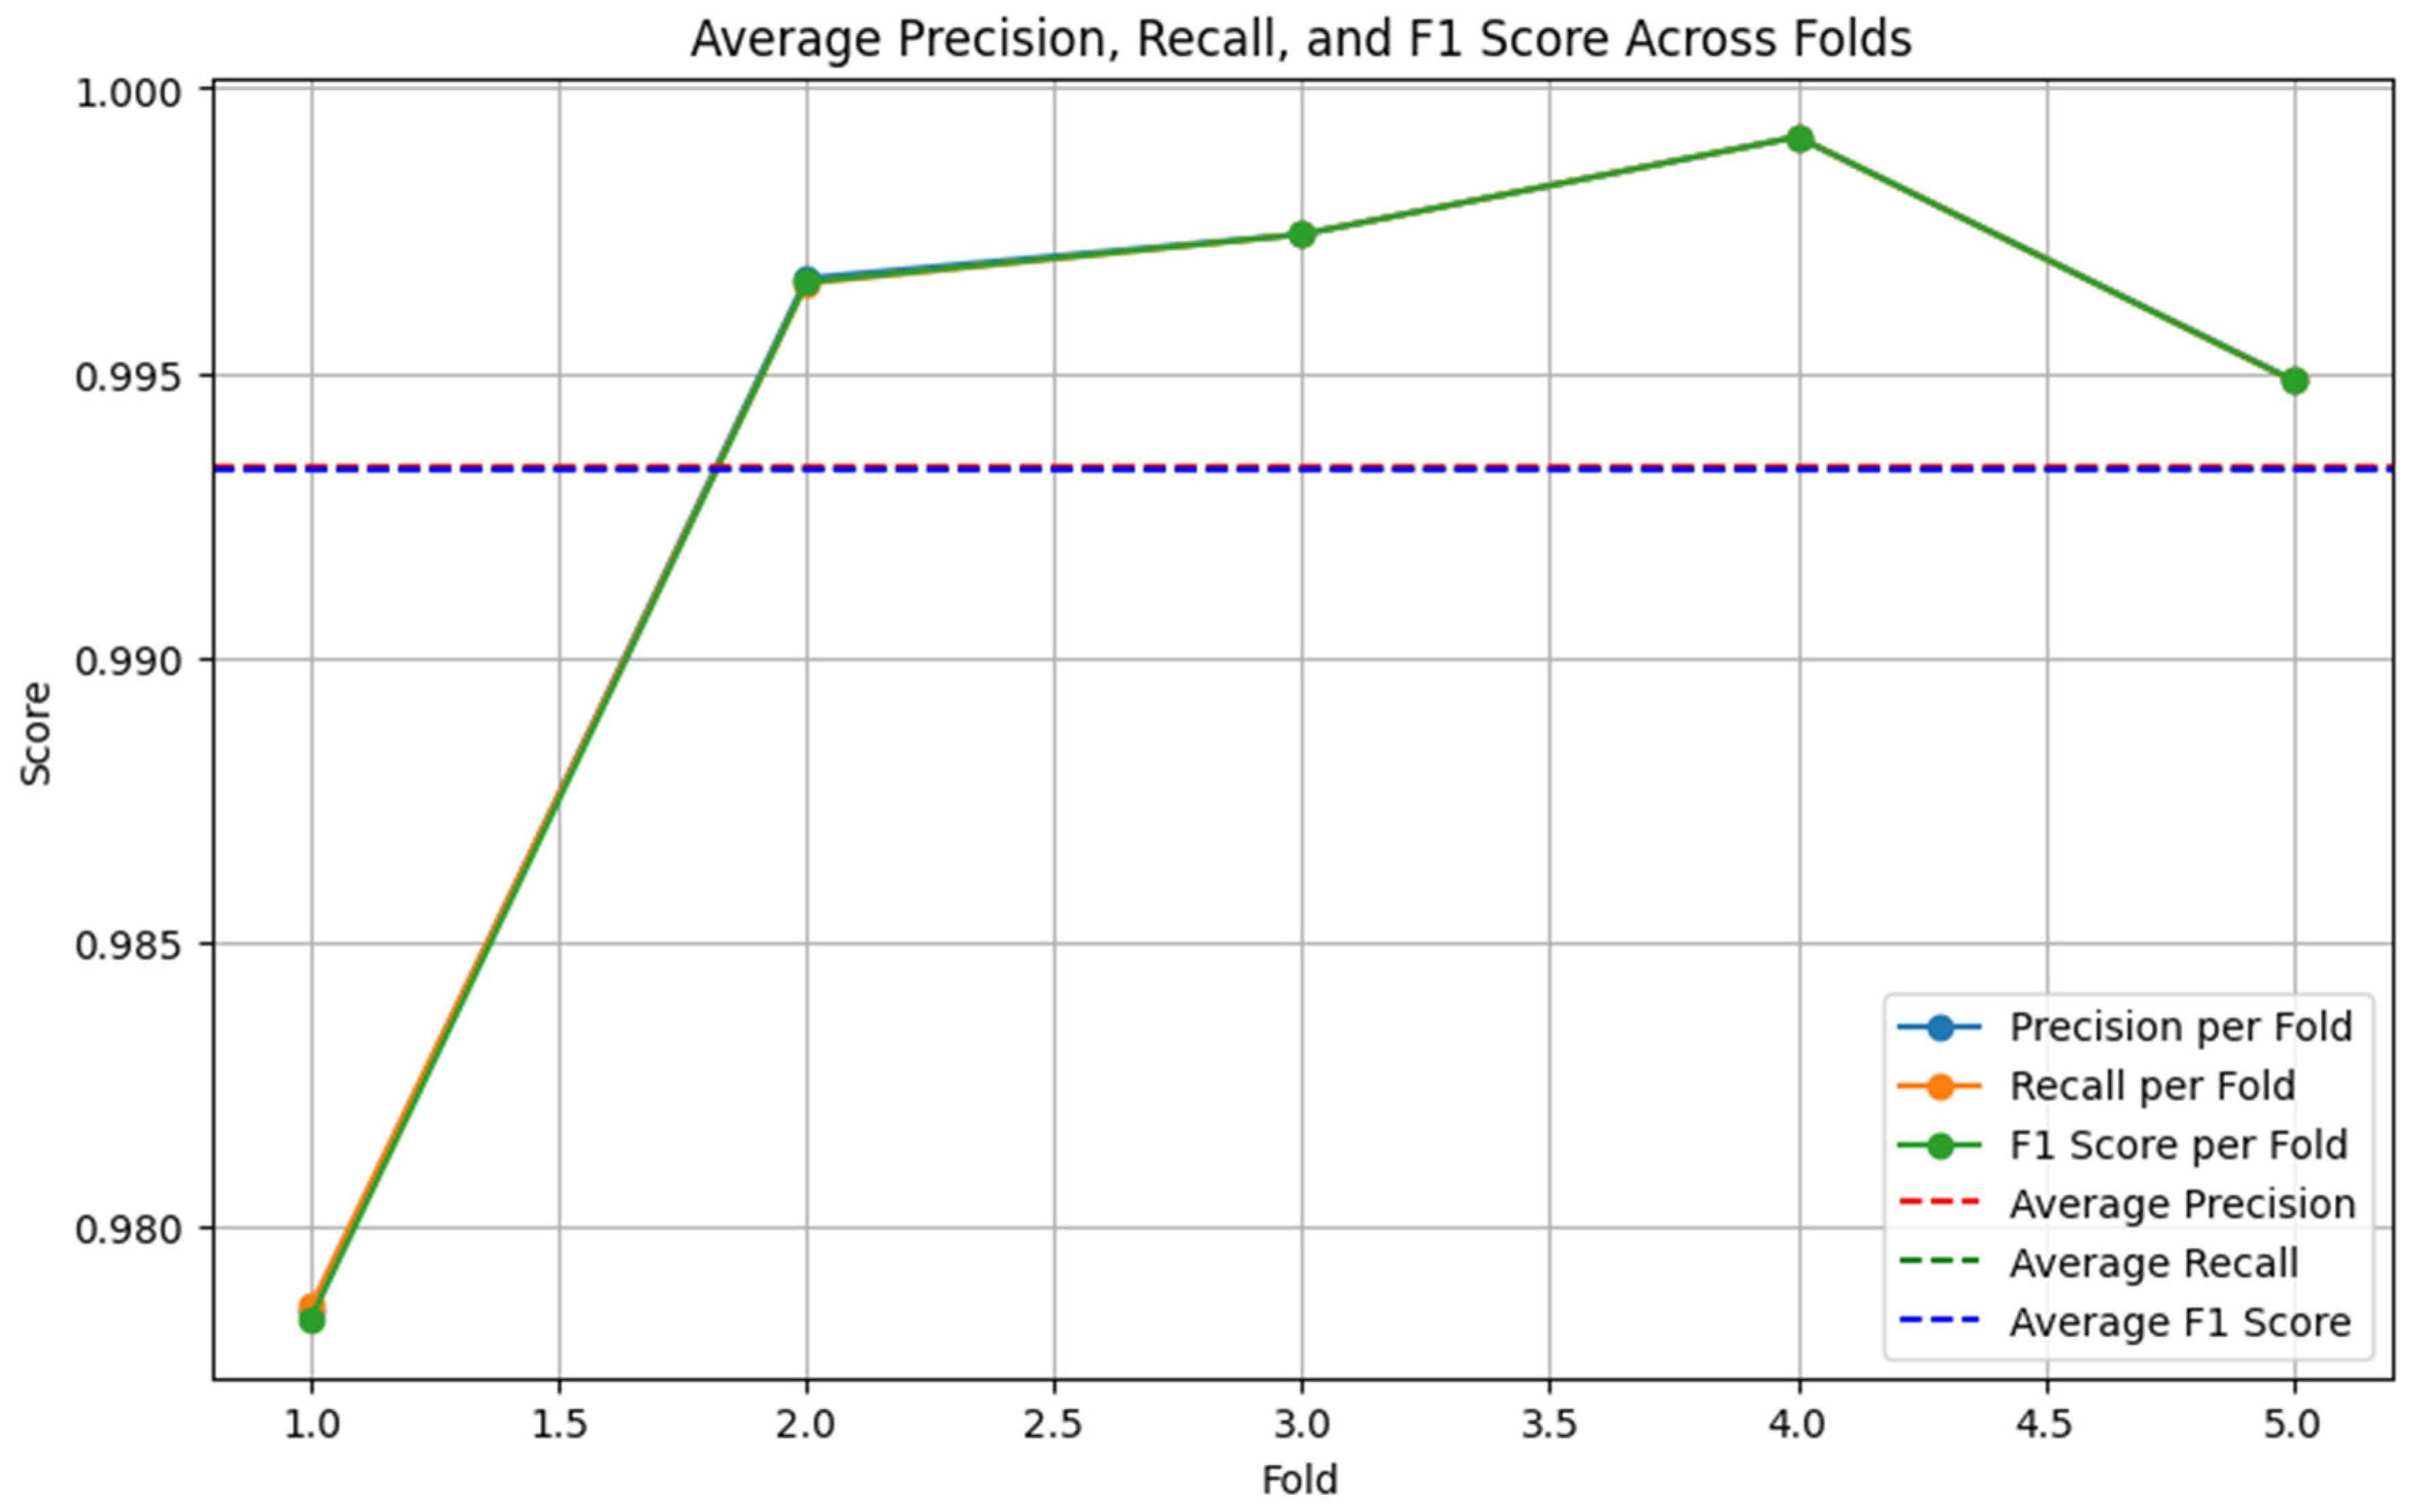
After identifying the top three performing models (XGB-TFIDF, BERT-LSTM, RoBERTa-LSTM), we applied ensemble hard voting to combine their predictions. The ensemble model outperformed individual models, as depicted in the figures below. Figure 5, Figure 6 and Figure 7 display the precision, recall, and F1 score on the original dataset for the BERT-LSTM, RoBERTa-LSTM, and XGB models, respectively.
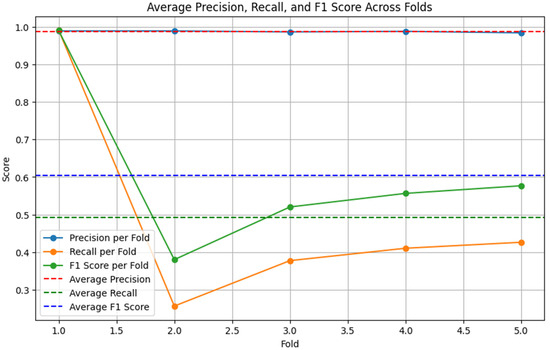
Figure 5.
BERT-LSTM performance on the original dataset (5-fold cross-validation).
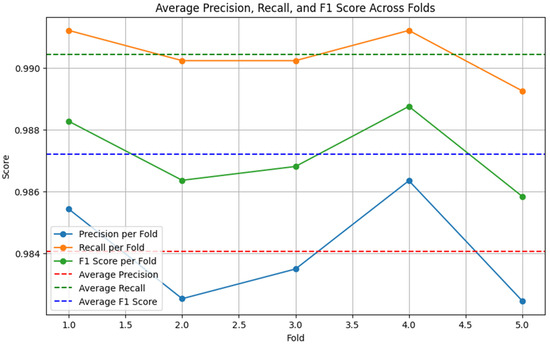
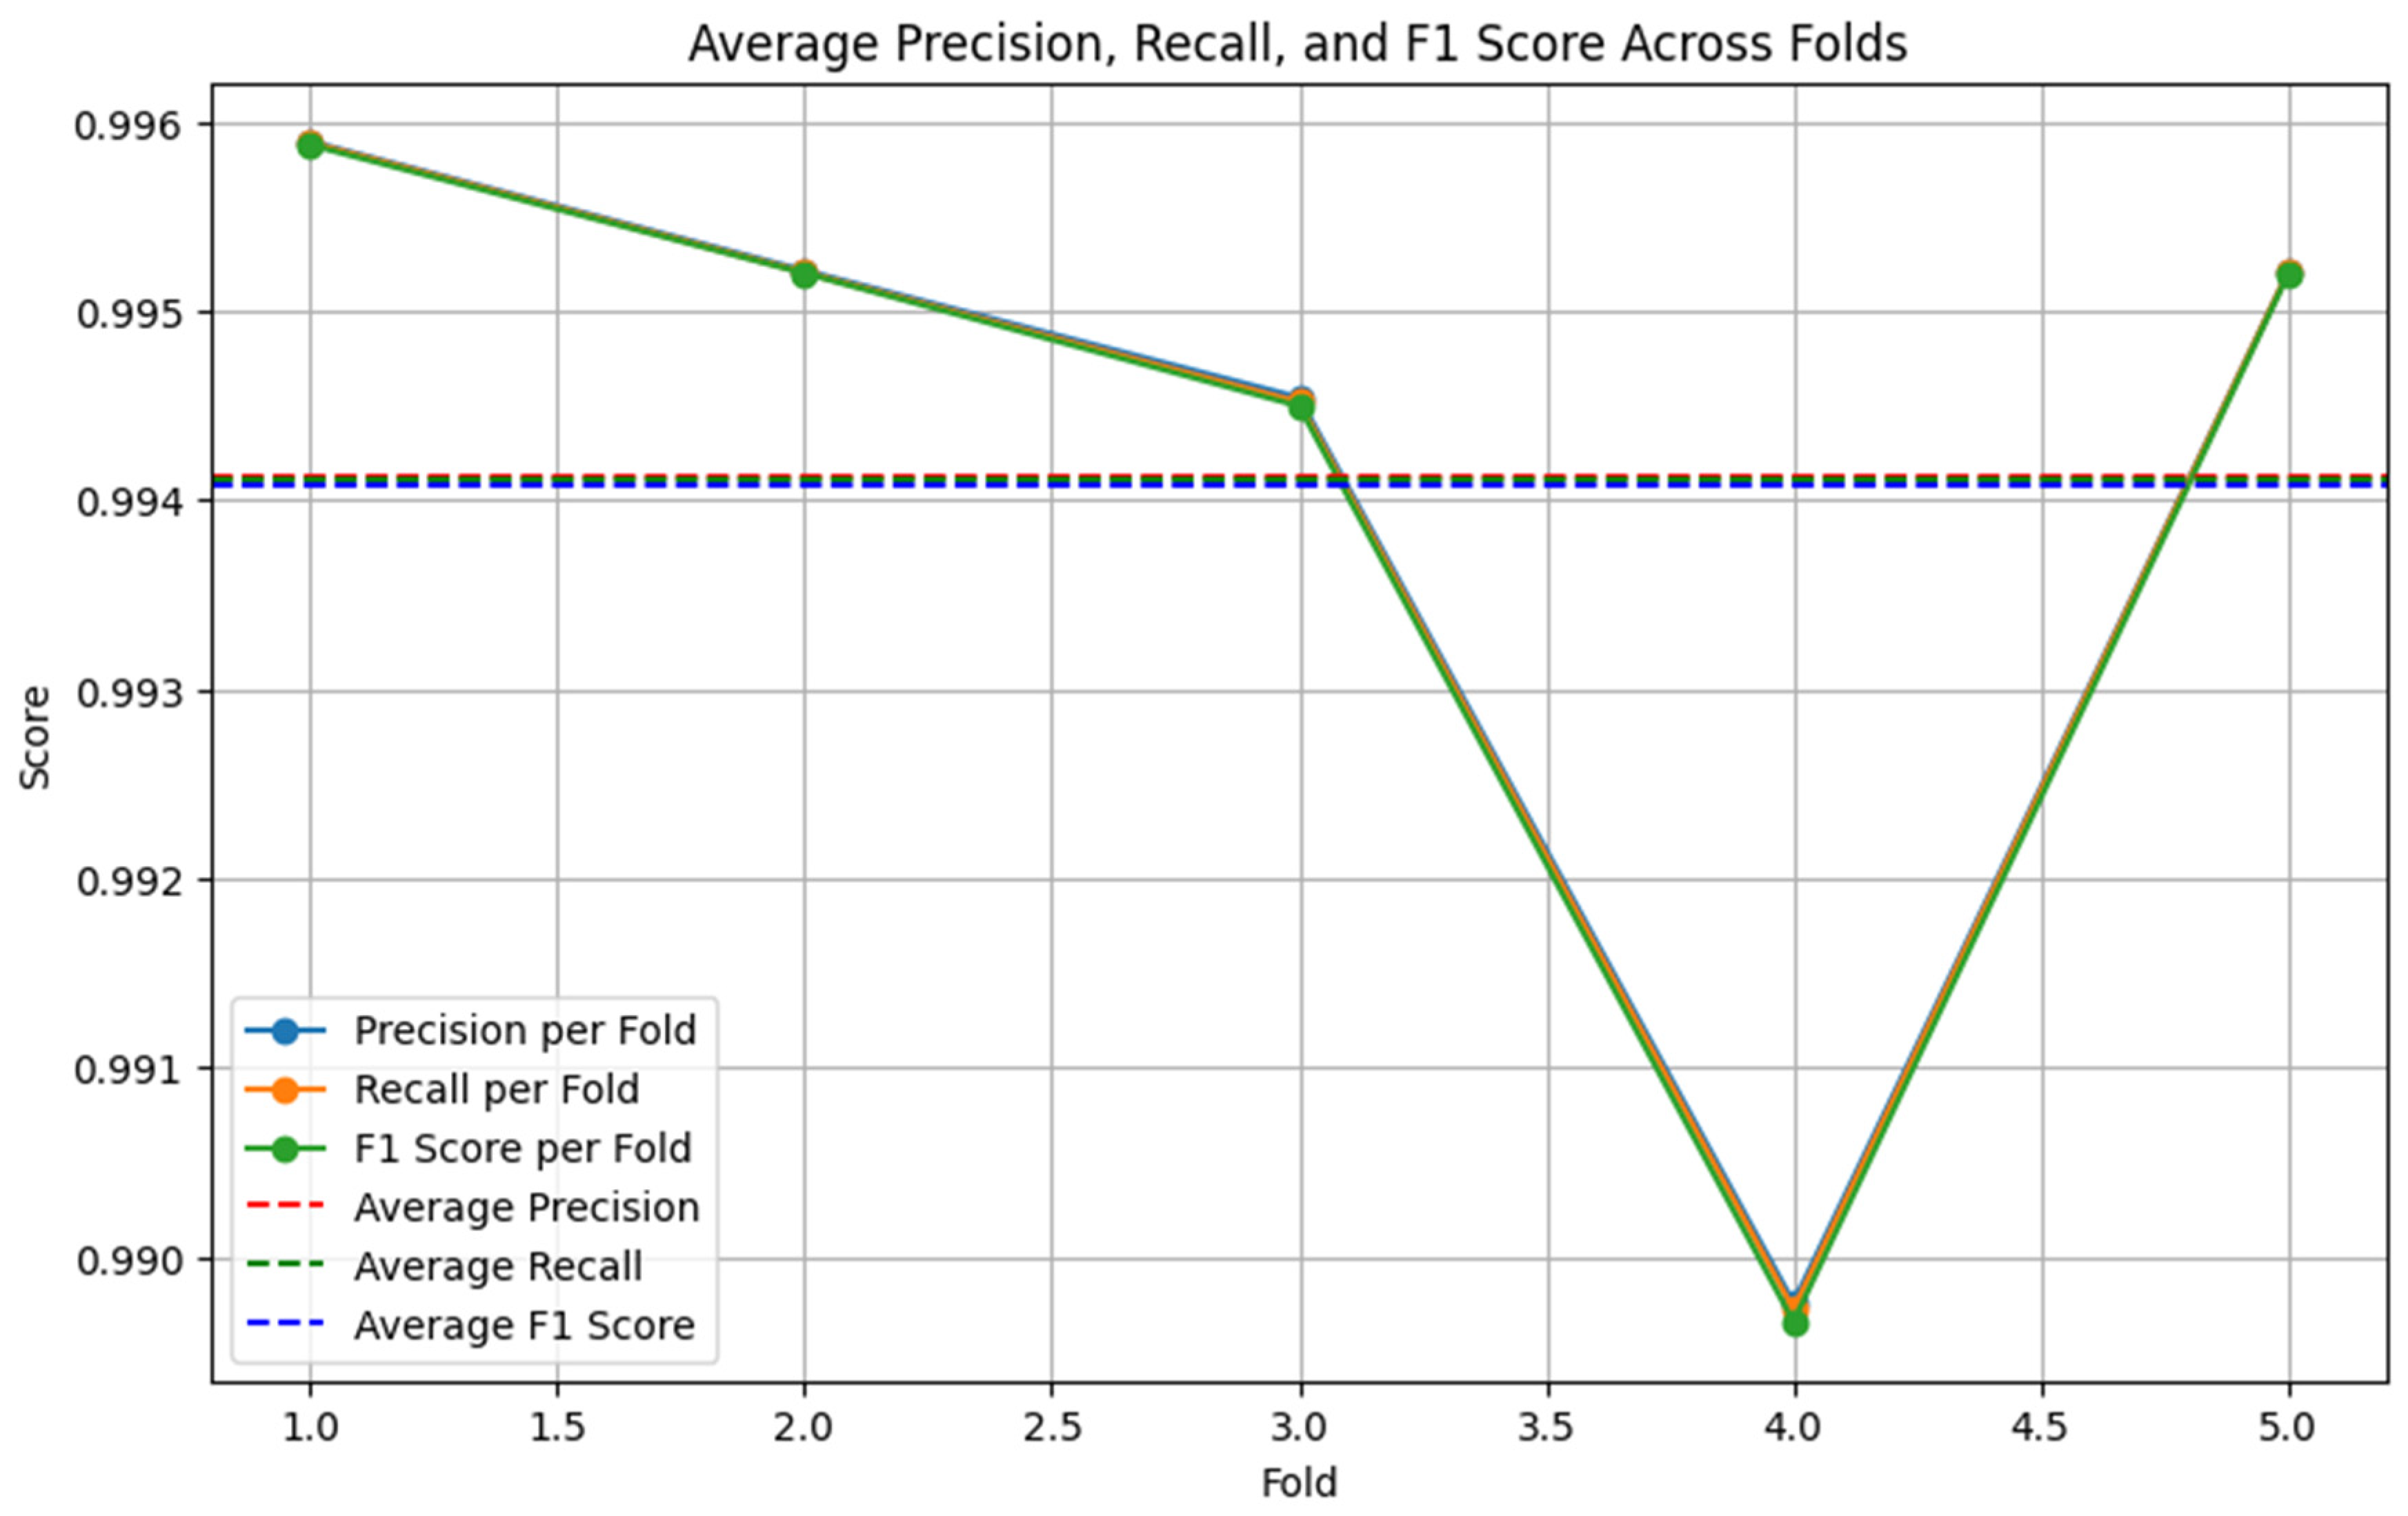
Figure 6.
RoBERTa-LSTM performance on the original dataset (5-fold cross-validation).

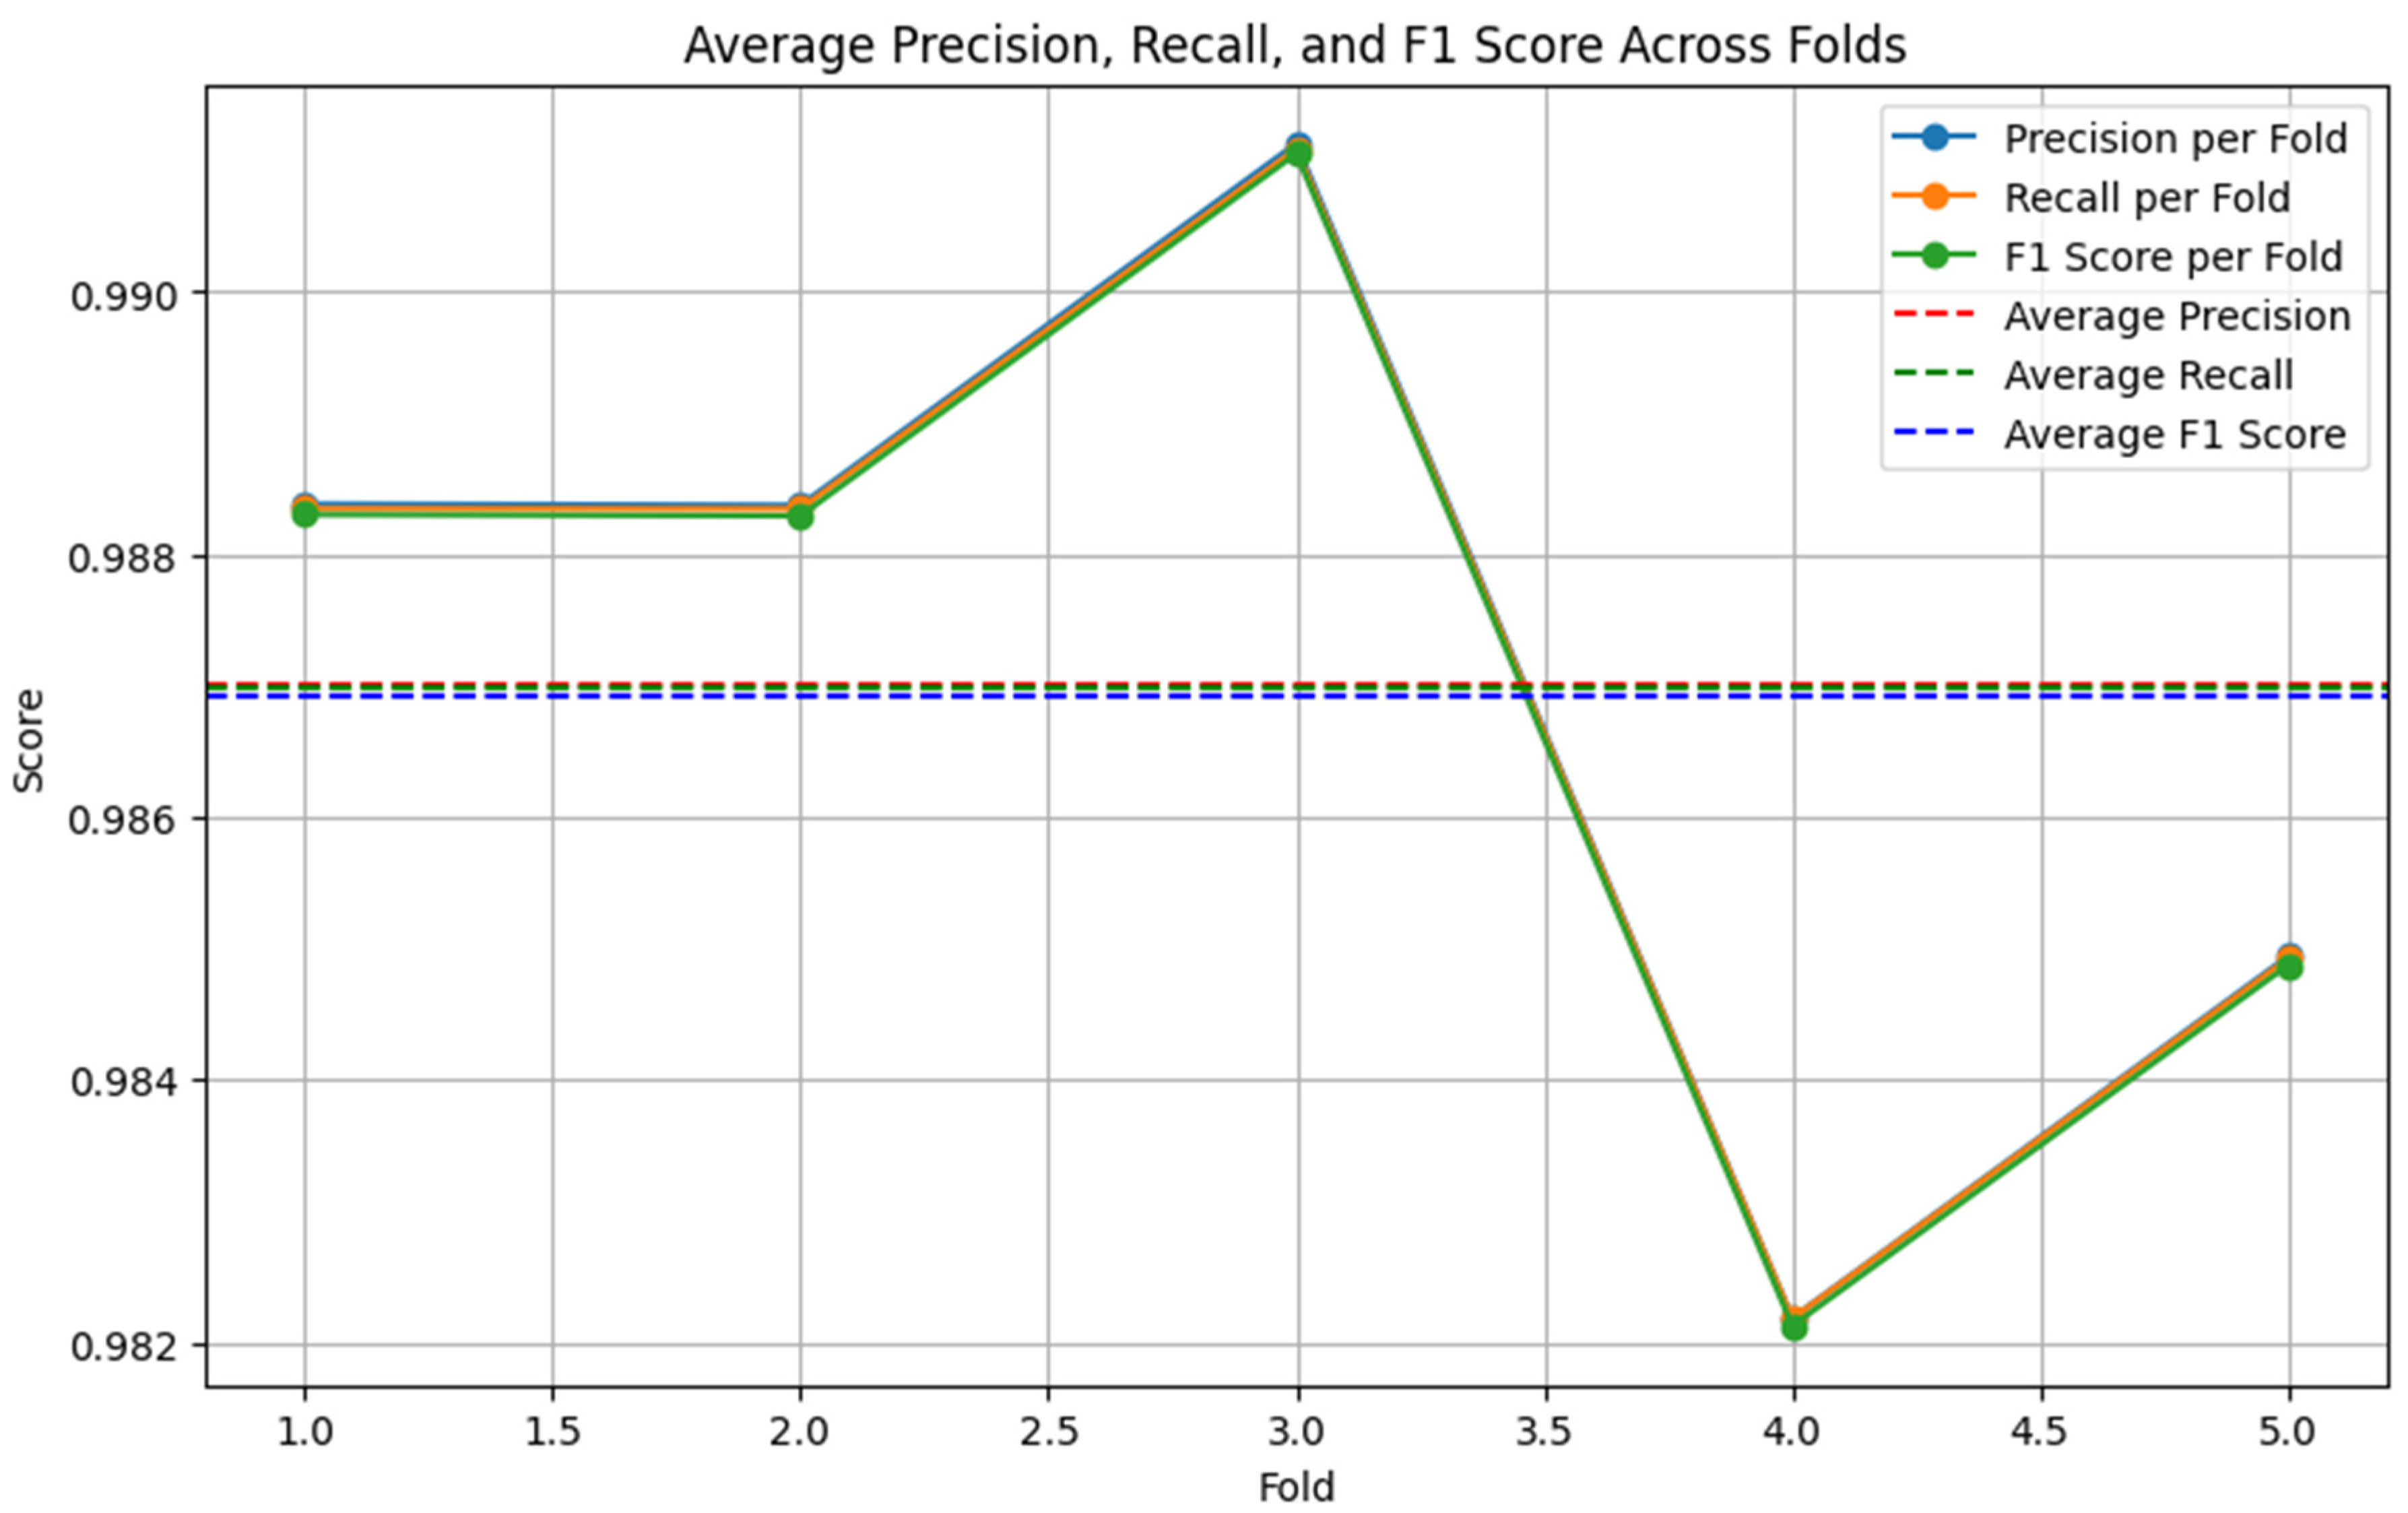
Figure 7.
XGB-TFIDF performance on the original dataset (5-fold cross-validation).
4.2. Classification Using Machine Learning Models and Deep Learning on the Augmented Dataset
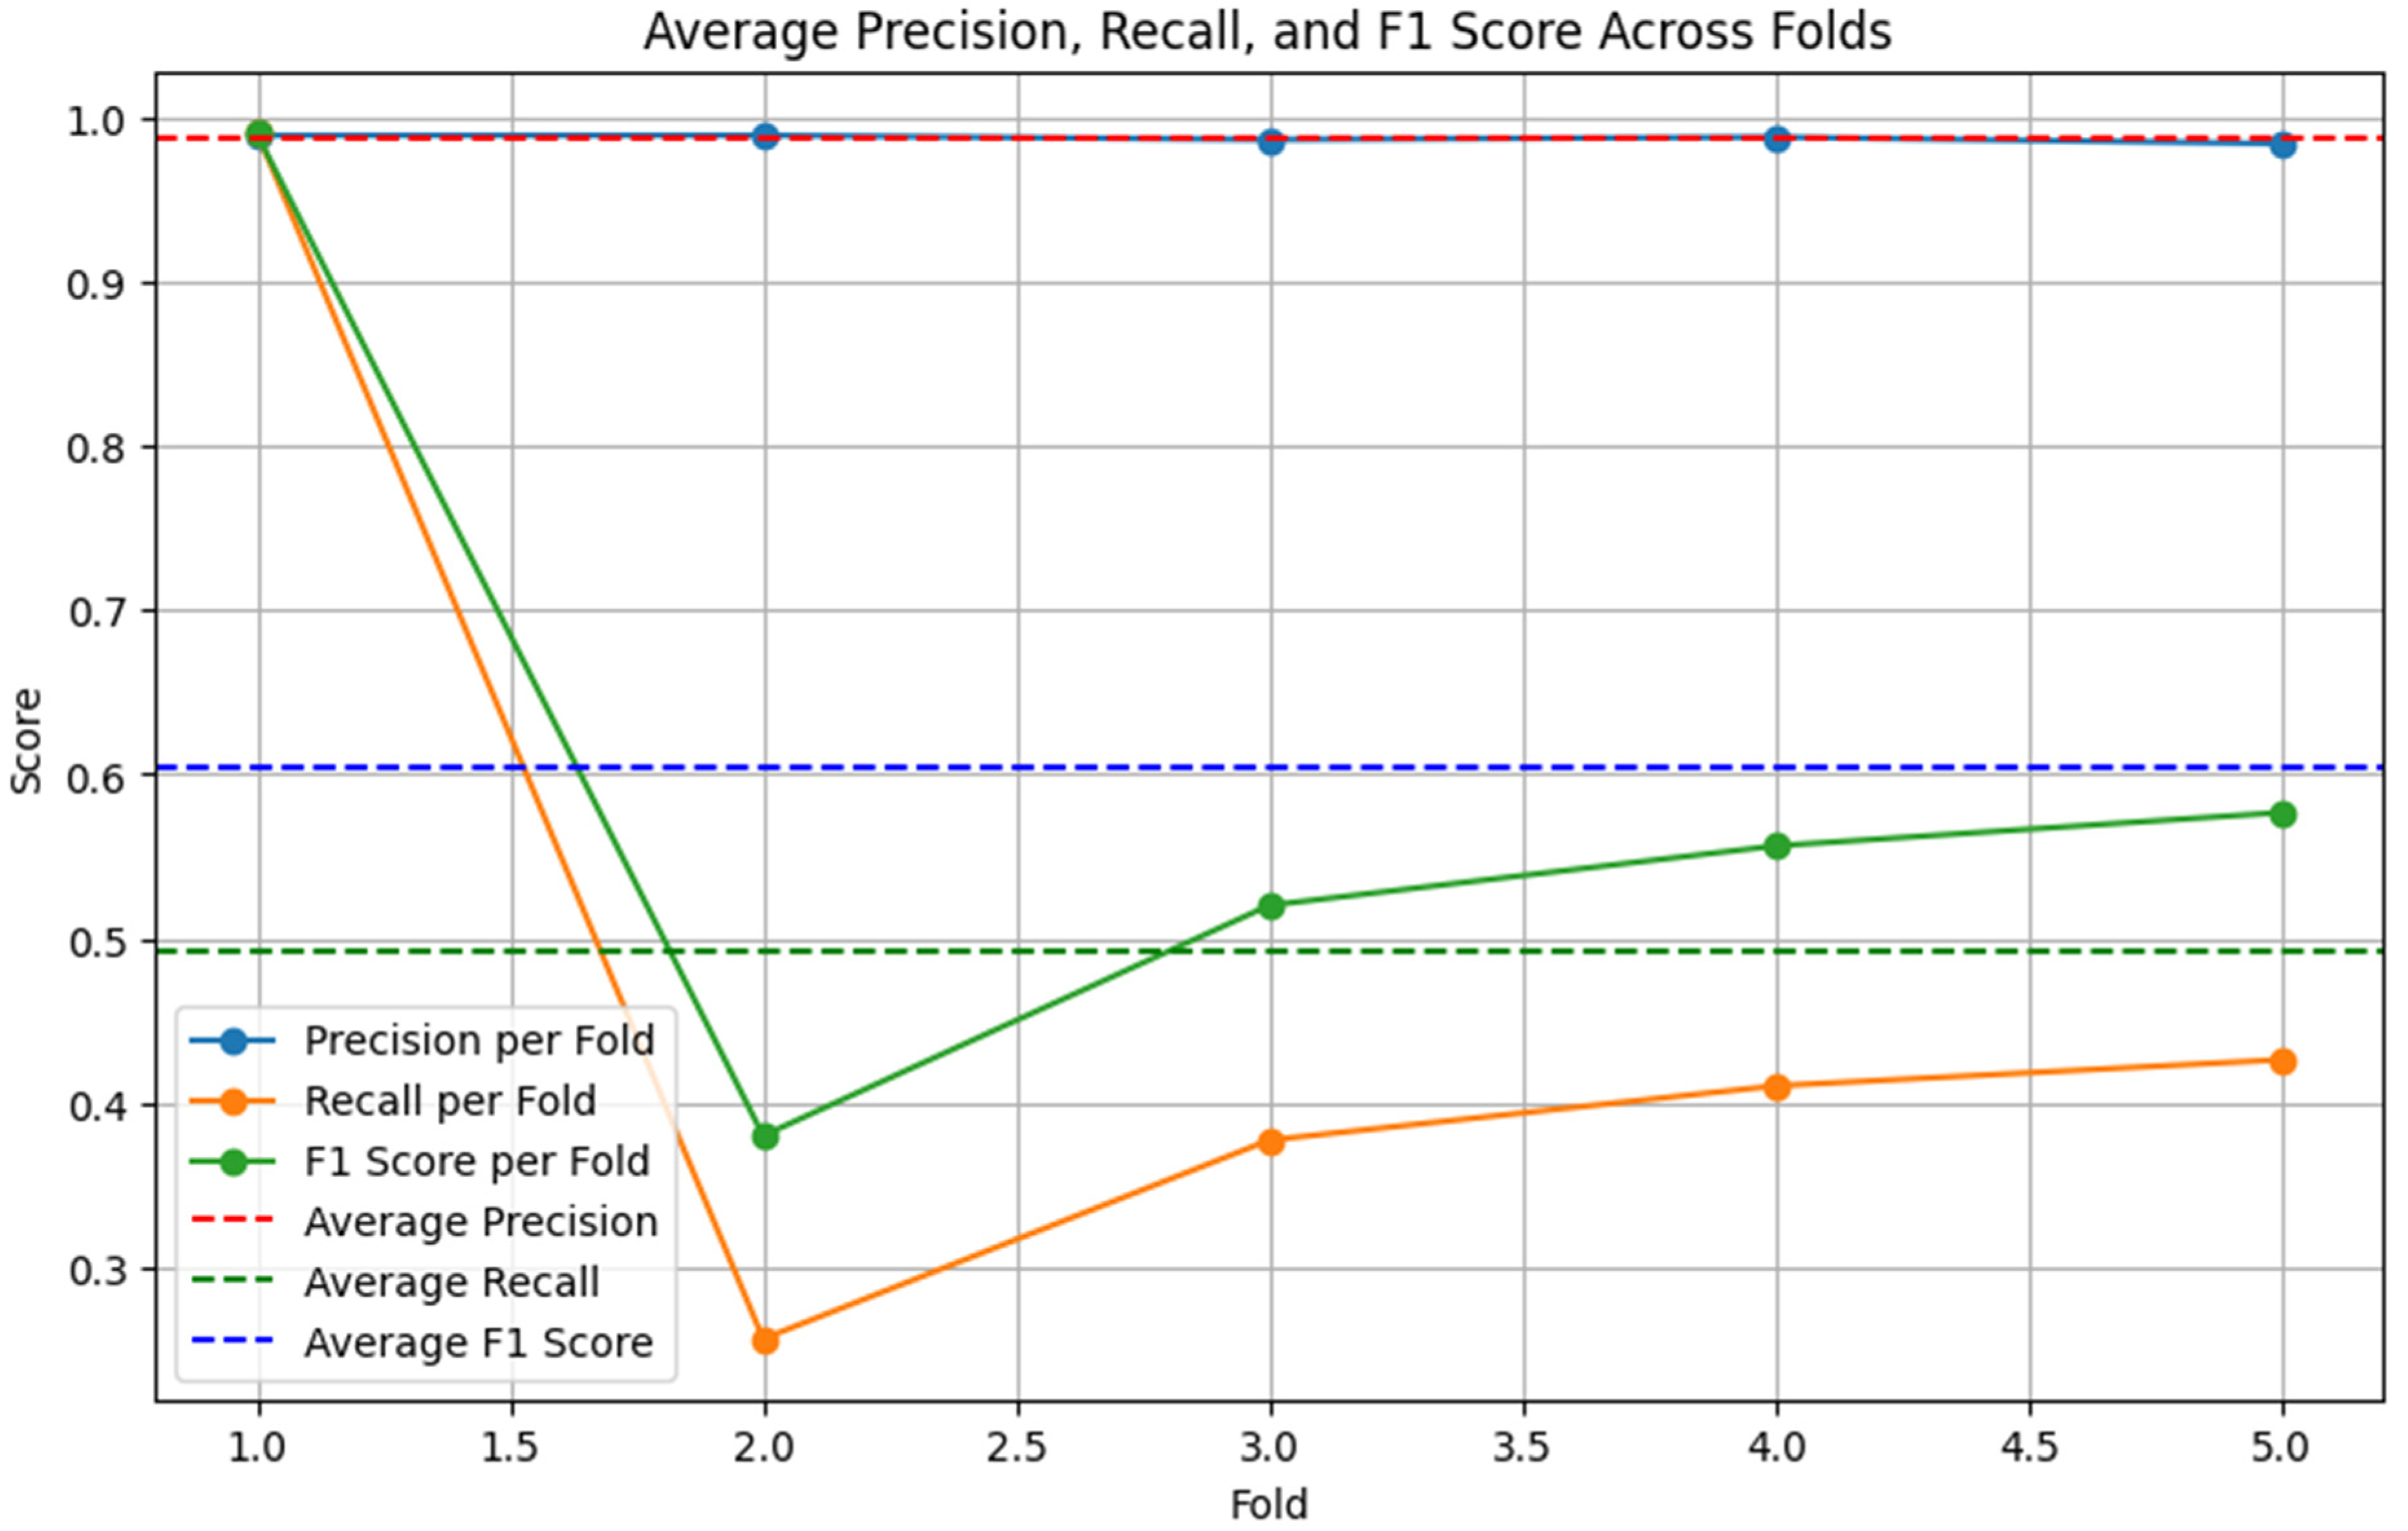
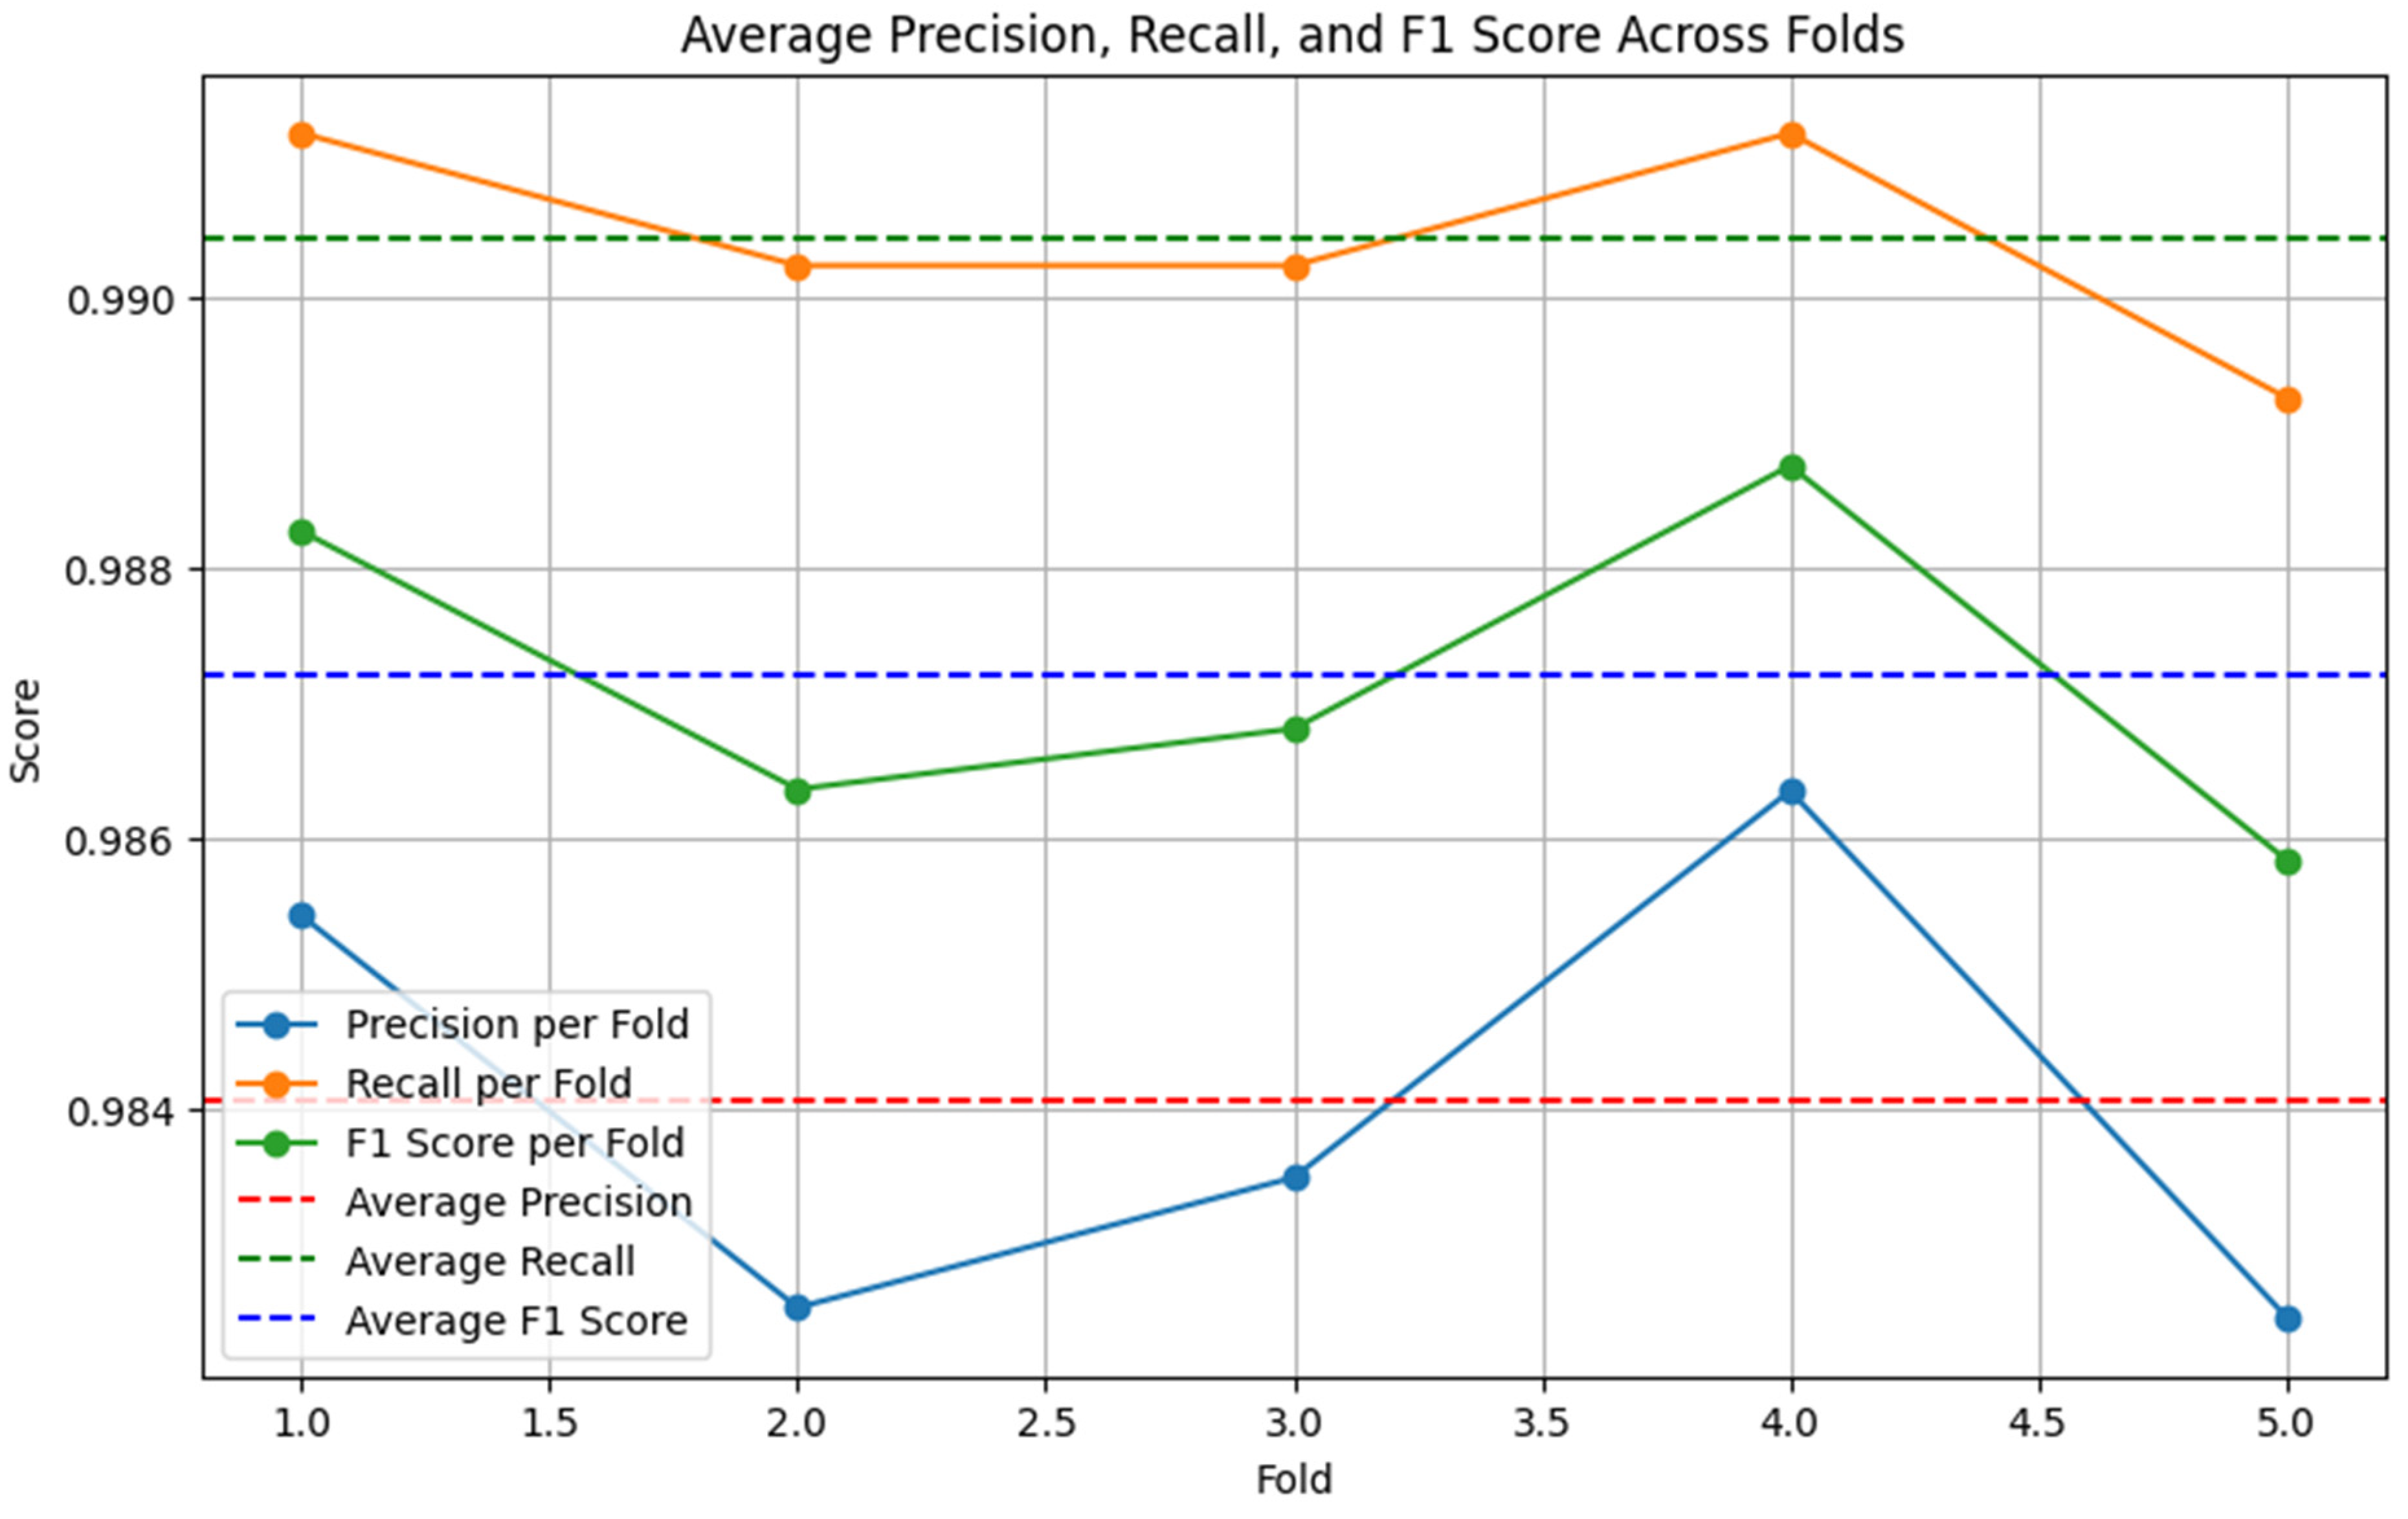
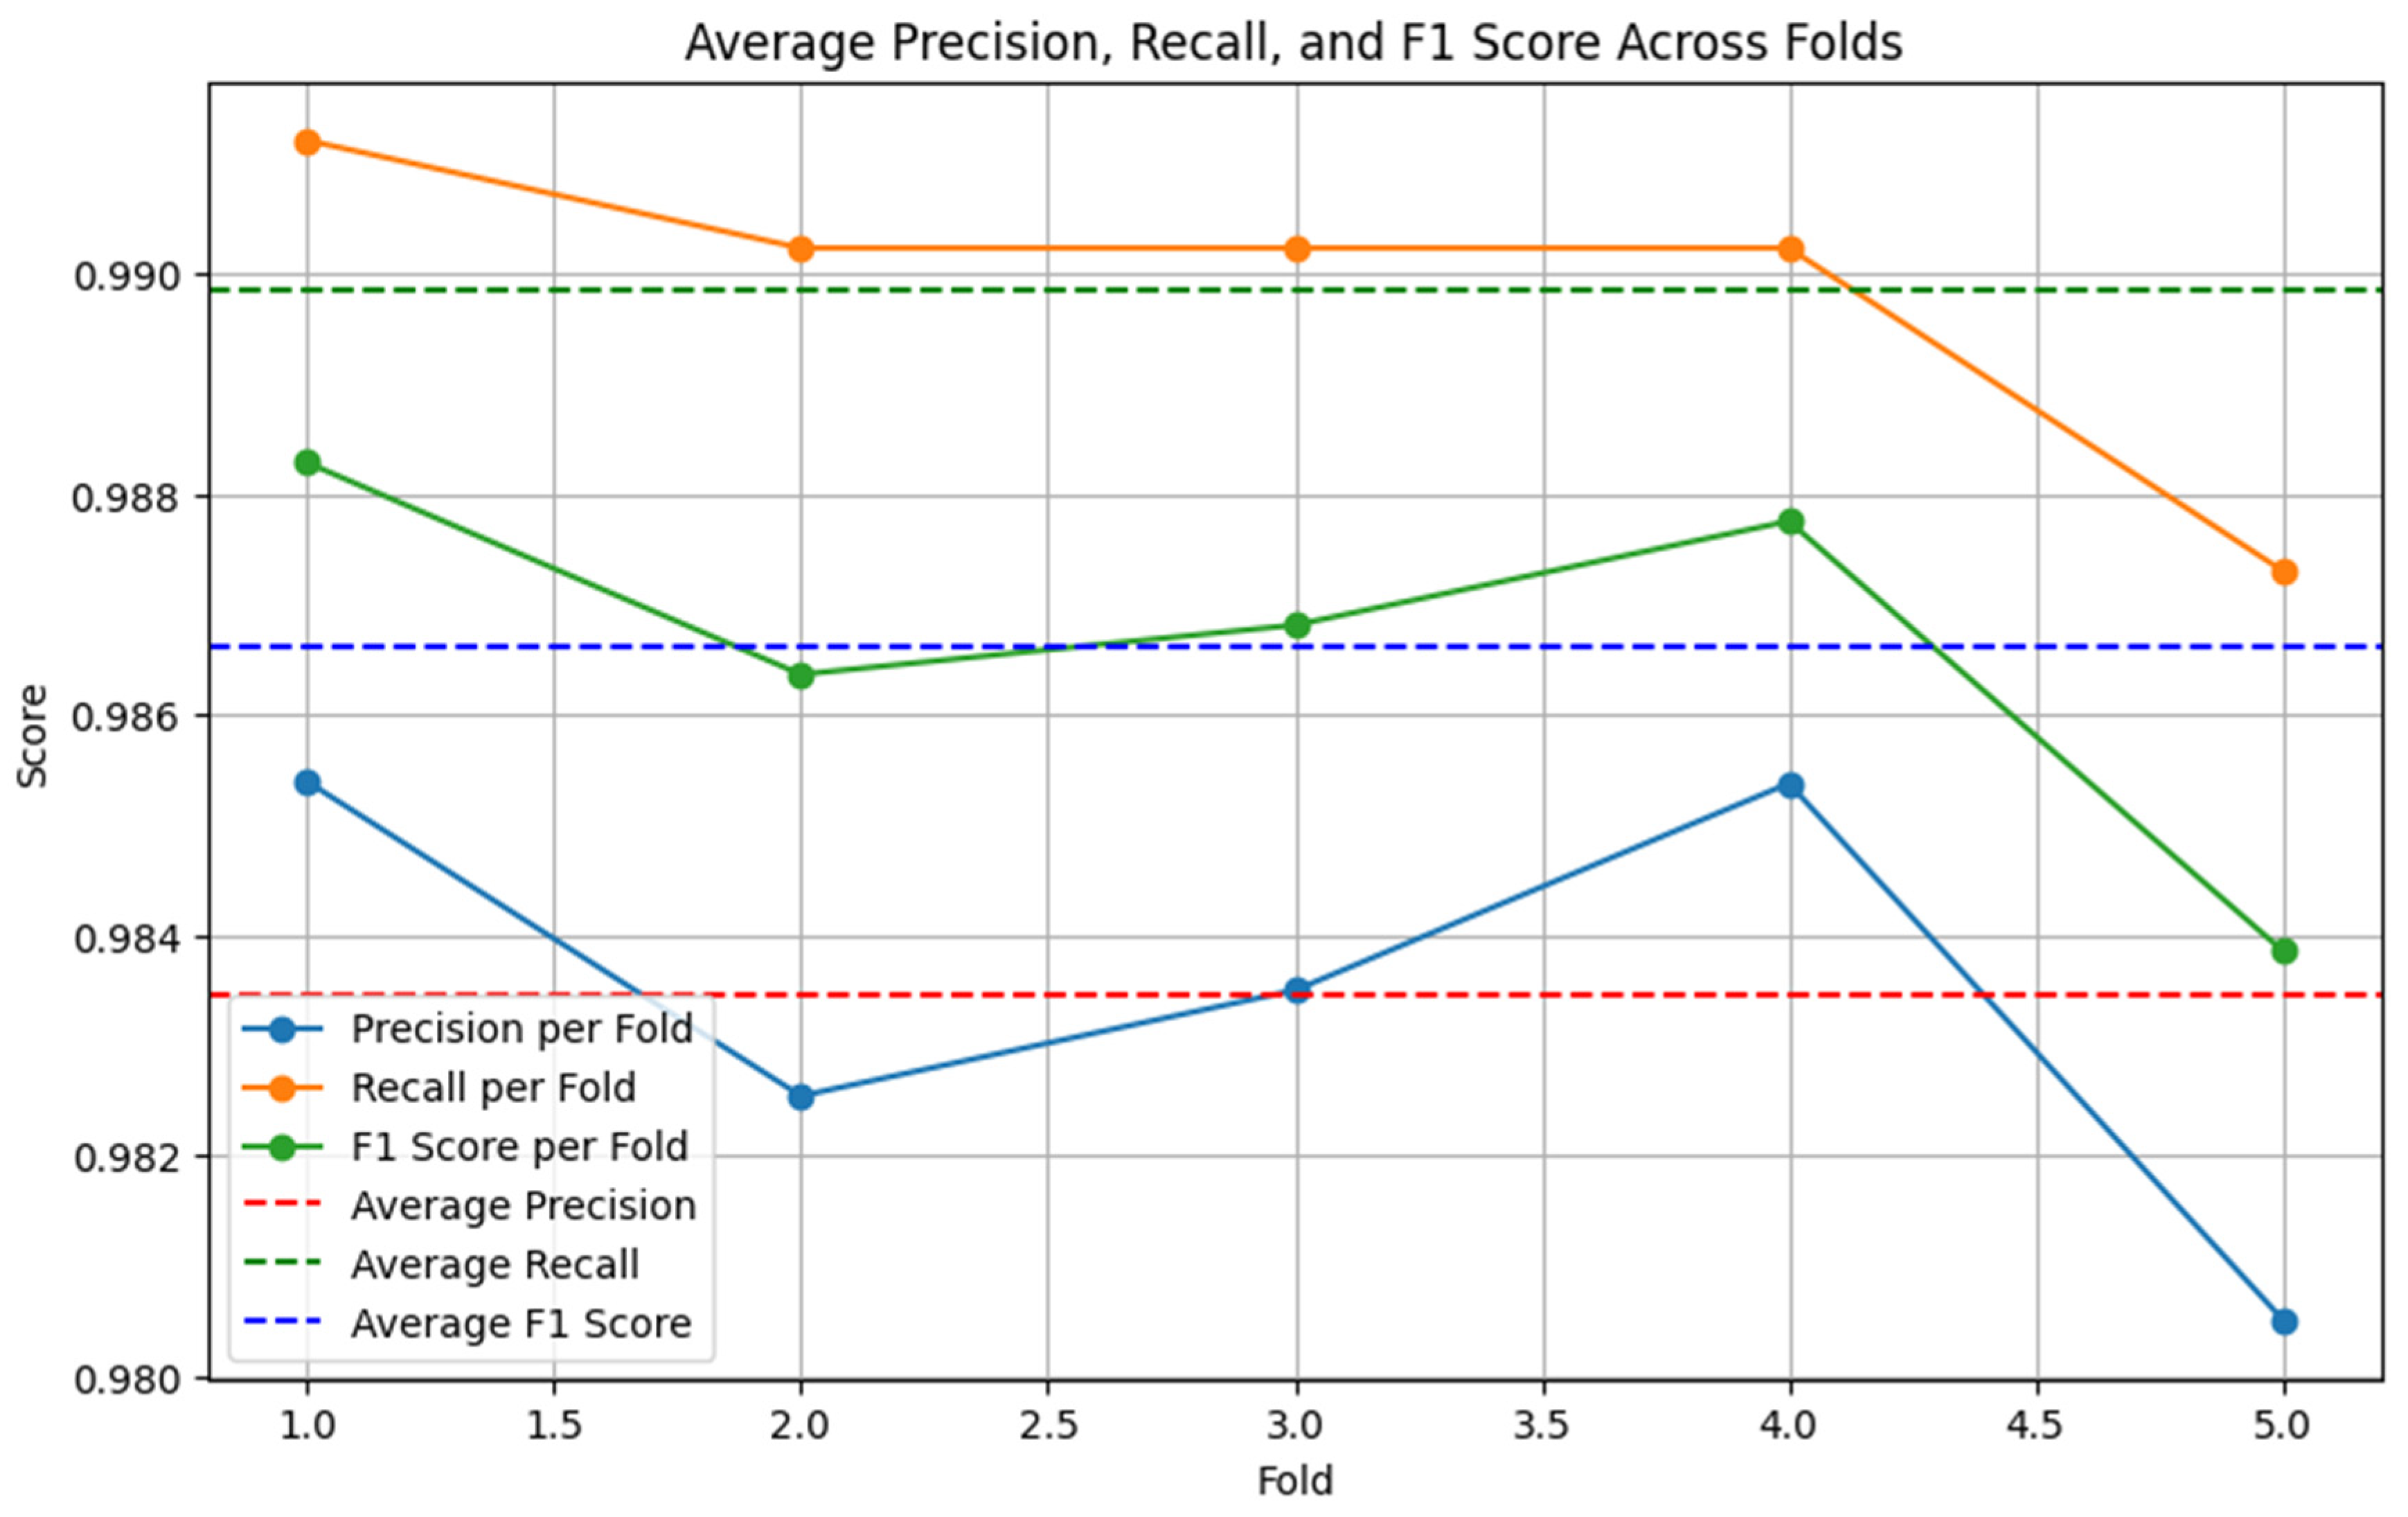
In Experiment 2, we repeated the same evaluation using the augmented dataset. The same machine learning models (XGB, RF, NB) combined with TF-IDF, Word2Vec, and BERT embeddings were assessed. Additionally, the BERT-LSTM and RoBERTa-LSTM models were fine-tuned and evaluated on the augmented dataset. The best-performing models (XGB-TFIDF, BERT-LSTM, RoBERTa-LSTM) were again used to create an ensemble hard voting model. Figure 8, Figure 9 and Figure 10 display the precision, recall, and F1 score on the augmented dataset for the BERT-LSTM, RoBERTa-LSTM, and XGB models, respectively. The performance metrics for the ensemble model on the augmented dataset are shown in Section 5.
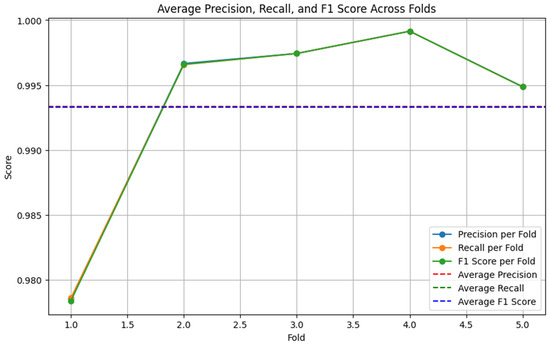
Figure 8.
BERT-LSTM performance on augmented dataset (5-fold cross-validation).

Figure 9.
RoBERTa-LSTM performance on augmented dataset (5-fold cross-validation).
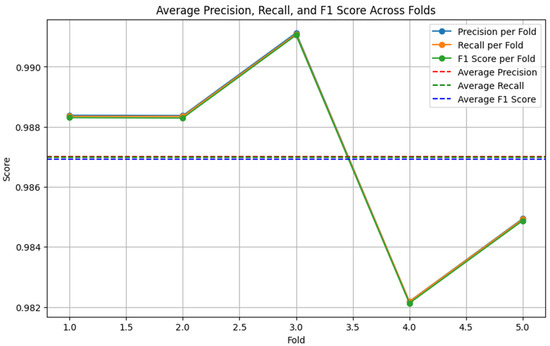
Figure 10.
XGB-TFIDF performance on augmented dataset (5-fold cross-validation).
Both the BERT-LSTM and RoBERTa-LSTM models were trained and evaluated on both the original and augmented datasets, with their performances compared to analyze the impact of data augmentation.
4.3. Ensemble Model with Hard Voting
4.3.1. Background
Generally, machine learning and deep learning algorithms require a large number of samples to train a robust model capable of performing the classification task efficiently. To improve the classification performance, researchers have adopted ensemble-based classification using different voting schemes, such as soft vs. hard voting [12,54,55]. In ensemble voting, the decisions of multiple base models are aggregated to produce the final decision that results in the overall classification accuracy surpassing any individual base model [56]. Ensemble techniques have been applied in different domains like document classification [57], image classification [58], and biomedical classification with promising results [59]. However, to the best of the author’s knowledge, this study is the first to be used in transportation to address crash severity classification.
4.3.2. Hard Voting Model
To enhance the crash severity classification, we employed three different models: BERT (DistilBERT), RoBERTa, and XGBoost (with TF-IDF). Each model was fine-tuned and configured with specific parameters to maximize performance. This approach aimed to improve performance by leveraging the strengths of each model on both the original and augmented datasets. Figure 11 shows an overview of the ensemble model with the top-performing classifiers. Table 2 provides an overview of the main settings and hyperparameters used for each model.
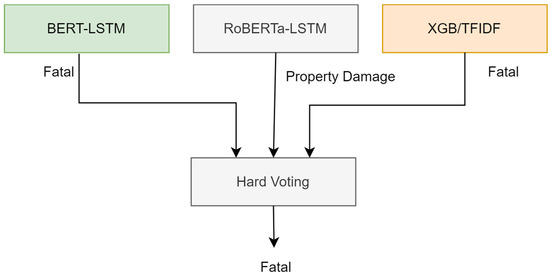
Figure 11.
Hard voting model.
Table 2.
Main settings and hyperparameters for BERT, RoBERTa, and XGBoost models.
The BERT model (DistilBERT) was fine-tuned with a Bidirectional Long Short-Term Memory (Bi-LSTM) layer, using the DistilBERT tokenizer with a maximum token length of 200. The model was optimized with the Adam optimizer and trained using a sparse categorical crossentropy loss function, with a batch size of 16 for 5 epochs. Uniform class weights were applied, and training dynamics were managed using ModelCheckpoint, EarlyStopping, and ReduceLROnPlateau callbacks. Similarly, the RoBERTa model was fine-tuned with a Bi-LSTM layer, employing the RobertaTokenizer with a maximum token length of 200. It shared the same optimizer and loss function as BERT but was trained for 10 epochs to ensure more extensive learning. Class weights were significantly adjusted to address class imbalance, particularly for the minority class, and the same callbacks as BERT were used. The XGBoost model, combined with TF-IDF vectorization for feature extraction, utilized a TF-IDF vectorizer configured to consider a maximum of 5000 features. The XGBoost classifier operated with default parameters and the m‘logloss’ evaluation metric, focusing on leveraging the TF-IDF vectorized features for classification without the need for the same type of preprocessing or callbacks required by the transformer models.
The ensemble method involved aggregating the predictions from each model into a 2D array and applying the mode function from scipy.stats to determine the most frequent prediction for each instance. By adopting the majority voting principle, where the class label predicted by at least two out of the three classifiers was selected as the final classification, the hard voting ensemble effectively combined the individual strengths of TF-IDF/XGB, BERT-LSTM, and RoBERTa-LSTM. This method improved the overall classification performance, particularly for the minority “Property Damage” class, by providing a more robust and accurate classification than any single model.
5. Experimental Results and Discussion
5.1. Experiment 1 Results
In Experiment 1, we trained three machine learning models (XGBoost, random forest, naive Bayes) using three embedding techniques (TF-IDF, Word2Vec, BERT) and two transformer-based models (BERT-LSTM and RoBERTa-LSTM) on the original dataset. After identifying the best-performing models, we applied an ensemble hard voting technique.
Table 3 shows the evaluation metrics for each model on the original dataset. The models performed differently based on the embedding techniques used.
Table 3.
Evaluation metrics for models on the original dataset.
After evaluating the models, we found that the RoBERTa-LSTM, XGB-TFIDF, and BERT-LSTM were the best-performing models on the original dataset. Therefore, we applied an ensemble hard voting technique to these models. Table 4 shows the performance of the ensemble model on the original dataset.
Table 4.
Ensemble model performance on the original dataset.
5.2. Experiment 2 Results
In Experiment 2, we repeated the evaluation of the augmented dataset using the same models and embedding techniques. We then applied an ensemble hard voting technique to the best-performing models. Table 5 shows the evaluation metrics for each model on the augmented dataset. The best-performing models on the augmented dataset were XGB-TFIDF, BERT-LSTM, and RoBERTa-LSTM. We combined these models using an ensemble hard voting technique. Table 6 shows the performance of the ensemble model on the original dataset.
Table 5.
Evaluation metrics for models on the augmented dataset.
Table 6.
Ensemble model performance on the augmented dataset.
5.3. Hard Voting Model
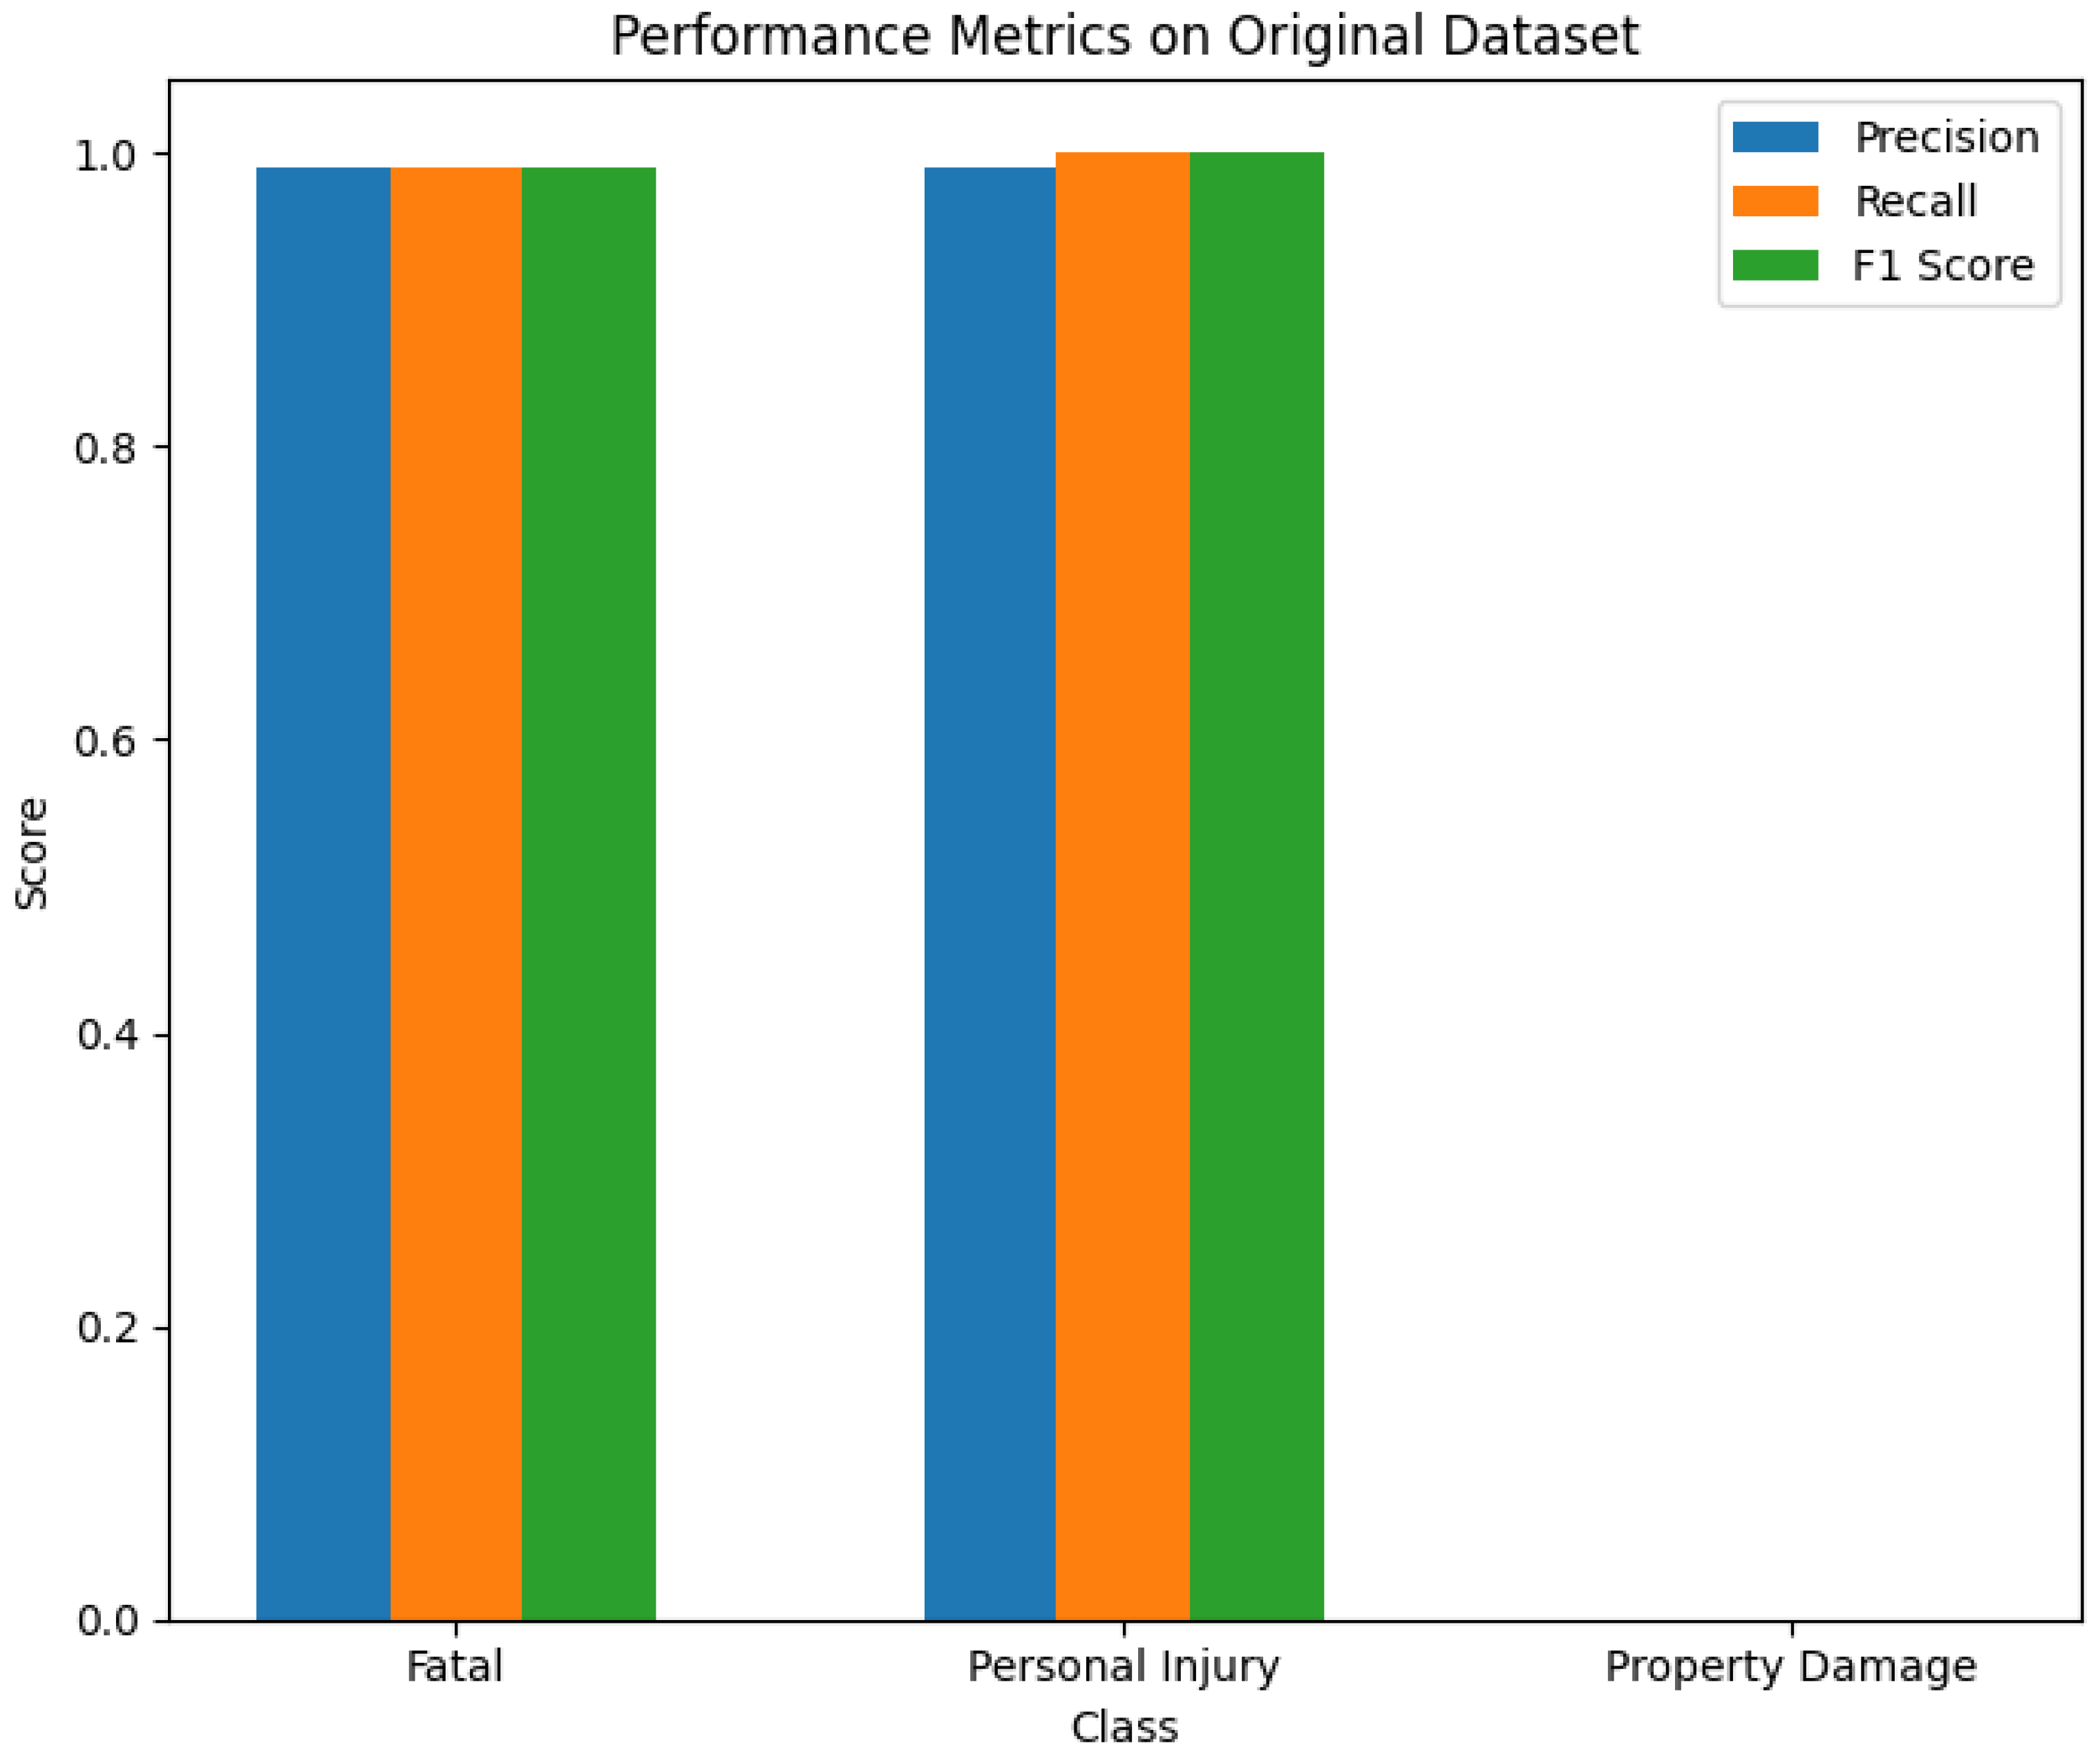
The ensemble model demonstrated significant improvements in precision, recall, and F1 score compared to individual models, as shown in Figure 12 and Figure 13. These figures highlight the performance metrics of the ensemble model on both the original and augmented datasets, clearly indicating the advantages of data augmentation and the hard voting approach for crash severity classification.
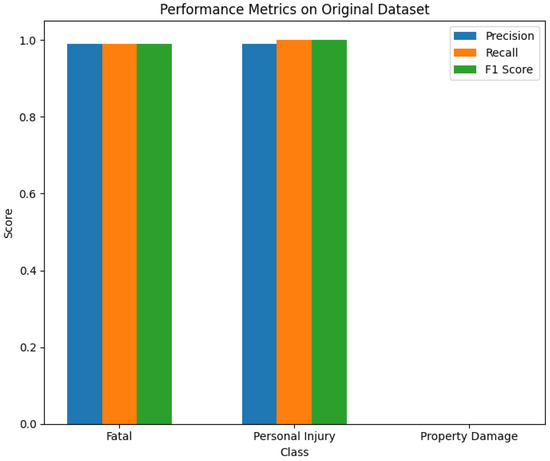
Figure 12.
The performance metrics of the ensemble model on the original dataset.
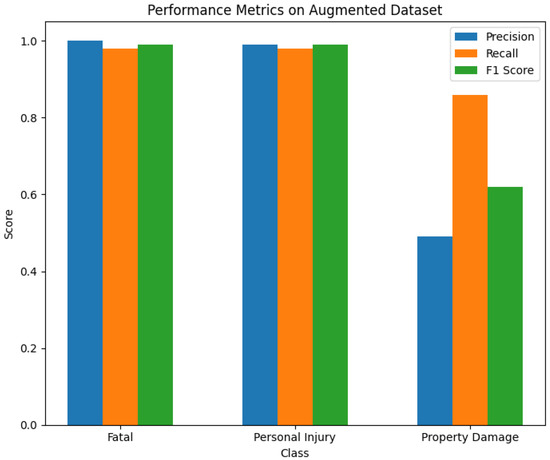
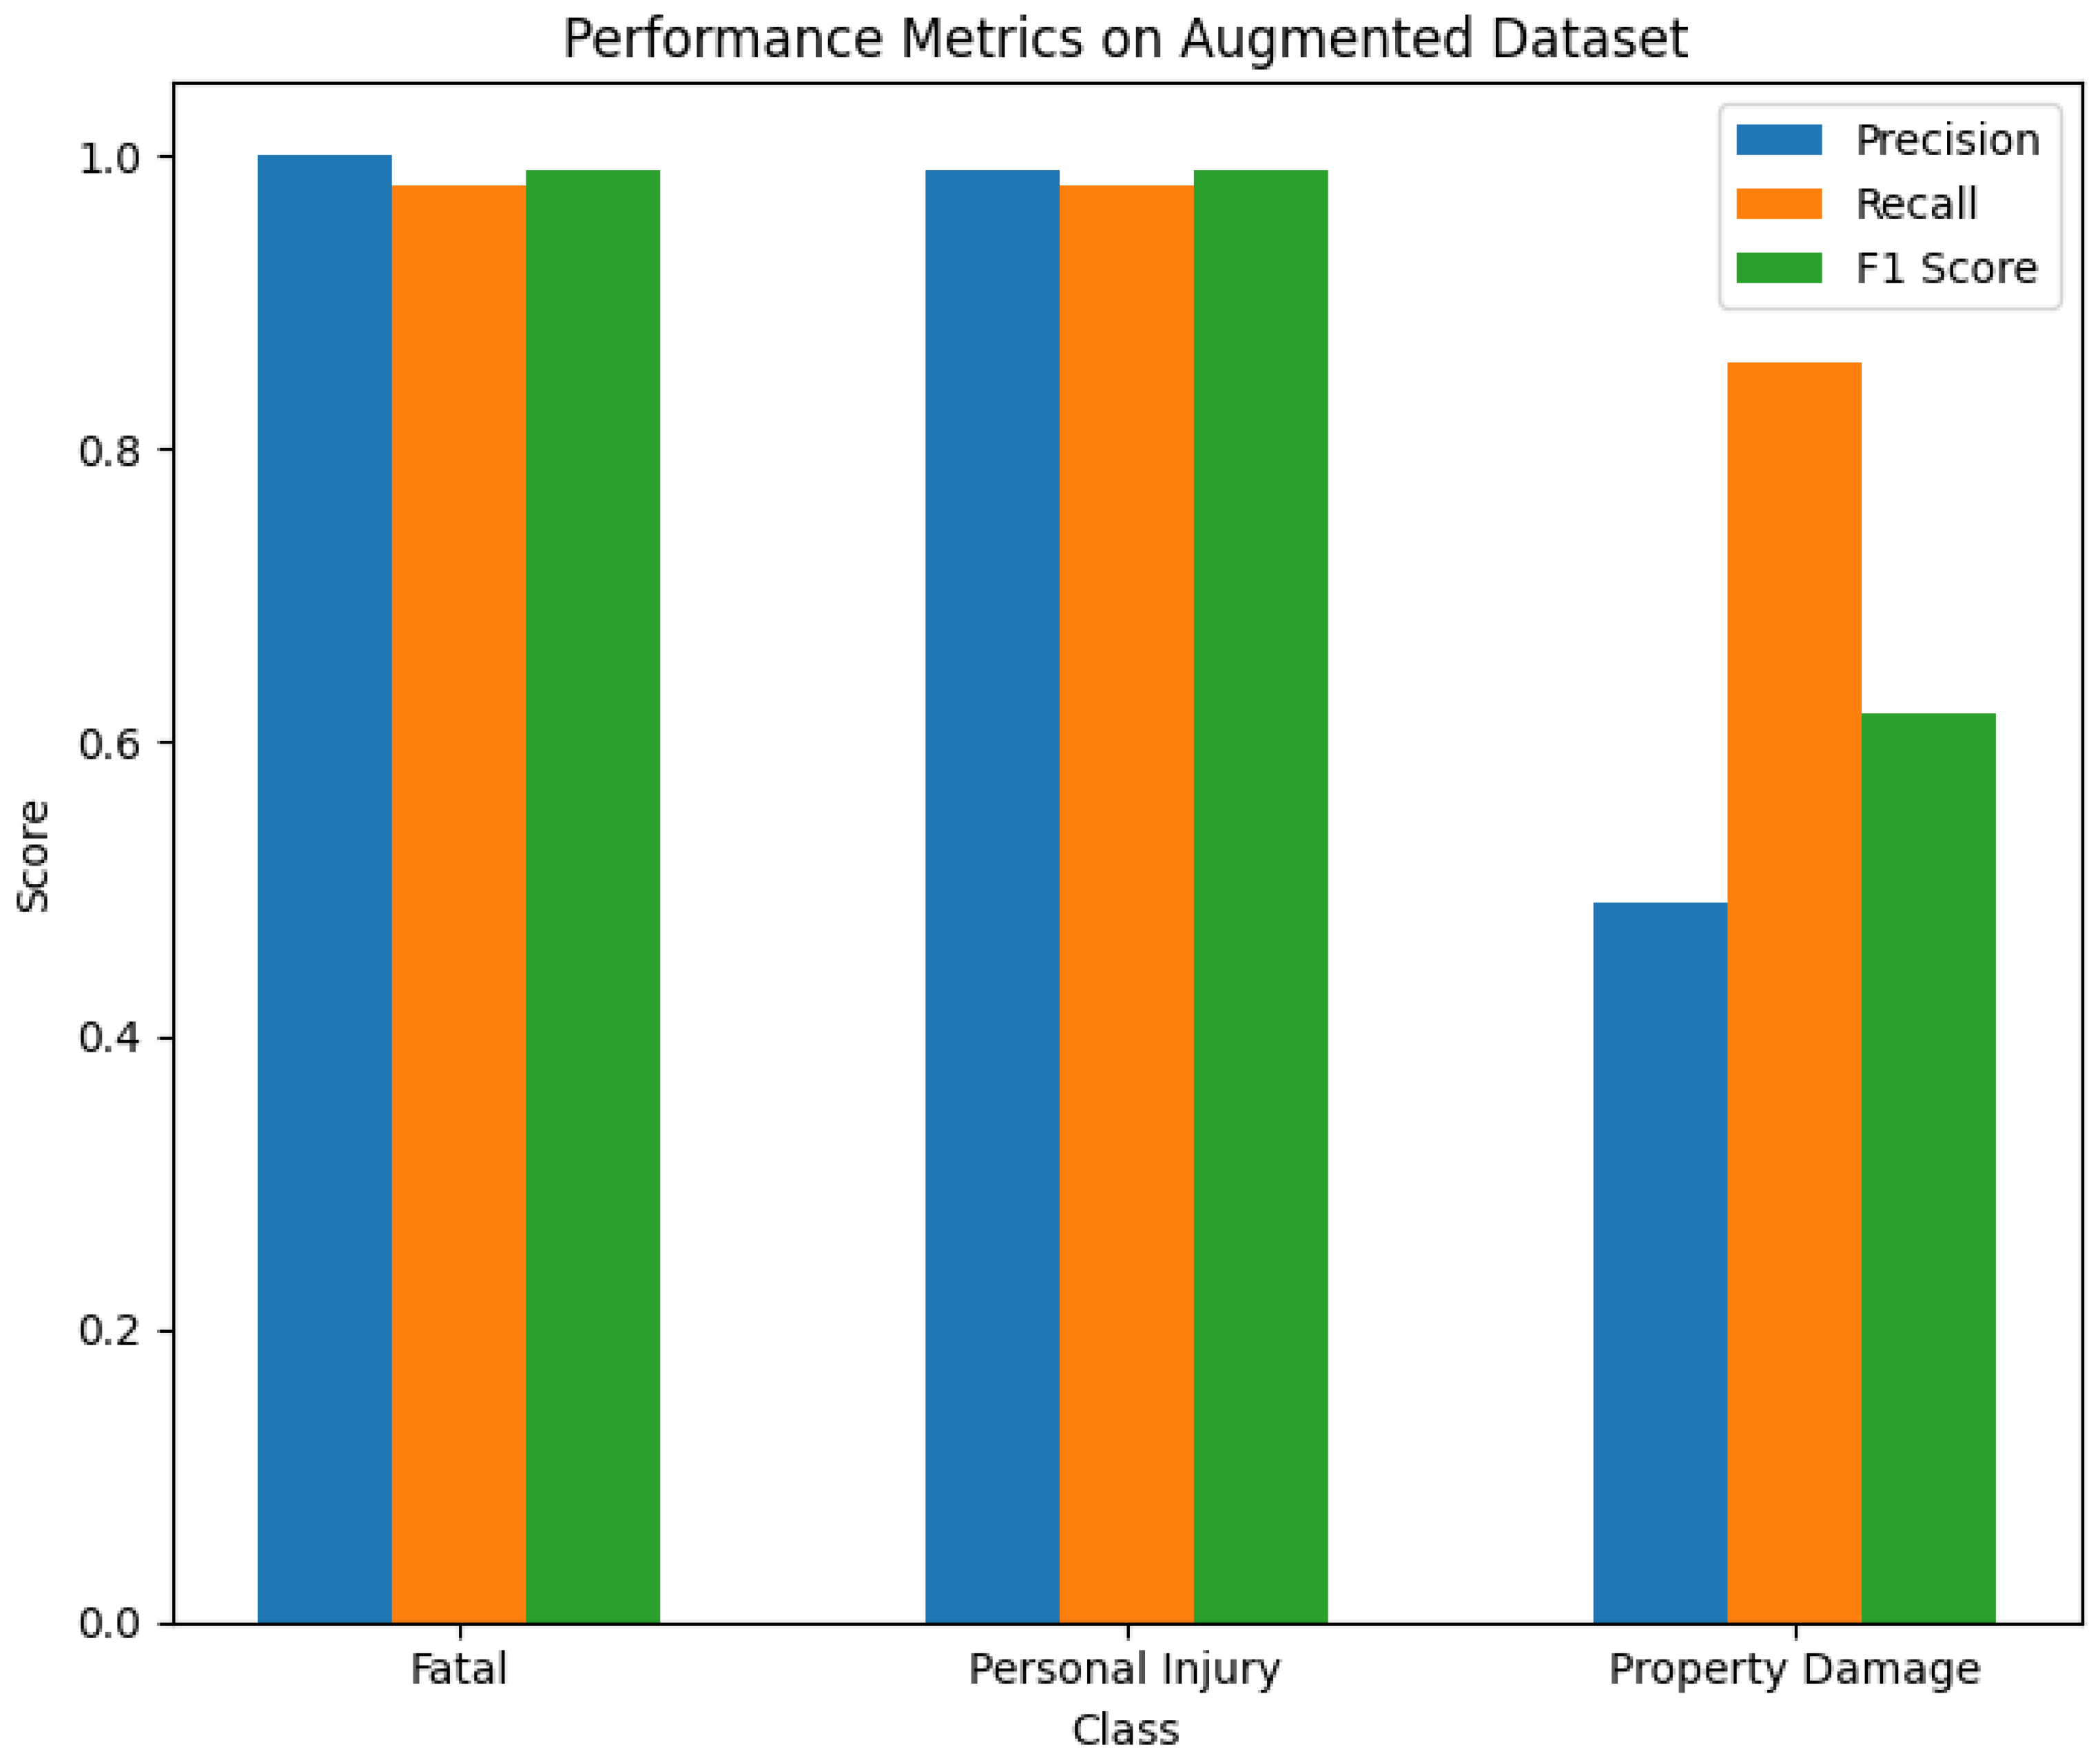
Figure 13.
The performance metrics of the ensemble model on the augmented dataset.
To enhance crash severity classification, we implemented an ensemble method using a hard voting classifier. This involved combining predictions from three top-performing models, BERT (DistilBERT), RoBERTa, and XGBoost, each trained on the augmented dataset. This hard voting mechanism capitalized on the strengths of each model, improving the overall classification performance, especially for the minority “Property Damage” class.
5.4. Discussion
The main observations from our study indicate that model performance varies significantly between the original and augmented datasets. On the original dataset, all models demonstrated strong performance for the Fatal and Personal Injury classes but struggled to classify the “Property Damage” classes. For instance, the XGB-TFIDF model achieved an F1 score of 0.9768 for “Fatal” and 0.9954 for “Personal Injury” but 0.0 for “Property Damage”. This pattern was consistent across other models, highlighting the challenge of classifying minority classes in imbalanced datasets. In contrast, the augmented dataset showed improved performance for minority class classification, particularly for the “Property Damage” class. The XGB-TFIDF model, for example, achieved an F1 score of 0.5122 for “Property Damage,” demonstrating the effectiveness of data augmentation.
Based on the performance metrics, the best three models selected for the ensemble hard voting were XGB-TFIDF, BERT-LSTM, and RoBERTa-LSTM. These models were chosen due to their superior performance across both datasets. For instance, BERT-LSTM achieved an F1 score of 0.98 for “Fatal” and 0.56 for “Personal Injury” on the original dataset while improving to 0.98 for “Fatal” and 0.96 for “Personal Injury” on the augmented dataset. Similarly, the RoBERTa-LSTM model consistently performed well, with an F1 score of 0.99 for “Fatal” and 1.00 for “Personal Injury” on the original dataset and maintaining high scores on the augmented dataset. These selections were justified by their robust performance and ability to handle the increased complexity of the data, thus making them ideal candidates for ensemble learning.
The ensemble model’s performance on both the original and augmented datasets underscores its effectiveness. On the original dataset, the ensemble model achieved high precision, recall, and F1 scores for the “Fatal” and “Personal Injury” classes, with F1 scores of 0.99 and 1.00, respectively, but failed to classify the “Property Damage” class, resulting in an F1 score of 0.0. In contrast, on the augmented dataset, the ensemble model showed significant improvement, with the “Property Damage” class achieving an F1 score of 0.62 and macro and weighted average F1 scores increasing to 0.87 and 0.98, respectively. These results demonstrate the ensemble model’s robustness and enhanced capability to handle imbalanced datasets through data augmentation. Despite these improvements, the performance for the “Property Damage” class remains lower than desired, indicating a need for further research to refine augmentation techniques and model architectures to address this challenge better.
6. Conclusions and Future Work
This study significantly contributes to crash severity classification using ensemble learning with pre-trained transformers and traditional machine learning models. We evaluated the effectiveness of various word embedding techniques (TF-IDF, Word2Vec, and BERT) combined with machine learning classifiers (XGBoost, random forest, and naive Bayes) and advanced models (BERT and RoBERTa fine-tuned with Bi-LSTM) through two comprehensive experiments.
The findings demonstrate that data augmentation and ensemble learning notably improve model performance, particularly in addressing class imbalance issues. In the first experiment on the original dataset, the combination of TF-IDF with XGBoost achieved high F1 scores for “Personal Injury” (99%) but struggled with the “Property Damage” class. Similarly, BERT-LSTM performed well for “Fatal” (98%) but poorly for “Property Damage” (2%). The ensemble model, combining TF-IDF/XGB, BERT-LSTM, and RoBERTa-LSTM, improved the overall performance with an F1 score of 99% for “Fatal” and 100% for “Personal Injury” but still failed to classify “Property Damage” effectively.
In the second experiment on the augmented dataset, the ensemble model significantly improved classification performance across all classes. It achieved F1 scores of 99% for “Fatal”, 99% for “Personal Injury”, and 62% for “Property Damage”, showing substantial improvement for the minority class compared to individual models. For instance, the XGB-TFIDF model achieved F1 scores of 98% for “Fatal”, 98% for “Personal Injury”, and 51% for “Property Damage”.
Despite these improvements, the classification performance for the “Property Damage” class still needs further enhancement, highlighting the necessity for additional research. Future work will focus on expanding the dataset to include traffic data from various sources to further evaluate model robustness. Additionally, we aim to integrate hybrid features from both text narratives and tabular data and apply explainable A.I. techniques to interpret model results and identify key factors contributing to crash severity. Further research will also explore new data augmentation methods and advanced modeling approaches to improve performance for minority classes. Moreover, we plan to refine our approach by considering the potential benefits of employing a weighted voting system, as well as other ensembling techniques, to further enhance the robustness and accuracy of our classification models.
Author Contributions
Conceptualization, S.J. and M.E.; software, S.J.; formal analysis, S.J. and M.E.; investigation, S.J., and M.E.; data curation, A.P.; writing—original draft preparation, S.J.; writing—review and editing, S.J., M.E., and R.N.; visualization, S.J. and M.E.; supervision, M.E., R.N., and A.P. All authors have read and agreed to the published version of the manuscript.
Funding
This research received no external funding.
Data Availability Statement
The original contributions presented in the study are included in the article, further inquiries or requests can be directed to the corresponding author.
Acknowledgments
I would like to thank the Queensland University of Technology (Q.U.T.) for funding this research. This work is conducted as part of my PhD research, supported by a funded scholarship from QUT.
Conflicts of Interest
The authors declare that they have no known competing financial interests or personal relationships that could have appeared to influence the work reported in this paper.
References
- Oestergaard, F.; Beck Kinman, S.; Ravn Pedersen, S. Control your data or drown trying. I.B.M. Nordic Blog 2013. Available online: https://www.ibm.com/blogs/nordic-msp/control-your-data-or-drown-trying/ (accessed on 23 May 2024).
- Hotho, A.; Nürnberger, A.; Paaß, G. A brief survey of text mining. J. Lang. Technol. Comput. Linguist. 2005, 20, 19–62. [Google Scholar] [CrossRef]
- Ramos, J. Using TF-IDF to determine word relevance in document queries. In Proceedings of the First Instructional Conference On Machine Learning, Los Angeles, CA, USA, 23–24 June 2003. [Google Scholar]
- Mikolov, T.; Sutskever, I.; Chen, K.; Corrado, G.S.; Dean, J. Distributed representations of words and phrases and their compositionality. In Proceedings of the 26th International Conference on Neural Information Processing Systems, Lake Tahoe, NV, USA, 5–10 December 2013; pp. 5–102013. [Google Scholar]
- Devlin, J. BERT: Pre-training of deep bidirectional transformers for understanding. arXiv 2019, arXiv:1810.04805v2. [Google Scholar]
- Liu, Y.; Ott, M.; Goyal, N.; Du, J.; Joshi, M.; Chen, D.; Levy, O.; Lewis, M.; Zettlemoyer, L.; Stoyanov, V. RoBERTa: A robustly optimized BERT pretraining approach. arXiv 2019, arXiv:1907.11692. [Google Scholar]
- He, P.; Liu, X.; Gao, J.; Chen, W. DeBERTa: Decoding-Enhanced BERT with disentangled attention. arXiv 2021, arXiv:2006.03654. [Google Scholar]
- Weiss, K.; Khoshgoftaar, T.M.; Wang, D. A survey of transfer learning. J. Big Data 2016, 3, 9. [Google Scholar] [CrossRef]
- Ekbal, A.; Saha, S. A multiobjective simulated annealing approach for classifier ensemble: Named entity recognition in Indian languages as case studies. Expert Syst. Appl. 2011, 38, 14760–14772. [Google Scholar] [CrossRef]
- Gundapu, S.; Mamidi, R. Transformer based automatic COVID-19 fake news detection system. arXiv 2021, arXiv:2101.00180. [Google Scholar]
- Minaee, S.; Kalchbrenner, N.; Cambria, E.; Nikzad, N.; Chenaghlu, M.; Gao, J. Deep learning–based text classification. ACM Comput. Surv. 2022, 54, 1–40. [Google Scholar] [CrossRef]
- Rustam, F.; Ashraf, I.; Mehmood, A.; Ullah, S.; Choi, G.S. Tweets classification on the base of sentiments for U.S. airline companies. Entropy 2019, 21, 1078. [Google Scholar] [CrossRef]
- Qasim, R.; Bangyal, W.H.; Alqarni, M.A.; Almazroi, A.A. A fine-tuned BERT-based transfer learning approach for text classification. J. Healthc. Eng. 2022, 2022, 3498123. [Google Scholar] [CrossRef] [PubMed]
- Sanh, L.D.V.; Chaumond, J.; Wolf, T. DistilBERT, a distilled version of BERT: Smaller, faster; cheaper; lighter. arXiv 2020, arXiv:1910.01108. [Google Scholar]
- Das, S.; Le, M.; Dai, B. Application of machine learning tools in classifying pedestrian crash types: A case study. Transp. Saf. Environ. 2020, 2, 106–119. [Google Scholar] [CrossRef]
- Pearl, J. The seven tools of causal inference, with reflections on machine learning. Commun. A.C.M. 2019, 62, 54–60. [Google Scholar] [CrossRef]
- Joshua, S.C.; Garber, N.J. Estimating truck accident rate and involvements using linear and Poisson regression models. Transp. Plan. Technol. 1990, 15, 41–58. [Google Scholar] [CrossRef]
- Fan, W.D.; Gong, L.; Washing, E.M.; Yu, M.; Haile, E. Identifying and quantifying factors affecting vehicle crash severity at highway-rail grade crossings: Models and their comparison. In Proceedings of the Transportation Research Board 95th Annual Meeting, Washington, DC, USA, 10–14 January 2016. [Google Scholar]
- Zhao, S.; Khattak, A.; Analysis, A. Motor vehicle drivers’ injuries in train–motor vehicle crashes. Accid. Anal. Prev. 2015, 74, 62–168. [Google Scholar] [CrossRef]
- Shibata, A.; Fukuda, K. Risk factors of fatality in motor vehicle traffic accidents. Accid. Anal. Prev. 1994, 26, 391–397. [Google Scholar] [CrossRef]
- Malyshkina, N.V.; Mannering, F.L. Empirical assessment of the impact of highway design exceptions on the frequency and severity of vehicle accidents. Accid. Anal. Prev. 2010, 42, 131–139. [Google Scholar] [CrossRef]
- Ye, F.; Lord, D. Comparing three commonly used crash severity models on sample size requirements: Multinomial logit, ordered probit and mixed logit models. Anal. Methods Accid. Res. 2014, 1, 72–85. [Google Scholar] [CrossRef]
- Al-Ghamdi, A.S. Using logistic regression to estimate the influence of accident factors on accident severity. Accid. Anal. Prev. 2002, 34, 729–741. [Google Scholar] [CrossRef]
- Eluru, N.; Bhat, C.R.; Hensher, D.A. A mixed generalized ordered response model for examining pedestrian and bicyclist injury severity level in traffic crashes. Accid. Anal. Prev. 2008, 40, 1033–1054. [Google Scholar] [CrossRef] [PubMed]
- Wang, X.; Kim, S.H. Prediction and factor identification for crash severity: Comparison of discrete choice and tree-based models. Transp. Res. Rec. 2019, 2673, 640–653. [Google Scholar] [CrossRef]
- Mokhtarimousavi, S.; Anderson, J.C.; Azizinamini, A.; Hadi, M. Factors affecting injury severity in vehicle-pedestrian crashes: A day-of-week analysis using random parameter ordered response models and Artificial Neural Networks. Int. J. Transp. Sci. Technol. 2020, 9, 100–115. [Google Scholar] [CrossRef]
- Hegde, J.; Rokseth, B. Applications of machine learning methods for engineering risk assessment—A review. Saf. Sci. 2020, 122, 104492. [Google Scholar] [CrossRef]
- Khanbhai, M.; Anyadi, P.; Symons, J.; Flott, K.; Darzi, A.; Mayer, E. Applying natural language processing and machine learning techniques to patient experience feedback: A systematic review. B.M.J. Health Care Inform. 2021, 28, e100262. [Google Scholar] [CrossRef] [PubMed]
- Li, Z.; Liu, P.; Wang, W.; Xu, C. Using support vector machine models for crash injury severity analysis. Accid. Anal. Prev. 2012, 45, 478–486. [Google Scholar] [CrossRef] [PubMed]
- Chong, M.; Abraham, A.; Paprzycki, M. Traffic accident analysis using machine learning paradigms. Informatica 2005, 29, 89–98. [Google Scholar]
- Rezapour, M.; Molan, A.M.; Ksaibati, K. Analyzing injury severity of motorcycle at-fault crashes using machine learning techniques, decision tree and logistic regression models. Int. J. Transp. Sci. Technol. 2020, 9, 89–99. [Google Scholar] [CrossRef]
- Pour, A.T.; Moridpour, S.; Tay, R.; Rajabifard, A. Modelling pedestrian crash severity at mid-blocks. Transp. A Transp. Sci. 2017, 13, 273–297. [Google Scholar]
- Gutierrez-Osorio, C.; Pedraza, C. Modern data sources and techniques for analysis and forecast of road accidents: A review. J. Traffic Transp. Eng. 2020, 7, 432–446. [Google Scholar] [CrossRef]
- Taamneh, M.; Taamneh, S.; Alkheder, S. Clustering-based classification of road traffic accidents using hierarchical clustering and artificial neural networks. Int. J. Inj. Control. Saf. Promot. 2017, 24, 388–395. [Google Scholar] [CrossRef] [PubMed]
- Arteaga, C.; Paz, A.; Park, J. Injury severity on traffic crashes: A text mining with an interpretable machine-learning approach. Saf. Sci. 2020, 132, 104988. [Google Scholar] [CrossRef]
- Das, S.; Dutta, A.; Dey, K.; Jalayer, M.; Mudgal, A. Vehicle involvements in hydroplaning crashes: Applying interpretable machine learning. Transp. Res. Interdiscip. Perspect. 2020, 6, 100176. [Google Scholar] [CrossRef]
- Nayak, R.; Piyatrapoomi, N.; Weligamage, J. Application of text mining in analysing road crashes for road asset management. In Proceedings of the Engineering Asset Lifecycle Management, Athens, Greece, 28–30 September 2009; Springer: Berlin/Heidelberg, Germany, 2010. [Google Scholar]
- Stein, R.A.; Jaques, P.A.; Valiati, J.F. An analysis of hierarchical text classification using word embeddings. Inf. Sci. 2019, 471, 216–232. [Google Scholar] [CrossRef]
- Gao, L. verb-based text mining of road crash report. In Proceedings of the 92nd Annual Meeting of the Transportation Research Board, Washington, DC, USA, 13–17 January 2013. [Google Scholar]
- Zhang, X.; Green, E.; Chen, M.; Souleyrette, R.R. Identifying secondary crashes using text mining techniques. J. Transp. Saf. Secur. 2019, 12, 1338–1358. [Google Scholar] [CrossRef]
- Wali, B.; Khattak, A.J.; Ahmad, N. Injury severity analysis of pedestrian and bicyclist trespassing crashes at non-crossings: A hybrid predictive text analytics and heterogeneity-based statistical modeling approach. Accid. Anal. Prev. 2021, 150, 105835. [Google Scholar] [CrossRef] [PubMed]
- Sayed, M.A.; Qin, X.; Kate, R.J.; Anisuzzaman, D.M.; Yu, Z. Identification and analysis of misclassified work-zone crashes using text mining techniques. Accid. Anal. Prev. 2021, 159, 106211. [Google Scholar] [CrossRef] [PubMed]
- Ganguli, R.; Miller, P.; Pothina, R. Effectiveness of natural language processing based machine learning in analyzing incident narratives at a mine. Minerals 2021, 11, 776. [Google Scholar] [CrossRef]
- Roque, C.; Cardoso, J.L.; Connell, T.; Schermers, G.; Weber, R. Topic analysis of Road Safety Inspections using latent Dirichlet allocation: A case study of roadside safety in Irish main roads. Accid. Anal. Prev. 2019, 131, 336–349. [Google Scholar] [CrossRef]
- Brown, T.B.; Mann, B.; Ryder, N.; Subbiah, M.; Kaplan, J.D.; Dhariwal, P.; Amodei, D. Language models are few-shot learners. In Proceedings of the Advances in Neural Information Processing Systems 33 (NeurIPS 2020), NeurIPS, Vancouver, BC, Canada, 6–12 December 2020. [Google Scholar]
- Parmar, V.S.; Jones, U.; Gomez, A.N.; Polosukhin, I. Attention is all you need. In Proceedings of the 31st Conference on Neural Information Processing Systems (NIPS 2017), Long Beach, CA, USA, 4–9 December 2017. [Google Scholar]
- Ho, T.K. Random dDecision fForests. In Proceedings of the 3rd International Conference on Document Analysis and Recognition, Montreal, QC, Canada, 14–16 August 1995; Volume 1, pp. 278–282. [Google Scholar]
- Rish, I. An empirical study of the naive Bayes classifier. In Proceedings of the Workshop on Empirical Methods in Artificial Intelligence, Seattle, WA, USA, 4 August 2001; Volume 3, pp. 41–46. [Google Scholar]
- Khusna, W.; Murfi, H. An analysis of the proportion of feature subsampling on XGBoost—A case study of claim prediction in car insurance. In Proceedings of the International Conference on Science and Applied Science (ICSAS2020), Surakarta, Indonesia, 7 July 2020. [Google Scholar]
- Kraus, M.; Feuerriegel, S. Decision support from financial disclosures with deep neural networks and transfer learning. Decis. Support Syst. 2017, 104, 38–48. [Google Scholar] [CrossRef]
- Das, S.; Datta, S.; Zubaidi, H.A.; Obaid, I.A. Applying interpretable machine learning to classify tree and utility pole related crash injury types. IATSS Res. 2021, 45, 310–316. [Google Scholar] [CrossRef]
- Davis, J.; Goadrich, M. The relationship between Precision-Recall and R.O.C. curves. In Proceedings of the 23rd International Conference on Machine Learning, Pittsburgh, PA, USA, 25–29 June 2006; pp. 233–240. [Google Scholar] [CrossRef]
- Saito, T.; Rehmsmeier, M. The Precision-Recall plot is more informative than the ROC plot when evaluating binary classifiers on imbalanced datasets. PLoS ONE 2015, 10, e0118432. [Google Scholar] [CrossRef] [PubMed]
- Polikar, R. Ensemble based systems in decision making. IEEE Circuits Syst. Mag. 2006, 6, 21–45. [Google Scholar] [CrossRef]
- Bishop, C.M.; Nasrabadi, N.M. Pattern Recognition and Machine Learning; Springer: Berlin/Heidelberg, Germany, 2006; Volume 4. [Google Scholar]
- Kuncheva, L.I. Combining Pattern Classifiers: Methods and Algorithms; John Wiley & Sons: Hoboken, NJ, USA, 2014. [Google Scholar]
- Khan, A.; Baharudin, B.; Lee, L.H.; Khan, K. A review of machine learning algorithms for text-documents classification. J. Adv. Inf. Technol. 2010, 1, 4–20. [Google Scholar]
- Lu, D.; Weng, Q. A survey of image classification methods and techniques for improving classification performance. Int. J. Remote Sens. 2007, 28, 823–870. [Google Scholar] [CrossRef]
- Zhang, Y.; Lin, H.; Yang, Z.; Wang, J.; Sun, Y.; Xu, B.; Zhao, Z. Neural network-based approaches for biomedical relation classification: A review. J. Biomed. Inform. 2019, 99, 103294. [Google Scholar] [CrossRef]

Disclaimer/Publisher’s Note: The statements, opinions and data contained in all publications are solely those of the individual author(s) and contributor(s) and not of MDPI and/or the editor(s). MDPI and/or the editor(s) disclaim responsibility for any injury to people or property resulting from any ideas, methods, instructions or products referred to in the content. |
© 2024 by the authors. Licensee MDPI, Basel, Switzerland. This article is an open access article distributed under the terms and conditions of the Creative Commons Attribution (CC BY) license (https://creativecommons.org/licenses/by/4.0/).