Article

A Comparative Study of Machine Learning Techniques for Cell Annotation of scRNA-Seq Data

1
Department of Computer Science, Jamia Millia Islamia, New Delhi 110025, India
2
Department of Management Information Systems, College of Business Administration, King Faisal University, Al-Ahsa 31982, Saudi Arabia
*
Authors to whom correspondence should be addressed.
Algorithms 2025, 18(4), 232; https://doi.org/10.3390/a18040232
Submission received: 9 March 2025 / Revised: 13 April 2025 / Accepted: 14 April 2025 / Published: 18 April 2025
(This article belongs to the Special Issue Advanced Research on Machine Learning Algorithms in Bioinformatics)

Abstract

:
Accurate cell type annotation is a critical step in single-cell RNA sequencing (scRNA-seq) analysis, enabling deeper insights into cellular heterogeneity and biological processes. In this study, we conducted a comprehensive comparative evaluation of various machine learning techniques, including support vector machine (SVM), decision tree, random forest, logistic regression, gradient boosting, k-nearest neighbour, transformer, and naive Bayes, to determine their effectiveness for single-cell annotation. These methods were evaluated using four diverse datasets comprising hundreds of cell types across several tissues. Our results revealed that SVM consistently outperformed other techniques, emerging as the top performer in three out of the four datasets, followed closely by logistic regression. Most methods demonstrated robust capabilities in annotating major cell types and identifying rare cell populations, though naive Bayes was the least effective due to its inherent limitations in handling high-dimensional and interdependent data. This study provides valuable insights into the relative strengths and weaknesses of machine learning methods for single-cell annotation, offering guidance for selecting appropriate techniques in scRNA-seq analyses.

1. Introduction

Cells are the building blocks of life, playing a central role in every aspect of an organism’s functioning. The human body is made up of approximately 30 trillion cells, each with its designated functions [1]. The functioning of tissue and body depends upon the interplay of individual cells. They operate both individually and collaboratively, carrying out specific duties that maintain health and balance within the body. By studying cells, we gain insights into the complex systems that govern development, health, and disease. Understanding cells has practical implications across various fields such as medicine and pathology. Exploring how cells operate helps us understand diseases better, develop targeted therapies, and even pave the way for breakthroughs in personalized medicine [2]. This knowledge is instrumental in crafting treatments that are tailored to individual needs, potentially revolutionizing how we approach illness and health care. Recent advances in high-throughput single-cell RNA sequencing (scRNA-seq) have significantly enhanced our capacity to analyze gene expression at the resolution of individual cells. The advent of scRNA-seq has opened up new avenues in cell research, particularly in identifying and classifying cell types [3]. This technology allows for precise examination of how cells differ from one another, even within the same tissue, enhancing our understanding of their specific roles and interactions. The insights gained from scRNA-seq are not just academic; they have practical applications in developing better diagnostic tools [4], refining therapeutic strategies [5], and advancing tissue engineering [6].
scRNA-seq has revolutionized biology and medicine by enabling detailed characterization of complex tissue composition, identification of new and rare cell types [7], understanding of developmental stages [8], and analysis of cellular responses to perturbations [9]. A major goal in scRNA-seq data analysis is the classification of cellular phenotypes, such as cell type annotation. Cell annotation is the process of categorizing and labelling cells based on their gene expression profiles, typically derived from single-cell RNA sequencing (scRNA-seq) data [10,11]. Cell annotation is essential for studying disease progression and tumour microenvironments [12]. Accurate identification is crucial because it allows scientists to map out the diverse landscape of cells within a body, explore their unique roles in both healthy and diseased states, and unearth new cellular types that could be critical in understanding life’s complexities [13]. This categorization helps researchers understand the cellular identity and functions within heterogeneous tissues. Cell annotation allows researchers to identify different cell types within mixed populations, enabling the separate study of each cell type and their interactions. Thus, cell annotation is one of the most significant applications of scRNA-seq to study the biological process and advancing medical practice.
Cell annotation methods can be broadly classified into manual and automated approaches. Manual annotation relies on identifying known marker genes specific to certain cell types. Researchers inspect gene expression clusters and assign labels based on these markers [14]. Databases like CellMarker [15], PanglaoDB [16], and CancerSEA [17] provide curated lists of such marker genes. Tools like scCATCH [18], SCSA [19], CellAssign [20], and SCINA [21] use statistical models to fit marker gene distributions and assign labels accordingly. For instance, scCATCH builds tissue-specific reference datasets and matches gene expression profiles to a predefined taxonomy, while CellAssign applies a Bayesian probabilistic model to label single cells. Automated methods are increasingly used for their speed and ability to handle large datasets. These include unsupervised, supervised, and hybrid learning approaches. Unsupervised methods, like t-SNE, UMAP, and Louvain, group cells based on gene expression without prior labels. After clustering, labels are assigned using marker genes. However, their accuracy depends on selecting the right clustering resolution—too many clusters may create unnecessary subgroups, while too few may miss rare cell types. Also, interpreting the biological meaning of clusters can be difficult, as these methods do not always provide functional insights.
Supervised learning-based cell annotation uses machine learning models trained on labelled reference datasets to classify new, unlabeled scRNA-seq data [22,23]. These models learn patterns in gene expression to identify cell types and can capture complex relationships in high-dimensional data. Common algorithms include random forest, SVM, k-NN, neural networks, and transformers. Tools such as canonical correlation analysis (CCA) [24], MNNCorrect [25], scAnnotate [26], scClassify [27], SingleCellNet [28], Moana [29], and LAmbDA [30] apply supervised learning for annotation. CCA [24] and MNNCorrect [25] integrate ‘query’ data with known datasets to analyze gene expression and gene-to-gene correlations. scAnnotate [26] uses random forest along with batch correction tools like Harmony and Seurat, and combines results using models like Elastic Net or XGBoost. SingleCellNet [28] applies a Random Forest model to compute similarity scores for each query cell and detect transition states or ambiguous identities. Moana combines SVM with hierarchical classification to refine labels, while LAmbDA [30] applies neural networks in a transfer learning framework to correct for batch effects across datasets. The main benefit of supervised methods is their ability to capture complex biological patterns and perform hierarchical classification. However, their accuracy depends on how well the training data represents all relevant cell types, and missing cell types in the reference can lead to misclassification.
Recently, deep learning techniques have demonstrated significant success across diverse scientific domains, encompassing medical imaging, text analysis, and single-cell studies [31,32,33,34,35,36]. Deep learning-based supervised methods such as scPred [37], scDeepSort [38], scBERT [12], GPT-4 [39], and scGPT [40] are employed to discover complex patterns in scRNA-seq data. These methods often outperform traditional unsupervised techniques by leveraging large amounts of annotated data. For example, scPred [37] applies principal component analysis (PCA) for dimensionality reduction followed by a support vector machine (SVM) classifier for cell classification. scDeepSort [38] utilizes a weighted graph neural network (GNN) trained on gene–cell graphs, enabling cell type annotation without prior knowledge integration. scBERT [12], adapted from the BERT architecture [41], leverages pre-training and fine-tuning on gene expression data to capture complex cellular relationships and mitigate batch effects. Hou et al. [39] evaluates the performance of GPT-4 for cell annotation across 10 datasets from five species, demonstrating over 75% accuracy for most cell types by leveraging marker gene information. The single-cell generative pre-trained transformer (scGPT) [40], a domain-adapted generative pre-trained transformer model, supports cell annotation, multimodal integration, and perturbation prediction using self-attention mechanisms, requiring large-scale pre-training for effective representation learning.
Hybrid annotation approaches combine supervised and unsupervised methods to make cell type identification in scRNA-seq data more accurate and reliable. These methods use multiple reference datasets to minimize batch effects and capture the hierarchical structure of cell types. Tools like scClassify [27] and CHETAH [42] demonstrate this strategy. scClassify employs ensemble learning with k-nearest neighbours to build a hierarchical classification tree and can assign intermediate or “unassigned” labels when reference mismatches occur. CHETAH iteratively refines annotations by comparing cells to subgroups of reference types. These methods are particularly effective in detecting both common and rare cell types and elucidating complex biological processes, though they may involve increased computational overhead and require careful parameter tuning.
A comparative study of machine learning techniques for cell annotation is essential for driving progress in the field. Such studies are significant because they help identify the strengths and limitations of different methods across diverse datasets, guide the selection of appropriate tools for specific biological questions, and promote the development of more accurate and generalizable models for cell type identification in scRNA-seq data. Cao et al. [43] conducted a systematic benchmark study of 13 supervised machine learning algorithms for cell phenotype classification using scRNA-seq data, evaluating their classification accuracy, computational efficiency, and gene selection capabilities across 43 datasets of varying sizes. Their findings provide practical guidelines for selecting appropriate ML models based on dataset scale and task requirements. Systematic comparison of machine learning algorithms is essential for improving annotation accuracy, guiding method selection, and advancing computational methodologies in single-cell research. It helps identify the most accurate methods for labelling known and novel cell types while highlighting each method’s strengths and limitations across different datasets. Comparative studies provide guidelines for selecting suitable approaches based on empirical evidence, making them invaluable for handling complex biological data. They also address biases introduced by computationally derived references, ensuring that evaluations better reflect real biological systems. Additionally, such comparisons drive the development of improved algorithms and hybrid methods, fostering innovation and enhancing the reliability of single-cell data analysis. Recognizing this need, in this study, we conducted a comparative study of machine learning techniques, including decision tree, SVM, kNN, random forest, and transformers, which have been applied in various computational tools for single-cell annotation. Using several datasets, we evaluated these techniques by comparing their F1 scores and accuracy to validate their performance.

2. Materials and Methods

We conducted a comprehensive evaluation of seven traditional machine learning models for cell type annotation using single-cell gene expression data. The dataset was pre-processed and split into training (80%) and test (20%) sets. We evaluated random forest (with 10 estimators), gradient boosting (300 estimators), support vector machine (with an RBF kernel), logistic regression (max 100 iterations), k-nearest neighbours (k = 5), decision tree, and Gaussian naive Bayes models with default parameters. Each model was trained on the training set and used to predict cell types in the test set. We also implemented a Transformer-based model comprising an embedding layer that projected the input gene expression data into a 512-dimensional feature space, followed by a transformer encoder with 6 layers and 8 attention heads, and a final classification layer. The number of output classes corresponded to the unique cell types in the dataset. We trained the model for 10 epochs using the Adam optimizer with a learning rate of 0.0001 and implemented a scheduler to adjust the learning rate based on validation loss. Cross-entropy loss was used as the optimization criterion. This experiment offered insights into the performance of various traditional machine learning methods for cell type annotation, highlighting differences between simple, interpretable models and complex ensemble methods.

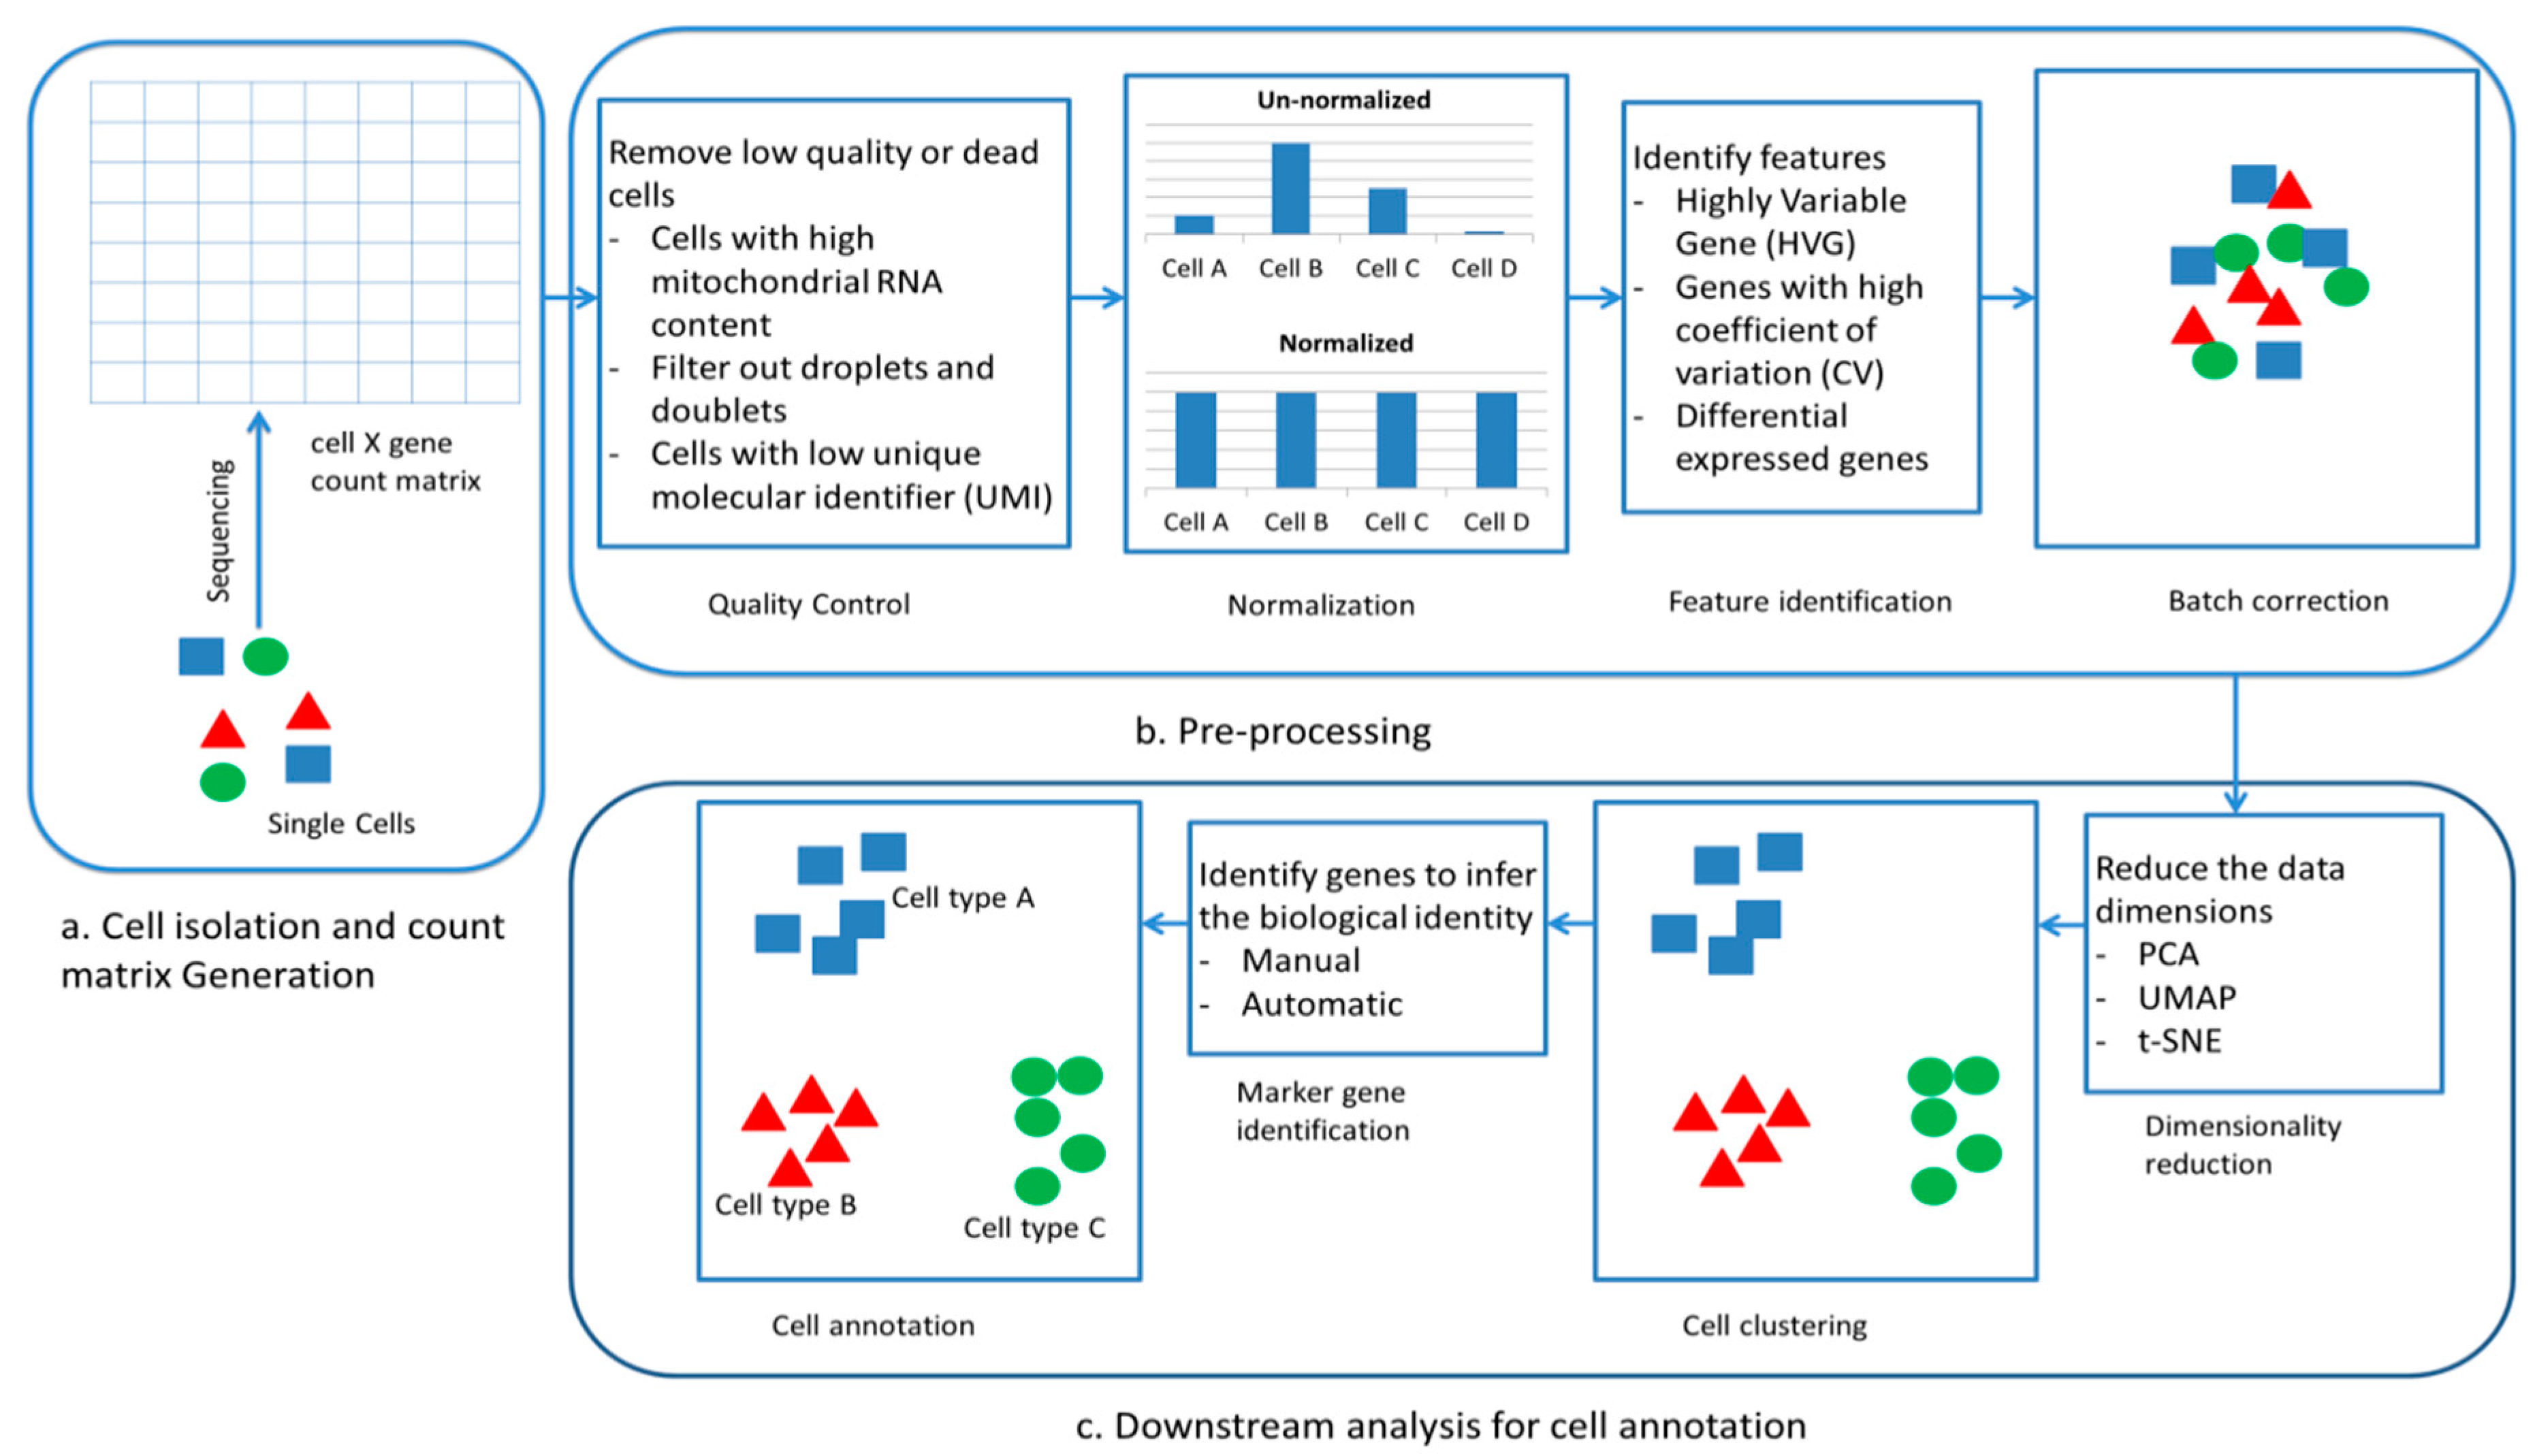
2.1. Single-Cell Annotation and Pre-Processing of scRNA-Seq

Single-cell analysis commences with the isolation of individual cells from diverse tissues. Subsequent to isolation, these cells undergo sequencing, resulting in the generation of a cell-by-gene count matrix, as shown in Figure 1a. In this study, we obtained the cell-by-gene count matrices of datasets from different sources. To ensure quality input for downstream analysis, we first performed standard pre-processing steps, including quality control, normalization, feature selection, and batch effect correction (Figure 1b). The process begins with quality control to remove low-quality or damaged cells based on metrics such as mitochondrial gene content, gene count, and unique molecular identifier (UMI) counts. High mitochondrial RNA content may indicate damaged cells, while too few or too many gene counts help identify empty droplets or doublets. Low unique molecular identifier (UMI) counts suggest poor-quality cells due to insufficient RNA capture or sequencing depth. Next, normalization is applied to adjust for sequencing depth using methods like log normalization. Then, highly variable genes (HVGs) are selected to retain biologically relevant features while reducing noise. Next, we used Seurat as batch correction methods to address technical differences across batches. Subsequently we applied Uniform Manifold Approximation and Projection (UMAP) as a dimensional reduction technique to reduce data dimensions for visualization and feature extraction. Cells were then clustered using the Leiden algorithm, a graph-based community detection method that captures local cell–cell similarity in expression space. Finally, cell type annotation was performed using reference-based methods, where clusters were assigned biological labels by comparing their expression profiles to curated reference datasets containing well-defined marker genes. This systematic and reproducible pipeline ensured that the data were clean, structured, and biologically interpretable for downstream analyses.

2.2. Machine Learning Techniques for Comparative Analysis of Single Cell Annotation

Decision trees are a commonly employed machine learning approach for classifying cell types in single-cell RNA sequencing (scRNA-seq) data due to their simplicity and interpretability [44,45]. A decision tree constructs a flowchart-like model where each internal node represents a “decision” based on the expression level of a particular gene, branches correspond to possible outcomes, and leaf nodes represent predicted cell types. In practice, decision trees make sequential decisions, guiding each new cell’s classification from the tree’s root to a specific leaf based on its gene expression, which simplifies understanding complex biological data and provides clear insights into gene relevance. Decision trees are favoured for their intuitive nature and ability to clearly explain their decision-making process. However, decision trees are prone to over-fitting, especially when the dataset contains many features and noise. To address this, strategies such as pruning (removing branches that contribute little to predictive accuracy) and setting depth limits are commonly used.
Random forest is an ensemble learning technique widely used for classifying cell types in single-cell RNA sequencing data [46]. Random forest is a popular ensemble learning method for classifying cell types in scRNA-seq data. It builds multiple decision trees using random subsets of data and features (bagging), reducing overfitting and improving accuracy [47]. Each tree predicts a cell type, and the final result is based on majority voting. This approach handles noisy and imbalanced data well, making it suitable for complex biological datasets. However, it can be computationally demanding for large datasets due to the high number of trees.
Gradient boosting is a robust machine learning method often used for classifying cell types in single-cell RNA sequencing data for accurate cell type classification. Unlike random forest, it builds trees sequentially, where each tree corrects the errors of the previous ones using a method called “boosting”. This is performed by minimizing a loss function through gradient descent [48]. Gradient boosting models, such as XGBoost, are popular for their speed, ability to handle missing data, and for providing feature importance to highlight key genes [49]. However, training can be time-consuming due to the sequential nature of the process, especially with large datasets.
K-nearest neighbour (KNN) is a simple, non-parametric, distance-based algorithm used in scRNA-seq data for cell type classification [50]. It assumes that similar cells are close in gene expression space. For a given cell, KNN finds its k-nearest neighbours using a distance metric (e.g., Euclidean or cosine) and assigns the most common label among them. Choosing the right K is crucial; too small can be noisy, too large can blur distinctions. Tools like Seurat use KNN for clustering, and its simplicity and effectiveness in capturing subtle patterns make it useful for classifying closely related cell types [4].
Naive Bayes is a simple, probabilistic algorithm used for cell type classification in scRNA-seq data [51]. It calculates the probability of each cell type from gene expression levels, assuming each gene’s presence is independent of others. Normalization, like log-transformation, ensures that gene expressions are comparable across different cells. After normalization (e.g., log transformation), it calculates the probability of each cell type and assigns the one with the highest value. Its speed and ability to handle many genes make it useful for analyzing complex genomic data and quickly adapting to new inputs.
Support vector machines (SVM) are a robust and versatile machine learning method widely used for classifying cell types in single-cell RNA sequencing (scRNA-seq) data due to their ability to handle high-dimensional and complex data [43]. The core principle of a SVM is to find an optimal hyperplane that separates different cell types in the gene expression space with the maximum margin, minimizing misclassification [52]. This “margin maximization” enhances the model’s generalizability, making it effective in distinguishing between closely related cell types [53]. In cases where cell types are not linearly separable, SVM employs kernel functions, such as the radial basis function (RBF), to transform the data into a higher-dimensional space where a separating hyperplane can be identified. This enables SVM to capture non-linear relationships between genes that are crucial for accurate classification. Despite its strengths, SVM can be computationally expensive, especially for large datasets, due to the need to compute pairwise distances between data points. However, optimized implementations and support for parallelization have improved scalability. The ability of SVM to classify cells based on their gene expression profiles with high accuracy, even in the presence of noise and non-linearity, makes it a valuable tool for single-cell annotation tasks.
Logistic regression is a machine learning method used for classifying cell types in single-cell RNA sequencing (scRNA-seq) data due to its simplicity, interpretability, and probabilistic output [54]. The goal of logistic regression is to model the probability that a given cell, represented by its gene expression profile, belongs to a specific cell type. This is achieved by fitting a linear model to the data and applying a logistic (sigmoid) function to map the output to a probability value between 0 and 1. In the case of multiple cell types, logistic regression extends to multinomial logistic regression, enabling classification across several classes simultaneously. Logistic regression computes a weighted sum of gene expression values, where the weights correspond to the model’s learned parameters. These weights indicate the contribution of each gene to the classification decision, making the model’s predictions biologically interpretable. One of the key strengths of logistic regression is its probabilistic output, which provides a confidence score for each predicted cell type. This allows researchers to interpret and rank classifications based on certainty. Logistic regression is also resistant to over-fitting in low-dimensional settings but may struggle with high-dimensional data, a common challenge in scRNA-seq studies. To address this, regularization techniques, such as L1 (lasso) and L2 (ridge) penalties, are applied to prevent over-fitting by constraining the magnitude of the weights.
The transformer is a model which was originally developed for natural language processing, but now it is being used to annotate and identify cell types in single-cell RNA sequencing data [55]. The powerful architecture of the model can be used effectively to handle the complexities of scRNA-seq data by offering sophisticated ways of classifying cell types. Transformers involve an attention mechanism which weighs important parts against other parts of the input data, making the model focus more on the relevant genes than others, for cell type classification [12]. This results in very useful subtleties for scRNA-seq data where under most circumstances, expression is gained for a set of specific genes that indicate cell type rather than others. Transformers, however, read through the whole set of gene expressions at once; it is just that the weights provided by the self-attention mechanisms identify the importance of one gene over another. The model can thus learn the complicated interdependence across the sets of genes relevant to cell type identification. As a result of training on different scRNA-seq datasets, transformers carry the knowledge of contextual relationships between the various gene expressions, thus helping to correctly infer cell type. Transformers classify cell type based on the patterns in expression data across the whole dataset; with learned weights, it makes a prediction on the most likely cell type for a cell. The model gives its output as probabilities for each cell type, upon which the highest probability gives the classification result. Continued adaptation of transformer architectures for genomic data is expected to further enhance their utility in single-cell analysis.

2.3. Hyper-Parameter Details

The machine learning models used for cell type annotation were tuned to optimize performance while addressing over-fitting and computational efficiency. The complete description of hyper-parameter details for each implemented ML technique is given in Table 1.

2.4. Dataset Description

The Peripheral Blood Mononuclear Cells (PBMC3k), PBMC3k dataset from 10x Genomics consists of single-cell RNA sequencing data from 3000 Peripheral Blood Mononuclear Cells (PBMCs) collected from a healthy donor with cells containing small amount of RNA per cell [56]. The dataset includes approximately 3000 cells that were sequenced on an Illumina NextSeq 500, with 69,000 reads per cell.
The Multiple sclerosis (MS) dataset has been accessed (https://www.ebi.ac.uk/gxa/sc/experiments/E-HCAD-35/results/tsne) on 15 October 2024 from the European Molecular Biology Laboratory—European Bioinformatics Institute (EMBL-EBI), and it consists of nine healthy control samples and twelve MS samples [57]. We split the control samples into the reference set for model fine-tuning and held out the MS samples as the query set for evaluation. This setting serves as an example of out-of-distribution data. We excluded three cell types: B cells, T cells, and oligodendrocyte B cells, which only existed in the query dataset. The final cell counts were 7844 in the training reference set and 13,468 in the query set. The provided cell type labels from the original publication were used as ground truth labels for evaluation. The data-processing protocol involved selecting HVGs to retain 3000 genes.
The utilized Zhengh68K [58] dataset involves single-cell RNA sequencing (scRNA-seq) of peripheral blood mononuclear cells (PBMCs) and bone marrow mononuclear cells (BMMCs) collected from transplant patients and healthy subjects, including the transcriptome of 68,000 PBMCs and 250,000 cells across 29 different samples. The dataset contains 68,000 cells captured from fresh peripheral blood mononuclear cells (PBMCs) from a healthy donor and 250,000 cells from a variety of sources, including cell lines and patient-derived samples, such as bone marrow cells from transplant patients. These cells were processed in a droplet-based system, with up to 8 samples being processed in parallel per run. In summary, the dataset used in this study provided a comprehensive look at the transcriptomic landscape of PBMCs and BMMCs, aiding in the identification of distinct subpopulations and cell types across a range of biological conditions. It provides comprehensive data for studying the cell annotation process.
The Pancreatic dataset profiles gene expression in individual pancreatic cells from human donors, including those with and without type 2 diabetes. It aims to identify pancreatic cell types, discover novel markers, and understand functional alterations in diabetes. The dataset has been sequenced using single-cell RNA sequencing via the CEL-seq technique on platforms like Illumina HiSeq 2500 and NextSeq 500. The dataset can be accessed from gene expression omnibus with accession number GSE81076.

3. Results and Discussion

This section presents a detailed comparison of the methods used in this study, summarizing the classification performance across all datasets with varying sample sizes. Specifically, the study evaluates the performance of different classification algorithms on four types of datasets of different sizes. The results for each classification criterion are discussed in the following subsections to facilitate a comprehensive comparison of the methods.

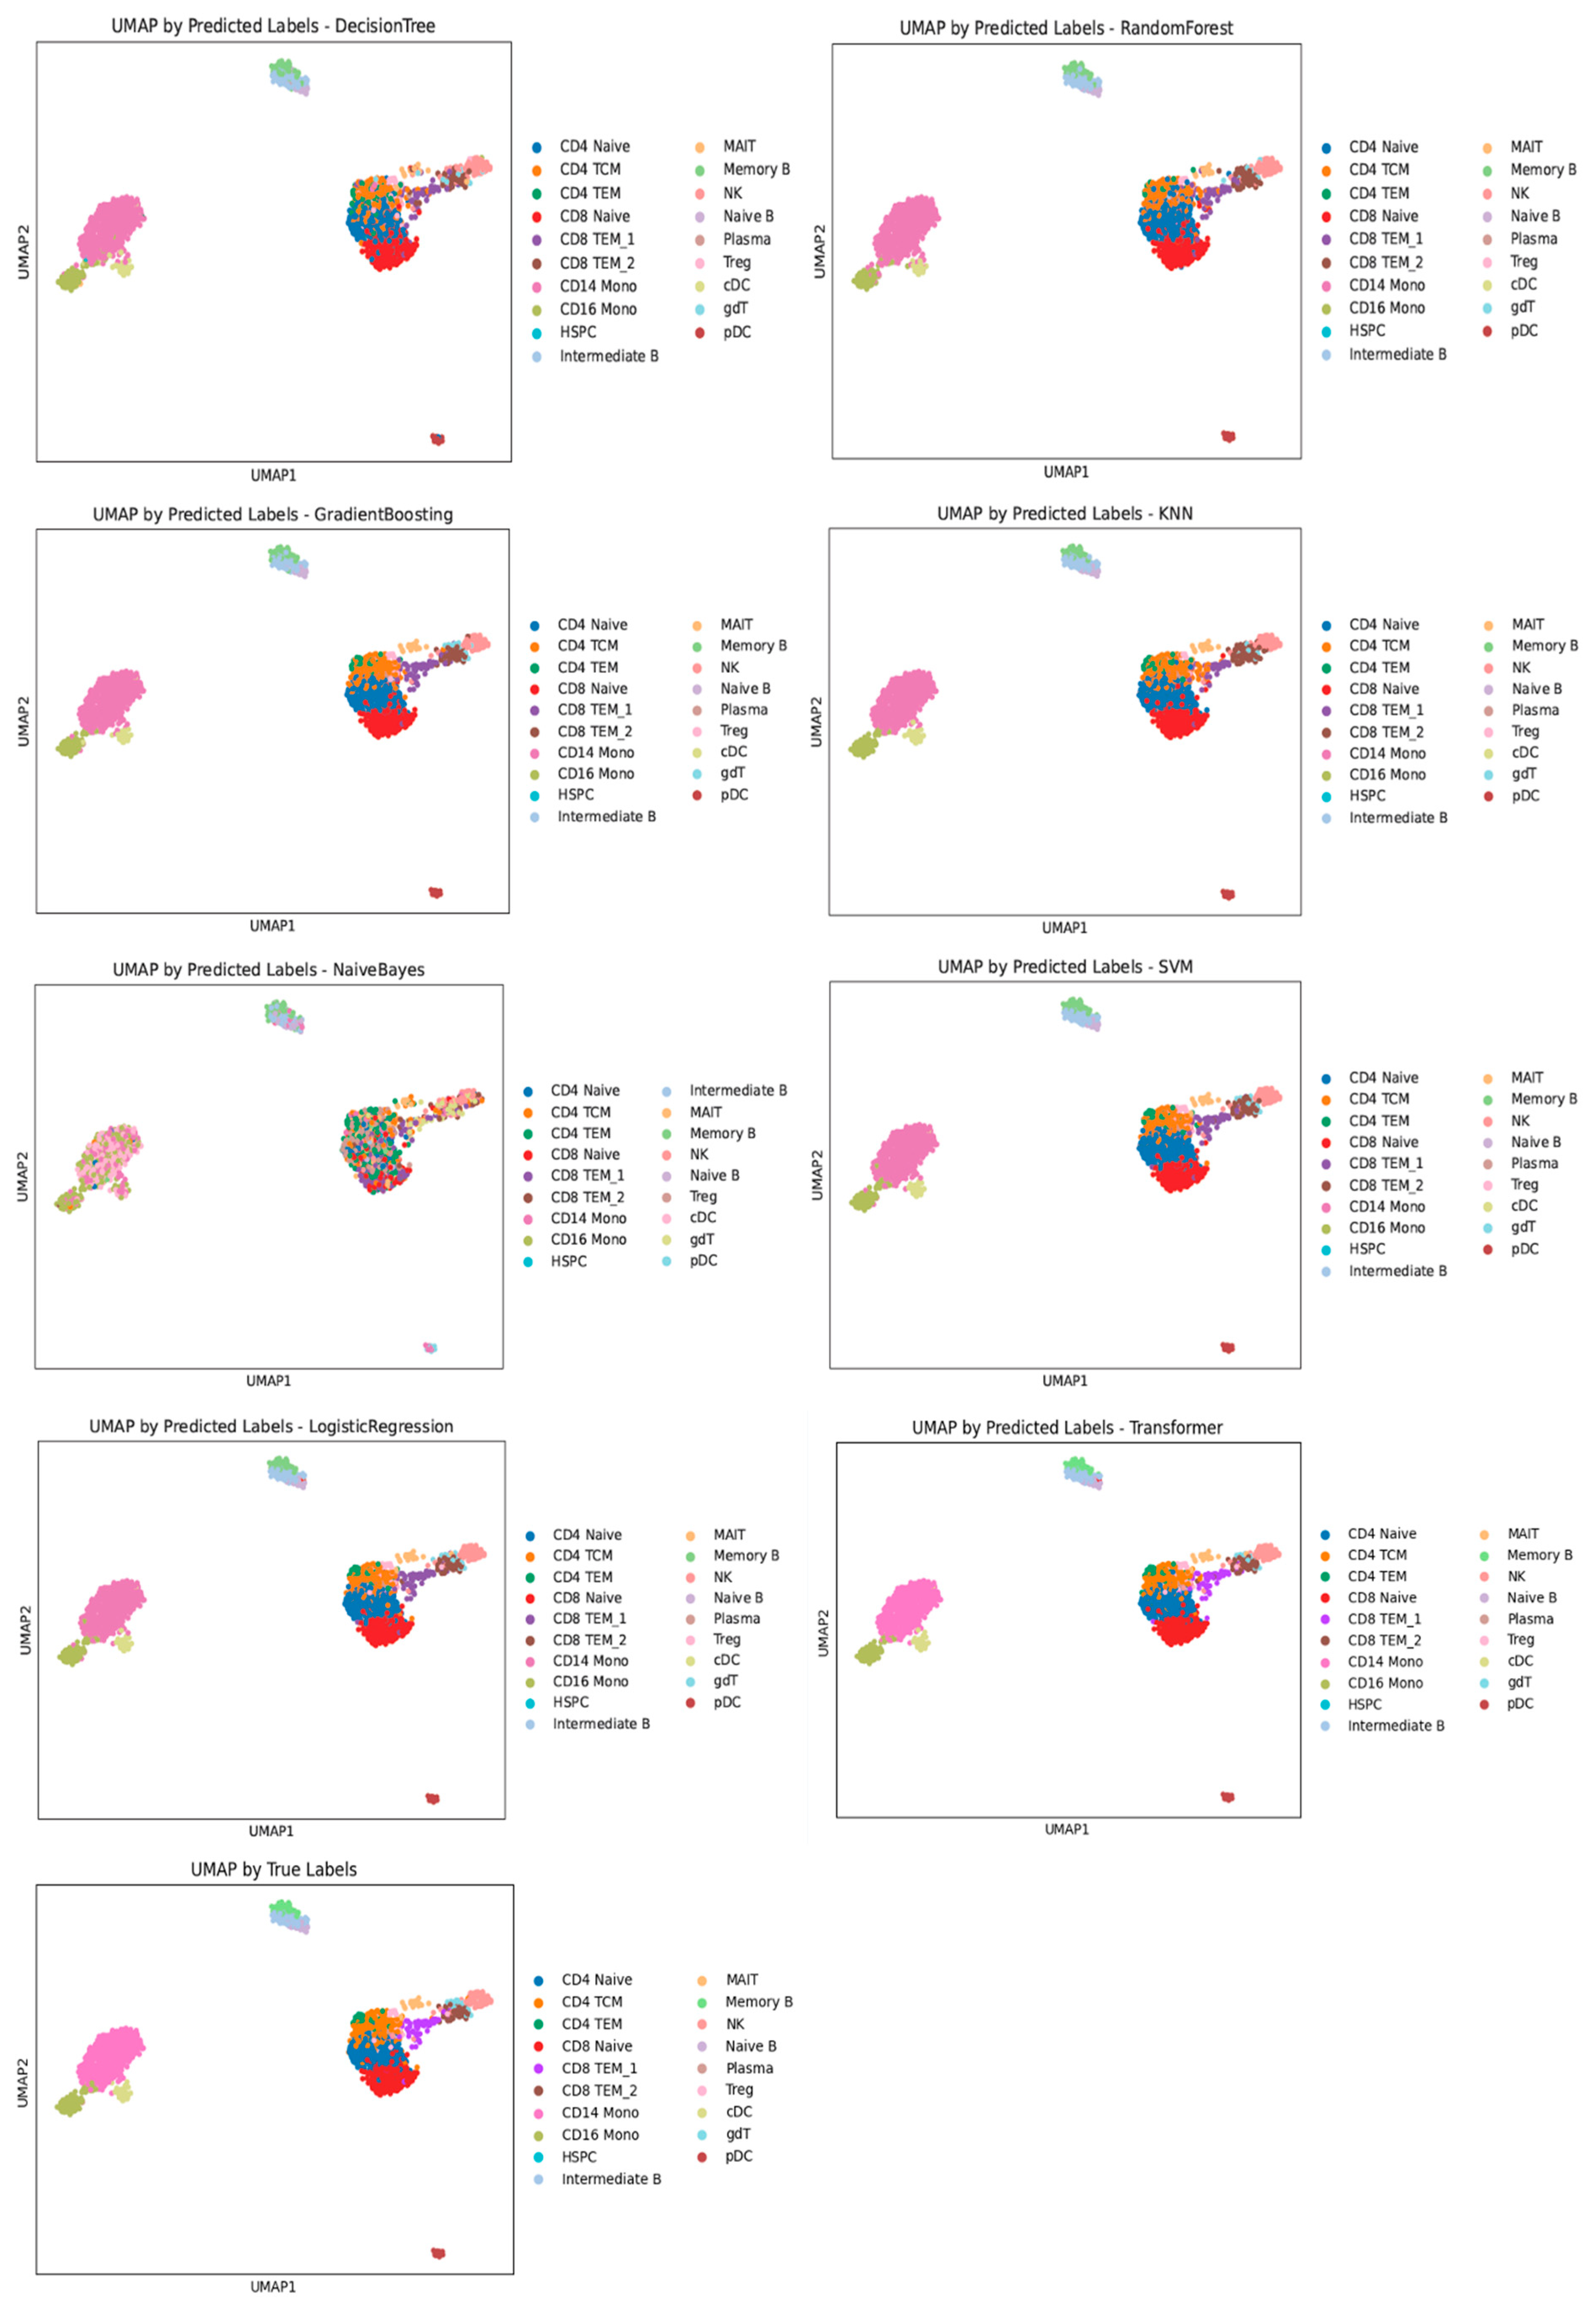
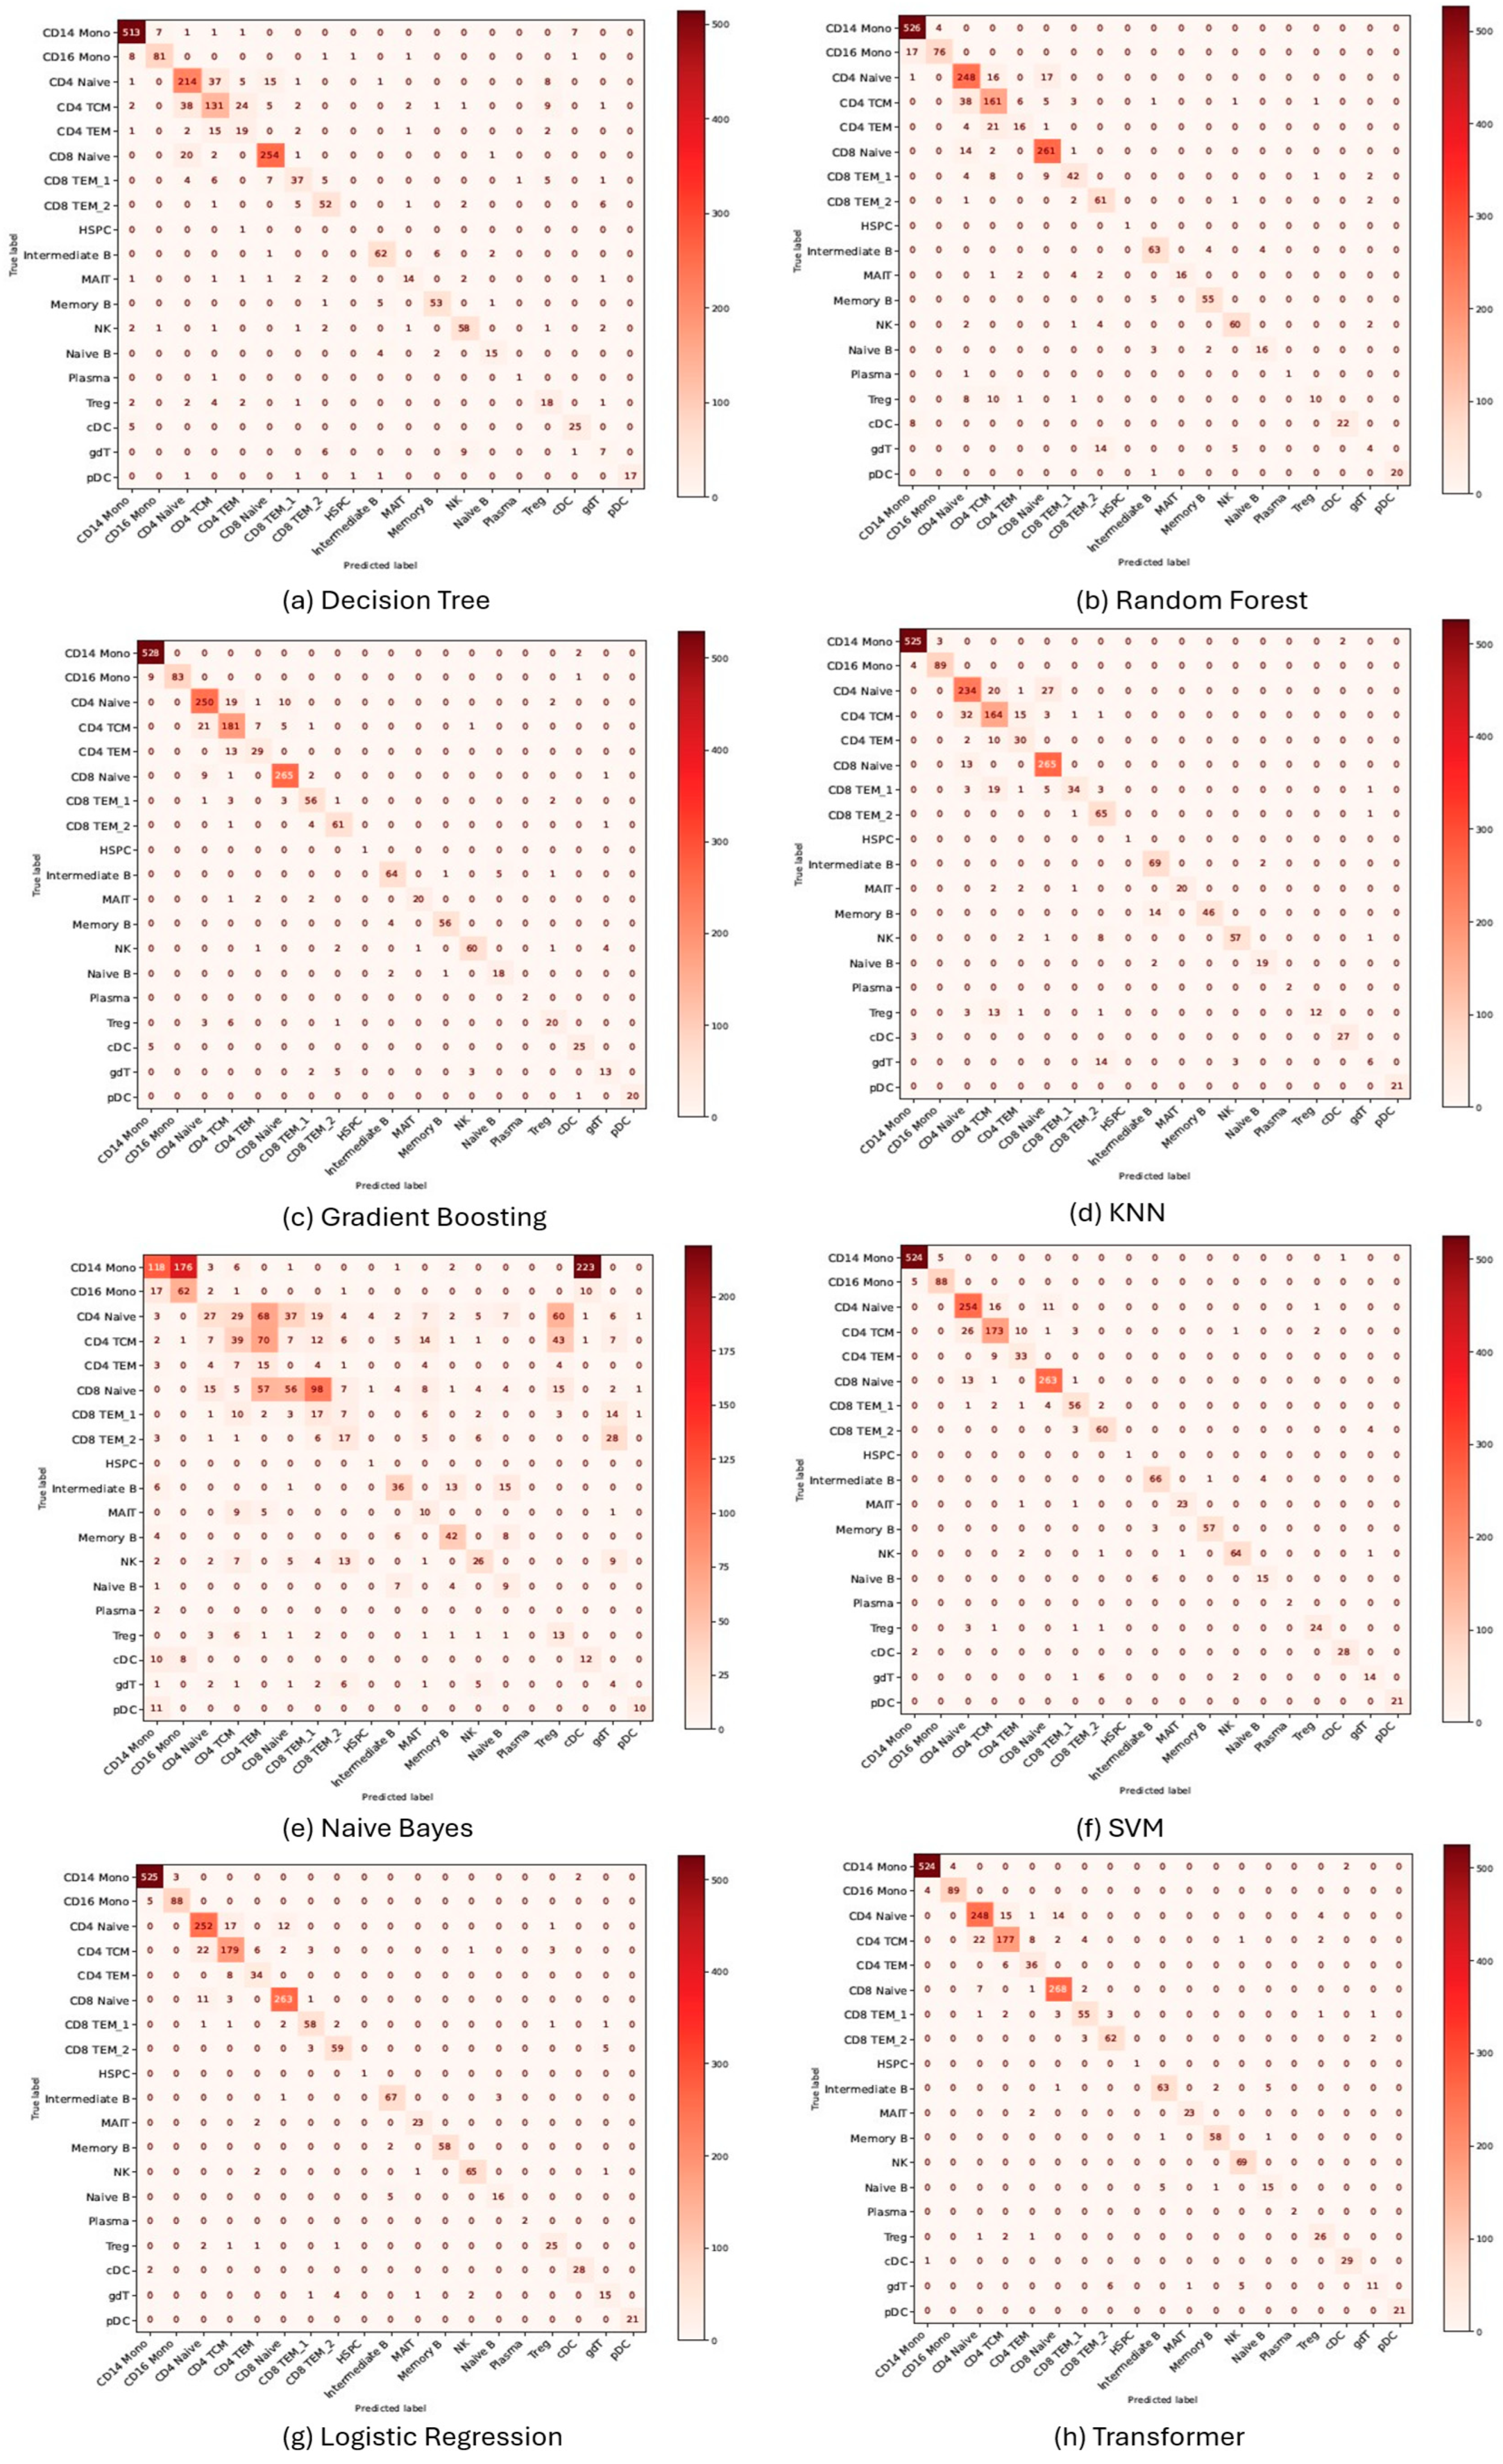
3.1. Performance Evaluation of Machine Learning Models for Cell Annotation of PBMC Datasets

This section summarizes the performance of different machine learning models for cell type annotation on a peripheral blood mononuclear cell (PBMC) dataset. The SVM model outperformed the others, achieving the highest accuracy, 95.83% and F1-score, 95.73%, highlighting its strong ability to manage complex, high-dimensional data in multi-class classification. Detailed metrics are shown in Table 2. SVM excels by using kernel transformations, allowing it to separate non-linearly distributed classes, an essential feature for detecting subtle transcriptional differences between closely related cell types. Logistic regression and transformers also displayed strong performances, with logistic regression displaying accuracy of 95.27% and an F1-score of 95.15%, while transformers showed 93.37% accuracy and 92.99% F1-score (Table 2), suggesting their effectiveness in capturing linear and non-linear relationships, respectively, within the data. The UMAP plots, coloured by predicted labels in Figure 2, visually underscore the clustering effectiveness of each model. These plots closely resembled the ground truth with well-separated and compact clusters, particularly for dominant cell types such as CD14+ monocytes, CD4 naive, and CD8 TEM_1. The corresponding confusion matrices shows high diagonal dominance with minimal off-diagonal misclassifications, indicating strong predictive accuracy and class separability (Figure 3). SVM and logistic regression showed high precision across most cell types, particularly in identifying CD4 T cells and B cells with minimal false positives, which is crucial for reducing misdiagnosis in clinical settings. Logistic regression models linear patterns well and uses regularization to avoid overfitting, while transformers use self-attention to capture gene-level context, making them highly effective for detecting subtle signals in multi-class classification.
Gradient boosting exhibited strong performance, with an accuracy of 92.99% and an F1-score of 92.89%, leveraging its ensemble and sequential learning framework to effectively model complex patterns while minimizing overfitting. UMAP visualizations revealed well-defined clusters, though slight overlaps between monocyte subtypes indicated challenges in resolving closely related cell types (Figure 2). Random forest outperformed decision trees, benefitting from ensemble aggregation that improved generalization, though both models showed confusion between CD14+ monocytes and CD8_TEM subtypes, reflecting limited discriminative power in high-dimensional scRNA-seq data. Random forest provided better robustness, yet its lack of iterative error correction, unlike gradient boosting, limited its ability to capture complex gene-level dependencies. While decision trees offer interpretability, their susceptibility to overfitting was evident in dispersed and overlapping clusters.
KNN and naive Bayes exhibited poor performance, with accuracies near 50% (Table 2), reflecting their limitations in handling high-dimensional, sparse scRNA-seq data. KNN’s reliance on distance metrics suffers from the curse of dimensionality, while naive Bayes assumption of feature independence is incompatible with gene expression data, where complex interdependencies exist. Both models showed widespread misclassifications across cell types, particularly between closely related populations such as memory and naive T cells. UMAP plots revealed dispersed, overlapping clusters (Figure 2), confirming their inability to capture underlying biological variation. In contrast, models like SVM, logistic regression, transformers, and gradient boosting effectively addressed the challenges of high-dimensional feature spaces through kernel transformations, regularization, self-attention, and sequential error correction, respectively.

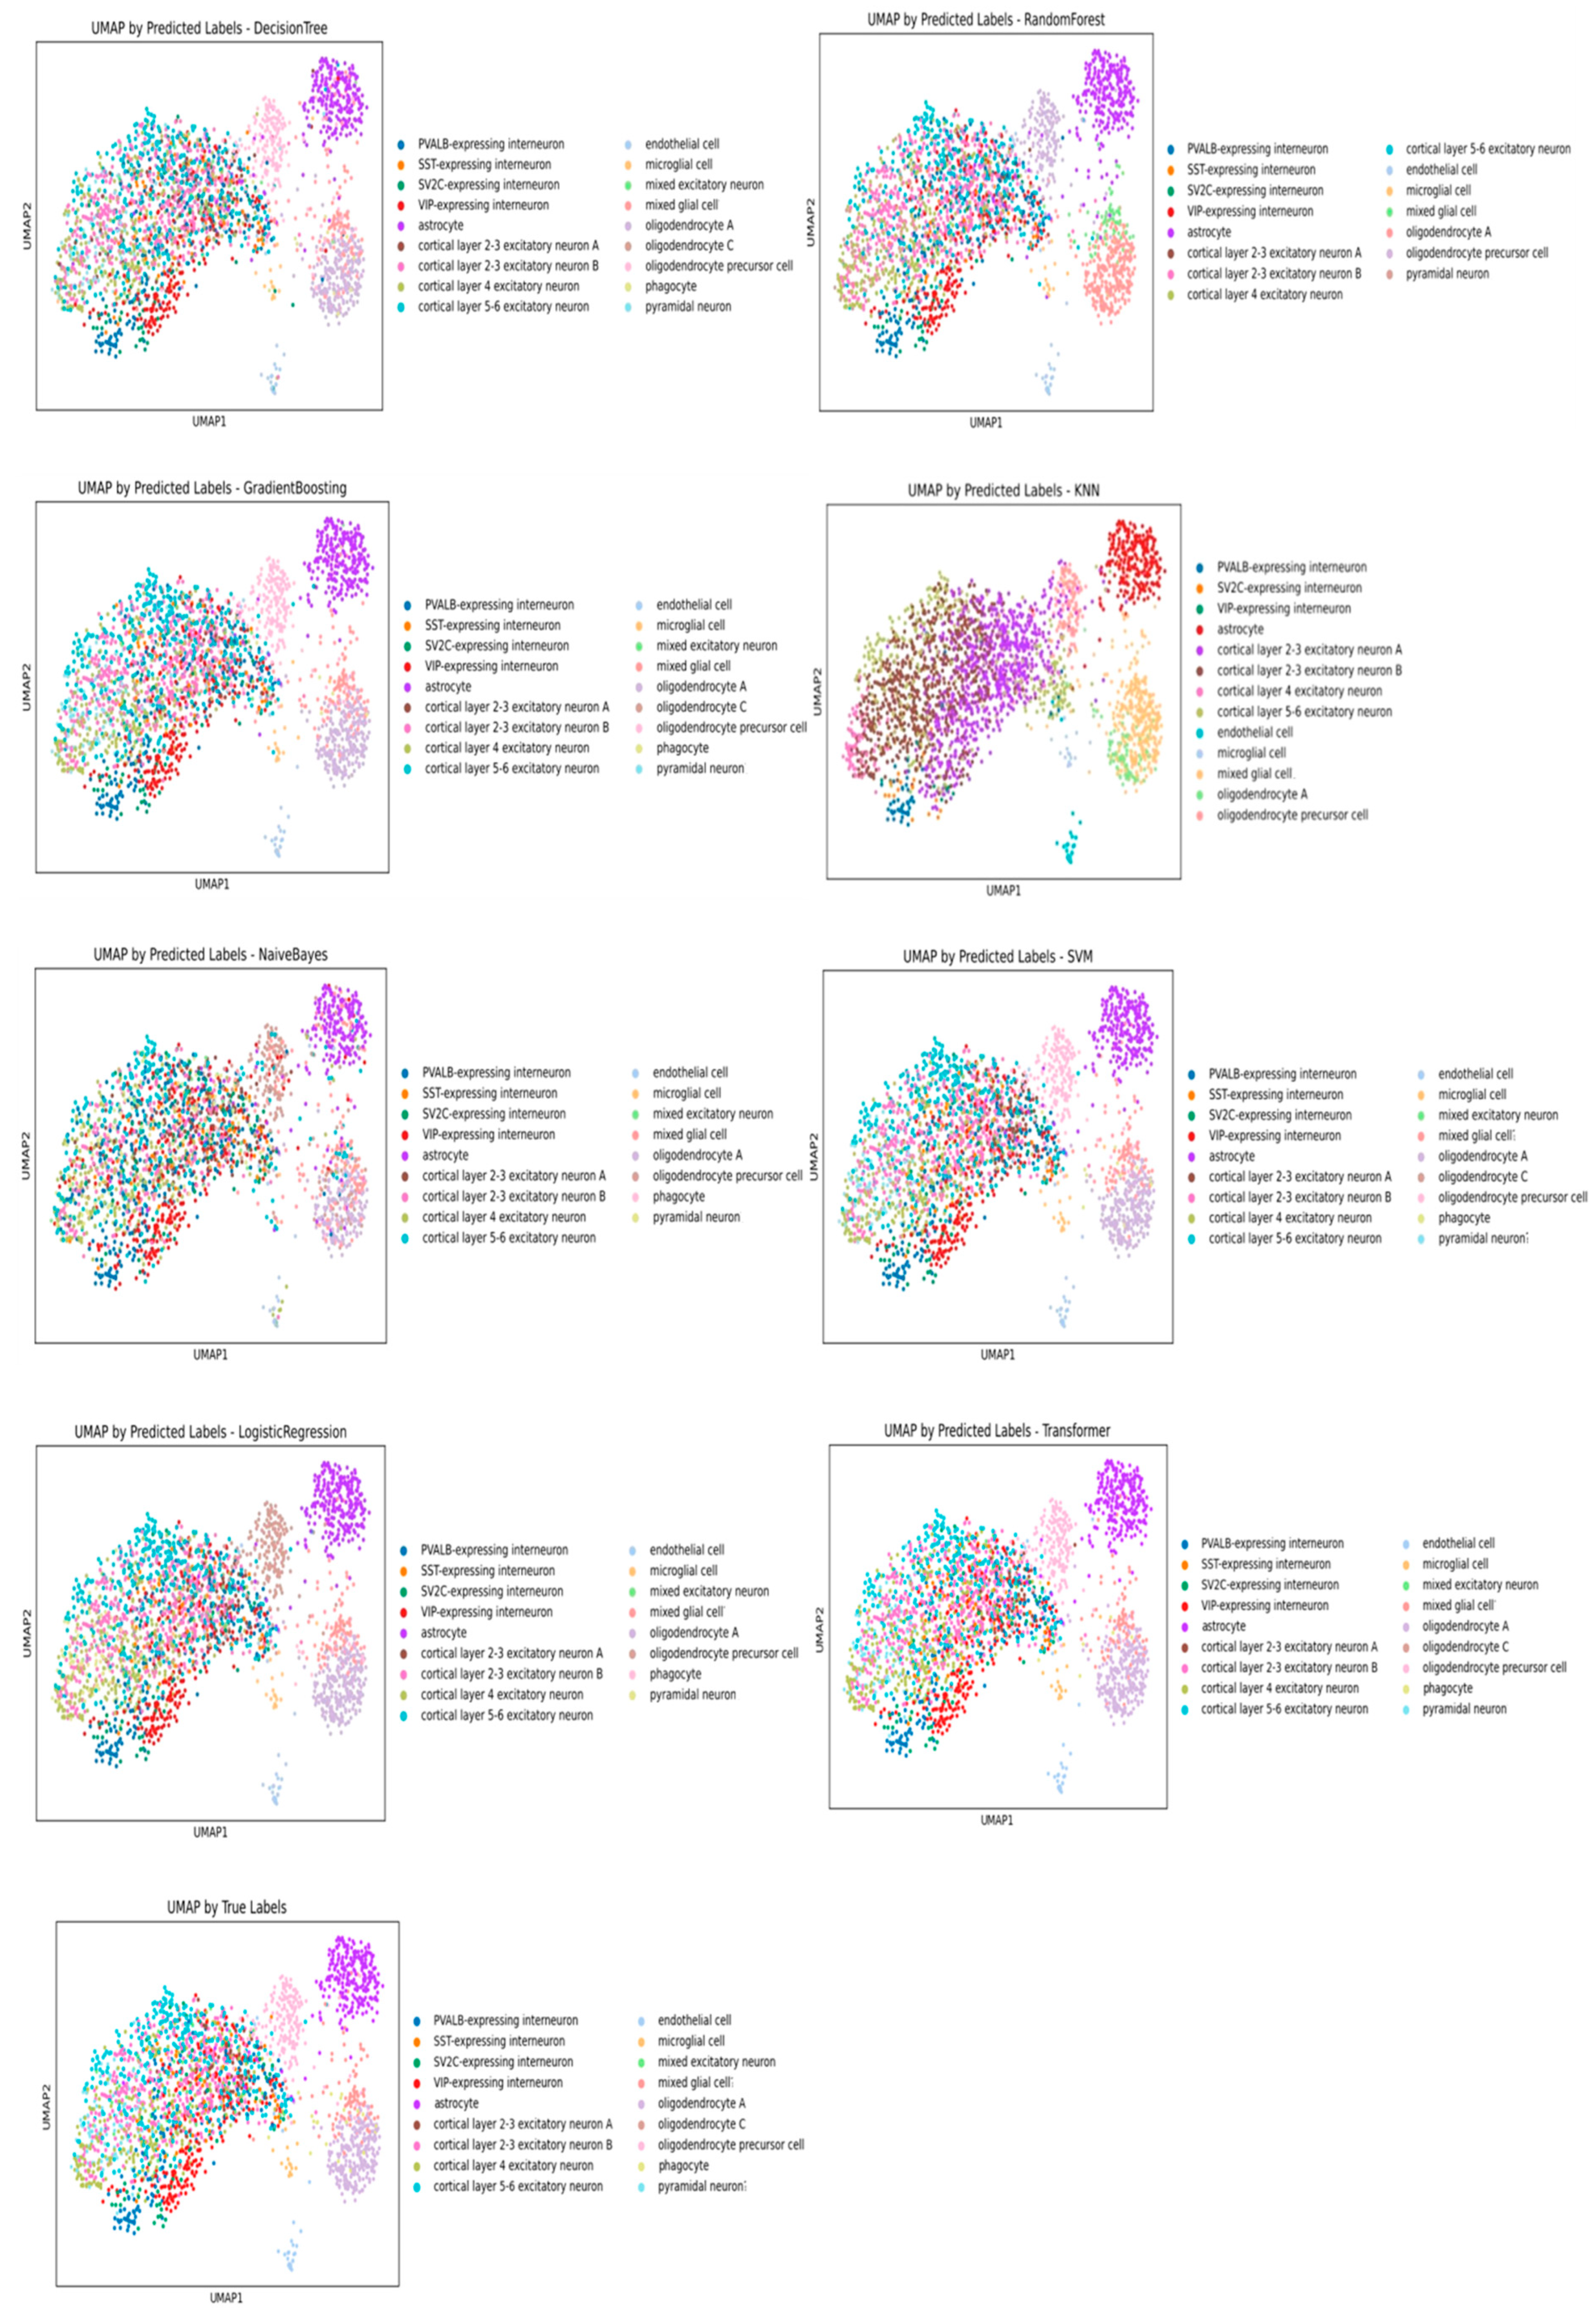
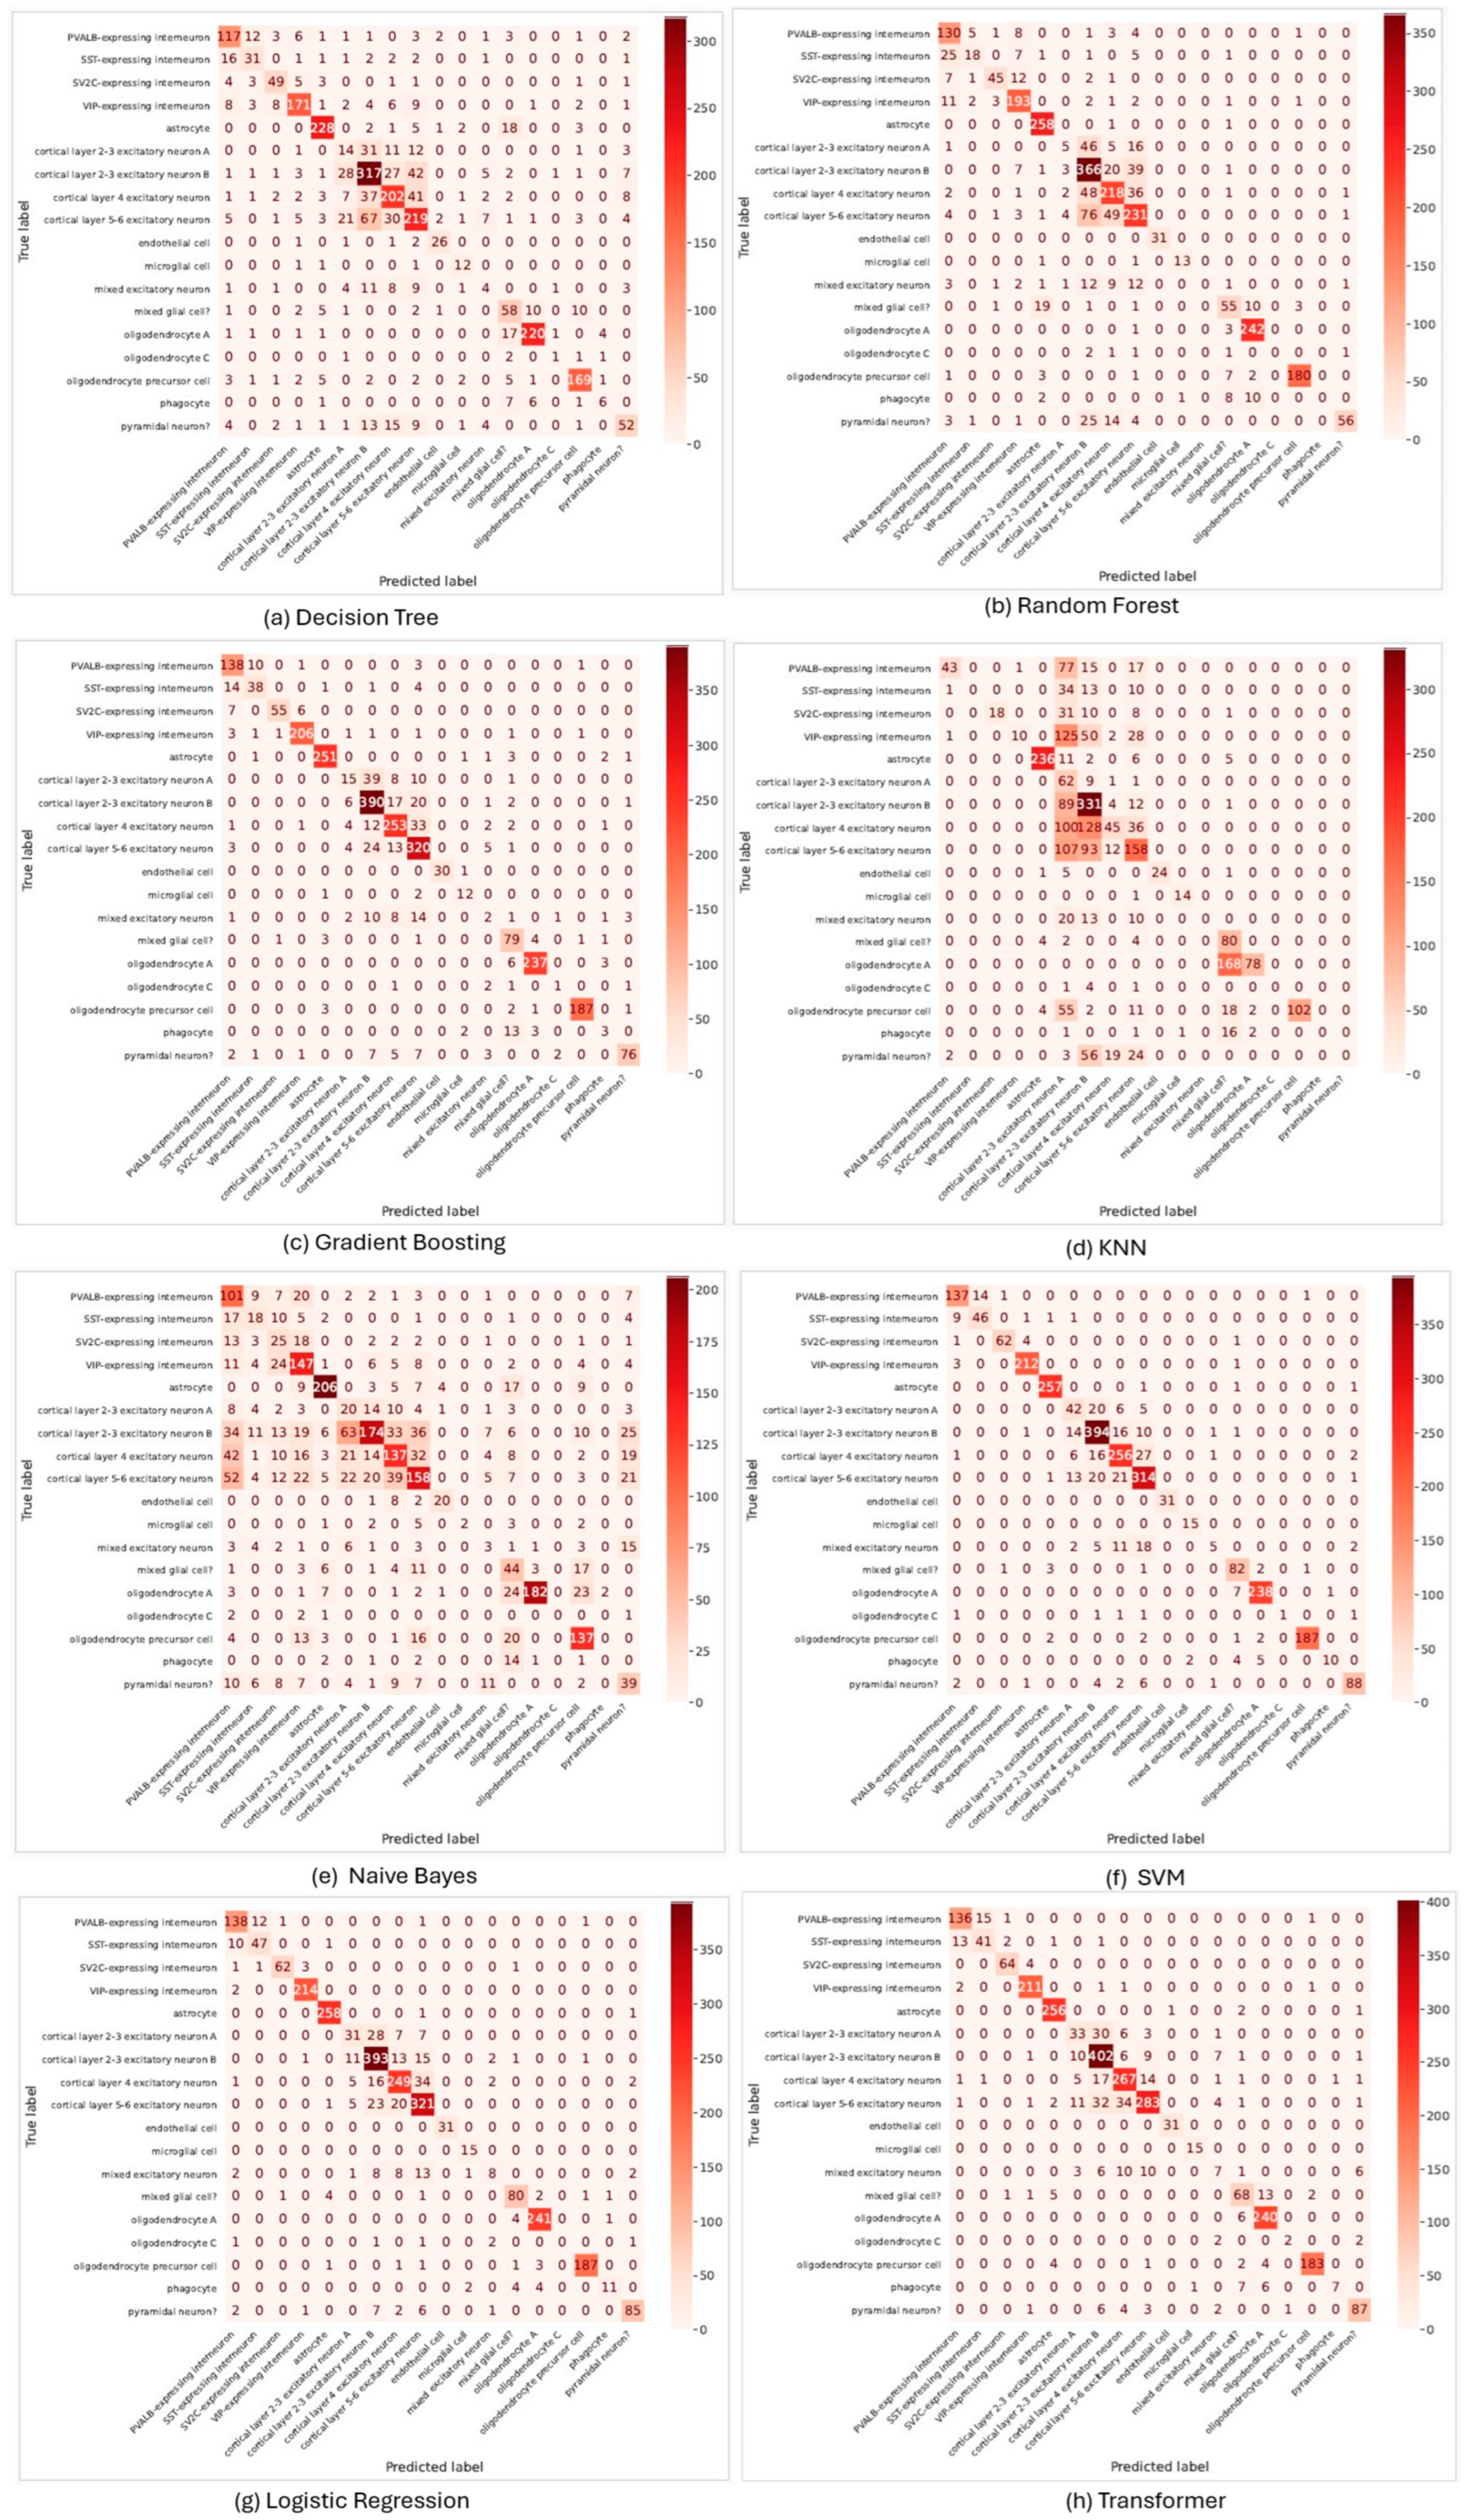
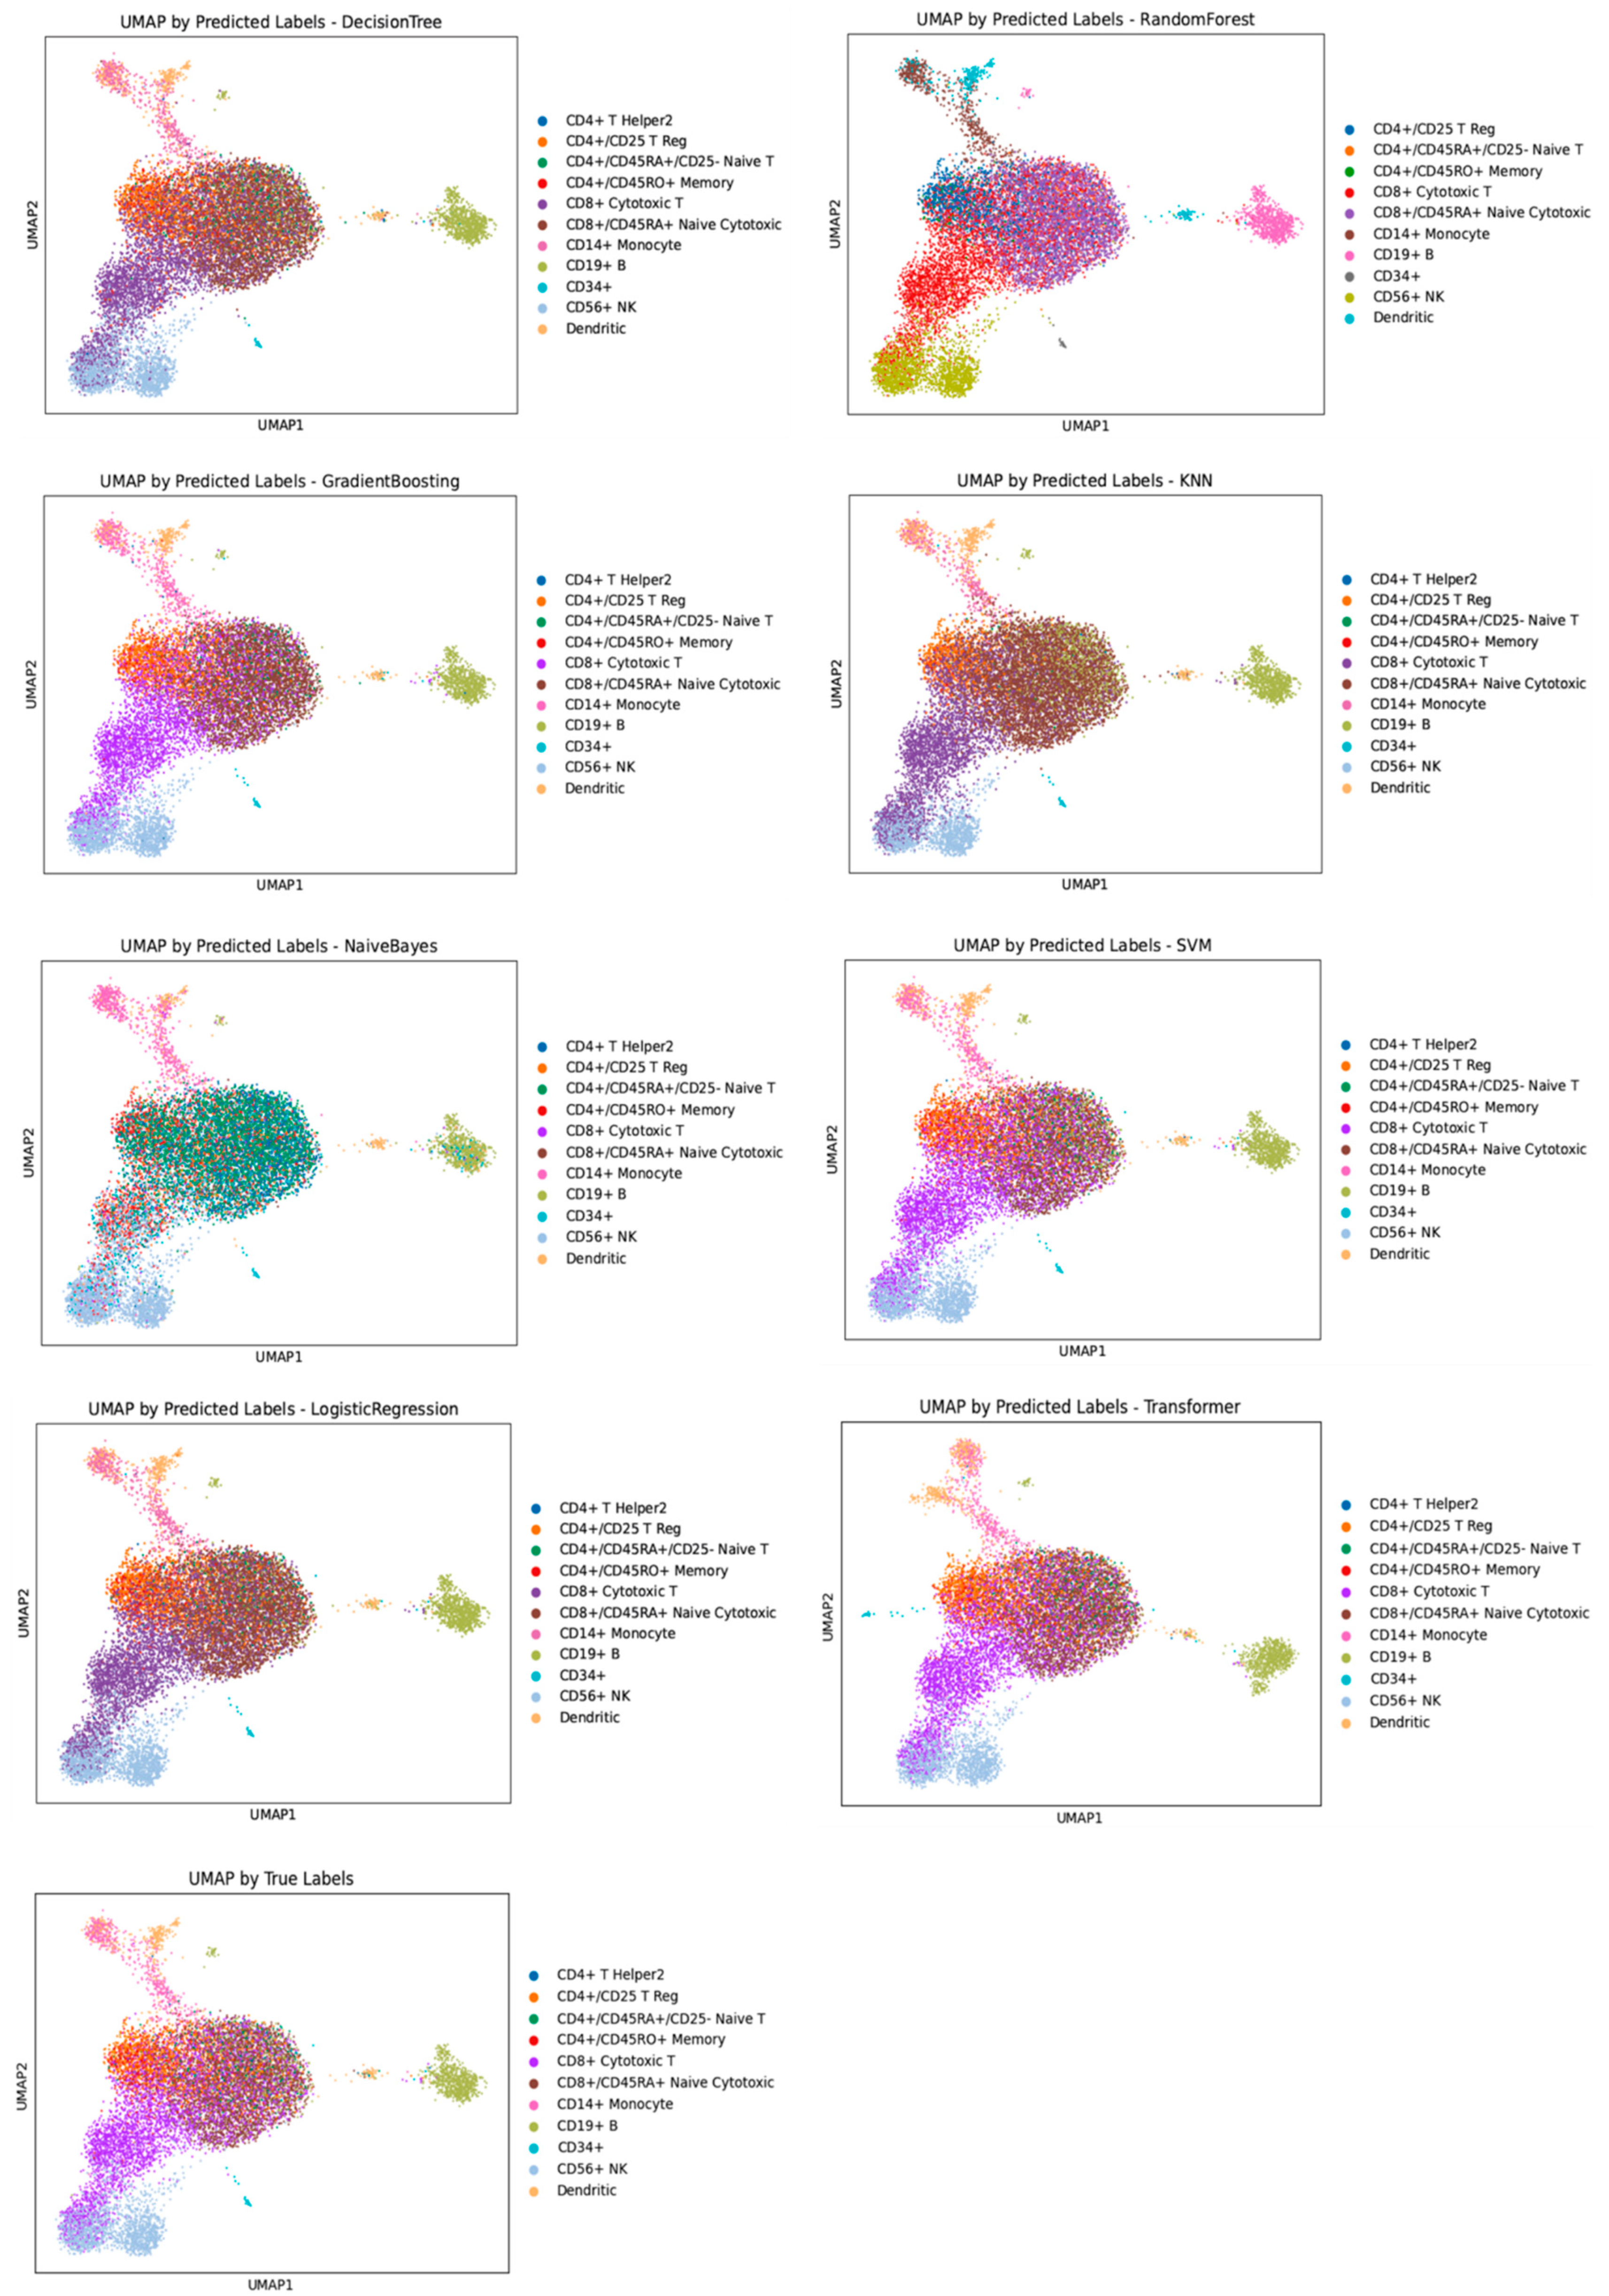
3.2. Performance Evaluation of Machine Learning Models for Cell Annotation on Multiple Sclerosis Dataset

Next, we assess the performance of machine learning models for cell annotation on a multiple sclerosis (MS) dataset. SVM and logistic regression achieved the highest accuracies of 88.23% and 88.01%, with corresponding F1-scores of 87.74% and 87.44%. Detailed metrics are presented in Table 2. These results highlight their effectiveness in managing the complexity and heterogeneity of high-dimensional MS-related data. UMAP visualizations (Figure 4) for SVM and logistic regression revealed distinct, well-separated clusters closely aligned with true labels, indicating strong learning and generalization. Both models achieved high precision and recall across most cell types (Figure 5), including transcriptionally similar neuronal and glial populations critical in MS. SVM effectively captured non-linear boundaries via kernel methods, while logistic regression leveraged regularization to maintain high accuracy without overfitting. Their confusion matrices confirmed minimal misclassifications.
Gradient boosting also performed well (accuracy: 85.12%, F1-score: 84.19%), benefiting from its sequential error correction to improve classification in complex, hierarchical data. UMAP plots showed coherent clusters, though with some overlaps in closely related cell types. Random forest achieved moderate performance (accuracy: 75.76%, F1-score: 73.73%) with reasonable cluster formation, but struggled in regions representing transitional states. Both models exhibited misclassification among similar neuron subtypes (Figure 5), reflecting limitations in resolving overlapping feature spaces.
Decision tree, KNN, and naive Bayes demonstrated significantly lower performance, underscoring their limitations in handling the complexity of single-cell data. Their underperformance can be attributed to inherent algorithmic constraints when applied to high-dimensional, heterogeneous datasets typical of transcriptomic profiles. Decision trees suffered from overfitting due to their reliance on a single-tree structure, which tends to memorize the training data rather than generalize to unseen examples. This limitation was evident in the UMAP (Figure 4), which displayed poorly separated clusters, and in the confusion matrix (Figure 5), which showed extensive off-diagonal misclassifications, especially among closely related cell types. KNN was hindered by the curse of dimensionality, where the notion of distance central to its functioning becomes less meaningful as the number of features increases. In high-dimensional gene expression space, the Euclidean distance loses its discriminative power, leading to scattered and overlapping clusters in the UMAP and frequent misclassification in the confusion matrix. Naive Bayes assumes conditional independence among features, an assumption that is clearly violated in gene expression data, where genes are often co-expressed or functionally interdependent. This fundamental mismatch between model assumptions and biological reality led to widespread classification errors across all cell types, as illustrated by both UMAP and confusion matrix results. These observations highlight that models relying on oversimplified assumptions or lacking mechanisms to manage high-dimensional interdependencies are ill-suited for annotating complex cellular phenotypes in MS datasets. In contrast, models such as SVM, logistic regression, and gradient boosting demonstrated superior performance due to their capacity to model non-linear relationships, apply regularization, and iteratively refine predictions.

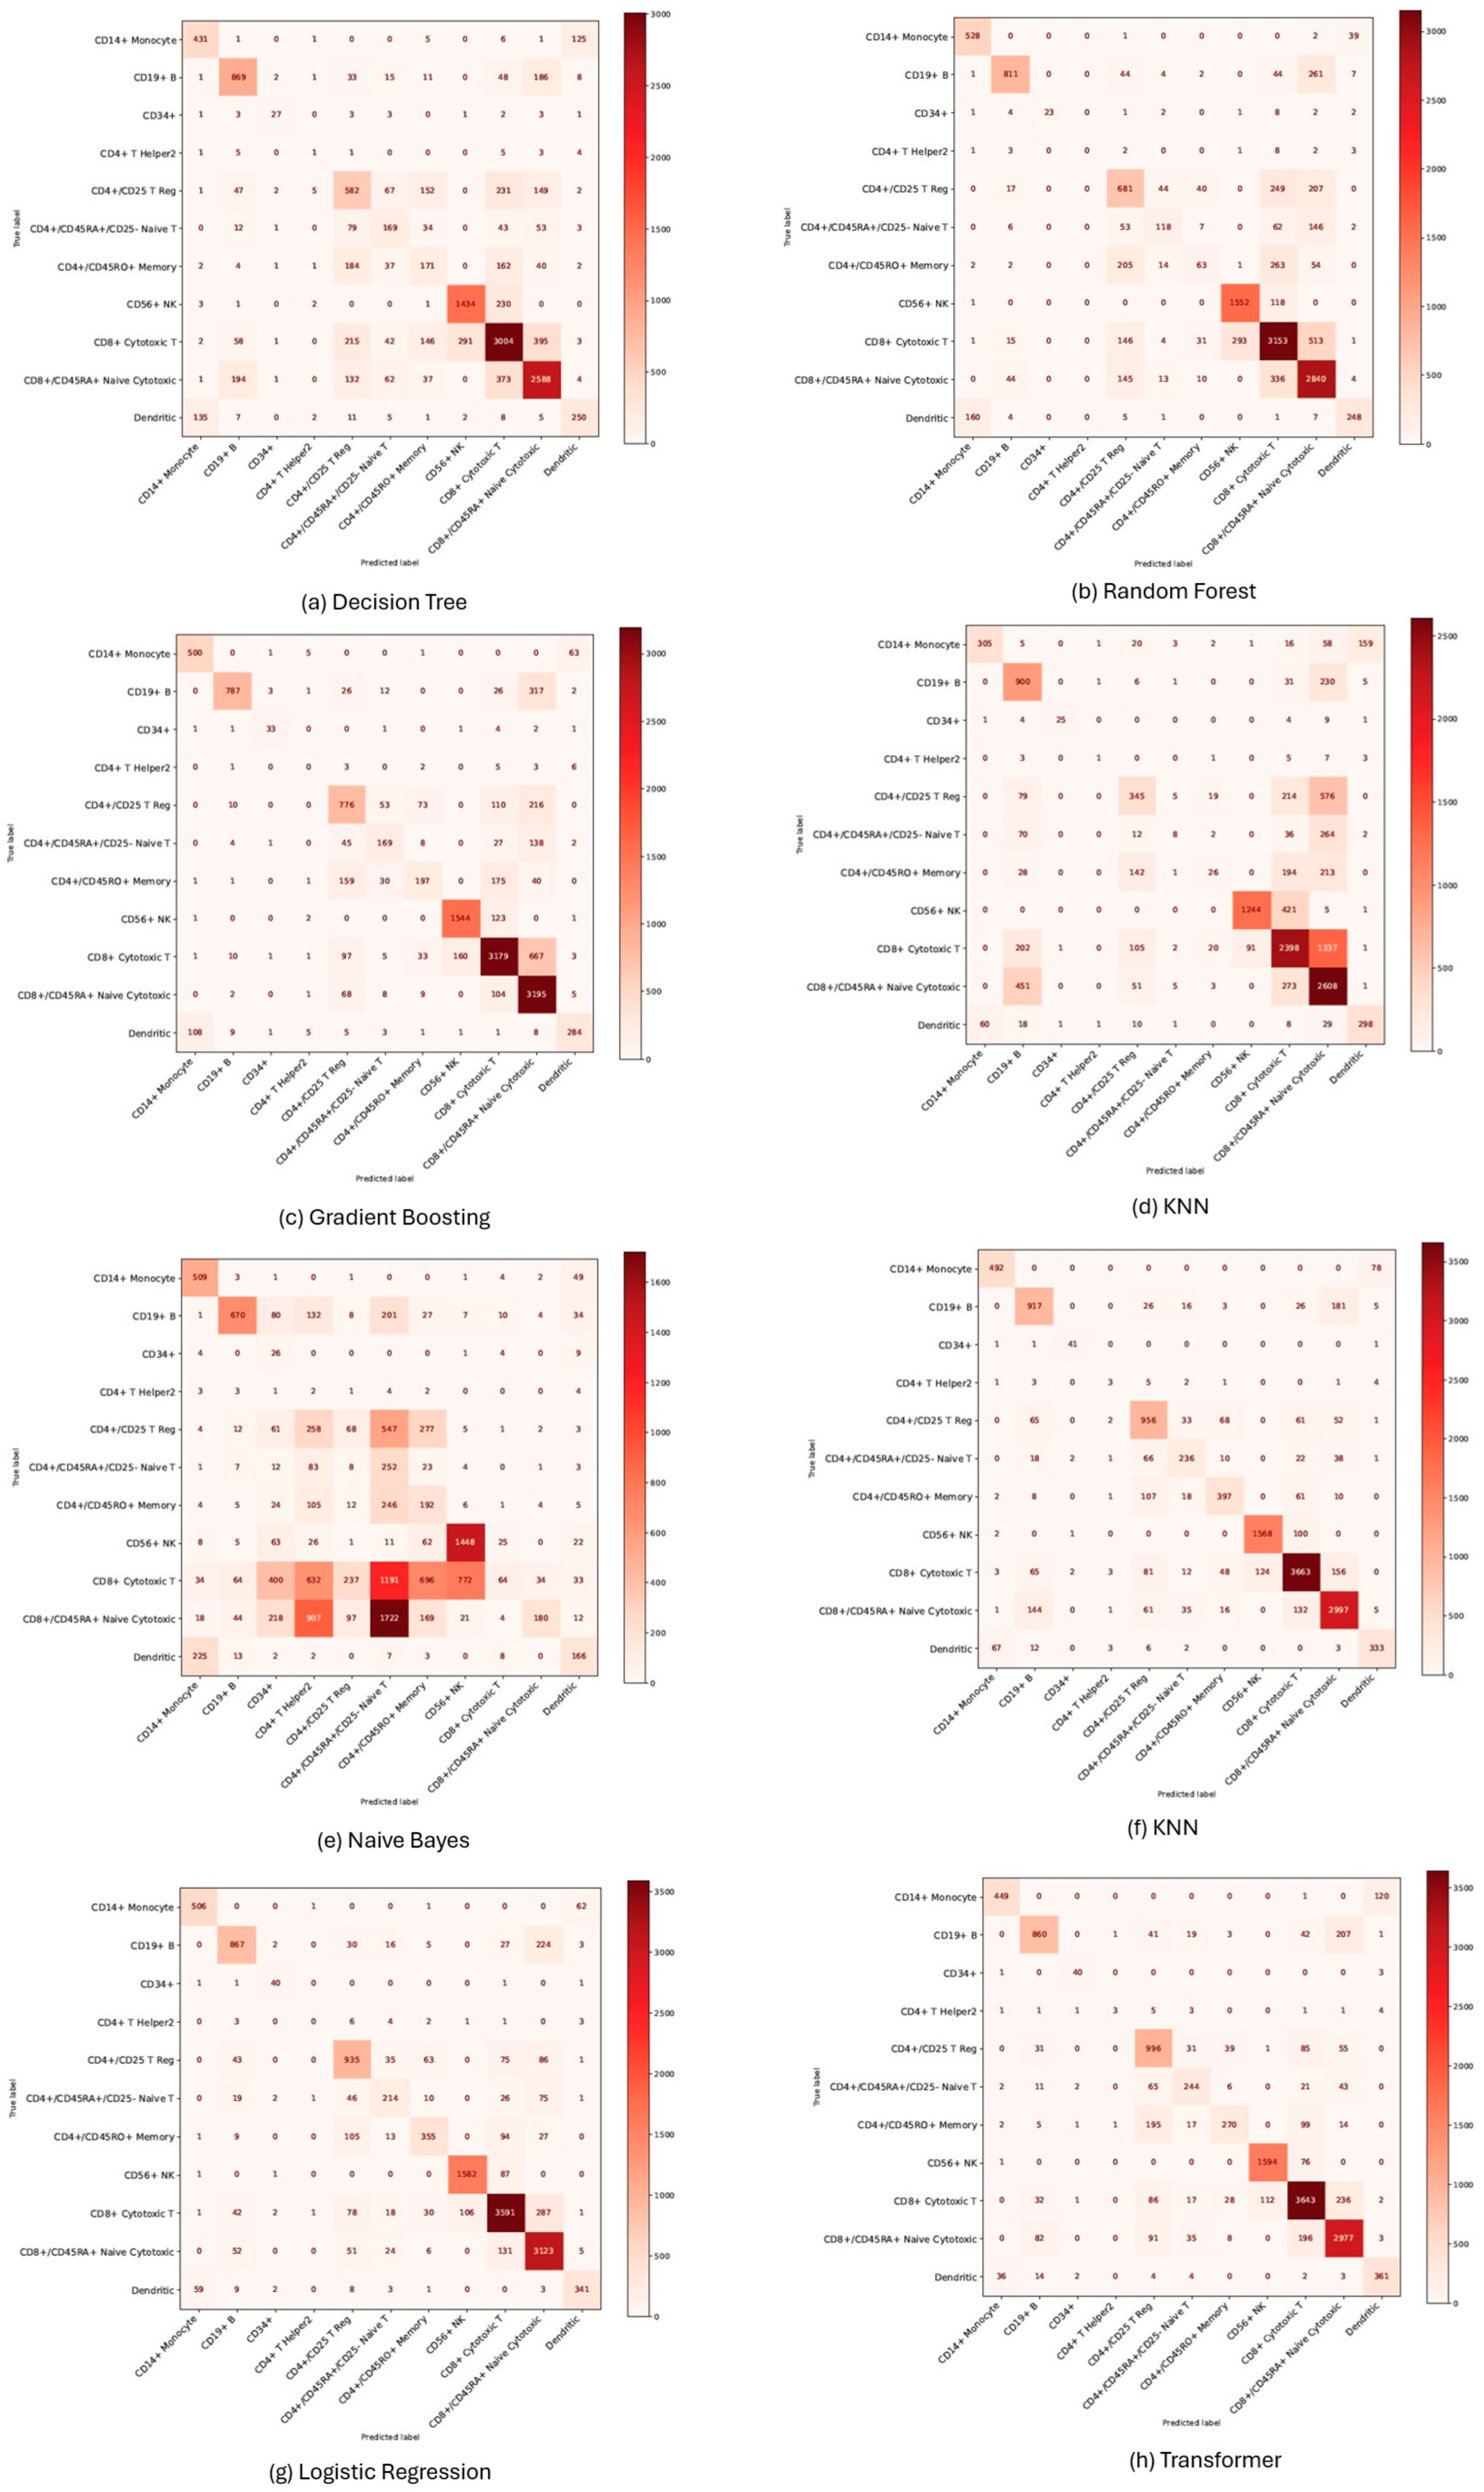
3.3. Performance Evaluation of Machine Learning Models for Cell Annotation of Zhengh68k Datasets

In this study, we evaluated the performance of machine learning models on the Zheng68k dataset for single-cell annotation. As shown in Table 2, SVM and logistic regression achieved the highest accuracy and F1-scores, followed by the transformer and gradient boosting. Random forest, decision tree, and KNN delivered moderate results, while naive Bayes performed the poorest. Clustering and classification outcomes are visualized in the UMAP plots and confusion matrices in Figure 6 and Figure 7.
Support vector machine (SVM) and logistic regression emerged as the top-performing models for cell type classification, achieving accuracies of 84.76% and 84.40%, and F1-scores of 84.72% and 84.15% (Table 2), respectively. SVM demonstrated robust performance with minimal misclassifications and clear, well-separated clusters in UMAP space (Figure 6), reflecting its capacity to model complex non-linear scenarios. Despite its inherently linear nature, logistic regression demonstrated strong performance, attributed to the incorporation of regularization techniques that mitigated overfitting and facilitated robust generalization across heterogeneous cell populations.
The transformer model also ranked among the best performers (accuracy: 83.54%, F1-score: 83.30%), leveraging its self-attention mechanism to capture intricate gene–gene dependencies, as evidenced by distinct clustering of major immune cell types. The UMAP plot showed distinct clusters, especially for major cell types like CD4+ T helper and CD8+ cytotoxic T cells (Figure 5), indicating the model’s ability to capture complex gene relationships through its attention mechanism. Gradient boosting followed with competitive performance (accuracy: 77.90%, F1-score: 77.29%), benefitting from its iterative refinement process that allowed it to model complex non-linear relationships. Its UMAP plots showed well-separated clusters, especially for distinct cell types like naive T cells and CD8+ cytotoxic T cells, indicating the model’s ability to learn complex non-linear relationships in gene expression data. However, its performance was slightly lower, likely due to sensitivity to noise and class imbalance.
Random forest outperformed the decision tree model with improved accuracy (73.17%) and F1-score (71.77%) by leveraging ensemble learning, which reduced overfitting and improved robustness; however, it still struggled with closely related cell types like monocytes and dendritic cells, as reflected in the confusion matrix and partially overlapping UMAP clusters. The UMAP plot showed more defined clusters with less overlap between cell types, suggesting that random forest’s ensemble learning approach helped improve the model’s robustness to noise and over-fitting. However, while random forest performs well in capturing relationships in the data, it still faces challenges in distinguishing highly similar cell types, particularly in the case of memory T cells and naive T cells.
Transformer models delivered strong results by capturing complex gene-gene relationships through self-attention mechanisms, although their computational demands limit scalability. Gradient boosting slightly outperformed Random Forest by iteratively correcting errors, demonstrating better separation in UMAP plots, yet still misclassified similar cell types. Decision tree achieved moderate accuracy (69.58%) but showed poor generalization, with overlapping UMAP clusters and frequent confusion between transcriptionally similar cells such as naive and memory T cells, due to its inability to model non-linear boundaries. These models leveraged ensemble learning, which helps mitigate overfitting and improves performance by aggregating multiple weak learners. However, they still struggled with distinguishing closely related cell types, indicating that ensemble models, while effective, are not always perfect at separating similar classes. The decision tree model achieved an accuracy of 69.58% and an F1-score of 69.46%, indicating moderate performance. The confusion matrix (Figure 7) shows that while the model performed well in classifying some cell types, it misclassified several others, especially those with similar gene expression profiles. For instance, the naive T cells and memory T cells were often confused with each other. The UMAP plot (Figure 6) revealed overlapping clusters, particularly for closely related cell types like CD4+ T helper and CD8+ cytotoxic T cells, suggesting that decision trees may struggle to capture complex relationships in high-dimensional data. KNN (accuracy: 59.59%) performed poorly, as distance metrics become unreliable in high-dimensional gene expression space, leading to dispersed and overlapping clusters. The confusion matrix highlighted frequent misclassifications, particularly between memory T cells and naive T cells. The UMAP plot for KNN displayed scattered clusters with significant overlap, indicating that the model was unable to accurately differentiate between cell types. Naive Bayes showed the lowest performance (accuracy: 26.13%) due to its unrealistic assumption of feature independence, which is invalid in gene expression data where gene co-regulation is common. Naive Bayes assumes feature independence, which is often violated in gene expression data, where genes are highly correlated. As a result, the model’s assumptions led to significant misclassifications, particularly for cell types with complex interdependencies in gene expression, such as T helper cells and cytotoxic T cells.

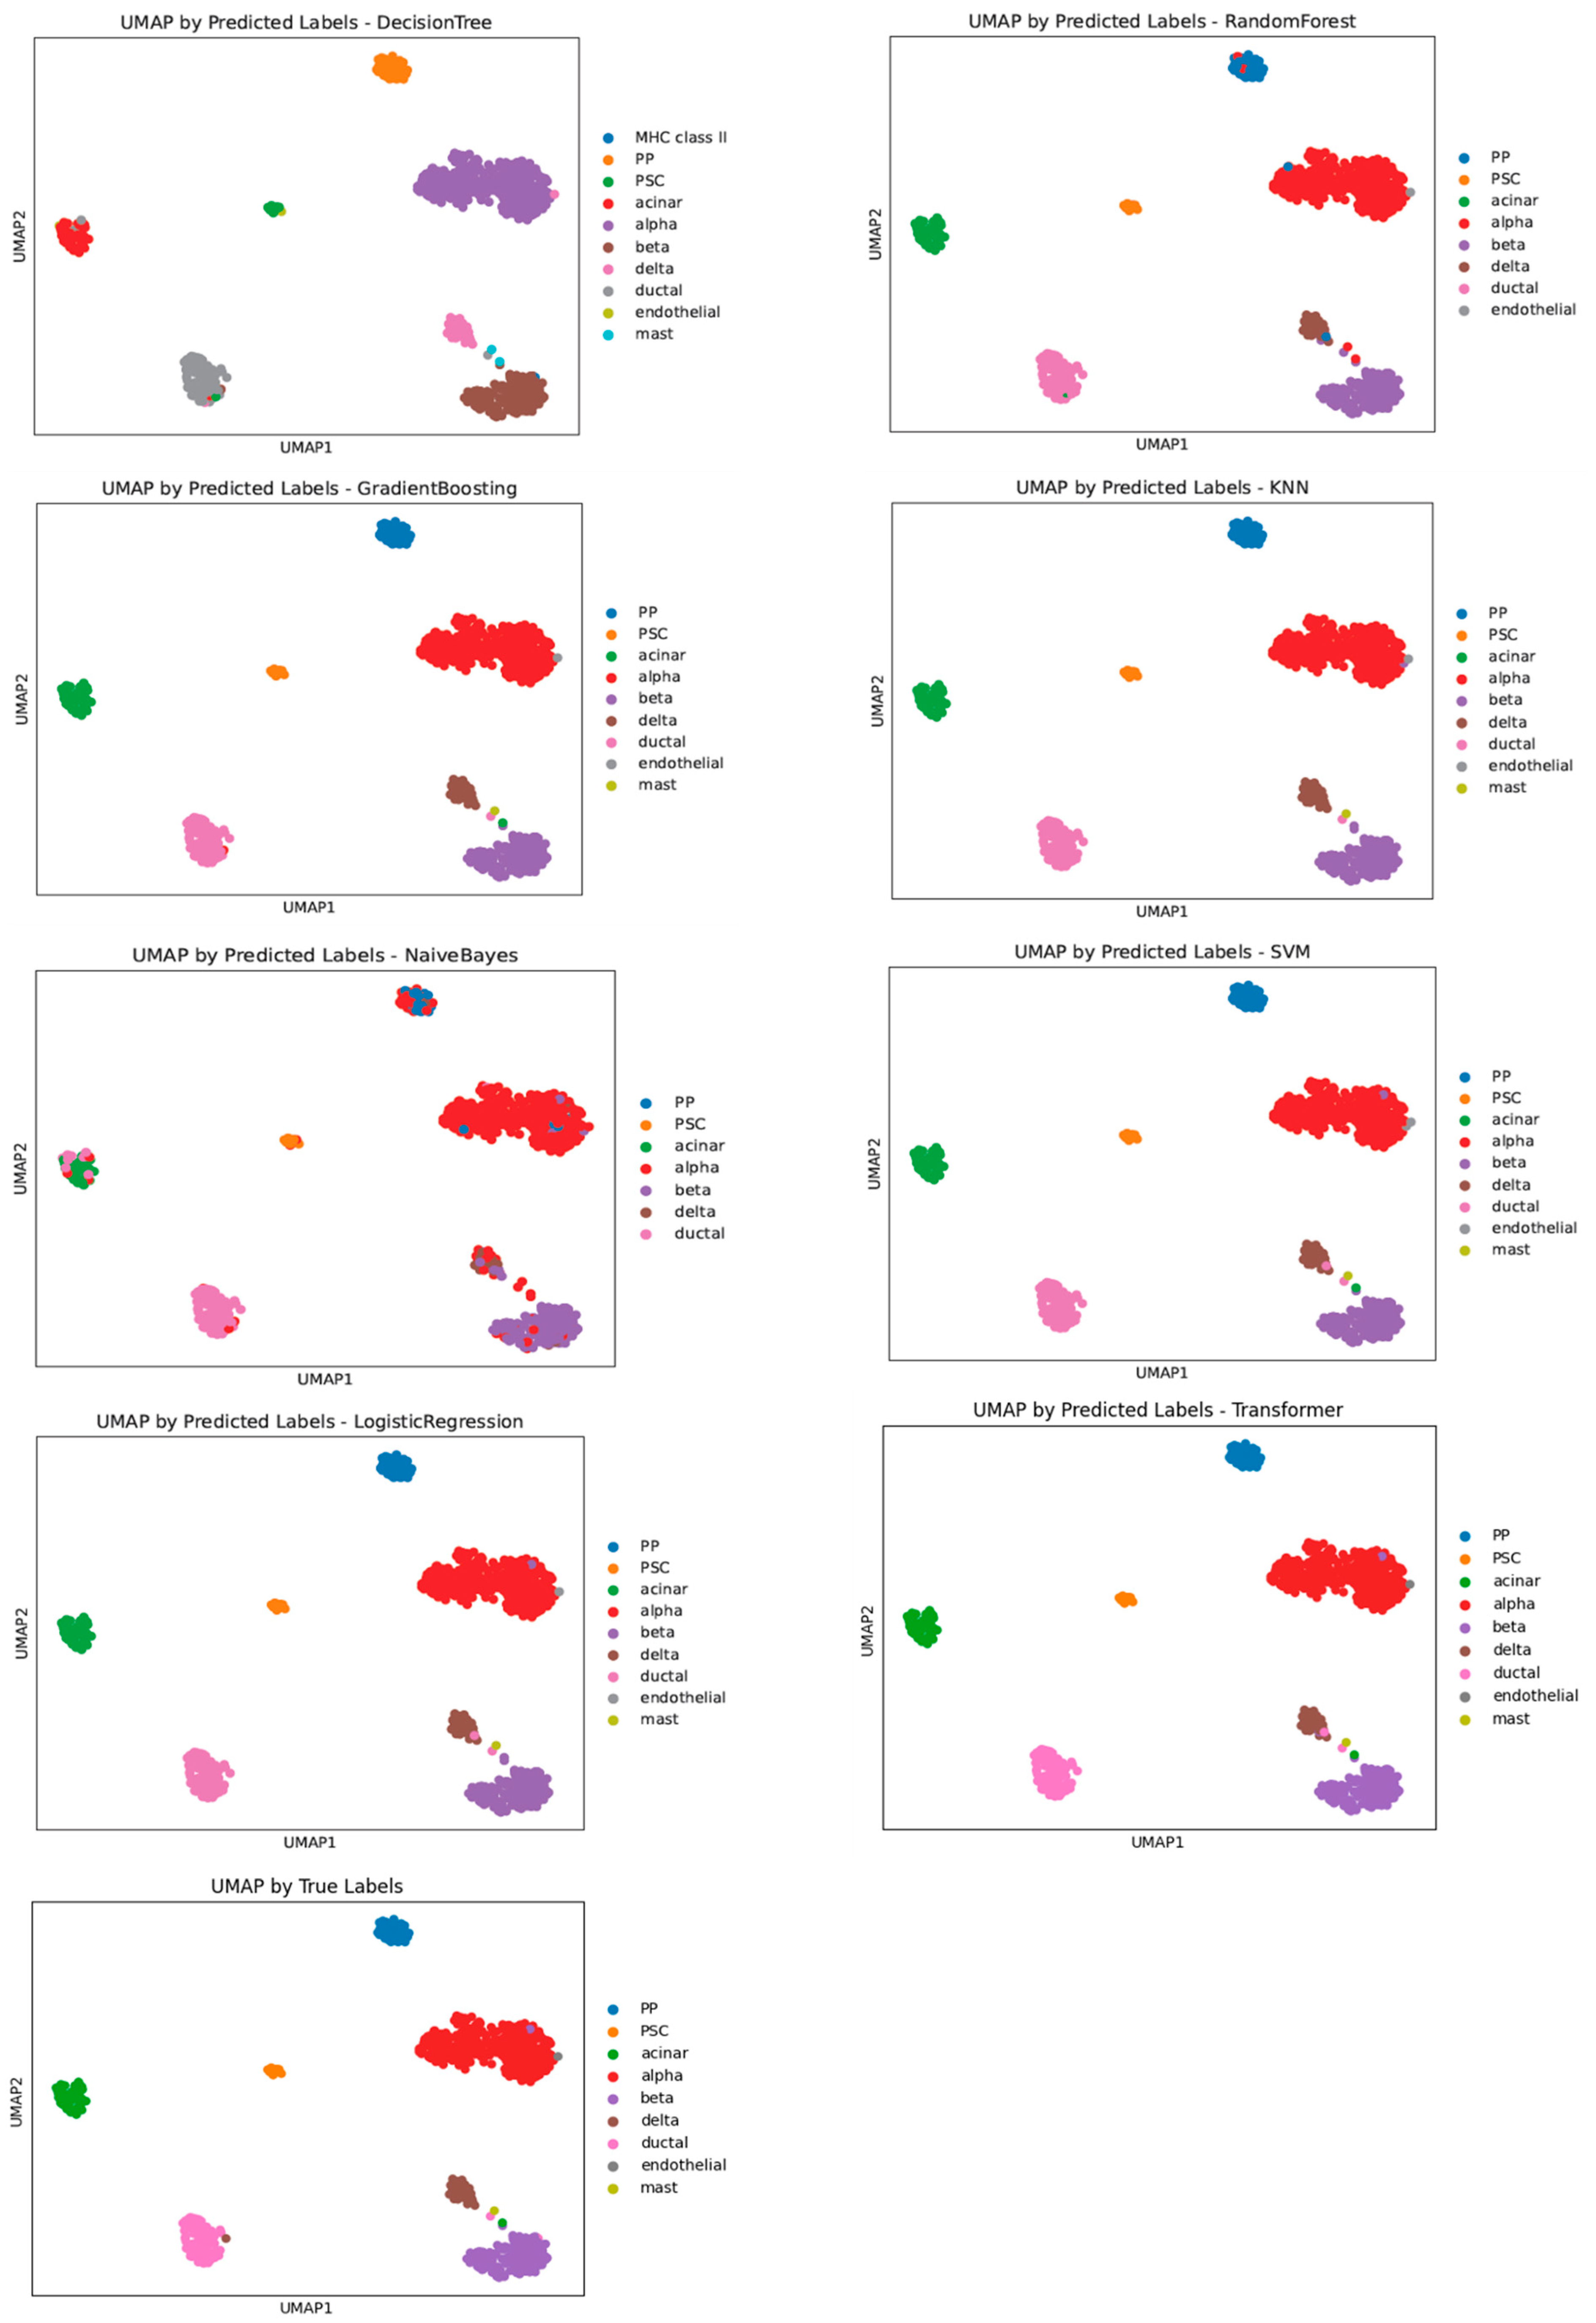
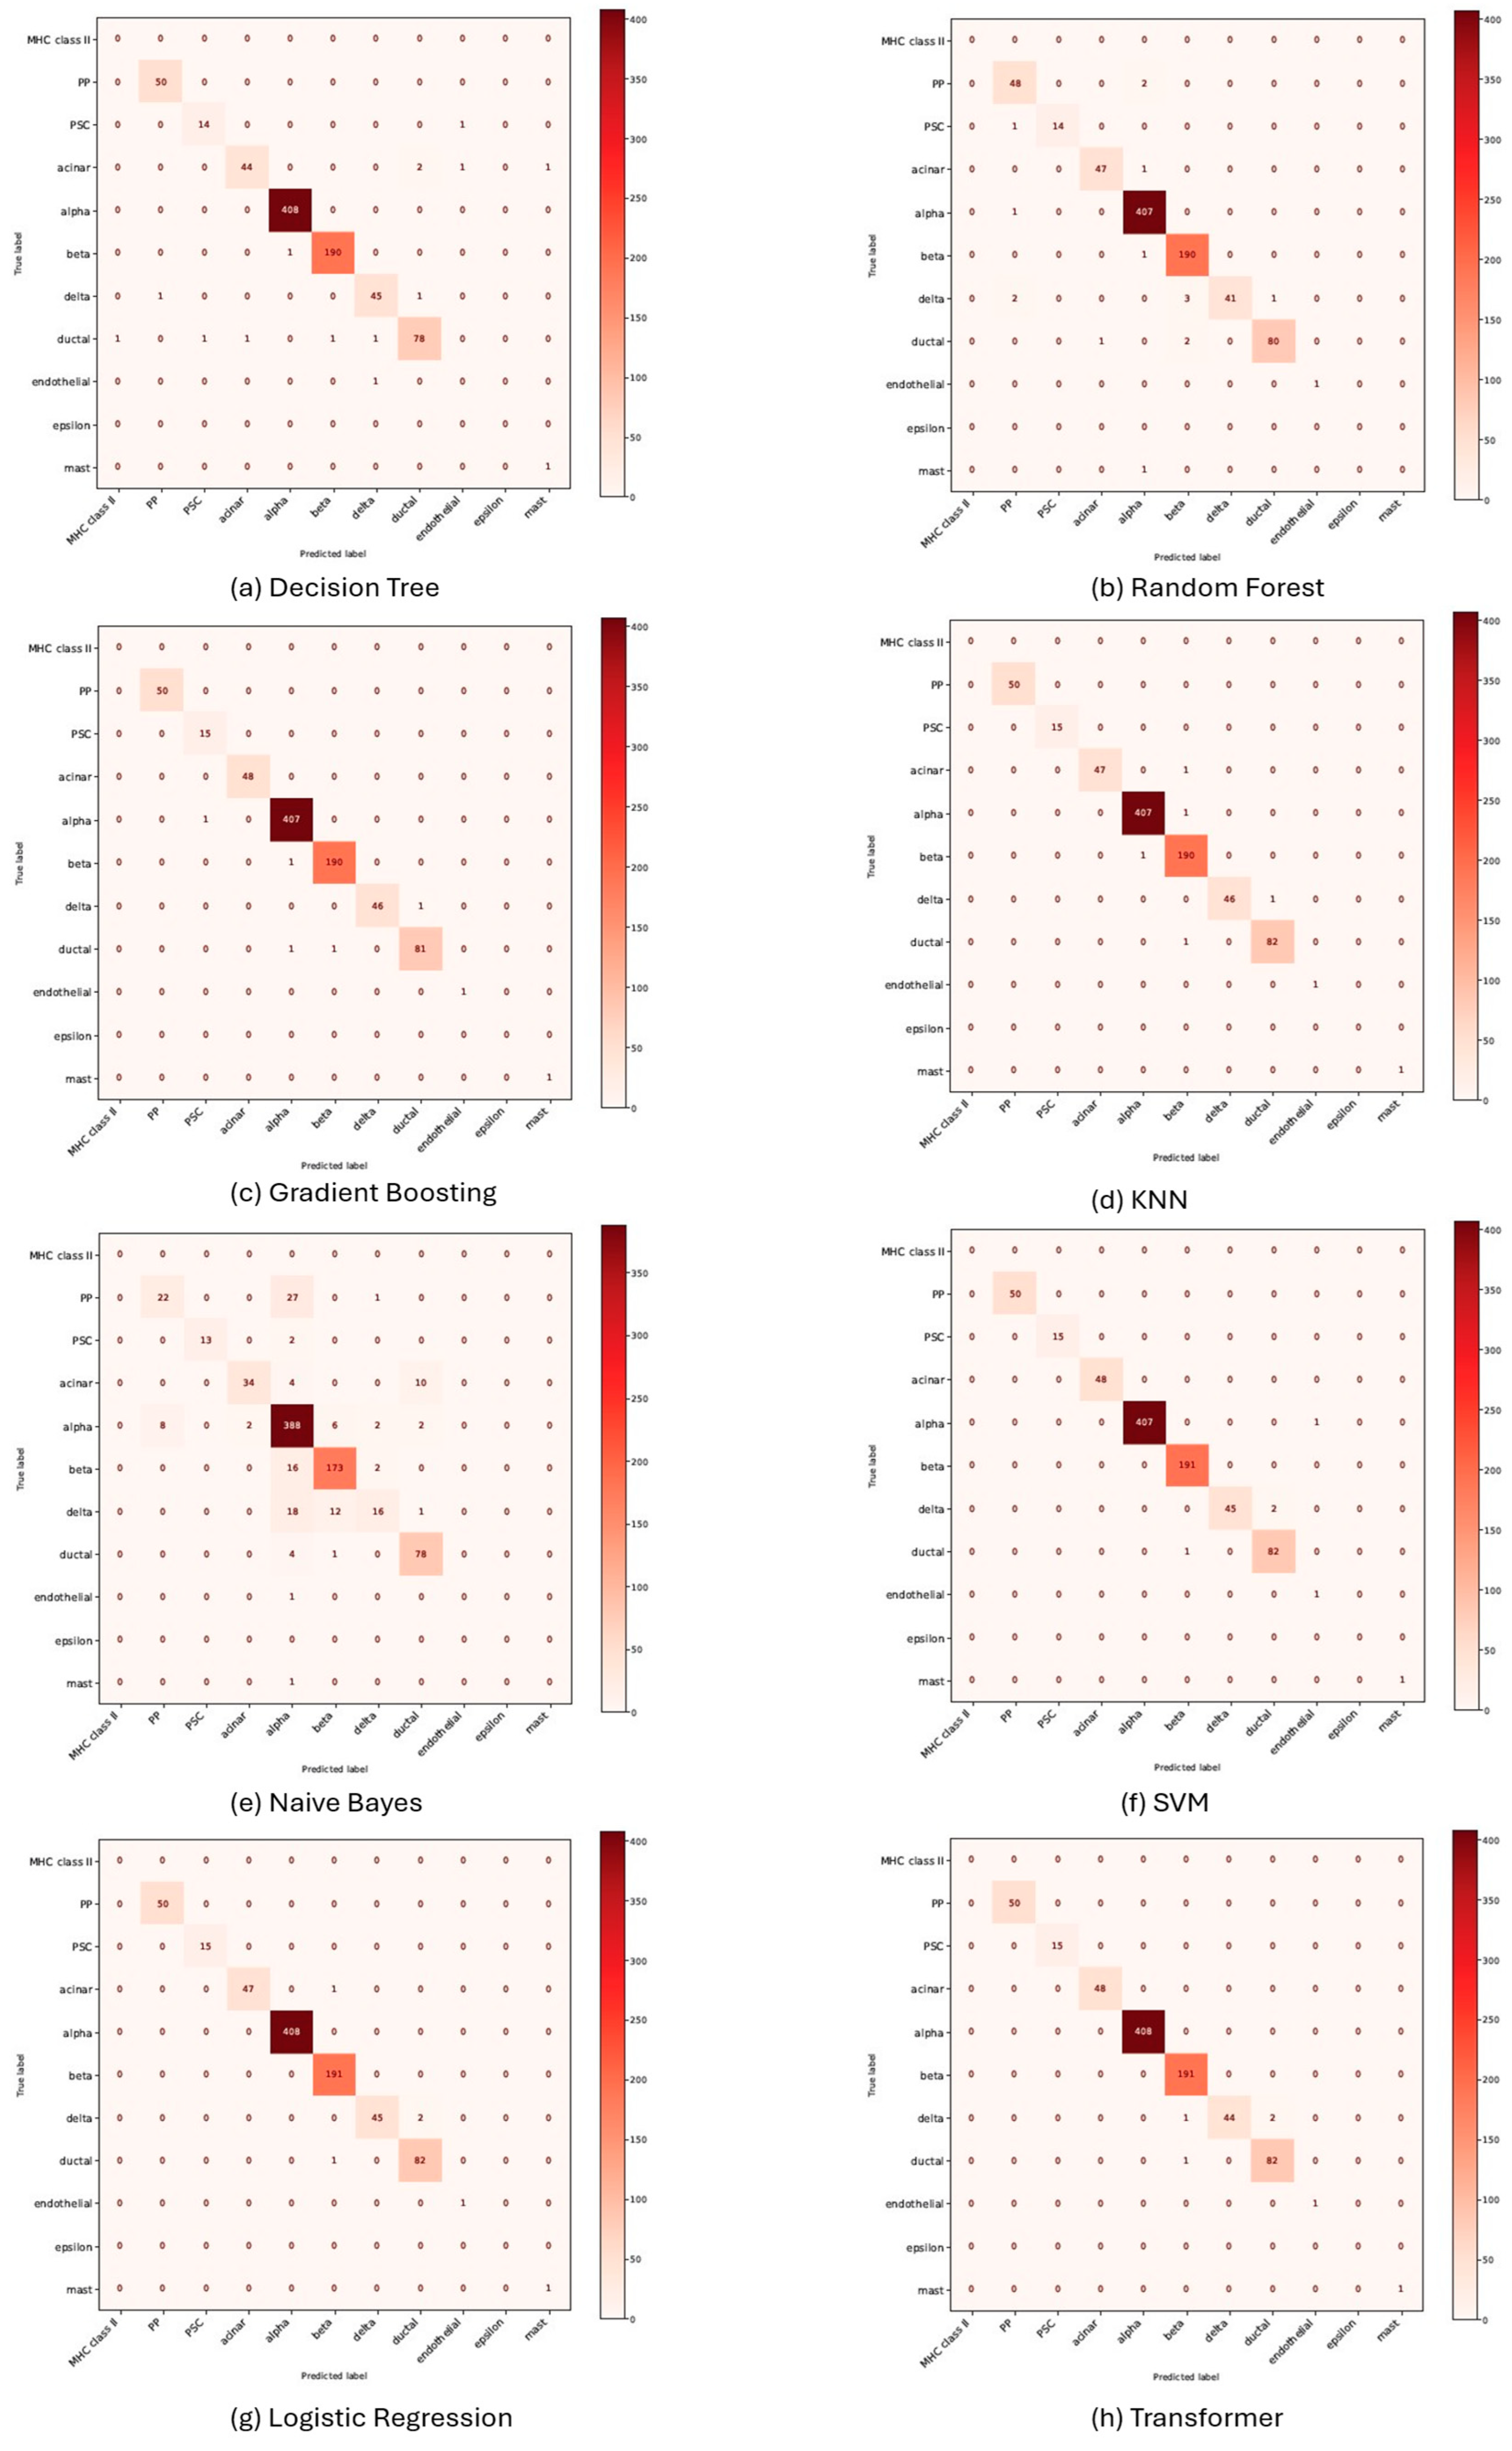
3.4. Performance Evaluation of Machine Learning Models for Cell Annotation of Pancreatic Dataset

The performance of various machine learning models for pancreatic cell annotation was assessed using UMAP visualizations, confusion matrices, accuracy, and F1-scores. The Umap and confusion matrix results are given in Figure 8 and Figure 9, respectively. Among the ML methods, SVM, transformer, and gradient boosting emerged as the top-performing methods, as evidenced by their high accuracy and F1-score (Table 2). Methods like KNN, logistic regression, and decision tree demonstrated moderate performance, while random forest and naive Bayes were the worst performing methods. The decision tree classifier performed well, achieving an accuracy of 0.9834 and an F1-score of 0.9846 in the pancreas dataset (Table 2). However, the confusion matrix for the dataset suggests that it has misclassified some minority cell types, indicating overfitting to majority classes.
Random forest, slightly lower in performance (0.9810 accuracy, 0.9803 F1-score), showed better generalization than the decision tree, with more balanced predictions but still some confusion in closely related cell types. Gradient boosting achieved high accuracy (0.9941) and F1-score (0.9969), demonstrating robust cell annotation capability. The UMAP visualization shows clear, well-separated clusters aligning closely with the true labels, confirming its superior performance in distinguishing cell types. KNN also performed well (0.9921 accuracy, 0.9958 F1-score), though its confusion matrix shows slightly more misclassification compared to gradient boosting. This suggests that while KNN captures local structures well, it may struggle with boundary cases. The naive Bayes classifier performed the worst among all models (0.8578 accuracy, 0.8456 F1-score), with significant misclassification in the confusion matrix. This result is expected due to the model’s assumption of feature independence, which does not hold well in transcriptomic data. The UMAP plot for naive Bayes shows poor separation of cell types, with overlapping clusters indicating a failure to capture complex relationships. In contrast, support vector machine (SVM) achieved the highest performance (0.9953 accuracy, 0.9976 F1-score), with well-separated clusters in the UMAP visualization and minimal misclassification in the confusion matrix, making it the most reliable method for cell annotation. Logistic regression (accuracy: 0.9921, F1-score: 0.9934) performed comparably to KNN but struggled slightly in distinguishing closely related cell types, as observed in the confusion matrix. The transformer-based model achieved 0.9943 accuracy and 0.9958 F1-score, performing similarly to gradient boosting and SVM. The UMAP plot for the transformer model shows clear and well-defined clusters, suggesting that it effectively captures non-linear relationships and latent patterns in high-dimensional data. The performance trends observed in the PBMC dataset largely align with the results from the pancreas dataset. SVM, gradient boosting, and transformer-based models consistently outperformed other methods, achieving high accuracy and well-separated clusters in UMAP. Naive Bayes performed poorly in both datasets, reinforcing its limitations in handling high-dimensional single-cell data. The confusion matrices reveal that models like decision tree and random forest, while effective, exhibit occasional misclassification, particularly for rare cell types. Overall, SVM, gradient boosting, and transformer-based models demonstrated the best performance for cell annotation, with high accuracy, well-clustered UMAP plots, and minimal misclassification in the confusion matrices. Naive Bayes performed the worst, while KNN and logistic regression were moderately effective. The results are consistent for pancreatic datasets, highlighting the robustness of advanced models like SVM and transformers for single-cell transcriptomic classification.

4. Discussion

We implemented machine learning methods for comparison to establish a reference framework that allows for an objective evaluation of classification performance across diverse single-cell RNA-seq datasets. These baseline models such as SVM, logistic regression, decision trees, KNN, and more are well-established, interpretable, and widely accessible, making them suitable starting points for both benchmarking and real-world applications. By assessing their performance, we aim to identify core strengths and limitations in handling high-dimensional, sparse, and biologically complex data. This provides valuable insights into which foundational models are most effective under varying conditions and serves as a benchmarking baseline for comparing more complex or specialized annotation tools in future studies.
While our study focused on comparison of these methods for cell type annotation, it is essential to understand the underlying reasons for the variation in performance across models. Supervised models such as SVM and logistic regression consistently outperformed others, largely due to their capacity to handle high-dimensional data and exploit complex decision boundaries. SVM, in particular, benefits from kernel transformations that allow it to separate non-linearly distributed classes, which is crucial when distinguishing subtle transcriptional differences between closely related cell types. Logistic regression, though simpler, leverages regularization to maintain generalizability in sparse, high-dimensional spaces typical of scRNA-seq data. Transformers also performed well by utilizing self-attention mechanisms to weigh gene interactions across the input space, capturing contextual gene dependencies. However, their performance, while strong, may be sensitive to training data diversity and require large, high-quality datasets to generalize effectively. In contrast, methods like naive Bayes and KNN performed poorly due to their reliance on assumptions that are violated in scRNA-seq data. Naive Bayes assumes feature independence, which fails in the presence of correlated gene expression, while KNN is susceptible to the curse of dimensionality, where meaningful distance metrics become diluted. The impact of data quality and normalization is profound. The scRNA-seq data are inherently noisy and sparse, necessitating rigorous preprocessing. Quality control removes low-quality cells and artefacts, while normalization corrects for sequencing depth and library size. Inadequate normalization may distort true gene expression signals, leading to biassed model training. For instance, models like SVM and logistic regression are sensitive to feature scaling, and improper normalization may adversely affect margin optimization or coefficient estimation. Moreover, batch effects introduce confounding biases. Without appropriate correction, models may learn batch-specific patterns rather than true biological signals, leading to poor generalization. This is particularly problematic in models like random forest and gradient boosting, which may overfit to batch-specific noise if not properly regularized. Additionally, differences in cell type representation, particularly imbalances or rare subpopulations, can skew classification. Ensemble models may mitigate this by combining multiple decision pathways, but simple models tend to be biassed toward dominant cell types.

5. Conclusions

This study systematically evaluated machine learning models for cell type annotation across PBMC, multiple sclerosis, and Zhengh68k, and pancreatic datasets. The models evaluated included decision tree, random forest, gradient boosting, KNN, naive Bayes, SVM, logistic regression, and transformer. Among the tested models, SVM and logistic regression consistently achieved superior performance, marked by high accuracy, F1-scores, and minimal misclassifications. SVM’s kernel-based approach excelled at capturing non-linear relationships in high-dimensional data, while logistic regression’s simplicity and regularization ensured robust and reliable predictions. The transformer model also demonstrated strong potential, leveraging self-attention mechanisms to capture complex dependencies in gene expression data. Its superior clustering of cell types underscores its effectiveness, although computational demands remain a consideration for large-scale applications. Similarly, gradient boosting performed well, with its iterative learning approach enabling it to handle complex patterns, albeit with occasional overlaps in closely related cell types. Random forest and decision trees displayed moderate performance, benefiting from ensemble methods but struggling with overlapping classes. Simpler models, such as KNN and naive Bayes, performed poorly due to limitations in handling high-dimensional and interdependent gene expression data. The findings highlight the critical role of model selection in single cell analysis, with advanced models like SVM, logistic regression, and transformers offering significant advantages for single-cell annotation. However, challenges in perfectly separating highly similar cell types indicate opportunities for further refinement. Our findings underscore the importance of selecting robust and sophisticated models for single-cell applications to ensure the reliability and accuracy of cell type annotations.

Author Contributions

Conceptualization, S.A.W. and S.Q.; methodology, S.A.W.; software, S.A.W.; validation, S.A.W., S.Q., M.S.M. and Y.G.; formal analysis, S.A.W., M.S.M. and Y.G.; resources, M.S.M. and Y.G.; data curation, S.A.W.; writing—original draft preparation, S.A.W.; writing—review and editing, S.A.W. and S.Q.; visualization, Y.G.; supervision, S.Q.; project administration, S.A.W., S.Q., M.S.M. and Y.G.; funding acquisition, M.S.M. and Y.G. All authors have read and agreed to the published version of the manuscript.

Funding

This work was supported by the Deanship of Scientific Research, the Vice Presidency for Graduate Studies and Scientific Research, King Faisal University, Saudi Arabia, under the project (KFU250055).

Data Availability Statement

The code used to generate the results presented in this study is available at: https://drive.google.com/drive/folders/1CZTtak88WXkvqTlAsJwdZHGkMkbPze_D?usp=drive_link (accessed on 11 April 2025).

Conflicts of Interest

The authors declare no conflict of interest.

References

  1. Zimmer, C. How Many Cells Are In Your Body? National Geographic Magazine, 23 October 2013. [Google Scholar]
  2. Lücken, M.D.; Burkhardt, D.B.; Cannoodt, R.; Lance, C.; Agrawal, A.; Aliee, H.; Chen, A.T.; Deconinck, L.; Detweiler, A.M.; Granados, A.A.; et al. A sandbox for prediction and integration of DNA, RNA, and protein data in single cells. In Proceedings of the NeurIPS 2021 Track Datasets and Benchmarks, Virtual, 6–14 December 2021. [Google Scholar]
  3. Tang, F.; Barbacioru, C.; Wang, Y.; Nordman, E.; Lee, C.; Xu, N.; Wang, X.; Bodeau, J.; Tuch, B.B.; Siddiqui, A.; et al. mRNA-Seq whole-transcriptome analysis of a single cell. Nat. Methods 2009, 6, 377–382. [Google Scholar] [CrossRef] [PubMed]
  4. Stuart, T.; Butler, A.; Hoffman, P.; Hafemeister, C.; Papalexi, E.; Mauck, W.M., III; Hao, Y.; Stoeckius, M.; Smibert, P.; Satija, R. Comprehensive Integration of Single-Cell Data. Cell 2019, 177, 1888–1902.e21. [Google Scholar] [CrossRef] [PubMed]
  5. Tirosh, I.; Izar, B.; Prakadan, S.M.; Wadsworth, M.H., II; Treacy, D.; Trombetta, J.J.; Rotem, A.; Rodman, C.; Lian, C.; Murphy, G.; et al. Dissecting the multicellular ecosystem of metastatic melanoma by single-cell RNA-seq. Science 2016, 352, 189–196. [Google Scholar] [CrossRef]
  6. Trapnell, C. Defining cell types and states with single-cell genomics. Genome Res. 2015, 25, 1491–1498. [Google Scholar] [CrossRef]
  7. Grün, D.; Lyubimova, A.; Kester, L.; Wiebrands, K.; Basak, O.; Sasaki, N.; Clevers, H.; van Oudenaarden, A. Single-cell messenger RNA sequencing reveals rare intestinal cell types. Nature 2015, 525, 251–255. [Google Scholar] [CrossRef] [PubMed]
  8. Rizvi, A.H.; Camara, P.G.; Kandror, E.K.; Roberts, T.J.; Schieren, I.; Maniatis, T.; Rabadan, R. Single-cell topological RNA-seq analysis reveals insights into cellular differentiation and development. Nat. Biotechnol. 2017, 35, 551–560. [Google Scholar] [CrossRef]
  9. Kumar, P.; Tan, Y.; Cahan, P. Understanding development and stem cells using single cell-based analyses of gene expression. Development 2017, 144, 17–32. [Google Scholar] [CrossRef]
  10. Lyu, P.; Zhai, Y.; Li, T.; Qian, J. CellAnn: A comprehensive, super-fast, and user-friendly single-cell annotation web server. Bioinformatics 2023, 39, btad521. [Google Scholar] [CrossRef]
  11. Clarke, Z.A.; Andrews, T.S.; Atif, J.; Pouyabahar, D.; Innes, B.T.; MacParland, S.A.; Bader, G.D. Tutorial: Guidelines for annotating single-cell transcriptomic maps using automated and manual methods. Nat. Protoc. 2021, 16, 2749–2764. [Google Scholar] [CrossRef]
  12. Yang, F.; Wang, W.; Wang, F.; Fang, Y.; Tang, D.; Huang, J.; Lu, H.; Yao, J. scBERT as a large-scale pretrained deep language model for cell type annotation of single-cell RNA-seq data. Nat. Mach. Intell. 2022, 4, 852–866. [Google Scholar] [CrossRef]
  13. Cheng, C.; Chen, W.; Jin, H.; Chen, X. A Review of Single-Cell RNA-Seq Annotation, Integration, and Cell–Cell Communication. Cells 2023, 12, 1970. [Google Scholar] [CrossRef]
  14. Papalexi, E.; Satija, R. Single-cell RNA sequencing to explore immune cell heterogeneity. Nat. Rev. Immunol. 2018, 18, 35–45. [Google Scholar] [CrossRef]
  15. Zhang, X.; Lan, Y.; Xu, J.; Quan, F.; Zhao, E.; Deng, C.; Luo, T.; Xu, L.; Liao, G.; Yan, M.; et al. CellMarker: A manually curated resource of cell markers in human and mouse. Nucleic Acids Res. 2019, 47, D721–D728. [Google Scholar] [CrossRef] [PubMed]
  16. Franzén, O.; Gan, L.M.; Björkegren, J.L.M. PanglaoDB: A web server for exploration of mouse and human single-cell RNA sequencing data. Database 2019, 2019, baz046. [Google Scholar] [CrossRef] [PubMed]
  17. Yuan, H.; Yan, M.; Zhang, G.; Liu, W.; Deng, C.; Liao, G.; Xu, L.; Luo, T.; Yan, H.; Long, Z.; et al. CancerSEA: A cancer single-cell state atlas. Nucleic Acids Res. 2019, 47, D900–D908. [Google Scholar] [CrossRef] [PubMed]
  18. Shao, X.; Liao, J.; Lu, X.; Xue, R.; Ai, N.; Fan, X. scCATCH: Automatic Annotation on Cell Types of Clusters from Single-Cell RNA Sequencing Data. iScience 2020, 23, 100882. [Google Scholar] [CrossRef]
  19. Cao, Y.; Wang, X.; Peng, G. SCSA: A cell type annotation tool for single-cell RNA-seq data. Front. Genet. 2020, 11, 490. [Google Scholar] [CrossRef]
  20. Zhang, A.W.; O’flanagan, C.; Chavez, E.A.; Lim, J.L.P.; Ceglia, N.; McPherson, A.; Wiens, M.; Walters, P.; Chan, T.; Hewitson, B.; et al. Probabilistic cell-type assignment of single-cell RNA-seq for tumor microenvironment profiling. Nat. Methods 2019, 16, 1007–1015. [Google Scholar] [CrossRef]
  21. Zhang, Z.; Luo, D.; Zhong, X.; Choi, J.H.; Ma, Y.; Wang, S.; Mahrt, E.; Guo, W.; Stawiski, E.W.; Modrusan, Z.; et al. SCINA: A Semi-Supervised Subtyping Algorithm of Single Cells and Bulk Samples. Genes 2019, 10, 531. [Google Scholar] [CrossRef]
  22. Ge, S.; Wang, H.; Alavi, A.; Xing, E.; Bar-Joseph, Z. Supervised Adversarial Alignment of Single-Cell RNA-seq Data. J. Comput. Biol. 2021, 28, 501–513. [Google Scholar] [CrossRef]
  23. Xie, P.; Gao, M.; Wang, C.; Zhang, J.; Noel, P.; Yang, C.; Von Hoff, D.; Han, H.; Zhang, M.Q.; Lin, W. SuperCT: A supervised-learning framework for enhanced characterization of single-cell transcriptomic profiles. Nucleic Acids Res. 2019, 47, e48. [Google Scholar] [CrossRef]
  24. Butler, A.; Hoffman, P.; Smibert, P.; Papalexi, E.; Satija, R. Integrating single-cell transcriptomic data across different conditions, technologies, and species. Nat. Biotechnol. 2018, 36, 411–420. [Google Scholar] [CrossRef]
  25. Haghverdi, L.; Lun, A.T.L.; Morgan, M.D.; Marioni, J.C. Batch effects in single-cell RNA-sequencing data are corrected by matching mutual nearest neighbors. Nat. Biotechnol. 2018, 36, 421–427. [Google Scholar] [CrossRef]
  26. Ji, X.; Tsao, D.; Bai, K.; Tsao, M.; Xing, L.; Zhang, X. scAnnotate: An automated cell-type annotation tool for single-cell RNA-sequencing data. Bioinform. Adv. 2023, 3, vbad030. [Google Scholar] [CrossRef]
  27. Lin, Y.; Cao, Y.; Kim, H.J.; Salim, A.; Speed, T.P.; Lin, D.M.; Yang, P.; Yang, J.Y.H. scClassify: Sample size estimation and multiscale classification of cells using single and multiple reference. Mol. Syst. Biol. 2020, 16, e9389. [Google Scholar] [CrossRef]
  28. Tan, Y.; Cahan, P. SingleCellNet: A Computational Tool to Classify Single Cell RNA-Seq Data Across Platforms and Across Species. Cell Syst. 2019, 9, 207–213.e2. [Google Scholar] [CrossRef]
  29. Wagner, F.; Yanai, I. Moana: A robust and scalable cell type classification framework for single-cell RNA-Seq data. BioRxiv 2018. [Google Scholar] [CrossRef]
  30. Johnson, T.S.; Wang, T.; Huang, Z.; Yu, C.Y.; Wu, Y.; Han, Y.; Zhang, Y.; Huang, K.; Zhang, J. LAmbDA: Label ambiguous domain adaptation dataset integration reduces batch effects and improves subtype detection. Bioinformatics 2019, 35, 4696–4706. [Google Scholar] [CrossRef]
  31. LeCun, Y.; Bengio, Y. Convolutional networks for images, speech, and time series. In The Handbook of Brain Theory and Neural Networks; MIT Press: Cambridge, UK, 1995; Volume 3361. [Google Scholar]
  32. Khan, F.; Ayoub, S.; Gulzar, Y.; Majid, M.; Reegu, F.A.; Mir, M.S.; Soomro, A.B.; Elwasila, O. MRI-Based Effective Ensemble Frameworks for Predicting Human Brain Tumor. J. Imaging 2023, 9, 163. [Google Scholar] [CrossRef]
  33. Bao, S.; Li, K.; Yan, C.; Zhang, Z.; Qu, J.; Zhou, M. Deep learning-based advances and applications for single-cell RNA-sequencing data analysis. Brief. Bioinform. 2022, 23, bbab473. [Google Scholar] [CrossRef]
  34. Wani, S.A.; Khan, S.A.; Quadri, S.M.K. scJVAE: A novel method for integrative analysis of multimodal single-cell data. Comput. Biol. Med. 2023, 158, 106865. [Google Scholar] [CrossRef]
  35. Wani, S.A.; Quadri, S.M.K. Evaluation of Computational Methods for Single Cell Multi-Omics Integration. Procedia Comput. Sci. 2022, 218, 2744–2754. [Google Scholar] [CrossRef]
  36. Majid, M.; Gulzar, Y.; Ayoub, S.; Khan, F.; Reegu, F.A.; Mir, M.S.; Jaziri, W.; Soomro, A.B. Enhanced Transfer Learning Strategies for Effective Kidney Tumor Classification with CT Imaging. Int. J. Adv. Comput. Sci. Appl. 2023, 14, 421–432. [Google Scholar] [CrossRef]
  37. Alquicira-Hernandez, J.; Sathe, A.; Ji, H.P.; Nguyen, Q.; Powell, J.E. ScPred: Accurate supervised method for cell-type classification from single-cell RNA-seq data. Genome Biol. 2019, 20, 264. [Google Scholar] [CrossRef]
  38. Shao, X.; Yang, H.; Zhuang, X.; Liao, J.; Yang, P.; Cheng, J.; Lu, X.; Chen, H.; Fan, X. ScDeepSort: A pre-trained cell-type annotation method for single-cell transcriptomics using deep learning with a weighted graph neural network. Nucleic Acids Res. 2021, 49, e122. [Google Scholar] [CrossRef]
  39. Hou, W.; Ji, Z. Assessing GPT-4 for cell type annotation in single-cell RNA-seq analysis. Nat. Methods 2024, 21, 1462–1465. [Google Scholar] [CrossRef]
  40. Cui, H.; Wang, C.; Maan, H.; Pang, K.; Luo, F.; Duan, N.; Wang, B. scGPT: Toward building a foundation model for single-cell multi-omics using generative AI. Nat. Methods 2024, 21, 1470–1480. [Google Scholar] [CrossRef]
  41. Devlin, J.; Chang, M.W.; Lee, K.; Toutanova, K. BERT: Pre-training of deep bidirectional transformers for language understanding. In Proceedings of the NAACL HLT 2019—2019 Conference of the North American Chapter of the Association for Computational Linguistics: Human Language Technologies—Proceedings of the Conference, Minneapolis, MN, USA, 2–7 June 2019. [Google Scholar]
  42. de Kanter, J.K.; Lijnzaad, P.; Candelli, T.; Margaritis, T.; Holstege, F.C.P. CHETAH: A selective, hierarchical cell type identification method for single-cell RNA sequencing. Nucleic Acids Res. 2019, 47, e95. [Google Scholar] [CrossRef]
  43. Cao, X.; Xing, L.; Majd, E.; He, H.; Gu, J.; Zhang, X. A Systematic Evaluation of Supervised Machine Learning Algorithms for Cell Phenotype Classification Using Single-Cell RNA Sequencing Data. Front. Genet. 2022, 13, 836798. [Google Scholar] [CrossRef]
  44. Rokach, L.; Maimon, O. Decision Trees. In Data Mining and Knowledge Discovery Handbook; Springer: Boston, MA, USA, 2006. [Google Scholar] [CrossRef]
  45. Rokach, L. Decision forest: Twenty years of research. Inf. Fusion 2016, 27, 111–125. [Google Scholar] [CrossRef]
  46. Pouyan, M.B.; Kostka, D. Random forest based similarity learning for single cell RNA sequencing data. Bioinformatics 2018, 34, i79–i88. [Google Scholar] [CrossRef]
  47. Majid, M.; Gulzar, Y.; Ayoub, S.; Khan, F.; Reegu, F.A.; Mir, M.S.; Jaziri, W.; Soomro, A.B. Using Ensemble Learning and Advanced Data Mining Techniques to Improve the Diagnosis of Chronic Kidney Disease. Int. J. Adv. Comput. Sci. Appl. 2023, 14, 470–480. [Google Scholar] [CrossRef]
  48. Natekin, A.; Knoll, A. Gradient boosting machines, a tutorial. Front. Neurorobotics 2013, 7, 2. [Google Scholar] [CrossRef]
  49. Ding, S.; Wang, D.; Zhou, X.; Chen, L.; Feng, K.; Xu, X.; Huang, T.; Li, Z.; Cai, Y. Predicting Heart Cell Types by Using Transcriptome Profiles and a Machine Learning Method. Life 2022, 12, 228. [Google Scholar] [CrossRef]
  50. Dann, E.; Henderson, N.C.; Teichmann, S.A.; Morgan, M.D.; Marioni, J.C. Differential abundance testing on single-cell data using k-nearest neighbor graphs. Nat. Biotechnol. 2021, 40, 245–253. [Google Scholar] [CrossRef]
  51. Sun, Z.; Chen, L.; Xin, H.; Jiang, Y.; Huang, Q.; Cillo, A.R.; Tabib, T.; Kolls, J.K.; Bruno, T.C.; Lafyatis, R.; et al. A Bayesian mixture model for clustering droplet-based single-cell transcriptomic data from population studies. Nat. Commun. 2019, 10, 1649. [Google Scholar] [CrossRef]
  52. Khan, F.; Gulzar, Y.; Ayoub, S.; Majid, M.; Mir, M.S.; Soomro, A.B. Least square-support vector machine based brain tumor classification system with multi model texture features. Front. Appl. Math. Stat. 2023, 9, 1324054. [Google Scholar] [CrossRef]
  53. Saygili, G.; OzgodeYigin, B. Continual learning approaches for single cell RNA sequencing data. Sci. Rep. 2023, 13, 15286. [Google Scholar] [CrossRef]
  54. Hosmer, D.W.; Lemeshow, S.; Sturdivant, R.X.; Regression, A.L. Applied Logistic Regression; John Wiley & Sons: Hoboken, NJ, USA, 2013. [Google Scholar] [CrossRef]
  55. Vaswani, A.; Shazeer, N.; Parmar, N.; Uszkoreit, J.; Jones, L.; Gomez, A.N.; Kaiser, Ł.; Polosukhin, I. Attention is all you need. In Proceedings of the 31st Conference on Neural Information Processing Systems (NIPS 2017), Long Beach, CA, USA, 4–9 December 2017. [Google Scholar]
  56. 10X Genomics. PBMC-Multiome. [Online]. Available online: https://www.10xgenomics.com/resources/datasets/pbmc-from-a-healthy-donor-granulocytes-removed-through-cell-sorting-10-k-1-standard-1-0-0 (accessed on 12 December 2022).
  57. Schirmer, L.; Velmeshev, D.; Holmqvist, S.; Kaufmann, M.; Werneburg, S.; Jung, D.; Vistnes, S.; Stockley, J.H.; Young, A.; Steindel, M.; et al. Neuronal vulnerability and multilineage diversity in multiple sclerosis. Nature 2019, 573, 75–82. [Google Scholar] [CrossRef]
  58. Zheng, G.X.Y.; Terry, J.M.; Belgrader, P.; Ryvkin, P.; Bent, Z.W.; Wilson, R.; Ziraldo, S.B.; Wheeler, T.D.; McDermott, G.P.; Zhu, J.; et al. Massively parallel digital transcriptional profiling of single cells. Nat. Commun. 2017, 8, 14049. [Google Scholar] [CrossRef]
Figure 1. Single-cell annotation pipeline illustrates the steps involved in annotating cell types. (a) Cell isolation and count matrix generation involves isolating individual cells and creating a cell-by-gene count matrix; (b) pre-processing techniques highlight the crucial pre-processing steps applied to the raw count matrix, including quality control, normalization feature identification, and batch correction; (c) downstream analysis for cell annotation involves clustering cells, identifying marker genes, and assigning cell type labels using known markers or reference datasets.
Algorithms 18 00232 g001
Figure 2. Cell annotation UMAP plots by various models for PBMC dataset.
Algorithms 18 00232 g002
Figure 3. Confusion matrices for cell annotation of models for PBMC dataset.
Algorithms 18 00232 g003
Figure 4. Cell annotation UMAP plots by various models for multiple sclerosis dataset.
Algorithms 18 00232 g004
Figure 5. Confusion matrices for cell annotation of models for multiple sclerosis dataset.
Algorithms 18 00232 g005
Figure 6. Cell annotation UMAP plots by various models for Zhengh68K dataset.
Algorithms 18 00232 g006
Figure 7. Confusion matrix for cell annotation of models for Zhengh68K dataset.
Algorithms 18 00232 g007
Figure 8. Cell annotation UMAP plots by various models for pancreatic dataset.
Algorithms 18 00232 g008
Figure 9. Confusion matrices for cell annotation of models for pancreatic dataset.
Algorithms 18 00232 g009
Table 1. Hyper-parameter description for ML techniques.
ModelKey Hyper-ParametersTraining Configuration
Decision TreeCriterion: gini,
Max Depth: None,
Min Samples Split: 2,
80% train data, pruning via max depth
Random ForestEstimators: 100,
Max Features: sqrt,
Max Depth: Tuned,
Bootstrap: True
80% train data, majority voting
Gradient Boosting (XGBoost)Estimators: 300,
Learning Rate: 0.1,
Max Depth: 3,
Early Stopping
Gradient descent to minimize log loss, early stopping
Support Vector Machine (SVM)Kernel: RBF,
Regularization (C): 1,
Tolerance: 1 × 10⁻³
Linear kernel, normalized input
Logistic RegressionRegularization: L2,
Max Iterations: 500,
Multi-Class: Multinomial
Normalized input, convergence with cross-validation
K-Nearest Neighbours (KNN)Neighbours (k): 5,
Distance Metric: Euclidean, Weighting: distance-based
Distance calculations for all data points
Naive BayesDistribution: Gaussian,
Variance Smoothing: 1 × 10⁻⁹
Log-transformed input for comparability
TransformerEmbedding Dimension: 512,
Encoder Layers: 6,
Attention Heads: 8,
Dropout: 0.1, Optimizer: Adam,
Learning Rate: 0.0001
Cross-entropy loss, trained for 10 epochs
Table 2. Accuracy and F1-score of models for various dataset.
ModelPBMC DatasetMS DatasetZhengh68KPancreatic Dataset
AccuracyF1-ScoreAccuracyF1-ScoreAccuracyF1-ScoreAccuracyF1-Score
Decision Tree0.87120.87300.70380.53390.69580.69460.98340.9846
Random Forest0.87880.86860.75760.73730.73170.71770.98100.9803
Gradient Boosting0.92990.92890.85120.84190.77900.77290.99410.9969
KNN0.51520.40200.44580.43970.59590.57640.99210.9958
Naive Bayes0.50190.51170.52450.53390.26130.24410.85780.8456
SVM0.95830.95730.88230.87740.84760.84720.99530.9976
Logistic Regression0.95270.95150.88010.87440.84400.84150.99210.9934
Transformer0.93370.92990.86600.86100.83540.83300.99430.9958
Disclaimer/Publisher’s Note: The statements, opinions and data contained in all publications are solely those of the individual author(s) and contributor(s) and not of MDPI and/or the editor(s). MDPI and/or the editor(s) disclaim responsibility for any injury to people or property resulting from any ideas, methods, instructions or products referred to in the content.

