1. Introduction
Fetal heart rate (FHR) and uterine contractions were continuously traced with a cardiotocogram (CTG), and the recorded chart was visually classified into various patterns; then, abnormal FHR patterns were individually assessed in each case, where the diagnosis was subjective and enlarged inter-observer difference, and therefore various problems developed in the CTG diagnosis. In addition, visual FHR pattern diagnosis was unable to apply computerized diagnosis because of no logical criteria, e.g., no lag time of late deceleration was reported by Hon [
1]. Later, Chik
et al. [
2] estimated it to be 20 or more seconds. Therefore, FHR diagnosis was computerized to quantitatively analyze FHR changes in an experts’ knowledge system, artificial neural network analysis, and FHR frequency spectrum analysis [
3,
4,
5,
6,
7]. Meanwhile, our recent studies on fetal movements with actocardiogram (ACG) [
8] solved several CTG problems, e.g., a physiologic sinusoidal FHR was unable to differentiate a fatal pathologic sinusoidal condition with CTG, while they were separated when a physiologic sinusoidal condition was developed by fetal periodic respiratory or mouthing movements in the ACG [
9]. Artificial birth was recommended before the loss of variability, because FHR variability is the response of the fetal brain to minor fetal movements, and its loss will mean fetal brain damage preceding cerebral palsy [
10,
11,
12].
Maeda
et al. reported computerized FHR diagnosis using a minicomputer in 1980, on the FHR analysis and FHR score calculation with quantified FHR data, challenging the objective FHR diagnosis [
3,
4], and furthermore reported artificial neural network computer diagnosis of FHR in 1998, calculating probabilities to be normal, suspicious and pathologic to the outcome of the fetus [
5]. Pathologic ominous sinusoidal FHR was diagnosed using an actocardiogram [
9] and also by the computer using frequency spectral analysis [
6]. The loss of FHR variability was detected with the experts’ knowledge system [
3,
4] and the frequency spectoral computer system [
7]. Chudáček
et al. analyzed FHR using the computer in fetal heart rate fractal analysis in 2004 [
13], Dawes
et al. studied FHR changes and its variability in pregnancy and labor [
14], Georgieva
et al. studied FHR in labor in 2011 [
15], Jezewski
et al. analyzed FHR using the neural network approach in 2007 [
16], and Signorini
et al. studied FHR using signal processing and wearable technology in 2014 [
17].
FHR monitoring was confused by subjective FHR pattern diagnosis in the past and solved by quantitative studies as follows.
1.1. Bradycardia
There was severe fetal bradycardia in a fetal cardiac sick sinus case, where reactive acceleration was present against fetal movements, and the A/B ratio was high in the ACG, resulting in a healthy neonate without asphyxia [
18]. Since the acceleration was responsive to excitation of the healthy fetal brain to fetal movement, this demonstrated healthy fetal state. As the bradycardia has a positive response to low PaO
2, there is no sign of hypoxic fetal brain damage.
1.2. Transient FHR Decrease (Deceleration)
1.2.1. Variable Deceleration
Mild to variable deceleration was the vagal reflex to umbilical cord compression, but not transient hypoxia, while a severely variable condition was hypoxia in the past, namely, a variable deceleration was thought to be vagal reflex and another was hypoxia in the past. The author estimated the nadir FHR to be at PaO2 level at present.
1.3. Transient FHR Increase (Acceleration)
Its disappearance from fetal movement (non-reactive FHR) was the first FHR sign in fetal hypoxia,
i.e., hypoxia suppresses mid-brain function, which develops acceleration by the stimulation of fetal movement burst, while baseline variability is preserved until severely advanced hypoxia [
12].
1.4. The Loss of FHR Variability
FHR baseline variability will develop as the response of the mid-brain to minor fetal movements, and finally disappeared in the severe hypoxia possibly due to fetal brain damage. It is recommended, therefore, to perform rapid delivery before the loss of variability to reduce cerebral palsy, instead of cesarean section after the loss of variability [
10,
11,
12]. As decreased variability, the loss of acceleration, severe NRFS, and a high hypoxia index would precede the loss of variability, rapid delivery should be performed according the appearance of these signs.
1.5. Sinusoidal FHR
Although true fatal pathologic sinusoidal FHR and a benign favorable physiologic sinusoidal condition should be differentiated, the two sinusoidal conditions could not be differentiated with CTG. Fortunately, periodic fetal movements in fetal periodic respiration or mouth movements developed physiologic sinusoidal (
Figure 1) [
9], but no fetal movement was associated to the pathologic one in ACG. Thus, two sinusoidal FHR cases were collected to find the difference of frequency spectrum between two sinusoidal HR only using fetal heart rate, then they were quantitatively diagnosed with computer in clinical automatic FHR diagnosis in the present paper [
6].
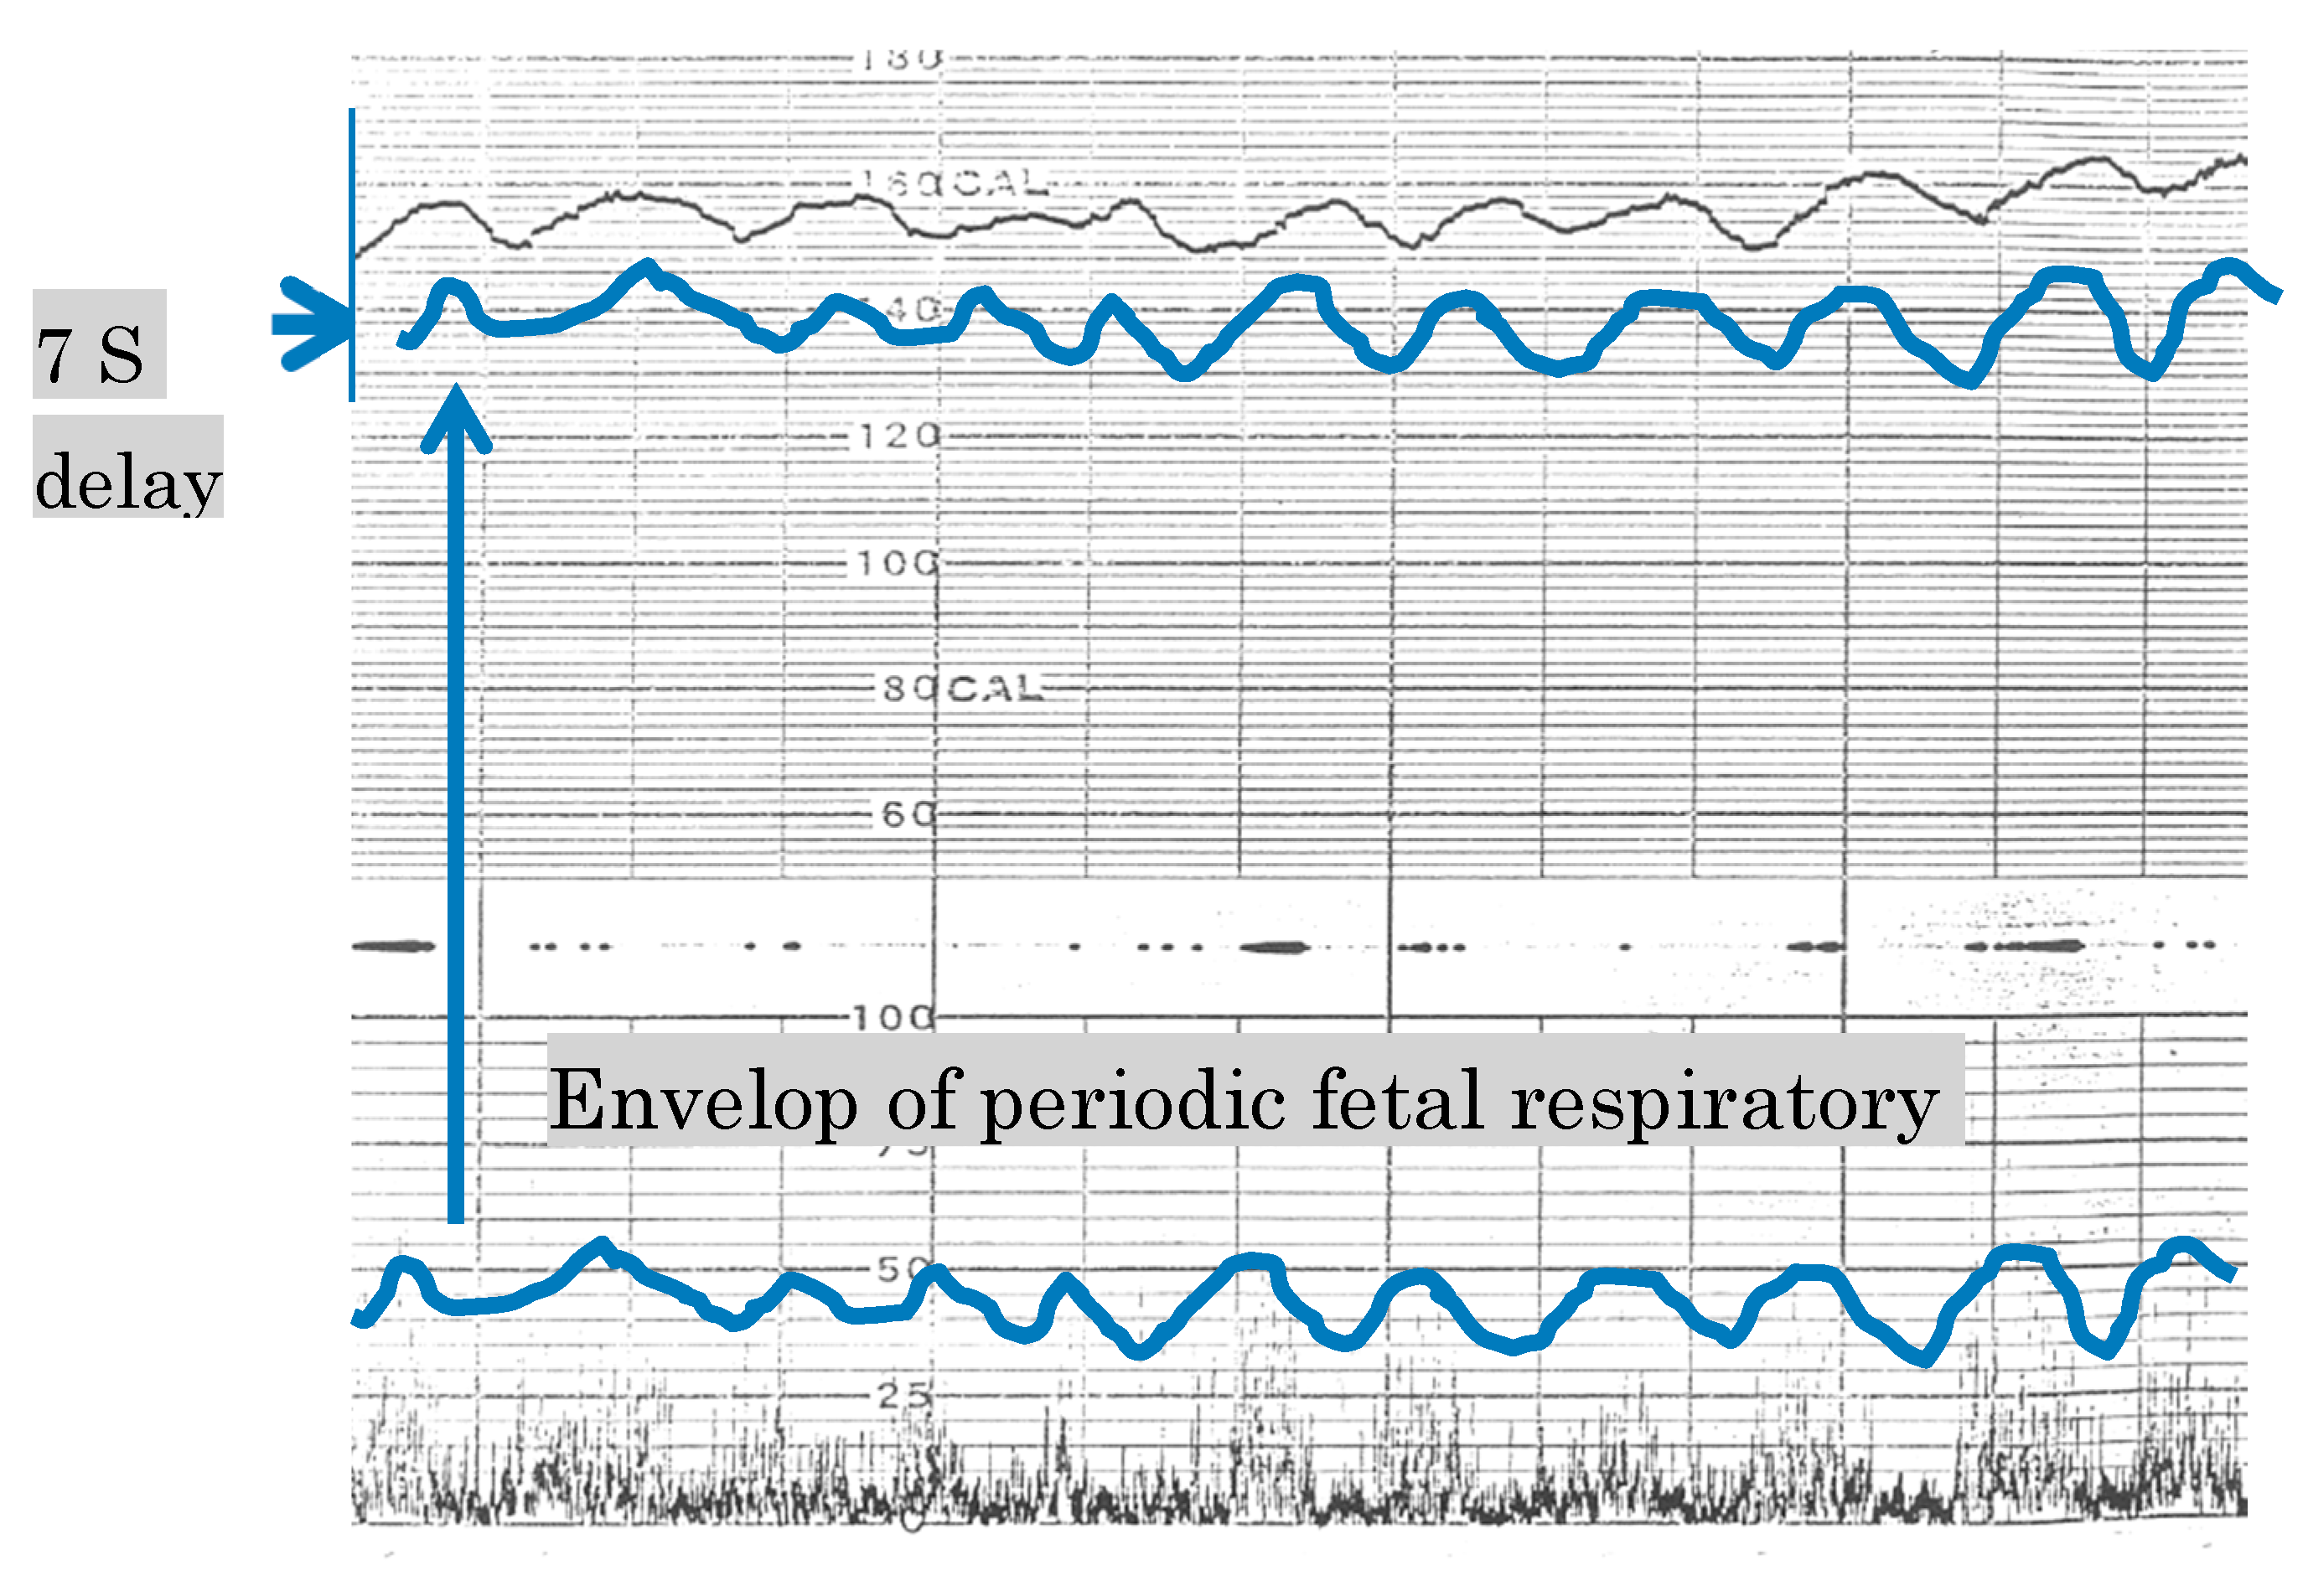
Figure 1.
The most upper line is a benign physiologic sinusoidal fetal heart rate (FHR), which synchronizes to the envelope of periodic fetal respiratory movements of the second and third lines recorded by actocardiogram (ACG). Since the outcome of physiologic sinusoidal FHR was favorable, it should be separated from pathologic fatal sinusoidal FHR; however, it was unable to be analyzed by CTG, while it was able as above using the ACG [
9], where FHR change was parallel to the height of fetal movement spikes. Since frequency spectrum of both sinusoidal FHR diagnosed by ACG were characteristic, pathologic sinusoidal FHR was diagnosed using the frequency spectrum in computer analysis. Outcome probability was 100% pathologic after input of the presence of pathologic sinusoidal FHR into educated neural network computer.
2. Methods
Personal data of the patient and the phone number of attending doctor were registered at the top of the FHR along with contraction data, which were transferred to the computer center through a telemetry or local area network (LAN). The computer input was composed of an 100 channels time sharing system to handle the data of multiple births. After A to D conversion every 5 min, 150 data items were continuously obtained in FHR and contraction. Actocardiogram data will be handled in the future. Original data was saved in a large external memory to be reproduced on demand.
3. Experts’ Knowledge System
Computer processing was started from the calculation of baseline FHR, FHR accelerations, FHR decelerations, FHR variability, and differentiation of late/early and variable decelerations. An objective FHR score was determined using values of FHR deceleration elements, baseline FHR, and acceleration [
4]. Our FHR analyzing algorithms were composed of FHR curve analysis and FHR score calculation. Fetal outcome probability was estimated by the neural network system using FHR parameters, diagnosis of pathologic sinusoidal FHR and the loss of FHR variability. No CTG chart was traced but original signals are saved in a large memory and the CTG chart is output as the computer hard copy on demand. Summary of the fetal monitoring was saved in the computer memory and patient record, as well as sent to the attending doctor or any responsible department.
3.1. Detection of FHR Baseline
FHR and contraction curves were sampled four times per 1 s and averaged at 2 s, constructing two data groups of each 150 data in 5 min. The number of FHR data was counted every 20 bpm steps, and the average of FHR data in the step of maximal number of FHR data was determined as the baseline FHR in 5 min. Acceleration was determined, if its amplitude was 15 or more bpm and the duration was 15 or more sec above the upper reference line, which was the sum of baseline FHR and half mean FHR variation. Deceleration (dip) was determined if the FHR decreased more than 15 bpm than the lower reference line and longer than 15 s. The number of accelerations and decelerations were counted in 5 min.
3.2. Late and Variable Decelerations
It was determined to be late deceleration if the DIP SHAPE value (dip area / [the dip duration × dip amplitude]) was <0.5, where the lag time between FHR nadir and contraction peak was >20 s, and the sum of each FHR data difference (dip variability) <60 bpm, and the dip number was >contraction number-1 in 15 min. A variable deceleration was determined, if the DIP SHAPE was >0.6, and dip variability >60 bpm in a dip [
3].
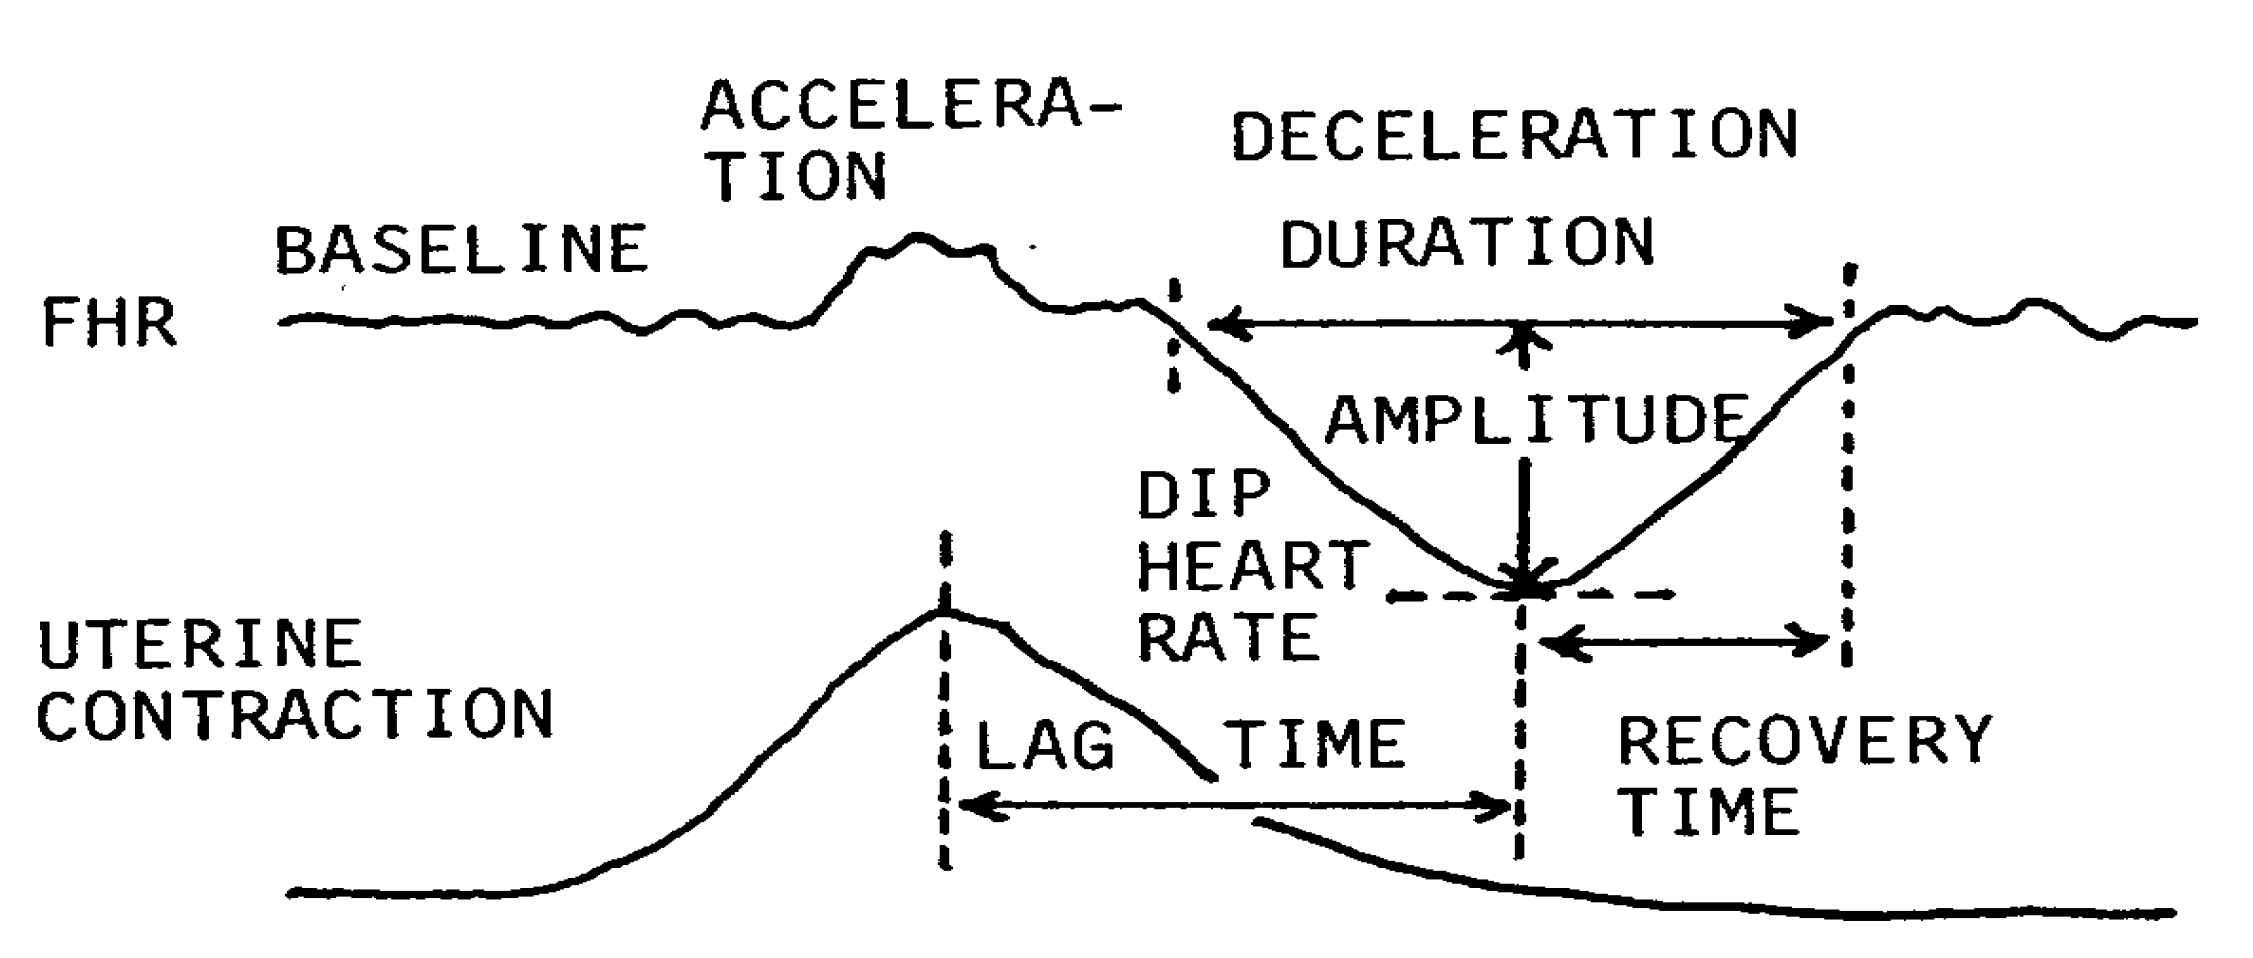
3.3. FHR Score
Baseline FHR and decelerations were quantitatively analyzed in 5 min, and the following data were utilized to calculate the FHR score: baseline FHR (bpm), dip duration (min), dip amplitude (bpm), nadir FHR (bpm), recovery time (sec) to return baseline, lag time (bpm), and the presence of acceleration. The work looks complicated in visual analysis, but it was easy in computer analysis (
Figure 2) [
3].
Figure 2.
Quantified analysis of FHR changes for computerized experts’ knowledge system [
3]. Each deceleration was analyzed if there were multiple decelerations in 5 min, where sum of the scores of all decelerations were the FHR score in 5 min. The items of above analysis was evaluated by the evaluation score determined by the percentage of low Apgar score lower than 7,
i.e., it was four points when low Apgar appeared in 100% of that FHR change, three points if low Apgar was 70%, two points for 40% and one point for 20% (
Table 1). A statistician allowed the evaluation as a goodness score. The sum of evaluation scores in 5 min was the FHR score.
Fetal state was abnormal if the FHR score was 10–19, and highly abnormal if the score was 20 or more. The FHR score was comprehensive evaluation of fetal status [
11].
Table 1.
Evaluation scores to be given each FHR abnormalities [
4].
Table 1.
Evaluation scores to be given each FHR abnormalities [4].
| FHR Abnormality | Apgar <7 (%) | Evaluation Score |
|---|
| Baseline FHR 160-180 or 130-110 | 28 | 1 |
| >180 or <110 | 71 | 3 |
| Deceleration duration > 60 s | 71 | 3 |
| nadir heart rate < 100 bpm | 37 | 2 |
| amplitude > 50 bpm | 50 | 2 |
| lag time > 40 s | 71 | 3 |
| recovery time > 40 s | 63 | 3 |
| no acceleration | 45 | 2 |
| W-shape without variability | 100 | 4 |
The FHR score in the first stage of labor (X) correlated to 1 min Apgar score (Y) and umbilical arterial blood pH (Z). Regression equations were;
As expected Apgar score = 4 (severe asphyxia) and pH = 7.16, if FHR score was 15 according to regression equations, rapid delivery will be indicated to avoid fetal or neonatal compromise if the FHR score was high [
4].
The down-hill amplitudes (bpm) of each long term variability were measured and averaged. The averaged variability <5 bpm was reported as “reduced variability”, and <1 bpm was “loss of variability”. Frequency spectrum analysis also detected the loss of variability [
7].
4. Artificial Neural Network Analysis
Since artificial neural network analysis was more objective than the experts’ knowledge system, it was added to our computerized FHR diagnosis to confirm the results obtained using the FHR score in the experts’ knowledge system.
The network software of Noguchi, composed of 40 units in the input layer, 30 units in the intermediate layer, three units in the output layer and a back-propagation system, was trained with eight FHR data including baseline FHR, the presence of sinusoidal FHR [
3,
7], variability amplitude, number of decelerations, its duration, nadir heart rate, recovery time to baseline, lag time from contraction peak, and fetal outcome (normal = 1, suspicious = 2, pathologic = 3), for 10,000 times until the output outcome was correct in the internal check. Eight FHR data were utilized to economize the time of computer diagnosis instead to use total FHR data. Educated software was installed in the diagnostic computer, where eight new FHR data of parturient women were input into the trained network for the diagnosis. The neural computer output was the percentage of fetal outcome probability to be normal, suspicious and pathologic. The results were compared to the FHR score, where both results were coincided [
5]. New cases of known outcome were analyzed with the network system, where the clinical outcome of the fetuses coincided to the output of neural computer [
5].
5. Frequency Spectrum Analysis of FHR
5.1. Materials and Methods
Although physiologic sinusoidal FHR was separated from pathologic one by the synchronization of periodically changing fetal movements in actocardiogram [
9], frequency spectrum of FHR trace was studied in the present report, instead of the use of actocardiogram, because only FHR data was handled in our computer diagnosis [
6].
Nine cases of pathologic sinusoidal FHR were diagnosed by clinical conditions and ACG, including an anemic Rh-incompatibility, 3 feto-maternal transfusions, an anemic Parbo B-19 infection and 4 NRFS, which were used as pathologic sinusoidal cases, and 12 control cases where 7 were clinically benign by ACG confirmed physiologic sinusoidal FHR and 5 normal FHR. Both groups were compared using the frequency spectrum parameters [
6].
5.2. Results and Conclusion of Sinusoidal FHR Diagnosis
The ratio of the area under 0.03125 to 0.1 Hz, which was common low frequency area in the heart rate frequency spectrum analysis, to the area under total spectrum (La/Ta) of pathologic sinusoidal FHR was >39% and also the peak power spectrum density (PPSD) was >300 bpm2/Hz, while the two parameters showed lower values in the control cases.
Thus, it was concluded that it was pathologic sinusoidal FHR, when both La/Ta > 39% and PPSD >300 bpm
2/Hz, and it was physiologic pseudo-sinusoidal FHR, when one or both parameter values were lower than the above values [
6].
5.3. The Loss of Variability
The experts’ system computer diagnosed the loss of long term variability when the mean amplitude of LTV was <1 bpm. In addition, the loss of variability was diagnosed, if the La/Ta ratio < 15% and PPSD < 60 bpm
2/Hz, in the frequency spectrum analysis of FHR baseline [
7].
Since FHR variability developed by the response of fetal brain to minor fetal movements, the loss of FHR variability could be the sign of general damage of fetal brain. Thus, it would be recommended to perform rapid delivery, such as a cesarean section, before the loss of variability to reduce cerebral palsy [
10,
11,
12], instead of cesarean section after the loss of variability. It was important, therefore, to alarm the states before the loss of variability, which would be reduced variability <5 bpm, severe bradycardia, severe late decelerations lasting >15 min, repeated severe variable decelerations, prolonged deceleration >2 min, loss of acceleration, high hypoxia index (sum of <110 bpm bradycardia duration (min) × 100/nadir bradycardia) tentatively as 20–24 [
12].
There will be institutions, which performed cesarean section by the signs before the loss of variability listed here with the purpose to improve perinatal state, and experienced the reduction of CP. That was natural according to the theory in the present report.
6. Central Computerized Automatic Fetal Monitoring System (TOITU Central Station Monitor MF-7400A20W) (Tokyo) [19]
6.2. Computer Processing
The central computer program was composed of an experts’ knowledge system to determine the FHR score and detect FHR elements, and an artificial neural network system to output outcome probabilities to be normal, suspicious and pathologic. FHR frequency spectrum analysis reported the diagnosis of pathologic sinusoidal FHR and the loss of variability.
6.3. Direct Report to Attending Doctor
Pathologic results obtained by the computer system were immediately and directly reported to the attending doctor, responsible departments and on the electronic patient record, to perform various treatments for the prevention of fetal compromise, by cellular phone, PC or similar mobile data terminal using registered address at the input of fetal data. The contents of direct information are listed in
Table 2.
Table 2.
Direct information items of fetal abnormalities to attending doctor.
Table 2.
Direct information items of fetal abnormalities to attending doctor.
| Bradycardia < 110, tachycardia > 180 (bpm) #, |
| Reduced FHR variability < 5 bpm # |
| The loss of variability # |
| Pathologic sinusoidal FHR # |
| Loss of acceleration |
| Severe variable deceleration # |
| Prolonged deceleration>2 min # |
| Late decelerations > 15 min # |
| FHR score >10 # |
| Pathologic outcome probability >30% # |
| A/B ratio (sum of acceleration duration ratio/fetal movement burst duration) < 1.0 * |
6.4. Clinical Improvements by the Use of Centralized Computer System
Perinatal mortality was significantly reduced compared to the previous computer system without a rapid and direct reporting system, and no cerebral palsy developed, using the central fetal monitoring computer system of the present report, at Seirei Mikatahara hospital (
Table 3) [
19]. Computerized FHR monitoring was useful not only for the convenience of attending doctor but also for the objective and rapid detection of fetal abnormality, to prevent fetal demise and cerebral palsy caused by fetal brain damage in the pregnancy and labor.
Table 3.
Improved clinical results compared to the previous computer system [
18].
Table 3.
Improved clinical results compared to the previous computer system [18].
| | 1996–2009
Previous central system | 2009–2011
Present system with direct alarm |
|---|
| Number of births | 10,346 | 1767 |
| Perinatal mortality* | 5.5 - significant reduction - 1.1 |
| Cerebral palsy rate in 1000 births | 1.0** | 0 |
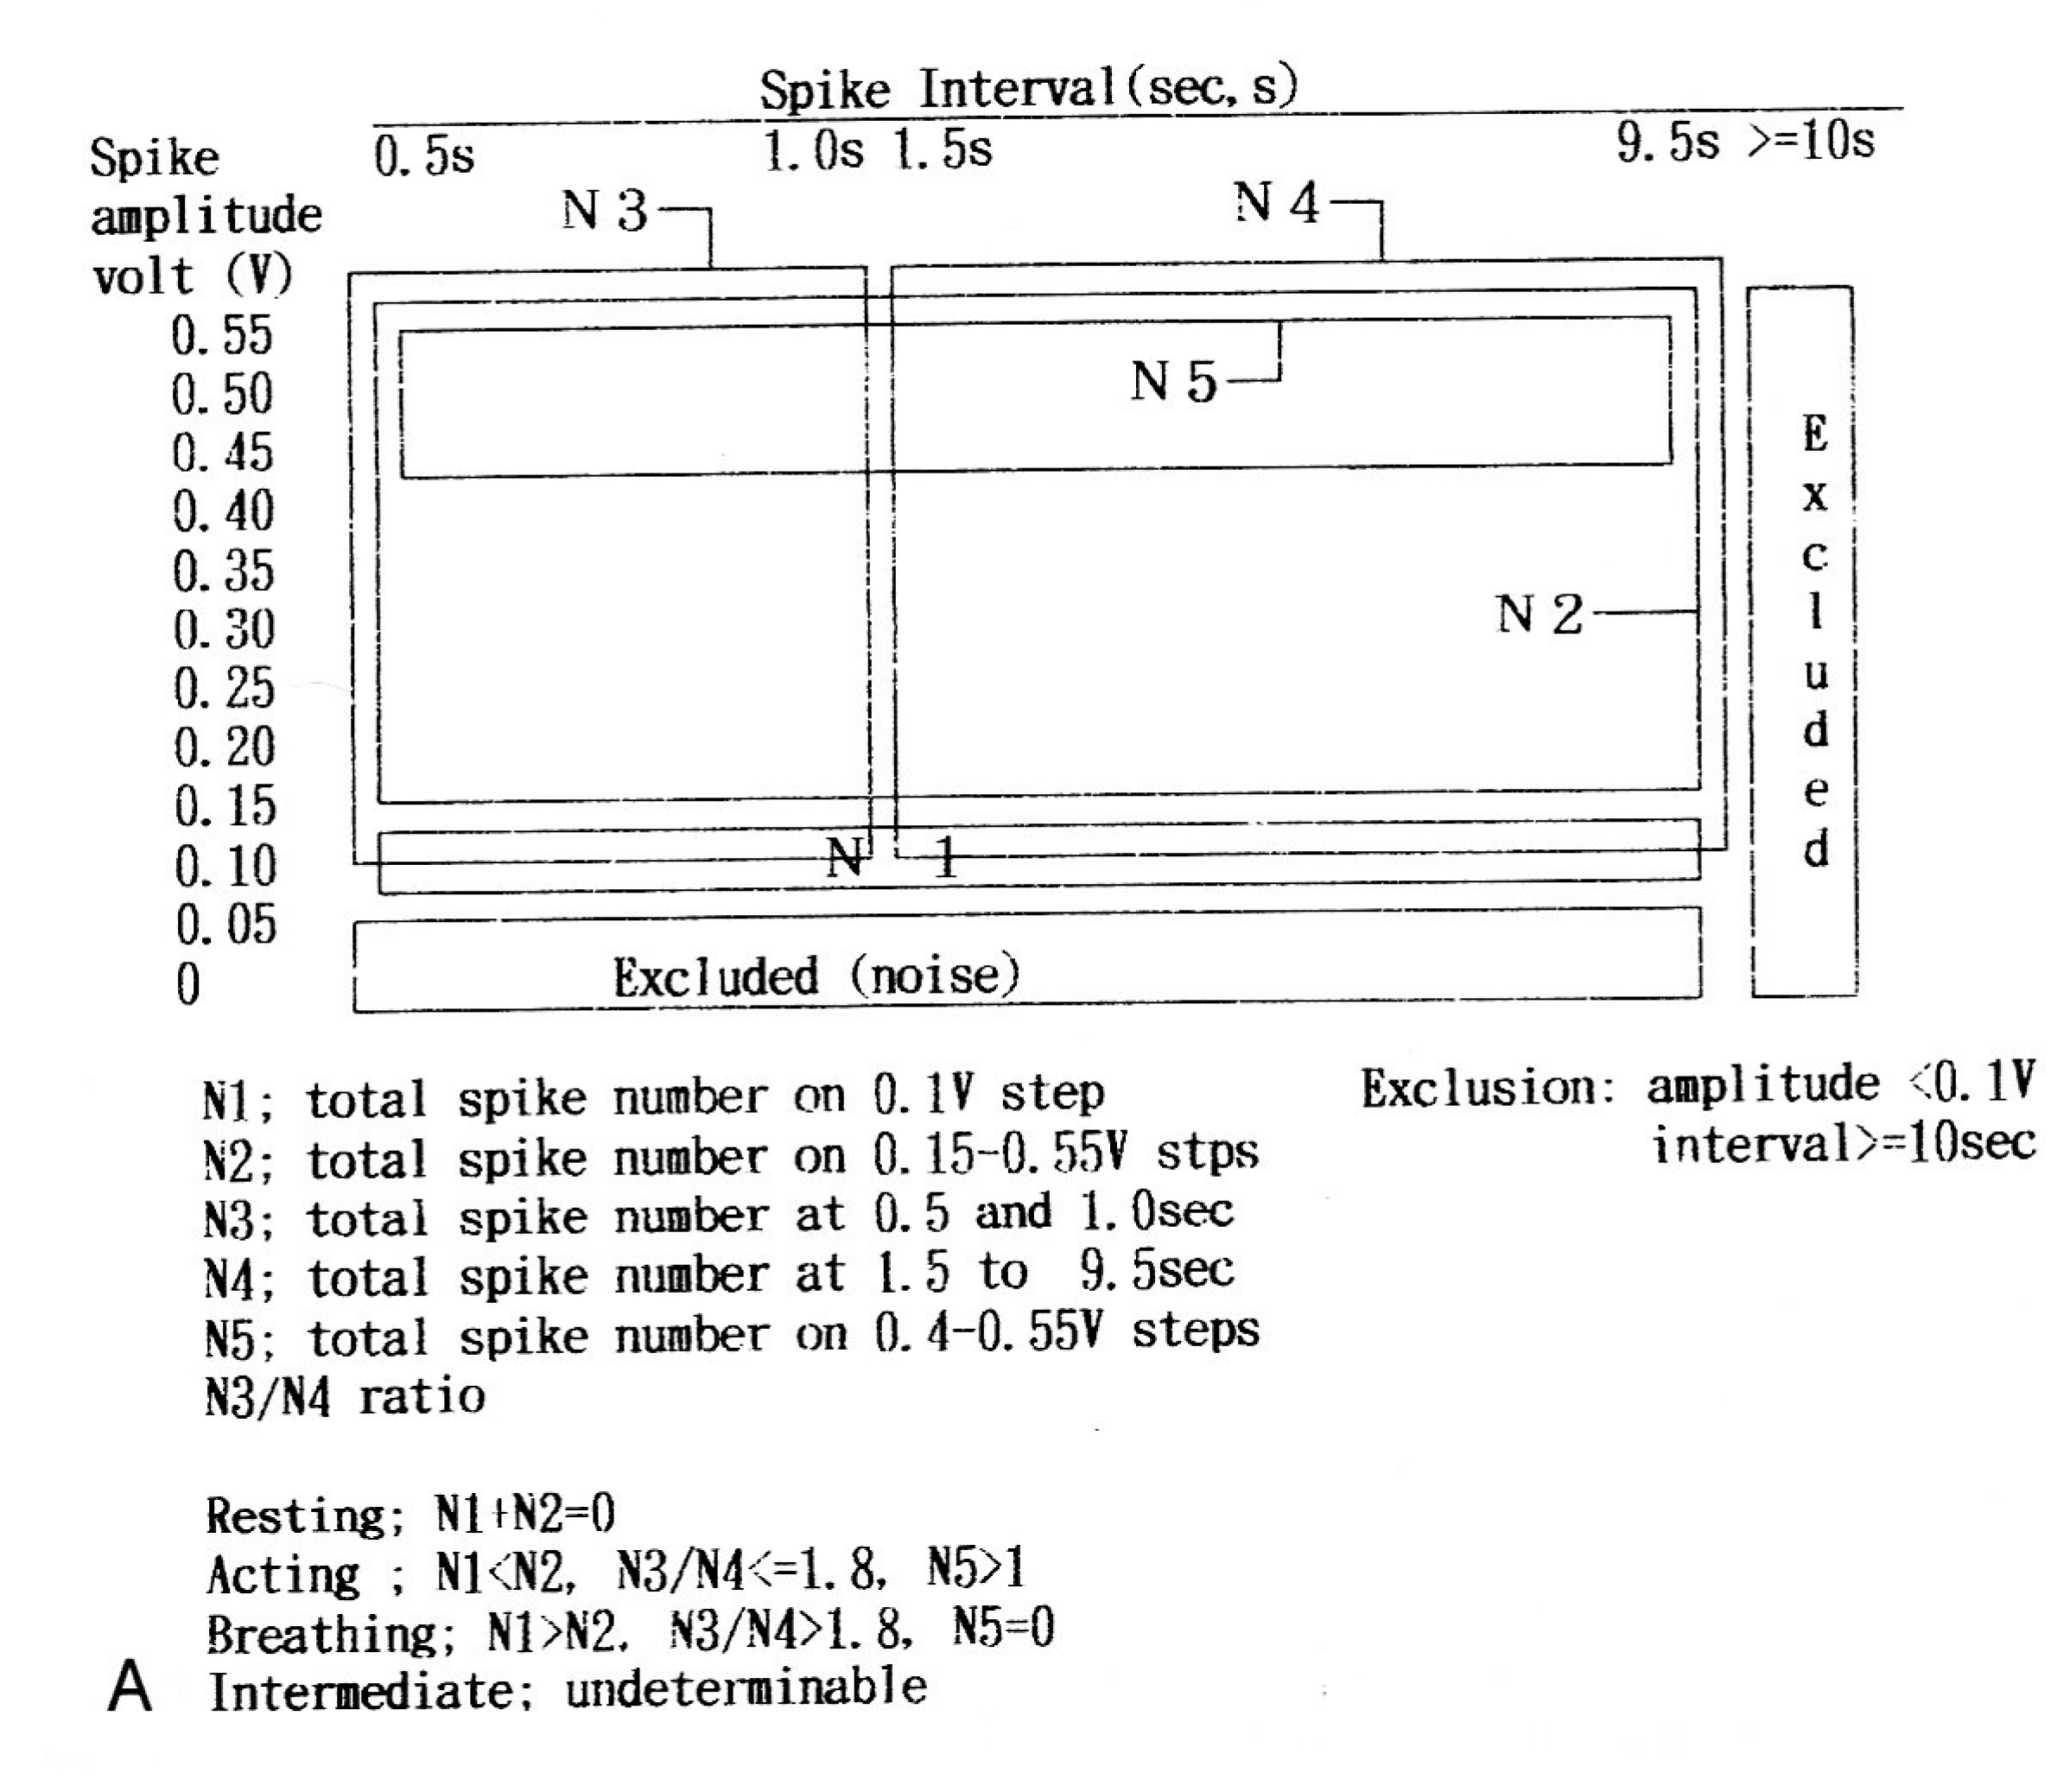
6.5. Computerized Diagnosis of Actocardiogram
The actocardiographic fetal movement spike signal data of normal pregnancy were introduced into a computer and fetal active, intermediate and resting states were automatically determined using the spike handling algorithm (
Figure 3), where the undeterminable result was intermediate fetal state [
21].
Figure 3.
The algorithm to automatically define fetal behavioral states into active and resting states. Undeterminable state was intermediate fetal state [
22].
Figure 3.
The algorithm to automatically define fetal behavioral states into active and resting states. Undeterminable state was intermediate fetal state [
22].
Fetal behavioral states were unstable in the periods before 34 weeks of gestation, and stabilized after 36 weeks in the computerized analysis using fetal movement signals (
Figure 3). Fetal hiccupping, non-reactive FHR (no acceleration against fetal movement), physiologic and pathologic sinusoidal FHR, abnormal fetal behavior,
etc., will be automatically detected by the automatic actocardiographic signal analysis in the future.
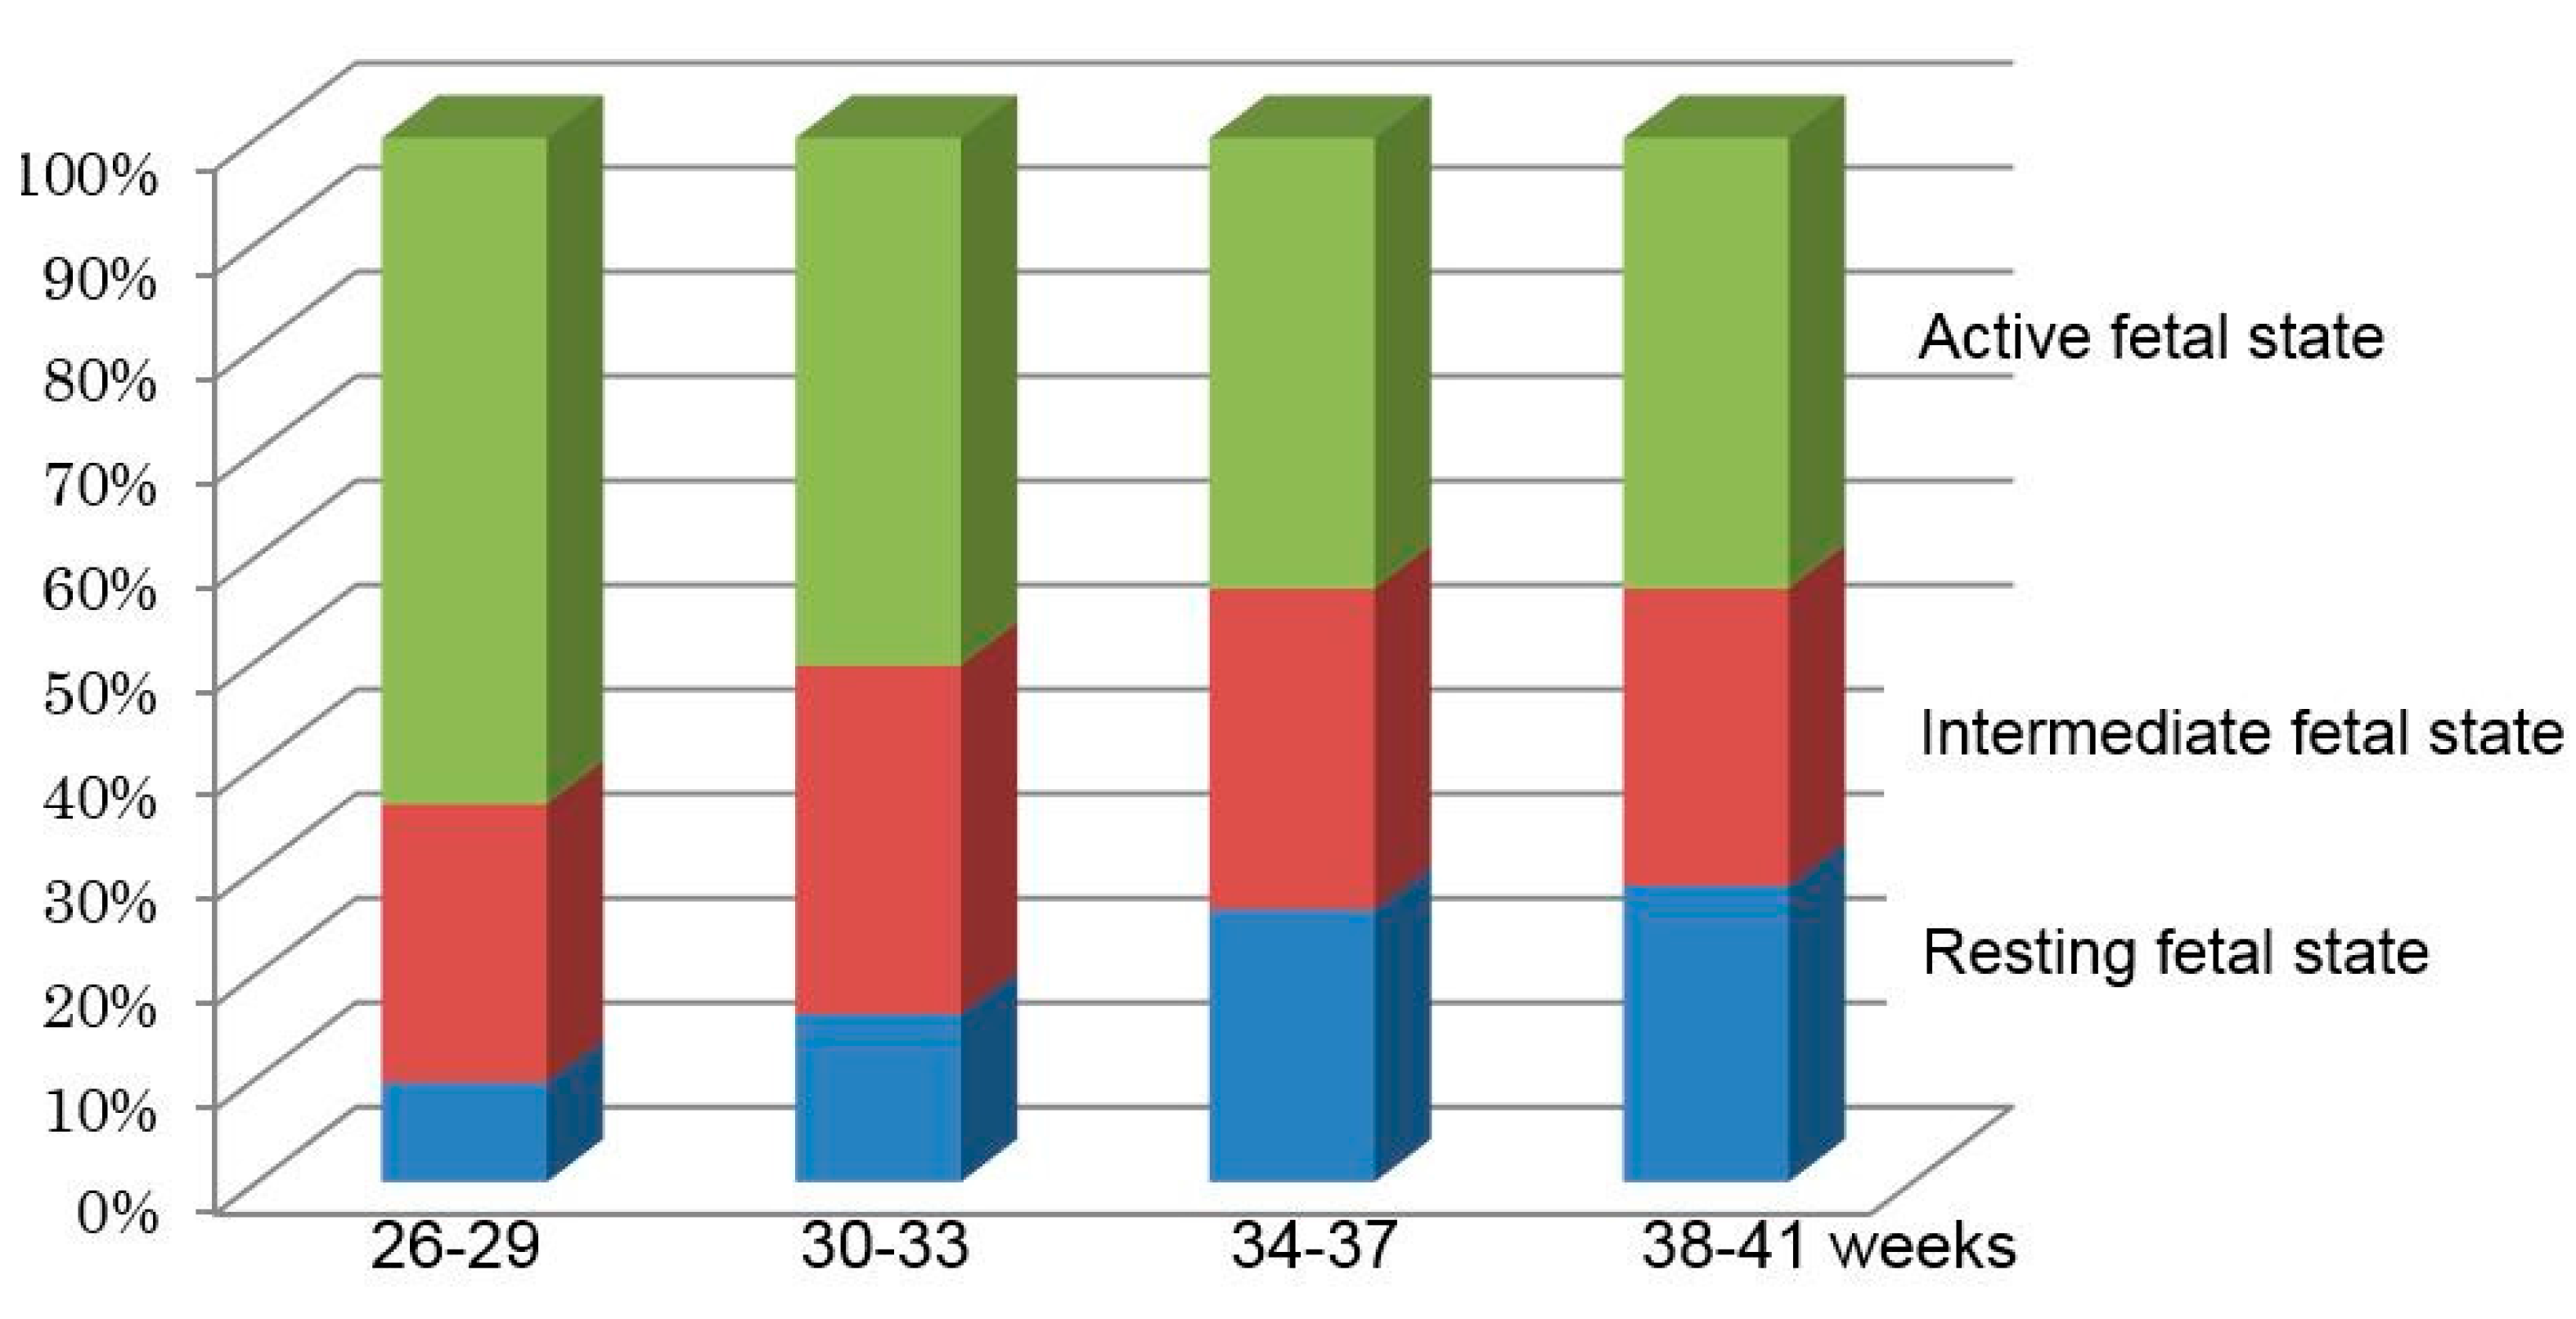
The percentages of three behavioral states were calculated in four pregnancy periods at 26–29, 30–33, 34–37 and 38–41 gestational weeks. As the percentages of active fetal states were gradually reduced and that of the resting fetal states increased during 26–37 weeks, and the percentage was stable in 38–41 weeks, fetal behavioral development would be complete at 37 weeks in normal pregnancy (
Figure 4) [
21].
Figure 4.
Fetal behavioral states obtained by computer analysis at four pregnancy periods using the algorithm of
Figure 3. Fetal behavioral development would be complete in 37 weeks of pregnancy [
22].
Figure 4.
Fetal behavioral states obtained by computer analysis at four pregnancy periods using the algorithm of
Figure 3. Fetal behavioral development would be complete in 37 weeks of pregnancy [
22].
7. Discussion and Conclusion
FHR diagnosis were objectivity achieved by quantitative analysis of fetal heart rate using FHR score and automated evaluation. Parallel processing of neural network computer diagnosis of the probability of fetal outcome confirmed diagnostic accuracy of FHR score, and frequency spectrum analysis diagnosed pathologic sinusoidal FHR and the loss of variability, in addition rapid and direct reporting system enhanced monitoring utility. Comprehensive FHR evaluation was obtained by automated diagnosis. Perinatal mortality was reduced and no cerebral palsy developed after introduction of the automatic centralized computer with direct and rapid reporting system at Seirei Mikatahara hospital, which was also capable of simultaneously monitoring multiple labor cases with a large time sharing system, which is attractive and useful in busy obstetric institutions handling a large number of births. The time used to visually monitor the fetal CTG in the labor is economized even in small obstetric clinics. In addition, the precision of analysis and no exhaustion will be advantages of computerized monitoring.
Acknowledgments
The first author expresses sincere gratitude to contributions of co-authors and the efforts of TOITU to develop the cenral computer.
Author Contributions
Maeda K contributed the manuscript, quantified objective analysis of FHR curve, creation of actocardiogram, of which application on the diagnosis of physiologic sinusoidal pattern, frequency spectrum of FHR curve, computer analysis of fetal behavior with actocardiogram.
Noguchi Y created the soft wear of artificial neural network analysis, its application for the FHR, the training of the neural network, and the neural network FHR diagnosis.
Utsu M set the central computer system in his hospital, actual diagnosis of the fetus in the labor, and the statistics on the effect of the new computer system.
Nagasawa T conducted the creation of central computer system, introduced frequency spectrum analysis, the diagnosis of ominous sinusoidal FHR and the loss of FHR variability with the spectrums.
Conflicts of Interest
The authors declare no conflict of interest.
References
- Hon, E.H. An Atlas of Fetal Heart Rate Patterns; Harty Press: New Haven, CT, USA, 1968. [Google Scholar]
- Chik, L.; Rosen, M.G.; Hirsch, V.J. An analysis of lag time and variability of fetal heart rate measurements. Am. J. Obstet. Gynecol. 1974, 118, 237–242. [Google Scholar] [PubMed]
- Maeda, K.; Arima, T.; Tatsumura, T. Computer-Aided fetal heart rate analysis and automatic fetal distress diagnosis during labor and pregnancy utilizing external technique in fetal monitoring. MEDINFO 1980, 80, 1214–1218. [Google Scholar]
- Maeda, K.; Noguchi, Y.; Matsumoto, F.; Nagasawa, T. Quantitative fetal heart rate evaluation without pattern classification: FHR score and artificial neural network analysis. In Text Book of Perinatal Medicine, 2nd ed.; Kurjak, A., Chervenak, F.A., Eds.; Informa: Londone, UK, 2006; pp. 1487–1495. [Google Scholar]
- Maeda, K.; Utsu, M.; Makio, A.; Serizawa, M.; Noguchi, Y.; Hamada, T.; Mariko, K.; Matsumoto, F. Neural network computer analysis of fetal heart rate. J. Matern. Fetal Invest. 1998, 8, 163–171. [Google Scholar]
- Maeda, K.; Nagsawa, T. Automatic computerized diagnosis of fetal sinusoidal heart rate. Fetal Diag. Ther. 2005, 20, 328–333. [Google Scholar] [CrossRef] [PubMed]
- Maeda, K.; Nagasawa, T. Loss of FHR variability diagnosed by frequency analysis. J. Perinat. Med. 2010, 38, 77–82. [Google Scholar] [CrossRef] [PubMed]
- Maeda, K. Studies on new ultrasonic Doppler fetal actograoh and continuous recording of fetal movement. Acta Obstet. Gynecol. Jpn. 1984, 36, 280–288. [Google Scholar]
- Ito, T.; Maeda, K.; Takahashi, H.; Nagata, N.; Nakajima, K.; Terakawa, N. Differentiation between physiologic and pathologic sinusoidal FHR pattern by fetal actocardiogram. J. Perinat. Med. 1994, 22, 39–48. [Google Scholar] [CrossRef] [PubMed]
- Maeda, K. Origin of the long-term variability and acceleration of FHR studied for the prevention of cerebral palsy in fetal hypoxia and general insults. J. Perinat. Med. 2013. [Google Scholar] [CrossRef] [PubMed]
- Maeda, K. Actocardiographic analysis of fetal hypoxia detected by the bradycardia, loss of fetal heart rate acceleration and long term variability. J. Health Med. Inform. 2013, 4, 118–122. [Google Scholar]
- Maeda, K. Modalities of fetal evaluation to detect fetal compromise prior to the development of significant neurological damage. J. Obstet. Gynecol. Res. 2014. [Google Scholar] [CrossRef] [PubMed]
- Chudáček, V.; Anden, J.; Mallat, S.; Abry, P.; Doret, M. Scattering transform for intrapartum fetal heart rate variability fractal analysis: a case control study. IEEE Trans. Biomed. Eng. 2014, 61, 1100–1108. [Google Scholar] [CrossRef] [PubMed]
- Dawes, G.S.; Lobb, M.; Moulden, M.; Redman, C.W.; Wheeler, T. Antenatal cardiotocogram quality and interpretation using computers. BJOG 2014, 121, 2–8. [Google Scholar] [CrossRef] [PubMed]
- Georgieva, A.; Pavne, S.J.; Moulden, M.; Redman, C.W. Computerized fetal hearte rate analysis in labor: detection of intervals with un-assignable baseline. Physiol. Meas. 2011, 32, 1549–1560. [Google Scholar] [CrossRef] [PubMed]
- Jezewski, M.; Wrobel, J.; Czabanski, R.; Horoba, K. Analysis of extracted cardiotocobraphic signal features to imptove automated prediction of fetal outcome. Biocybern. Biomed. Engineer. 2010, 30, 29–47. [Google Scholar]
- Signorini, M.G.; Fanelli, A.; Magenes, G. Monitoring fetal heart rate during pregnancy contributions from advanced signal processing and wearable technology. Comput. Math. Methods Med. 2014, 2014, 707581. [Google Scholar] [CrossRef] [PubMed]
- Maeda, K.; Iwabe, T.; Yoshida, S.; Ito, T.; Minagawa, Y.; Morokuma, S.; Pooh, R.K.; Fuchiwaki, T. Detailed multigrade evaluation of fetal disorders with the quantified actocardiogram. J. Perinat. Med. 2009, 37, 392–396. [Google Scholar] [CrossRef] [PubMed]
- Maeda, K.; Utsu, M.; Noguchi, Y.; Matsumoto, F.; Nagasawa, T. Central computerized automatic fetal heart rate diagnosis with a rapid and direct alarm system. Open Med. Devices J. 2012, 4, 28–33. [Google Scholar] [CrossRef]
- Kamitani, K. Maternal and Child Health Status in Japan; Boshi Hoken Jigyodan: Tokyo, Janpan, 2011; pp. 22–23. [Google Scholar]
- Takeshita, K.; Ando, Y.; Ohtani, K.; Takashima, S. Cerebral palsy in Tottori, Japan. Neuroepidemiology 1989, 8, 184–192. [Google Scholar] [CrossRef] [PubMed]
- Maeda, K.; Tatsumura, M.; Utsu, M. Analysis of fetal movements by Doppler actocardiogram and fetal B-mode imaging. Clin. Perinatol. 1999, 26, 829–851. [Google Scholar] [PubMed]
© 2015 by the authors; licensee MDPI, Basel, Switzerland. This article is an open access article distributed under the terms and conditions of the Creative Commons Attribution license (http://creativecommons.org/licenses/by/4.0/).


