Abstract
Improvement of soil nutrients is crucial for the long-term development and stability of restored ecosystems in mine areas. However, knowledge about the variation in soil nutrients and their influencing factors during the reclamation of sub-alpine metal mine soil is still scarce. We assess the status of soil organic carbon (SOC), total nitrogen (TN), N fractions, total phosphorus (TP), and available P in reclaimed soil at a copper mine site (2702 m above sea level) in the southeastern edge of the Tibetan Plateau, southwest China. The mine area had been reclaimed by distributing stockpiled topsoil (~15 cm) in 2008, sowing seeds of ryegrass (Lolium perenne L.) in 2009, and planting seedlings of A. ferdinandi-coburgii and Rosa omeiensis f. pteracantha in 2010. We found that, eight years after the reclamation, although the concentrations of SOC (24.3 g kg−1) and TN (2.21 g kg−1) in the reclaimed soil increased by 25% and 29% compared with the stockpiled topsoil, respectively, they only accounted for about half of the levels in the undisturbed topsoil. In contrast, the concentration of TP (498–570 mg kg−1) did not significantly change between the reclaimed and stockpiled topsoil. The concentrations of NH4-N (30.1 g kg−1), NO3-N (17.2 g kg−1), and available P (11.1 mg kg−1) in the reclaimed soil were 2.2, 1.3, and 1.6 times the levels in stockpiled topsoil, respectively, but still lower than those in undisturbed soil. The concentrations of microbial C, N, and P in the reclaimed soil had a similar variation pattern to the available nutrients. The soil C:P and N:P ratios and microbial biomass C:P and N:P ratios in the reclaimed soil were significantly lower than the levels in the undisturbed forest soil. The average accumulation rates of SOC and TN in the reclaimed soil were 85.3 and 11.4 g m−2 year−1, respectively. The rates are much lower than those of reclaimed mine soils with similar reclaim duration but better climate conditions. Relatively slow development of vegetation and soil microorganisms and leaching due to a freeze–thaw cycle controlled by the sub-alpine climate are likely responsible for the slow recovery of soil SOC and TN.
1. Introduction
Mining exploitation has caused irreversible damage to many natural ecosystems around the world. Reclamation is an effective technology to recover a disturbed ecosystem and restore its biodiversity and function [1,2]. Mine soil quality is a key indicator to assess the success of reclamation in mine sites [3,4,5] because the long-term development and stability of recovered plant communities are based on the systematic development and improvement of soil properties, including microbial functions [6,7]. Organic carbon (C) and nitrogen (N) pools in mine soil are massively degraded by mining activities [8,9]. Soil nutrients have been identified as the most critical properties when evaluating mine soil quality [5,10,11,12]. As a consequence, information on the variation in soil nutrients during reclamation is crucial to achieve successful reclamation [13].
A large number of studies have focused on the dynamics of soil physical, chemical, and biological properties during reclamation in several climate types [8,14,15,16,17,18,19,20,21]. These studies have estimated the accumulation rates of soil organic C (SOC), total N (TN), and available C, N, and phosphorus (P), analyzed the major driving factors affecting variation in the nutrients, and discussed the relationships between soil development and revegetation. However, most of the reclaimed mine areas in these studies are located in temperate [8,16,17,19], sub-tropical, and tropical zones [14,15,18,20,21]. Hardly any research has focused on the recovery of major soil nutrients during reclamation in sub-alpine areas.
Sub-alpine regions are prevalently characterized by relatively low temperatures, short growing season, and intensive freeze–thaw cycles [22]. Knowledge about how these features influence the recovery of major soil nutrient pools and the driving factors during reclamation is still scarce. For example, the low temperatures and short growing season presumably do not facilitate the rapid growth of plants, especially woody plants, and thus reduce the return of C by litter. However, because the microbial mineralization of soil organic matter is also inhibited, the low temperature is likely beneficial to SOC sequestration. In addition, freeze–thaw cycles decrease soluble nutrient pools by causing leaching of nutrients from topsoil. In contrast, these factors increase available mineral nutrients since the freeze–thaw cycle effectively breaks the minerals into fine particles, enhancing the weathering of mine soil and, thus, the release of nutrients.
Compared with coal mines, metal mine areas, especially copper mine sites, have more constraints on plant establishment and colonization, such as heavy metal toxicity, low content of nutrients, and extreme pH [23,24,25]. This highlights the essential role of improvement of soil physical–chemical–biological properties in successful reclamation. In addition, this also is a major cause for the rare field evidence about the variations in soil nutrient pools in copper mine sites in sub-alpine zones [26,27]. In the present study, we investigate the variation in the pools of SOC, N, P, and microbial biomass C, N, and P in an experimental reclamation project of a sub-alpine copper mine site in the southern edge of the Tibetan Plateau. In addition, we estimate the accumulation rates of SOC and N and analyze the changes in C:N:P stoichiometry. The first goal is to assess the status of SOC, N, and P in the reclaimed mine soil after eight years’ reclamation at the sub-alpine copper mine site. The second goal is to elucidate the effects of revegetation and sub-alpine climate on the available nutrient pools and the accumulation rates of SOC and TN in the reclamation soil.
2. Materials and Methods
2.1. Site Description
This study was conducted at an experimental reclamation project in a copper mine (chalcopyrite) (28°26′49″ E, 101°41′43″ E, 2702 m above sea level) in the southeastern edge of the Tibetan Plateau, southwest China (Figure S1). The protolith of this mine is a set of argillaceous-arenaceous marine sedimentary rocks in the passive continental margin, containing a small amount of volcanic rocks. Metallogenic materials mainly come from the ore-bearing rocks characterized by multiple phases and many geneses. The formation occured during the Yanshan period (133–143 Ma) by middle to high hydrothermal fluid mineralization [28]. The mean annual temperature is 7 °C (Table 1). The diurnal temperature range is 21 °C with the maximum annual temperature of 21 °C in July and the minimum annual temperature of −15.6 °C in January (Table 1). The mean annual precipitation of 802 mm is concentrated in the summer season (Table 1). Soil freeze–thaw cycles occur from November to March (Table 1), showing a cryic temperature regime to pedogenic processes in this region. This climate regime is typical and common in the sub-alpine region in the southeastern edge of the Tibetan Plateau. The undisturbed forest in the vicinity of the mining area is dominated by alder (Alnus ferdinandi-coburgii) with a height of 2–10 m. The coverage percent of the undisturbed forests is 90–100% (Table 1). The soil in the undisturbed forest is classified as leached brown soil according to the Genetic Soil Classification of China (GSCC) [29] or Alfisols according to soil taxonomy (ST) [30]. The slope of the reclamation area is 5–10° facing southwest. The experimental reclamation action was to cover stockpiled topsoil ~15 cm deep in 2008. The topsoil was taken from the surface mineral soil (0–30 cm) before this area was mined. In April 2009, seeds of ryegrass (Lolium perenne L.) were sown. In April 2010, seedlings of A. ferdinandi-coburgii and Rosa omeiensis f. pteracantha were planted with a distance of about 5 m to each other. The survival rate of the two species was recorded as between 30% and 40% in 2017. The coverage percent of the restoration vegetation was 30–50% (Table 1). This reclamation method is common in most mine areas in the southeastern edge of the Tibetan Plateau.

Table 1.
Characteristics of soil sampled at two depths and vegetation at different sites in a sub-alpine copper mine site, southeastern edge of the Tibetan Plateau.
2.2. Sampling and Analyses
In the reclaimed area, six plots (5 × 5 m) with a distance of >30 m from each other were selected to collect soil samples. In each plot, ten soil cores were collected by a soil auger. The depth of each soil core was 30 cm. The cores were divided into two layers to collect samples: 0–15 cm—reclaimed soil (RS) and 15–30 cm—reclaimed spoil (RSP) (Figure. S2). The collected sub-samples were mixed thoroughly to a composite sample for each horizon at each plot. Thus, we collected two composite samples from each plot, i.e., data of 12 composite samples from the reclaimed area. A litter horizon was not found in the reclaimed plots, therefore we did not collect litter samples.
In addition to RS and RSP, soil samples were also collected from the adjacent undisturbed forests (UTOP: 0–15 cm, USUB: 15–30 cm) as reference soil (Figure S2). The initial stockpiled topsoil (CKS) and mine spoil (CKSP) were collected as control groups (Figure S2). Soil samples were stored in a cooler with ice (1–4 °C) before moving to a laboratory. Samples for the analysis of soil properties were sieved (<2 mm) to remove coarse rocks and roots. Then, the soil samples were divided into two parts and were air-dried or stored at 4 °C (fresh soils), respectively.
Soil bulk density (BD) was determined by excavating holes with a certain volume. The volume of excavated soil could be measured by backfilling with a known volume of water [31]. Samples for BD were oven-dried at 105 °C for 48 h, and the weight and volume of coarse fragment (>2 mm) were subtracted from the total soil weight and volume to calculate BD. Air-dried soil samples were used for the rest of analyses except for determining NH4-N, NO3-N and microbial biomass C, N, and P (MBC, MBN, and MBP). Soil pH was determined in H2O suspensions (soil:water ratio of 1:2.5) using a pH meter (FE20K, Mettler Toledo, Germany). The particle size distribution was determined by a laser particle size analyzer (Mastersizer 2000) after samples were treated with 3%H2O2 (clay: <2 μm; silt: 2–20 μm; sand: 20–2000 μm). SOC and total N (TN) concentrations were measured using an element analyzer (Elementar vario MACRO cube, Germany). Total P (TP) was measured by a profile DV (USA Teledyne Leeman Labs) inductively coupled plasma atomic emission spectrometer (ICP-AES) (detection limit: 0.02 mg P/L) after digestion by refluxing with the nitric acid (6 mL), hydrofluoric acid (2 mL), and perchloric acid (1 mL). Available P was determined using the method proposed by Olsen and Sommers (1982) [32]. The concentrations of NH4-N and NO3-N were determined using a flow autoanalyzer (SEAL analytical AutoAnalyzer 3, Germany) after extraction by 1 M KCl solution. The contents of MBC, MBN, and MBP were measured by the chloroform fumigation-extraction method [33,34]. Two replicates were used when determining the above soil properties.
2.3. Calculations
The pools of SOC and TN (Pool, kg m−2) in different soil horizons were calculated using the following formula:
where Conc., BD and D are the concentration of SOC or TN (g kg−1), bulk density (g m−3), and depth (cm) in each horizon, respectively.
Pool = (Conc. × BD × D)/100
The accumulation rate of SOC and TN (R, g m−2 year−1) was calculated using the following formula:
where Age is the reclamation time (8 years).
R = Pool/Age × 10
2.4. Statistics
A test of homogeneity of variances was applied to pH, the contents of sand, silt, and clay and the concentrations of SOC, TN, TP, NH4-N, NO3-N MBC, MBN, and MBP (Table S1). If the variance of a variable was not homogeneous, the variable was transformed by the natural logarithm function. Variables were subjected to a one-way analysis of variance (ANOVA) to test differences between RS, RSP, CKS, CKSP, UTOP, and USUB (Table S2), after which LSD’s post-hoc tests were performed (Table S3). Before a correlation analysis was applied, variables were tested for normality (Q–Q plots, Figure S3). The correlations between these variables were determined by Pearson’s correlation coefficients. A significance level of p < 0.05 was used in this study (except where noted).
3. Results
3.1. Soil Properties
The bulk density in the reclaimed soil (RS) was lower than that in the initial stockpiled topsoil (CKS) but higher than that in the undisturbed topsoil (UTOP) (Table 1). The proportion of clay in the RS was lower than that in the CKS and UTOP. The reclaimed spoil (RSP) had more clay than the initial mine spoil (CKSP). We found no significant difference of pH between the Rs and CKs. In contrast, pH of the RSP increased by 1.1 units compared with the CKSP (Table 1).
3.2. Variations in soil C, N and P
The concentrations of SOC (24.3 ± 1.7 g kg−1, mean ± SD) and TN (2.21 ± 0.12 g kg−1) in the RS increased significantly compared with the CKS (SOC: 19.4 ± 1.6 g kg−1, TN: 1.71 ± 0.19 g kg−1), but only accounted for 44% and 54% of those in the UTOP, respectively (Figure 1a,b). The concentrations of SOC (2.46 ± 0.21 g kg−1) and TN (0.57 ± 0.03 g kg−1) in the RSP increased slightly compared with the CKSP (SOC: 1.81 ± 0.24 g kg−1, TN: 0.43 ± 0.06 g kg−1). The concentrations of NH4-N (30.1 ± 5.8 g kg−1) and NO3-N (17.2 ± 3.7 g kg−1) in the RS were 2.2 and 1.3 times of those in the CKS (Figure 2a,b). The concentrations of NH4-N and NO3-N increased from 3.2 and 0.8 mg kg−1 in the CKSP to 13.2 and 5.5 mg kg−1 in the RSP, respectively. The concentration of NH4-N was higher than that of NO3-N in both the RS and RSP. However, there was higher concentration of NO3-N than NH4-N in both the UTOP and undisturbed subsurface soil (USUB) (Figure 2a,b).
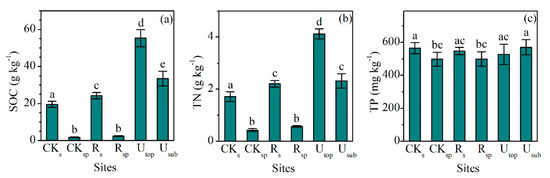
Figure 1.
Comparisons of the concentrations of (a) soil organic carbon (SOC), (b) total nitrogen (TN), and (c) total phosphorus (TP) between the reclaimed soil (Rs), reclaimed spoil (Rsp), initial topsoil (CKs), initial spoil (CKsp), and adjacent undisturbed forest soils (0–15 cm, Utop; 15–30 cm, Usub) in a sub-alpine copper mine site, southeastern edge of the Tibetan Plateau. Data are shown as means ± SD of 6 replicates. Different letters indicate significantly different variables between different samples at the p < 0.05 level.
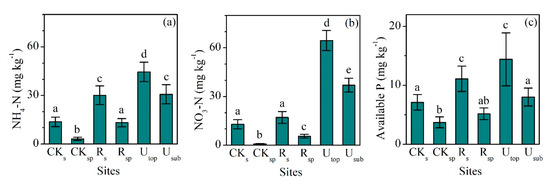
Figure 2.
Comparisons of the concentrations of (a) NH4-N, (b) NO3-N, and (c) available P between the reclaimed soil (Rs), reclaimed spoil (Rsp), initial topsoil (CKs), initial spoil (CKsp), and adjacent undisturbed forest soils (0–15 cm, Utop; 15–30 cm, Usub) in a sub-alpine copper mine site, southeastern edge of the Tibetan Plateau. Data are shown as means ± SD of 6 replicates. Different letters indicate significantly different variables between different samples at the p < 0.05 level.
The lowest concentration of TP (498 ± 42 mg kg−1) occurred in the CKSP and the highest one (570 ± 46 mg kg−1) occurred in the USUB (Figure 1c). The concentrations of TP in the RS (547 ± 22 mg kg−1) and RSP (499 ± 43 mg kg−1) did not significantly change compared with the CKS (565 ± 34 mg kg−1) and CKSP (498 ± 42 mg kg−1). However, the concentrations of available P in the RS (11.1 ± 2.2 mg kg−1) were significantly higher than those in the CKS (7.2 ± 1.4 mg kg−1) and were comparable with the UTOP (14.4 ± 4.5 mg kg−1) (Figure 2c).
The C:N ratios (mass ratio) in the RS (11.0 ± 1.1) and RSP (4.3 ± 0.3) did not significantly change compared with the CKS (11.4 ± 0.8) and CKSP (4.2 ± 0.3). They also were lower than the UTOP (13.4 ± 0.6) and USUB (14.4 ± 0.4) (Figure 3a). In contrast, the C:P (44.3 ± 3.7) and N:P (4.1 ± 0.4) ratios in the RS were significantly higher than those in the CKS (34.4 ± 1.5 and 3.0 ± 0.3), although they were still largely lower than those in the UTOP (105.8 ± 10.7 and 7.9 ± 0.8) (Figure 3b,c).
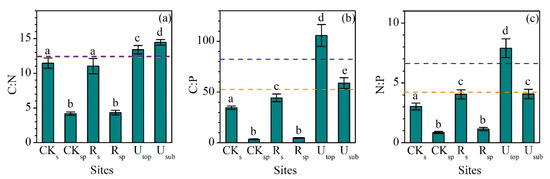
Figure 3.
Comparisons of (a) C:N, (b) C:P, and (c) N:P ratios (mass ratio) between the reclaimed soil (Rs), reclaimed spoil (Rsp), initial topsoil (CKs), initial spoil (CKsp), and adjacent undisturbed forest soils (0–15 cm, Utop; 15–30 cm, Usub) in a sub-alpine copper mine site, southeastern edge of the Tibetan Plateau. The blue dash line represents the value of global soil C:N, C:P, and N:P ratios [35]. The orange dash line represents the value of soil C:N, C:P, and N:P ratios in China [36]. Data are shown as means ± SD of 6 replicates. Different letters indicate significantly different variables between different samples at the p < 0.05 level.
3.3. Variations in Soil Microbial Biomass C, N, and P
MBC, MBN, and MBP showed a similar pattern between different groups (Figure 4a–c). The concentrations of MBC, MBN, and MBP in the RS increased largely compared the CKS. Although the concentrations of MBC (220 ± 22 mg kg−1), MBN (22.9 ± 3.0 mg kg−1), and MBP (8.7 ± 1.3 mg kg−1) in the RS were still lower than those in the UTOP (602 ± 59, 83.1 ± 9.3 and 18.3 ± 3.4 mg kg−1), they were comparable to those in the USUB (210 ± 35, 22.4 ± 4.9 and 5.5 ± 0.9 mg kg−1). MBC:N (9.8 ± 1.4), MBC:P (25.9 ± 4.2), and MBN:P (2.6 ± 0.1) ratios in the RS were higher than those in the CKS and RSP (Figure 5a–c). Compared with the UTOP, the RS had a comparable MBC:N ratio but lower MBC:P and MBN:P ratio. The concentration of MBC, MBN, and MBP in the CKSP was not detected.
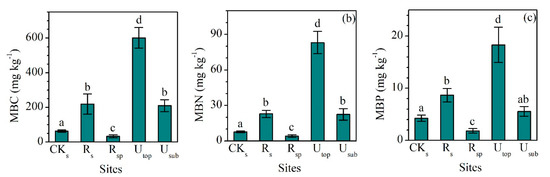
Figure 4.
Comparisons of the concentrations of (a) microbial biomass carbon (MBC), (b) microbial biomass nitrogen (MBN), and (c) microbial biomass phosphorus (MBP) between the reclaimed soil (Rs), reclaimed spoil (Rsp), initial topsoil (CKs), and adjacent undisturbed forest soils (0–15 cm, Utop; 15–30 cm, Usub) in a sub-alpine copper mine site, southeastern edge of the Tibetan Plateau. The concentration of MBC, MBN, and MBP in the initial spoil (CKsp) was not detected. Data are shown as means ± SD of 6 replicates. Different letters indicate significantly different variables between different samples at the p < 0.05 level.
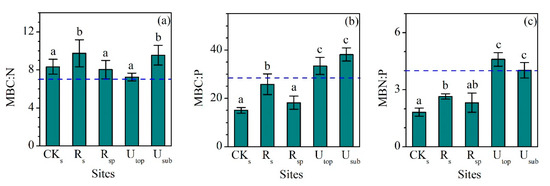
Figure 5.
Comparisons of (a) microbial biomass carbon to nitrogen (MBC:N), (b) microbial biomass carbon to phsophorus (MBC:P), and (c) microbial biomass nitrogen to phosphorus (MBN:P) ratios (mass ratio) between the reclaimed soil (Rs), reclaimed spoil (Rsp), initial topsoil (CKs), and adjacent undisturbed forest soils (0–15 cm, Utop; 15–30 cm, Usub) in a sub-alpine copper mine site, southeastern edge of the Tibetan Plateau. The blue dash line represents the value of global soil MBC:N, MBC:P, and MBN:P ratios [35]. Data are shown as means ± SD of 6 replicates. Different letters indicate significantly different variables between different samples at the p < 0.05 level.
3.4. Rate of Accumulation of Soil C and N
After eight years of reclamation, the SOC and TN pools increased from 3.85 and 0.34 kg m−2 in the CKS to 4.37 and 0.40 kg m−2 in the RS, respectively (Figure 6). The SOC and TN pools in the RSP increased by 0.16 and 0.03 kg m−2 compared with those in the CKSP, respectively. The SOC and TN pools in the RS were 46% and 56% of those in the UTOP. For the RS, the accumulation rates of SOC and TN were 65.0 and 7.3 g m−2 year−1, respectively (Table 2). For the RSP, the rates were 20.3 (SOC) and 4.1 (TN) g m−2 year−1, respectively.
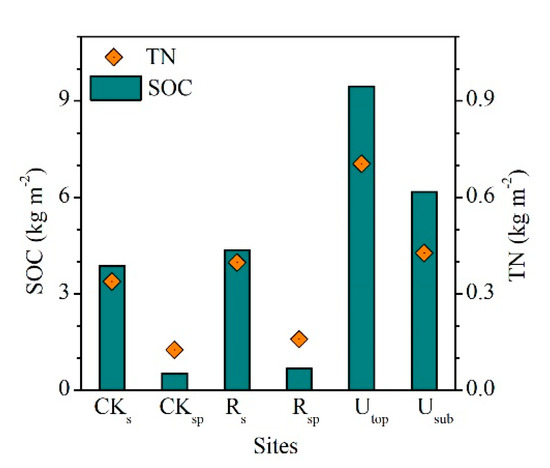
Figure 6.
Comparisons of the pools of soil organic carbon (SOC) and total nitrogen (TN) between the reclaimed soil (0–15 cm, Rs), reclaimed spoil (15–30 cm, Rsp), initial topsoil (CKs), initial spoil (CKsp), and adjacent undisturbed forest soils (0–15 cm, Utop; 15–30 cm, Usub) in a sub-alpine copper mine site, southeastern edge of the Tibetan Plateau.
Table 2.
Pools and accumulation rates of SOC and TN in reclaimed soils in mine areas with similar reclamation duration in the world.
4. Discussion
4.1. Variation in Soil Properties
The decrease in the bulk density of the RS compared with the CKS is likely a result of the accumulation of SOC with revegetation (Table 1, Figure 1). The decline of bulk density caused by the input of organic matter occurs in many young natural and recovered ecosystems. For example, soil bulk density decreased with increasing SOC along natural chronosequences in the Tibetan Plateau [37] and in the European Alps [38]. The decline of bulk density with the restoration period has also been reported in many recovered ecosystems [8,14,39,40]. The increase in pH of the RSP compared with the CKSP (Table 1) is probably caused by the deposition of base cations leached from the upper RS.
4.2. Variation in Major soil nutrients
Comparing the RS with CKS, the significant accumulation of both SOC and TN (Figure 1a,b, and Figure 6) and the slight decrease in TP (Figure 1c) showed a decoupled variation with the process of reclamation. The insignificant difference between the C:N ratios (Figure 3a) and the distinct changes in the C:P and N:P ratios (Figure 3b,c) between the RS and CKS also indicate this decoupled variation. In addition, the strong correlations between SOC, TN, MBC, and MBN and no correlation between TP and SOC, TN, MBC, MBN, and MBP (Table S3) further show the divergent variation in SOC and TN and TP.
This difference is presumably because of the different ultimate sources and biogeochemical cycling of C, N, and P. Indeed, C, N, and P all can be returned to the soil by the litter of Lolium perenne L. and Astragalus membranaceus in our reclaimed site. However, the ultimate major sources of organic C and N in the soil are atmospheric through photosynthesis and fixation by plants and microorganisms, while the ultimate source of P is the weathering of primary mineral P [41,42]. As a result, these differences will gradually increase the C and N pools in soil but only “cycle” P from bottom to top horizons. More than that, the P content in soil tends to decrease with long-term pedogenesis [43]. Consequently, similar to our results, increasing C and N and decreasing soil P with the pedogenic process have been observed in many natural and reclaimed ecosystems in various climate types [7,14,15,16,37,44,45].
The increase in the concentrations of NH4-N and available P in the RS (Figure 2a–c) reflect the improvement of soil available nutrient pools after revegetation. This is likely related to the increase in soil microbial activity according to their strong correlations to MBC, MBN, and MBP (Table S4). The ratio of MBC to SOC (MBC/SOC) increased from 0.63% in the CKS to 0.91% in the RS demonstrates the enhanced microbial activity due to revegetation. The high ratios of MBN to NH4-N (0.76) and NO3-N (0.51) also show the important role of microorganisms in transforming N [49]. In addition, the positive correlations of available P to SOC, TN, MBC, MBN, and MBP but not to TP (Table S4) and the high ratio of MBP to available P (0.78) further indicate that microbial transformation is a major mechanism of the increase in available P. Previous studies also related variations in soil nutrient status to microbial activities [19].
4.3. Accumulation Rates of C and N
The accumulation rate of SOC at our site is higher than that at a lignite mine site in Western North Dakota (No. 1 in Table 2, [46]) and a coal mine site in India planted with Tectona grandis L.f (No. 2A in Table 2, [18]), slightly higher than that at a sand mine site in Southern Poland (No. 3 in Table 2, [47]), comparable to that at a coal mine site recovered by forest in Southeastern Ohio, USA (No. 4C in Table 2, 10 years, [8]), and lower than that at other sites with a similar reclamation duration but higher MAT and MAP (No. 2B–D, 4A, 4B, 5A, 5B, 6, and 7 in Table 2, [8,14,15,17,18]. Our accumulation rate of TN is in the middle of the range (1.5–29.7 g m−2·year−1) of the previous studies with various climate and vegetation types (Table 2).
The differences of the rates of SOC and TN accumulation between our site and other sites can be jointly attributed to the effects of climate and vegetation type. First, relatively higher precipitation and temperature favor the development of vegetation and microbial activities, which further facilitate the fixation of N and the return of C and N to soil. This can be reflected by the observation that higher accumulation rates of SOC and TN generally occurred in sites with higher MAT and MAP (Table 2). Second, vegetation type and its interaction with climate can also influence the accumulation of SOC and TN. This can be shown by that the accumulation rates of SOC and TN in our site are even higher than those in several sites with higher MAT and MAP (No. 2A, 3, and 6 in Table 2). The large differences (11-fold) of the accumulation rate of TN between the Sites 6 and 8 further show the influence of vegetation type. The MAT and MAP are comparable at the two sites but Site 8 was dominated by the locust (leguminous tree) while Site 6 was dominated by non-leguminous species (Table 2). Singh et al. (2004) also found that leguminous trees cause a larger increase in soil N pool than non-leguminous trees [50]. In addition, the relatively high content of total Cu in the RSP (~368 mg/kg, personal communication) maybe prevent the growth of plants and activity of microbes, inhibiting the accumulation of SOC and TN.
The accumulation rates of SOC and TN at our site were largely higher than those in natural soil during primary succession, similar to some previous reports [20,47]. For example, our accumulation rate of SOC is 2.6–12.0 times of that at three “young” chronosequences (120–150 years) in the Swiss Alps [51,52,53]. Our accumulation rate of TN is 2.7–5.7 times of that at a lava chronosequence (142 years) in tropical Hawaii [44]. This is no surprise because the parent materials of natural successional soils are often lacking in C and N [52], while the reclaimed soil often has a certain amount of legacy C and N (Figure 1a,b), which can facilitate the rapid establishment of microorganisms and vegetation. As a consequence, considerable amounts of SOC and N can be rapidly fixed or returned to soil by litters in reclaimed sites.
4.4. Slow Increase in Soil Nutrient Pools in Sub-Alpine Mine Site
For our reclaimed soil, it would take around 124 years to reach SOC equivalence with the undisturbed forest soil, if keeping the current rate (Table 2). Because many previous studies have reported that the accumulation rate of SOC decreases with soil development [45,51], the actual recovery duration of SOC would be longer than this estimation. This recovery duration is much longer than that found in reclaimed sites with better climate conditions [4,14,40]. For example, the reclaimed site would need less than 20 years to achieve the SOC content of the reference forest in tropical Ranchi district, India [14]. Mukhopadhyay et al. (2014) found that soil quality after 17 years reclamation was comparable to that in a nearby undisturbed forest in a tropical coal mine site in India [4]. For a coal mine in a temperate zone, northern China, Yuan et al. (2018) found that the duration required to reach the nutrient level of undisturbed site was about 10 years [40].
The slow increase in soil SOC and TN at our site is likely related to the relatively slow development of vegetation (Table 1) and microbial activities controlled by the relatively cold and dry climate. This point can be supported by the variation in available nutrients, microbial biomass, and C:N:P ratios. First, although the concentrations of NH4-N and NO3-N at the RS increased compared with the CKS, they only accounted for 67.5% and 26.6% of those in the Utop. The lower content of NO3-N content than NH4-N in the RS further illustrates that it will need a long time to reach the level of nutrients at the undisturbed site where the content of NO3-N is higher than NH4-N (Figure 2a,b). The low temperature and the long frost period (Table 1) is probably an important factor causing weak nitrification and, thus, the low content of NO3-N in the RS. In addition, the leaching of soluble NO3-N is also likely responsible for the low content of NO3-N in RS. This can be shown by the existence of NO3-N in the subsurface RSP (Figure 2b). The undetectable MBC and MBN in the RSP indicate that the NO3-N in the RSP came from the upper RS horizon by leaching. The occurrence of leaching at our reclaimed site is also demonstrated by the increase in clay content of the RSP and the decrease in clay content of the RS (Table 1).
Second, the concentrations of MBC, MBN, and MBP in the RS were 36.5%, 27.5%, and 47.3% of those in the UTOP (Figure 4a–c), showing the relatively low rate of microbial nutrient transformation controlled by the low temperature. This is also reflected by the observation that the MBC/SOC (0.9%), MBN/TN (1%), and MBP/TP (1.6%) in the RS were lower than those in the UTOP, and much lower than those in various types of soils around the world [54,55,56,57]. In addition, even in low altitudinal areas, it will take several decades or more for microbial biomass and diversity in disturbed soils to reach the levels of undisturbed soils [58,59]. Therefore, the slow recovery of soil microbial function is likely a reason for the slow recovery of soil nutrient pools at our site.
Finally, although the C:N ratio in the RS approached the ratios in China and global soils (Figure 3a) [35,36], the much lower C:P and N:P ratios than the global values (Figure 3b,c) indicate the insufficient contents of SOC and N in the RS. Similar to the soil C:N:P ratios, the MBC:N ratio in the RS increased to the same level of the UTOP (Figure 5a); however, the MBC:P ratiois slightly lower than the global value and the MBN:P ratio much lower than that in the UTOP, USUB, and global level (Figure 5a) [35]. These results illustrate not only the lack of C and N in the RS, but also the likely N limitation to the microbial community.
5. Conclusions
The SOC and TN pools in the reclaimed soil after eight years of reclamation increased significantly, compared with the initial stockpiled topsoil in the sub-alpine copper mine area, southeastern edge of the Tibetan Plateau, southwest China. In contrast, a significant difference in the TP pool was not observed. The SOC and TN pools in the reclaimed soil accounted for 46% and 56% of those in the adjacent undisturbed forest soil. The concentrations of MBC, MBN, and MBP in the reclaimed soil were only 37%, 27%, and 48% of the levels in the undisturbed soil, respectively. The relatively slow increase in soil SOC and TN pools are likely related to the relatively cold and dry sub-alpine climate, which does not favor the fast development of vegetation and microbial activities.
Supplementary Materials
The following are available online at https://www.mdpi.com/1999-4907/10/12/1069/s1, Figure S1: The location of the reclaimed area and the undisturbed forest in a sub-alpine copper mine site, southeastern edge of the Tibetan Plateau, Figure S2: Six classes of soil and spoil samples in this study, Figure S3: Q-Q plots of 11 variables in a sub-alpine copper mine site, southeastern edge of the Tibetan Plateau, Table S1: Test of Homogeneity of Variances, Table S2: Results of ANOVA analysis of 11 variables, Table S3: Pearson’s correlation coefficients between the concentrations of soil C, N, P, microbial biomass C, N and P (MBC, MBN and MBP) in a sub-alpine copper mine site, southern edge of the Tibetan Plateau (N = 30), Table S4: Pearson’s correlation coefficients between the concentrations of available P, NH4-N and NH4-N and the soil C, N, P, microbial biomass C, N and P (MBC, MBN and MBP) in a sub-alpine copper mine site, southern edge of the Tibetan Plateau (N = 30).
Author Contributions
The authors contributed equally to the conceptualization of the research design and the writing of manuscripts for this paper. The methodology, the preparation of empirical investigations, the collection of primary data in the field, data curation and the formal analysis was done by Y.C. The final review and editing of the manuscript was conducted by Y.C. and J.Z. The project administration as well as the funding acquisition was done by J.Z.
Funding
This research was funded by the National Key R&D Program of China (No. 2018YFD1100104), the Youth Innovation Promotion Association of Chinese Academy of Sciences (Grant No. 2018407) and the Sichuan Science and Technology Program (Grant No. 2019YJ0008).
Acknowledgments
The authors would like to thank the editors and anonymous reviewers for their constructive comments which improve the quality of this manuscript greatly.
Conflicts of Interest
The authors declare no conflict of interest.
References
- Li, M.S. Ecological restoration of mineland with particular reference to the metalliferous mine wasteland in China: A review of research and practice. Sci. Total Environ. 2006, 357, 38–53. [Google Scholar] [CrossRef]
- Wang, L.; Ji, B.; Hu, Y.H.; Liu, R.Q.; Sun, W. A review on in situ phytoremediation of mine tailings. Chemosphere 2017, 184, 594–600. [Google Scholar] [CrossRef]
- Yao, R.J.; Yang, J.S.; Gao, P.; Zhang, J.B.; Jin, W.H. Determining minimum data set for soil quality assessment of typical salt-affected farmland in the coastal reclamation area. Soil Tillage Res. 2013, 128, 137–148. [Google Scholar] [CrossRef]
- Mukhopadhyay, S.; Maiti, S.K.; Masto, R.E. Development of mine soil quality index (MSQI) for evaluation of reclamation success: A chronosequence study. Ecol. Eng. 2014, 71, 10–20. [Google Scholar] [CrossRef]
- Mukhopadhyay, S.; Masto, R.E.; Yadav, A.; George, J.; Ram, L.C.; Shukla, S.P. Soil quality index for evaluation of reclaimed coal mine spoil. Sci. Total Environ. 2016, 542, 540–550. [Google Scholar] [CrossRef] [PubMed]
- Li, X.F.; Huang, L.B. Toward a New Paradigm for tailings phytostabilization-nature of the substrates, amendment options, and anthropogenic pedogenesis. Crit. Rev. Environ. Sci. Technol. 2015, 45, 813–839. [Google Scholar] [CrossRef]
- Shrestha, R.K.; Lal, R. Changes in physical and chemical properties of soil after surface mining and reclamation. Geoderma 2011, 161, 168–176. [Google Scholar] [CrossRef]
- Akala, V.A.; Lal, R. Soil organic carbon pools and sequestration rates in reclaimed minesoils in Ohio. J. Environ. Qual. 2001, 30, 2098–2104. [Google Scholar] [CrossRef] [PubMed]
- Ganjegunte, G.K.; Wick, A.F.; Stahl, P.D.; Vance, G.F. Accumulation and composition of total organic carbon in reclaimed coal mine lands. Land Degrad. Dev. 2009, 20, 156–175. [Google Scholar] [CrossRef]
- Bodlák, L.; Krováková, K.; Kobesová, M.; Brom, J.; Stastny, J.; Pecharová, E. SOC content—An appropriate tool for evaluating the soil quality in a reclaimed post-mining landscape. Ecol. Eng. 2012, 43, 53–59. [Google Scholar] [CrossRef]
- Chaudhuri, S.; McDonald, L.M.; Skousen, J.; Pena-Yewtukhiw, E.M. Soil organic carbon molecular properties: Effects of time since reclamation in a minesoil chronosequence. Land Degrad. Dev. 2015, 26, 237–248. [Google Scholar] [CrossRef]
- Monserie, M.F.; Watteau, F.; Villemin, G.; Ouvrard, S.; Morel, J.L. Technosol genesis: Identification of organo-mineral associations in a young Technosol derived from coking plant waste materials. J. Soil Sediment 2009, 9, 537–546. [Google Scholar] [CrossRef]
- Courtney, R.; Mullen, G.; Harrington, T. An Evaluation of revegetation success on bauxite residue. Restor. Ecol. 2009, 17, 350–358. [Google Scholar] [CrossRef]
- Ahirwal, J.; Maiti, S.K.; Singh, A.K. Changes in ecosystem carbon pool and soil CO2 flux following post-mine reclamation in dry tropical environment, India. Sci. Total Environ. 2017, 583, 153–162. [Google Scholar] [CrossRef]
- Ahirwal, J.; Maiti, S.K.; Reddy, M.S. Development of carbon, nitrogen and phosphate stocks of reclaimed coal mine soil within 8 years after forestation with Prosopis juliflora (Sw.) Dc. Catena 2017, 156, 42–50. [Google Scholar] [CrossRef]
- Liu, X.Y.; Bai, Z.K.; Zhou, W.; Cao, Y.G.; Zhang, G.J. Changes in soil properties in the soil profile after mining and reclamation in an opencast coal mine on the Loess Plateau, China. Ecol. Eng. 2017, 98, 228–239. [Google Scholar] [CrossRef]
- Pietrzykowski, M.; Daniels, W.L. Estimation of carbon sequestration by pine (Pinus sylvestris L.) ecosystems developed on reforested post-mining sites in Poland on differing mine soil substrates. Ecol. Eng. 2014, 73, 209–218. [Google Scholar] [CrossRef]
- Singh, A.; Zeng, D.; Chen, F. Effect of young woody plantations on carbon and nutrient accretion rates in a redeveloping soil on coalmine spoil in a dry tropical environment, India. Land Degrad. Dev. 2006, 17, 13–21. [Google Scholar] [CrossRef]
- Šourková, M.; Frouz, J.; Fettweis, U.; Bens, O.; Hüttl, R.; Šantrůčková, H. Soil development and properties of microbial biomass succession in reclaimed post mining sites near Sokolov (Czech Republic) and near Cottbus (Germany). Geoderma 2005, 129, 73–80. [Google Scholar] [CrossRef]
- You, F.; Dalal, R.; Huang, L.B. Initiation of soil formation in weathered sulfidic Cu-Pb-Zn tailings under subtropical and semi-arid climatic conditions. Chemosphere 2018, 204, 318–326. [Google Scholar] [CrossRef]
- Yuan, M.; Xu, Z.P.; Baumgartl, T.; Huang, L. Organic amendment and plant growth improved aggregation in Cu/Pb-Zn tailings. Soil Sci. Soc. Am. J. 2016, 80, 27–37. [Google Scholar] [CrossRef]
- Zhong, X.H.; Zhang, W.J.; Luo, J. The characteristics of the mountain ecosystem and environment in the Gongga Mountain region. Ambio 1999, 28, 648–654. [Google Scholar]
- Das, M.; Maiti, S.K. Comparison between availability of heavy metals in dry and wetland tailing of an abandoned copper tailing pond. Environ. Monit. Assess. 2008, 137, 343–350. [Google Scholar] [CrossRef] [PubMed]
- Fernández-Calviño, D.; Cutillas-Barreiro, L.; Nóvoa-Muñoz, J.C.; Díaz-Raviña, M.; Fernández-Sanjurjo, M.J.; Álvarez-Rodríguez, E.; Núñez-Delgado, A.; Arias-Estévez, M.; Rousk, J. Using pine bark and mussel shell amendments to reclaim microbial functions in a Cu polluted acid mine soil. Appl. Soil Ecol. 2018, 127, 102–111. [Google Scholar] [CrossRef]
- Ye, Z.; Shu, W.; Zhang, Z.; Lan, C.; Wong, M. Evaluation of major constraints to revegetation of lead/zinc mine tailings using bioassay techniques. Chemosphere 2002, 47, 1103–1111. [Google Scholar] [CrossRef]
- Huang, L.; Baumgartl, T.; Mulligan, D. Is rhizosphere remediation sufficient for sustainable revegetation of mine tailings? Ann. Bot. 2012, 110, 223–238. [Google Scholar] [CrossRef]
- Mendez, M.O.; Maier, R.M. Phytostabilization of mine tailings in arid and semiarid environments—An emerging remediation technology. Environ. Health Perspect. 2007, 116, 278–283. [Google Scholar] [CrossRef]
- Li, T.Z.; Feng, X.l.; Zhang, H.H.; Tang, G.L.; Wu, Z.B.; Xia, X.B. Geochemical characteristics of the ore-bearing rock series and genesis of the Liwu copper deposit, Sichuan Province. Geol. Explor. 2010, 46, 921–930, (In Chinese with English abstract). [Google Scholar]
- National Soil Survey Office. Soils of China; Chinese Agriculture Press: Beijing, China, 1998; pp. 1–1253. (In Chinese)
- Soil Survey Staff in USDA. Keys to Soil Taxonomy, 12th ed.; USDA—Natural Resources Conservation Service: Washington, DC, USA, 2014; pp. 1–306.
- Maynard, D.G.; Curran, M.P. Soil density measurement in forest soils. In Soil Sampling and Methods of Analysis, 2nd ed.; Cartery, M.R., Gregorich, E.G., Eds.; CRC Press, Boca Raton Taylor & Francis Group, LLC: Boca Raton, FL, USA, 2006; pp. 863–869. [Google Scholar]
- Olsen, S.R.; Sommers, L.E. Phosphorus. In Methods of Soil Analysis; Miller, A.L., Keeney, D.R., Eds.; American Society of Agronomy Madison: Madison, WI, USA, 1982; pp. 403–427. [Google Scholar]
- Brookes, P.C.; Powlson, D.S.; Jenkinson, D.S. Measurement of microbial biomass phosphorus in soil. Soil Biol. Biochem. 1982, 14, 319–329. [Google Scholar] [CrossRef]
- Wu, J.; He, Z.; Wei, W.; O’Donnell, A.G.; Syers, J.K. Quantifying microbial biomass phosphorus in acid soils. Biol. Fertil. Soils 2000, 32, 500–507. [Google Scholar] [CrossRef]
- Cleveland, C.C.; Liptzin, D. C:N:P stoichiometry in soil: Is there a “Redfield ratio” for the microbial biomass? Biogeochemistry 2007, 85, 235–252. [Google Scholar] [CrossRef]
- Tian, H.Q.; Chen, G.S.; Zhang, C.; Melillo, J.M.; Hall, C.A.S. Pattern and variation of C:N:P ratios in China’s soils: A synthesis of observational data. Biogeochemistry 2010, 98, 139–151. [Google Scholar] [CrossRef]
- Zhou, J.; Wu, Y.H.; Prietzel, J.; Bing, H.J.; Yu, D.; Sun, S.Q.; Luo, J.; Sun, H.Y. Changes of soil phosphorus speciation along a 120-year soil chronosequence in the Hailuogou Glacier retreat area (Gongga Mountain, SW China). Geoderma 2013, 195, 251–259. [Google Scholar] [CrossRef]
- Guelland, K.; Hagedorn, F.; Smittenberg, R.H.; Goransson, H.; Bernasconi, S.M.; Hajdas, I.; Kretzschmar, R. Evolution of carbon fluxes during initial soil formation along the forefield of Damma glacier, Switzerland. Biogeochemistry 2013, 113, 545–561. [Google Scholar] [CrossRef]
- Kumar, S.; Maiti, S.K.; Chaudhuri, S. Soil development in 2–21 years old coalmine reclaimed spoil with trees: A case study from Sonepur-Bazari opencast project, Raniganj Coalfield, India. Ecol. Eng. 2015, 84, 311–324. [Google Scholar] [CrossRef]
- Yuan, Y.; Zhao, Z.Q.; Niu, S.Y.; Li, X.Z.; Wang, Y.Y.; Bai, Z.K. Reclamation promotes the succession of the soil and vegetation in opencast coal mine: A case study from Robinia pseudoacacia reclaimed forests, Pingshuo mine, China. Catena 2018, 165, 72–79. [Google Scholar] [CrossRef]
- Batjes, N.H. Total carbon and nitrogen in the soils of the world. Eur. J. Soil Sci. 1996, 47, 151–163. [Google Scholar] [CrossRef]
- Vitousek, P.M.; Porder, S.; Houlton, B.Z.; Chadwick, O.A. Terrestrial phosphorus limitation: Mechanisms, implications, and nitrogen-phosphorus interactions. Ecol. Appl. 2010, 20, 5–15. [Google Scholar] [CrossRef]
- Walker, T.W.; Syers, J.K. The fate of phosphorus during pedogenesis. Geoderma 1976, 15, 1–19. [Google Scholar] [CrossRef]
- Crews, T.E.; Kurina, L.M.; Vitousek, P.M. Organic matter and nitrogen accumulation and nitrogen fixation during early ecosystem development in Hawaii. Biogeochemistry 2001, 52, 259–279. [Google Scholar] [CrossRef]
- Zhou, J.; Bing, H.J.; Wu, Y.H.; Yang, Z.J.; Wang, J.P.; Sun, H.Y.; Luo, J.; Liang, J.H. Rapid weathering processes of a 120-year-old chronosequence in the Hailuogou Glacier foreland, Mt. Gongga, SW China. Geoderma 2016, 267, 78–91. [Google Scholar] [CrossRef]
- Wali, M.K. Ecological succession and the rehabilitation of disturbed terrestrial ecosystems. Plant Soil 1999, 213, 195–220. [Google Scholar] [CrossRef]
- Pietrzykowski, M.; Krzaklewski, W. Soil organic matter, C and N accumulation during natural succession and reclamation in an opencast sand quarry (southern Poland). Arch. Agron. Soil Sci. 2007, 53, 473–483. [Google Scholar] [CrossRef]
- Jencks, E.; Tyron, E.; Contri, M. Accumulation of nitrogen in minesoils seeded to black locust 1. Soil Sci. Soc. Am. J. 1982, 46, 1290–1293. [Google Scholar] [CrossRef]
- Recous, S.; Mary, B.; Faurie, G. Microbial immobilization of ammonium and nitrate in cultivated soils. Soil Biol. Biochem. 1990, 22, 913–922. [Google Scholar] [CrossRef]
- Singh, A.N.; Raghubanshi, A.S.; Singh, J.S. Impact of native tree plantations on mine spoil in a dry tropical environment. For. Ecol. Manag. 2004, 187, 49–60. [Google Scholar] [CrossRef]
- Egli, M.; Fitze, P.; Mirabella, A. Weathering and evolution of soils formed on granitic, glacial deposits: Results from chronosequences of Swiss alpine environments. Catena 2001, 45, 19–47. [Google Scholar] [CrossRef]
- Burga, C.A.; Krusi, B.; Egli, M.; Wernli, M.; Elsener, S.; Ziefle, M.; Fischer, T.; Mavris, C. Plant succession and soil development on the foreland of the Morteratsch glacier (Pontresina, Switzerland): Straight forward or chaotic? Flora 2010, 205, 561–576. [Google Scholar] [CrossRef]
- Dümig, A.; Smittenberg, R.; Kogel-Knabner, I. Concurrent evolution of organic and mineral components during initial soil development after retreat of the Damma glacier, Switzerland. Geoderma 2011, 163, 83–94. [Google Scholar] [CrossRef]
- Anderson, J.P.E.; Domsch, K.H. Quantities of plant nutrients in the microbial biomass of selected soils. Soil Sci. 1980, 130, 211–216. [Google Scholar] [CrossRef]
- Azam, F.; Yousaf, M.; Hussain, F.; Malik, K.A. Determination of biomass-N in some agricultural soils of Punjab, Pakistan. Plant Soil 1989, 113, 223–228. [Google Scholar] [CrossRef]
- Yu, Z.Y.; Chen, F.S.; Zeng, D.H.; Zhao, Q.; Chen, G.S. Soil inorganic nitrogen and microbial biomass carbon and nitrogen under pine plantations in zhanggutai sandy soil. Pedosphere 2008, 18, 775–784. [Google Scholar] [CrossRef]
- Asensio, V.; Covelo, E.F.; Kandeler, E. Soil management of copper mine tailing soils—Sludge amendment and tree vegetation could improve biological soil quality. Sci. Total Environ. 2013, 456, 82–90. [Google Scholar] [CrossRef] [PubMed]
- Anderson, J.D.; Ingram, L.J.; Stahl, P.D. Influence of reclamation management practices on microbial biomass carbon and soil organic carbon accumulation in semiarid mined lands of Wyoming. Appl. Soil Ecol. 2008, 40, 387–397. [Google Scholar] [CrossRef]
- Banning, N.C.; Grant, C.D.; Jones, D.L.; Murphy, D.V. Recovery of soil organic matter, organic matter turnover and nitrogen cycling in a post-mining forest rehabilitation chronosequence. Soil Biol. Biochem. 2008, 40, 2021–2031. [Google Scholar] [CrossRef]


© 2019 by the authors. Licensee MDPI, Basel, Switzerland. This article is an open access article distributed under the terms and conditions of the Creative Commons Attribution (CC BY) license (http://creativecommons.org/licenses/by/4.0/).