Article

Allometric Models for Predicting Aboveground Biomass of Trees in the Dry Afromontane Forests of Northern Ethiopia

1
Department of Land Resources Management and Environmental Protection, Mekelle University, Mekelle P.O. Box 231, Ethiopia
2
Faculty of Environmental Sciences and Natural Resource Management, Norwegian University of Life Sciences, P. O. Box 5003, 1432 Ås, Norway
*
Author to whom correspondence should be addressed.
Forests 2019, 10(12), 1114; https://doi.org/10.3390/f10121114
Submission received: 9 November 2019 / Revised: 27 November 2019 / Accepted: 4 December 2019 / Published: 6 December 2019
(This article belongs to the Section Forest Ecology and Management)

Abstract

:
Dry Afromontane forests form the largest part of the existing natural vegetation in Ethiopia. Nevertheless, models for quantifying aboveground tree biomass (AGB) of these forests are rare. The objective of this study was, therefore, to develop local multispecies and species-specific AGB models for dry Afromontane forests in northern Ethiopia and to test the accuracy of some potentially relevant, previously developed AGB models. A total of 86 sample trees consisting of ten dominant tree species were harvested to develop the models. A set of models relating AGB to diameter at breast height (DBH) or at stump height (DSH), height (H), crown area (CA), and wood basic density (ρ) were fitted. Model evaluation and selection was based on statistical significance of model parameter estimates, relative mean root-square-error (rMRSE), relative bias (rBias), and Akaike Information Criterion (AIC). A leave-one-out cross-validation procedure was used to compute rMRSE and rBias. The best multispecies model, which includes DSH, CA, and ρ as predictors, explained more than 95% of the variability in AGB. The best species-specific models for the two dominant species, with DBH or DSH as the sole predictor, also explained more than 96% of the variability in AGB. Higher biases from the previously published models compared to the best models from this study show the need to develop local models for more accurate biomass estimation. The developed models allow to quantify AGB with a high level of accuracy for our site, and they can potentially be applied in dry Afromontane forests elsewhere in Ethiopia if species composition and growing conditions are carefully evaluated before an application is done.

1. Introduction

Aboveground tree biomass (AGB) is an important variable used in quantifying and monitoring forest ecosystem services. Aboveground tree biomass in forest ecosystems is needed for many applications; it can be used to estimate the amount of carbon that forests can sequester or that can be emitted when forests are destroyed [1,2], it can be used to determine sustainable wood harvest [3], it provides information on how many resources are available for use [4], and it is important for assessing forest productivity [5,6]. For these and other applications, reliable and accurate biomass estimates are required.
Aboveground tree biomass can be determined directly, by harvesting all trees in a known area and weighing their biomass, or indirectly, by using an allometric model that relates forest biomass to a single or a combination of dendrometrical variables that are easy to measure such as diameter or height [7,8]. In addition to diameter or height, the importance of wood basic density as a predictor variable in AGB models has been confirmed in several studies (e.g., [9,10,11]). Furthermore, for shrubs or trees with multi-stem patterns, crown dimension could be a useful variable to explain the variability in biomass [12]. Although the direct method is the most accurate, it is impractical for large areas because it is time consuming and destructive [13]. Moreover, applying the direct method in protected or threatened forests is not always possible. Hence, use of allometric models is a commonly used method [14,15].
The accuracy of AGB estimation using allometric models is highly dependent on the use of appropriate models [11]. There are different arguments when it comes to choosing between the use of existing general (data from multiple sites) allometric models or to develop local (data from one site) allometric models for estimating biomass of a particular forest. Furthermore, general models can be developed for multiple species (general multispecies models) or for single species (general species-specific models). Similarly, local models can be developed for multiple species (local multispecies models) or for single species (local species-specific models). Because developing biomass models is costly, very often people prefer to adopt existing general (multispecies or species-specific) models from the literature rather than develop local models [16,17]. However, use of general models outside the locations reflecting the conditions on which they were developed can lead to significant biases in AGB estimations [15]. For instance, the general multispecies pan-tropical models developed by Chave et al. [10,11] have been used for estimating AGB of different forest types in many parts of the world, including Ethiopia. Nevertheless, there are many studies (e.g., [15,18,19]) that showed a significant bias in AGB for different forest types when these models were applied.
Local models may have limited use beyond the site for which they are developed. However, they generally provide less bias than general models [20] because tree growth characteristics are affected by local geographical conditions such as climate, soil properties, altitude, and land-use history [21]. As it is indicated by Mokria et al. [2], lack of local AGB estimation models is the main reason for persistent inaccuracy in biomass estimation, particularly in sub-Saharan Africa.
There have been some attempts to develop allometric models (mostly local species-specific) for estimating biomass of trees and shrubs in various parts of Ethiopia. In a review made by Henry et al. [22] on available AGB models in sub-Saharan Africa, 63 models addressing six species were registered from Ethiopia, of which 70% of the models were developed for eucalypt species. None of the models included multiple species. Even though there are developments after the review by Henry et al. [22], still very few models (e.g., [2,19]) are multispecies. Species-specific models can result in accurate biomass estimates. However, developing models for every species is not feasible in areas where there is high number of species because destructive sampling is limited by high costs and legal restrictions on tree harvesting. As it is suggested by Chave et al. [10], use of multispecies AGB models is a more feasible solution for tropical forests, which are characterized by high species diversity.
Dry Afromontane forests form the largest part of the existing natural vegetation in Ethiopia [23]. Nevertheless, AGB models developed particularly for these forests are rare. In the literature, we found only four published studies regarding AGB models developed for the Ethiopian Afromontane forests: (1) local species-specific models developed by Worku and Soromessa [24] for Juniperus procera Hochst. ex Endl. and Afrocarpus falcatus (Thunb.) R. Br. Ex Mirb. in Wof-Washa dry Afromontane forest using a non-destructive method; (2) local species-specific models developed by Tesfaye et al. [18] for Allophyllus abyssinicus (Hochst.) Radlk., Olea europaea L. subsp. cuspidata (Wall. ex DC.) Ciffieri., Olinia rochetiana A. Juss, Rhus glutinosa Hochst. Ex A. Rich., and Scolopia theifolia Gilg in Chilimo dry Afromontane forest; (3) local species-specific model developed by Kebede and Soromessa [25] for Olea europaea L. subsp. cuspidata (Wall. ex DC.) Ciffieri. in Mana Angetu moist Afromontane forest using a semi-destructive method; and (4) local species-specific models developed by Solomon et al. [26] for Juniperus procera Hochst. ex Endl. and Acacia abyssinica Hochst. ex Benth. in Gergera watershed.
The main objective of this study was to develop local AGB models for dry Afromontane forests in northern Ethiopia. More specifically, we aimed (1) to develop local multispecies models and local species-specific models for dominant tree species, (2) to develop models with different combinations of predictor variables to secure flexibility in application, and (3) to test the accuracy of some potentially relevant, previously developed AGB models on data from our study site.

2. Materials and Methods

2.1. Site Description

For this study, we selected Desa’a dry Afromontane forest, which is located in the northern part of the country (Figure 1). Desa’a is one of the few large remnants of the dry Afromontane forests of the Ethiopian plateau [23]. It is among the 58 National Forest Priority Areas designated to conserve the remaining natural forests of the country and their genetic resources [27]. The forest supplies a wide range of ecosystem services, including carbon storage. It is also home for many bird species [28] and plays a critical role in preventing the expansion of desert to the highlands by being a climatic buffer zone between the cool highlands of Tigray and the hot lowlands in Afar [29]. Moreover, the country’s Ministry of Environment, Forest and Climate Change (MEFCC) has identified Desa’a forest as one of the candidate areas for implementing the international climate change mitigation policy, REDD+ (reduced emissions from deforestation and degradation, plus sustainable forest management, conservation, and enhancement of carbon stock). There are also ongoing efforts to highlight the potential of the forest to be considered as a UNESCO biosphere reserve (personal communication) where the ecosystem services of the forest, in terms of climate change mitigation through carbon sequestration, is one of the criteria to be evaluated.
Desa’a forest is located 60 km northeast of Mekelle, the capital city of the Tigray region, Ethiopia. The total forest area is estimated to be 120,026 ha [30]. The forest is located in two administrative regions, namely Tigray and Afar, with the majority of the forest residing in the Tigray region (Figure 1). Geographically, the forest is situated between 13°18′ and 13°58′ North latitude and 39°35′ and 39°54′ East longitude. The altitude of the area ranges from 900 to 3000 m a.s.l. The area has a unimodal rainfall pattern, with the peak rainy season being from July to August [16]. Based on 10 years (2007–2016) of data from a nearby weather station, the area receives a mean annual rainfall of 532 mm, and the average temperature is 18 °C [29]. Desa’a forest is dominated by Juniperus procera Hochst. ex Endl. and Olea europaea L. subsp. Cuspidata (Wall. ex DC.) Ciffieri, which are characteristic species of Afromontane forests.

2.2. Data Collection

A dataset from a previous vegetation inventory, undertaken in Desa’a forest by WeForest project in 2017 [31] for a different purpose, was used to get information on species and diameter class distributions. In total, 303 plots of 20 × 20 m were sampled across Desa’a forest following a systematic grid (2 × 2 km) in this inventory. For all plots, all individual trees and shrubs were identified for their species and measured for diameter at breast height (DBH, at 1.3 m) and height. Information on basal area according to species was calculated and used to guide the selection of trees and shrubs (hereafter “trees”) for destructive sampling. Ten dominant tree species were selected, mainly based on their contribution to the total basal area of the forest. Dracaena ombet Kotschy & Peyr., an endangered species, was purposely excluded during the selection for destructive sampling, though its contribution to the total basal area (3.6%) was higher than some of the selected species. Then, individual trees of the selected species were stratified into six different DBH classes (2.5–10, 10.1–20, 20.1–30, 30.1–40, 40.1–50, and >50 cm), and, finally, a total of 86 trees were selected proportionally over these diameter classes. The selected species were Juniperus procera, Olea europaea, Rhus natalensis Bernh. ex Krauss, Acacia etbaica Schweinf, Calpurnia aurea Benth., Dodonaea angustifolia L. F., Cadia purpurea Ait, Tarchonanthus camphorantus L., Acokanthera schimperi (A. DC.) Benth. & Hook.f. ex Schweinf., and Euclea racemosa Murray subsp. Schimperi (A. DC) F. White (Table 1). The selected species contributed more than 76% of the total basal area of the forest, while only the first two species contributed more than 45%.
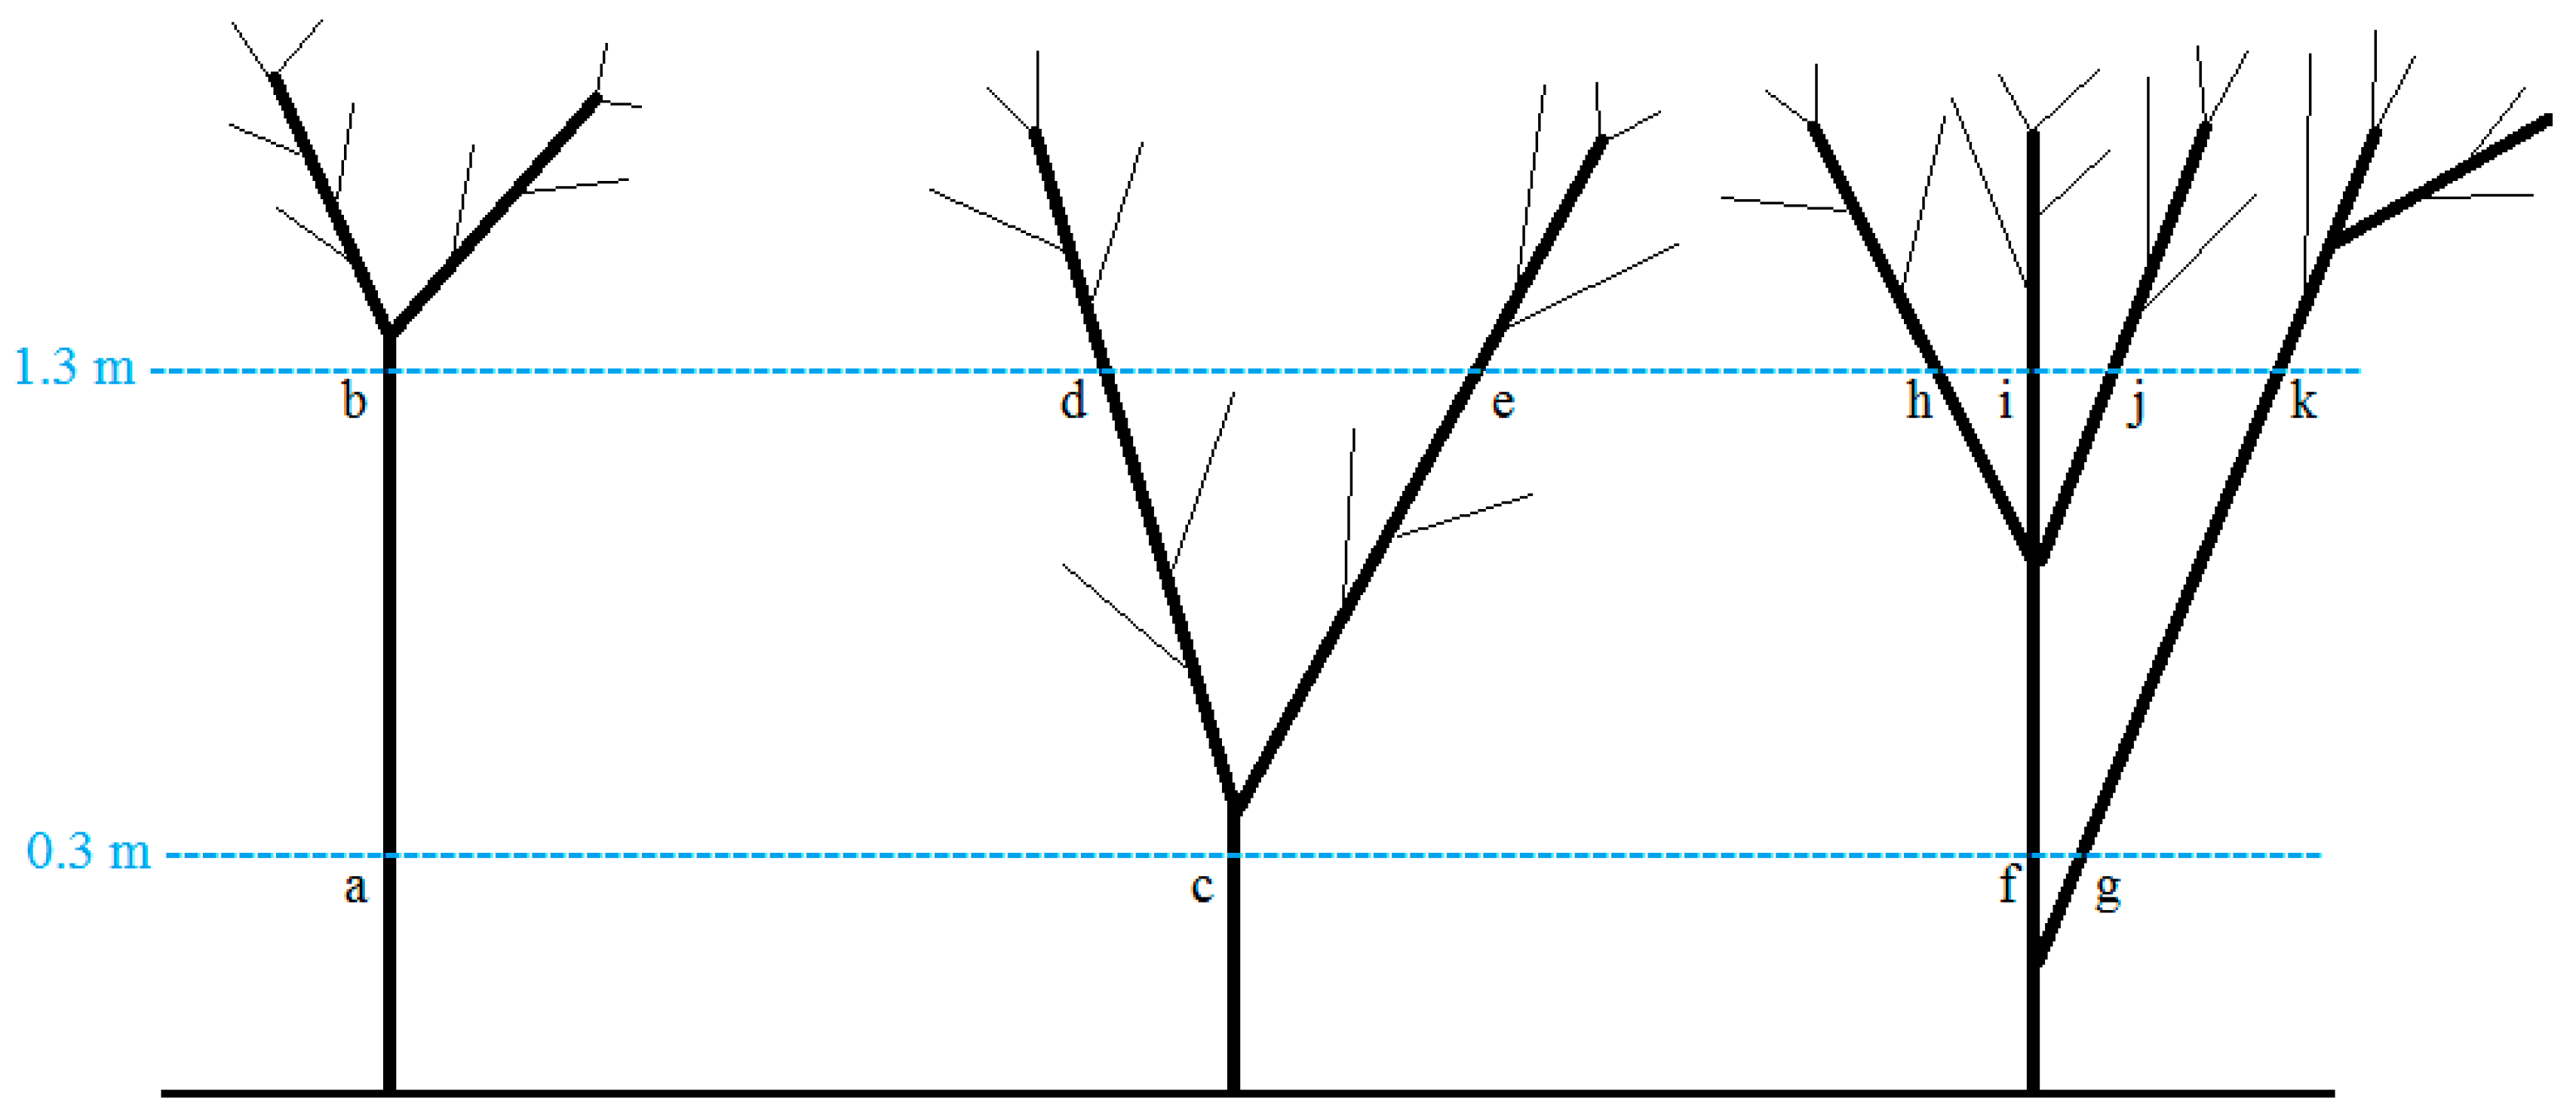
Before felling, diameter at stump height (DSH, at 0.3 m from the ground) and DBH were first measured. Figure 2 illustrates how these two variables were measured for different situations in this multi-stemmed environment.
For all cases of multiple stem diameter measurements, the diameter of a tree (DBH or DSH) was calculated as follows:
DBH   or   DSH   =   i n D i 2 ,
where Di is the diameter of the ith stem at the measurement height.
Finally, total height (H), widest crown diameter (CD1), and its perpendicular crown diameter (CD2) of each sample tree were measured. For multi-stemmed trees, a unified crown of all stems was considered as the crown of the tree. Crown diameters (CD1, CD2) were used to calculate crown area (CA) as follows.
CA   =   π CD 1   ×   CD 2 4 ,
Basic descriptive statistics on the selected trees are shown in Table 1.
After felling the trees, each tree was partitioned into three components: (1) stem, (2) branches with diameter ≥ 1 cm, and (3) twigs (leaves plus small branches with diameter < 1 cm). Then, each component was weighed separately for their fresh weight in field using a hanging balance (0–200 kg). Subsamples for dry weight estimation were collected from each tree component and weighed for their fresh weight using a digital balance with an accuracy of 0.001 kg in field. From each component, three subsamples were taken from twigs (large, medium, and small), from branches (large, medium, and small) and from stems (disks from three heights along the stem at 1.3 m from the ground, 50% of the total tree height and 85% of the total tree height). The subsamples were finally taken to the Mekelle University laboratory for drying. The stem and branch subsamples were oven-dried at 105 °C and the twig sub-samples at 75 °C until a constant weight was obtained. After drying, the three subsamples were averaged within each component. Then, total dry weight of each biomass component (TDWc) of each tree was calculated as:
TDW c   =   SDW c SFW c   ×   TFW c ,
where SDWc is subsample dry weight of component, SFWc is subsample fresh weight of component, and TFWc is total fresh weight of component. Total AGB of each tree was then obtained by summing the total dry weight for all components (Table 1, Figure 3).
Wood basic density (ρ, g cm−3) is defined as oven-dry mass divided by green volume [32,33]. For determination of ρ, after peeling off the bark, all sampled stem disks were saturated in a container of water for 30 min to restore their green volumes. Then, glassware with volumetric scales were partially filled with water, and each disk was immersed so that the green volume could be directly read from the displacement of water. Disks that could not be accommodated in the volumetric devices because of their sizes were immersed into a larger container overflowed with water, and green volume was measured as volume of displaced water from the container. Finally, the disks were oven-dried at a temperature of 105 °C and repeatedly weighed with an electronic scale (accuracy 0.001 kg) until a constant dry weight was attained. Wood basic density for each disk was determined as the ratio of oven-dry mass to green volume.
To determine ρ for each tree, three stem disks were used (i.e., from the lower (at 1.3 m height), middle (at 50% of the total height), and upper (at 85% of the total height) part of the stem for each tree). We used the arithmetic mean from the three disks as a mean ρ value for each tree: Juniperus procera (n = 15, mean = 0.6), Cadia purpurea (n = 6, mean = 0.82), Tarchonanthus camphorantus (n = 6, mean = 0.73), Calpurnia aurea (n = 3, mean = 0.73), Euclea racemosa (n = 3, mean = 0.67), and Acokanthera schimperi (n = 3, mean = 0.70). For the four remaining species, previous information on ρ values exists [34] (Olea europaea (n = 6, mean = 0.97), Acacia etbaica (n = 25, mean = 0.81), Rhus natalensis (n = 13, mean = 0.76), and Dodonaea angustifolia n = 18, mean = 0.82)); no sample disks were taken for these species.

2.3. Analyses

All statistical analysis were done using R software [35]. Before establishing the allometric models, we used a correlation matrix plot to explore the relationships between the response variable (AGB) and the potential predictor variables (DBH, DSH, H, CA, ρ). Aboveground biomass was significantly correlated with DBH (r = 0.91), DSH (r = 0.90), CA (r = 0.81), and H (r = 0.69) but was not significantly correlated with ρ (r = 0.14). Although ρ was not significantly correlated with AGB, we included it in our model testing because it varies considerably between different species [34] and is, therefore, considered as an important variable to explain variations in biomass for multispecies AGB models (e.g., [11,36]).
Because of the generally complex architecture of trees growing in Desa’a (Figure 2), and potential inconveniences and uncertainties related to DBH measurements, we decided to test model forms that comprised two different options: DBH-based models and DSH-based models. Although DBH is the most commonly measured variable in forest inventories and in most AGB models [22], DSH measurements are commonly applied in Ethiopia. This applies to both when developing AGB models and when estimating AGB based on sample plot inventories (e.g., [19,37,38,39]).
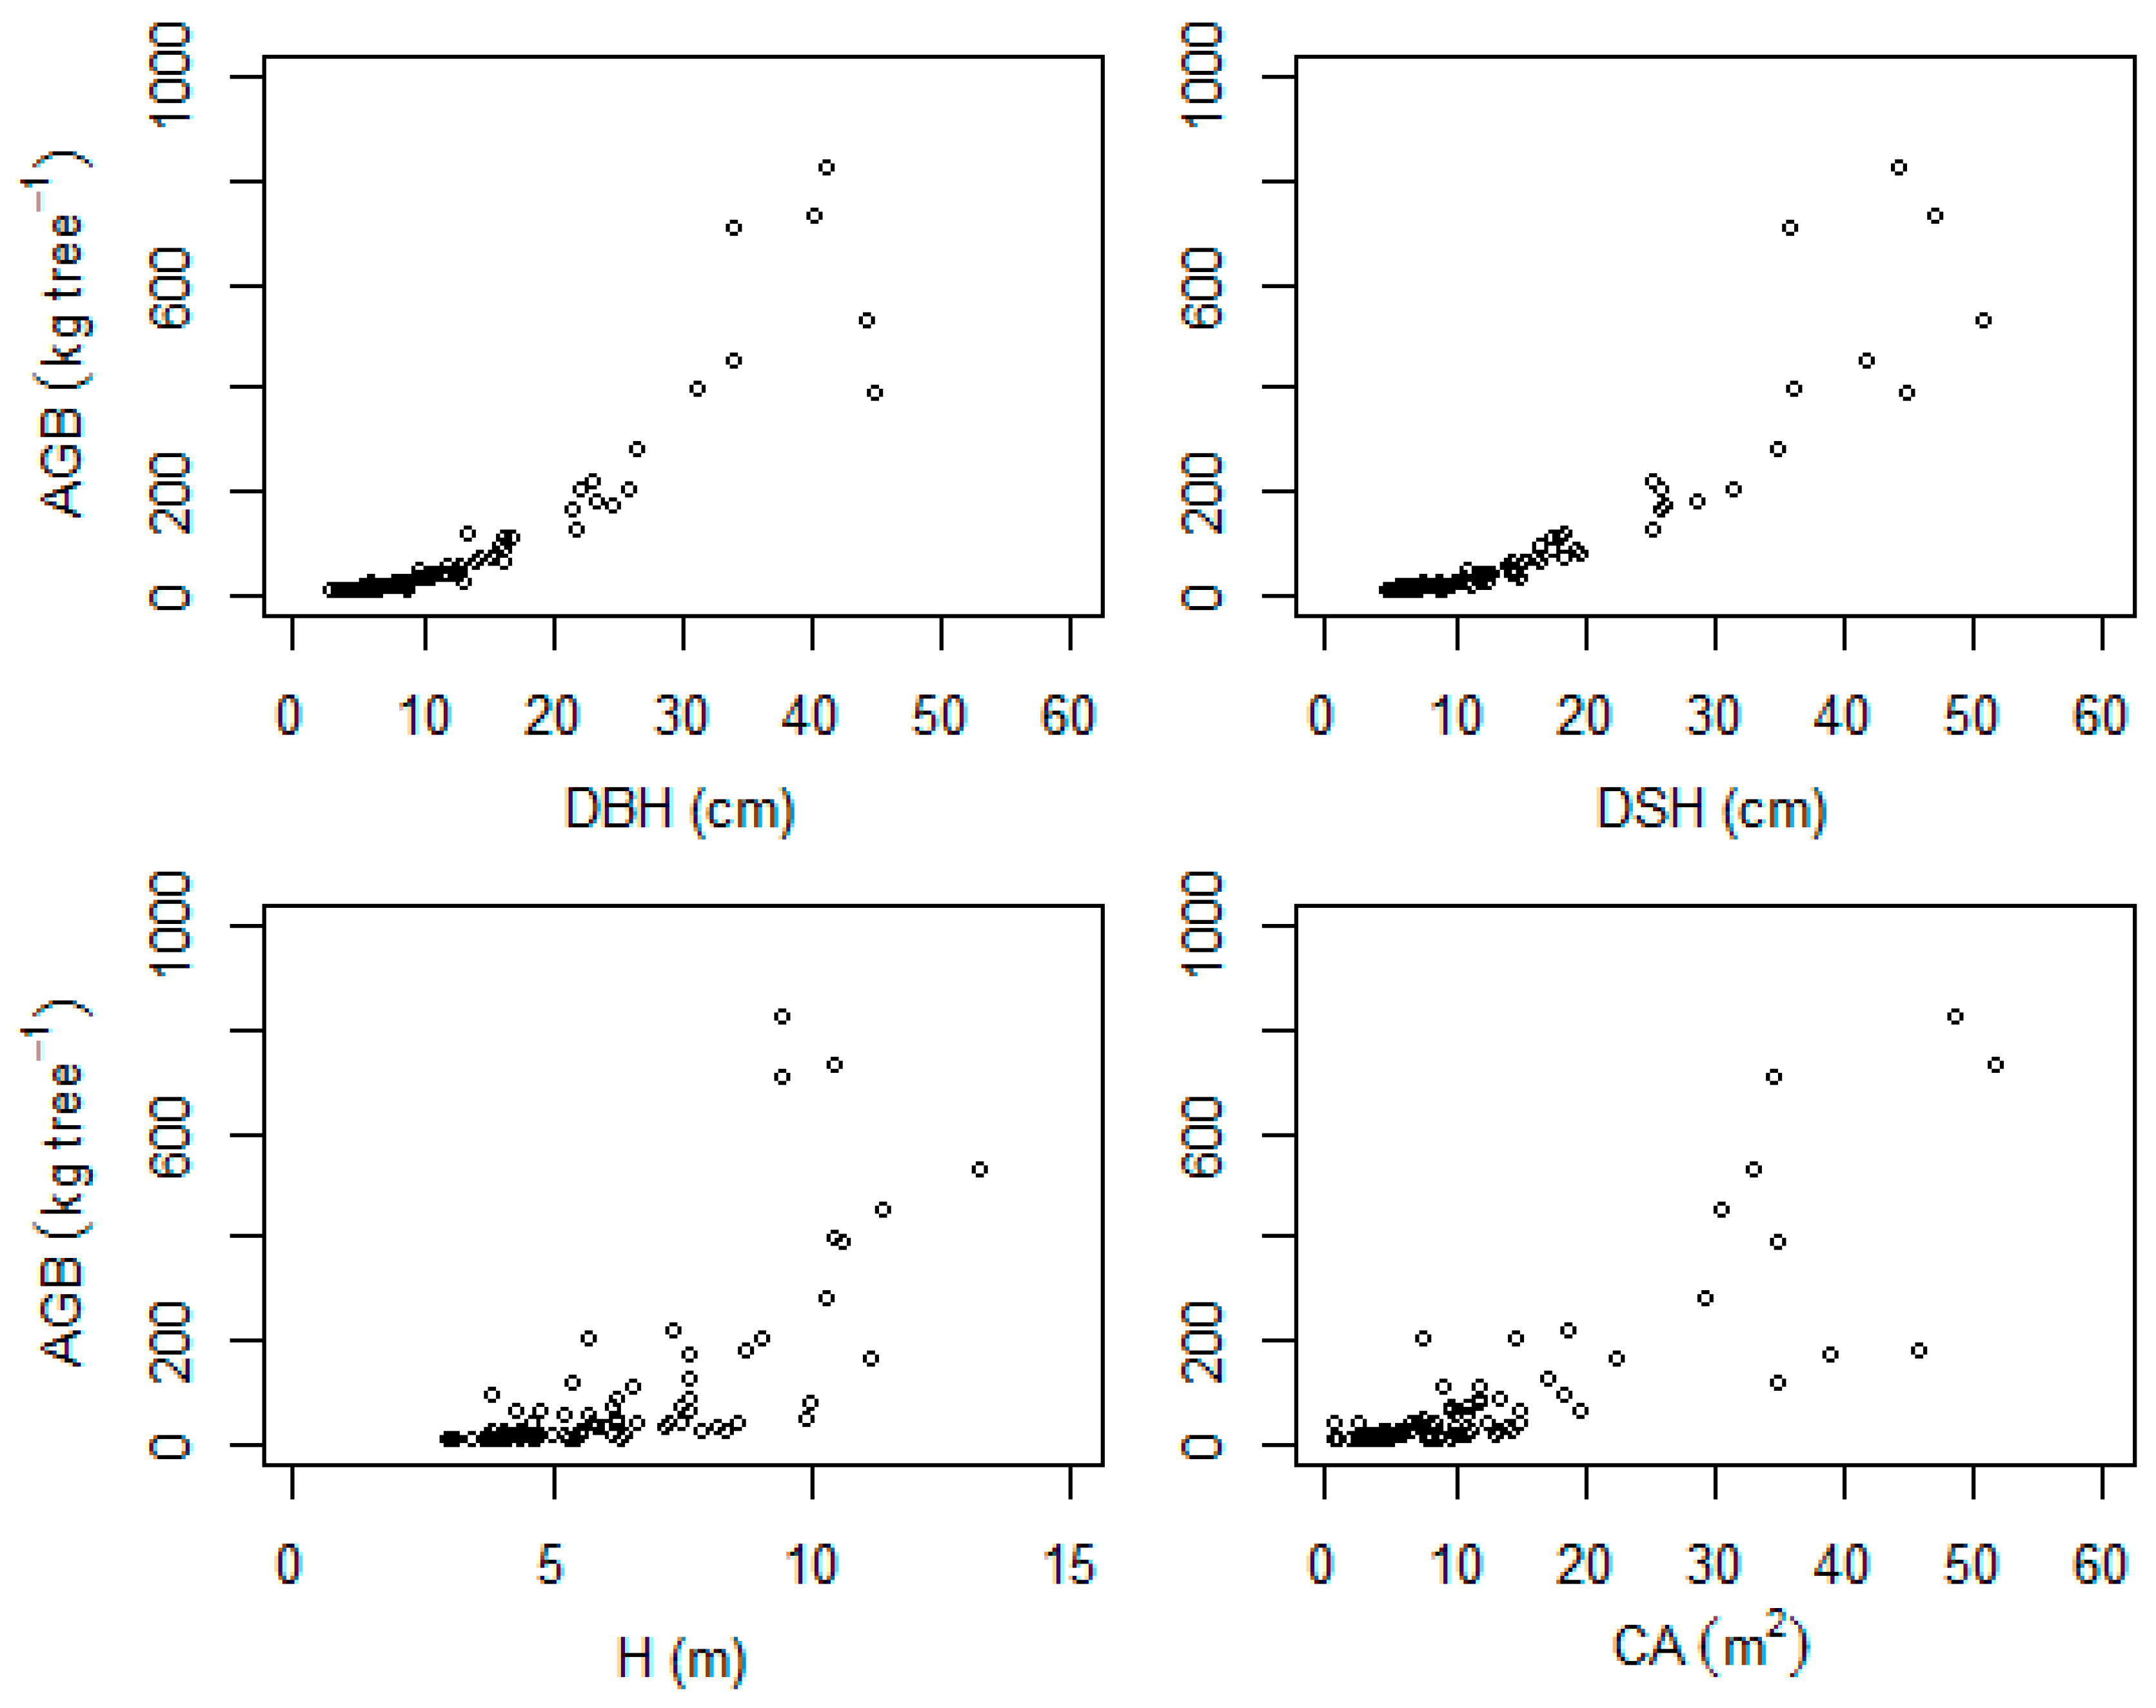
The scatter plots of AGB versus the potential predictor variables indicated nonlinear relationships (Figure 3). Hence, nonlinear model forms fitted by power functions were tested. Since tree diameters (DBH and DSH) were the variables having the highest correlation with AGB in our case, we formulated eight different model forms for testing using diameter (D, i.e., DBH or DSH) as the sole predictor and combined with a stepwise inclusion of H, CA, and ρ in the following way:
AGB   =   a   ×   D b ,
AGB   =   a   ×   D b   ×   H c ,
AGB   =   a   ×   D b   ×   ρ c ,
AGB   =   a   ×   D b   ×   H c   ×   CA d ,
AGB   =   a   ×   D b   ×   H c   ×   ρ d ,
AGB   =   a   ×   D b   ×   CA c   ×   ρ d ,
AGB   =   a   ×   D b   ×   H c   ×   CA d   ×   ρ e ,
where a, b, c, d, and e are parameter estimates.
We also wanted to explore two different ways of building up the portfolio of AGB models. First, in Model System I, we developed multispecies models based on the entire dataset (n = 86), and second, in Model System II, we developed species-specific models for the two dominant tree species, Juniperus procera (n = 23) and Olea europaea (n = 16), and multispecies models for all the other species in the dataset (n = 47). The models under each model system were divided into two options: a first option consisting of eight models with DBH as a sole predictor variable and in combination with the others (H, CA, and ρ), and a second option consisting of another eight models with DSH as a sole predictor variable and in combination with the others. This means that, in total, 16 models (M1–M16) were fitted under Model System I. Similarly, under Model System II, with two different options based on DBH and DSH, and two species-specific models and one multispecies model, we fitted a total of 48 different models. Among all the models under Model System II, only the best ones within each option are presented (i.e., for Juniperus procera (M17 and M18), for Olea europaea (M19 and M20), and for the other species (M21 and M22)).
When we evaluated the models, the residual plots exhibited heteroscedasticity (i.e., nonconstant residual variance); hence, we transformed the data using natural logarithm to account for the heteroscedasticity problem. Model comparison and selection was based on the following criteria: statistical significance of model parameters, relative root-mean-square error (rRMSE), relative bias (rBias), and Akaike Information criterion (AIC) [10]. A leave-one-out cross validation procedure [40] was used to compute rRMSE and rBias. In this procedure, a single observation was used for validation set and the remaining (n – 1) observations as a training set. Then, a prediction was made for the excluded observation, and this process was repeated on the “n – 1” observations. Repeating this procedure “n” times produced “n” test error estimations. The RMSE and Bias were computed based on the “n” test error estimations, and their relative values (rRMSE and rBias) were obtained by dividing to the mean of observed AGB as follows:
RMSE   =   1 n i = 1 n ( Y i   Y ^ i ) 2   ,   rRMSE ( % )   = RMSE Y ¯   ×   100 ,
Bias =   1 n i = 1 n ( Y i Y ^ i )   ,   rBias ( % )   =   Bias Y ¯   ×   100 ,
where Y i is observed AGB, Y ^ i is predicted AGB, Y ¯ is mean of observed AGB, and n is number of observations. The predicted values of AGB were used after back-transforming them to their original scale and correcting the bias introduced by logarithmic transformation. The correction factor (CF) for the bias was computed as [10].
CF   =   e ( RSE 2 2 ) ,
where RSE is residual standard error.
We also tested previously published general multispecies models and local species-specific models (Table 2) using our data set. We chose four general multispecies models developed by Chave et al. [10], Chave et al. [11], Ubuy et al. [19], and Mokria et al. [2] and three local species-specific models developed by Worku and Soromessa [24], Solomon et al. [26], and Kebede and Soromessa [25]. The models developed by Chave et al. [10] and Chave et al. [11] were chosen because they are supposed to be used generally in tropical regions. The models developed by Ubuy et al. [19] and Mokria et al. [2] were the only two multispecies models we found in literature that were developed using sample trees from Ethiopia. The species-specific models developed by Worku and Soromessa [24] and Solomon et al. [26] for Juniperus procera and by Kebede and Soromessa [25] for Olea europaea were the most relevant ones we found in literature based on sample trees from Ethiopia.

3. Results

The parameter estimates and statistical summary for the multispecies AGB models under Model System I are presented in Table 3. All models that included H as a predictor variable had nonsignificant model parameters estimate (p > 0.05) and were, therefore, not considered as valid. On the other hand, M1, M3, M4, and M7 (from the first option with DBH as predictor) and M9, M11, M12, and M15 (from the second option with DSH as predictor) all had significant model parameter estimates (p < 0.05). Generally, there were only small differences between the models regarding adjusted R2. Among the valid models, M7 and M15, respectively for the two options, were the best ones based on the statistical performance criteria (rRMSE, rBias, and AIC). The simple models using DBH and DSH solely as predictor variables (M1 and M9, respectively) both explained about 94% of the AGB variation but had higher rRMSE and rBias compared to the other valid models.
Among all the tested AGB models for two dominant species and for other species under Model System II, only those with DBH and DSH as sole predictor variables had significant parameter estimates (p < 0.05) (Table 4). Generally, the rBias values of these models were higher than those of the multispecies AGB models.
We predicted AGB of the 86 sample trees using the two systems and compared their biases (Table 5). In Model System I, we used the best multispecies models (M7 and M15). In Model System II, we used independently the best species-specific models for Juniperus procera and Olea europaea (M17 and M18 for Juniperus procera, and M19 and M20 for Olea europaea) and the best multispecies models for others (M21 and M22). Finally, an average bias was computed. Although the differences between observed and predicted values were not significantly different from zero, Model System I slightly underpredicted while Model System II overpredicted AGB.
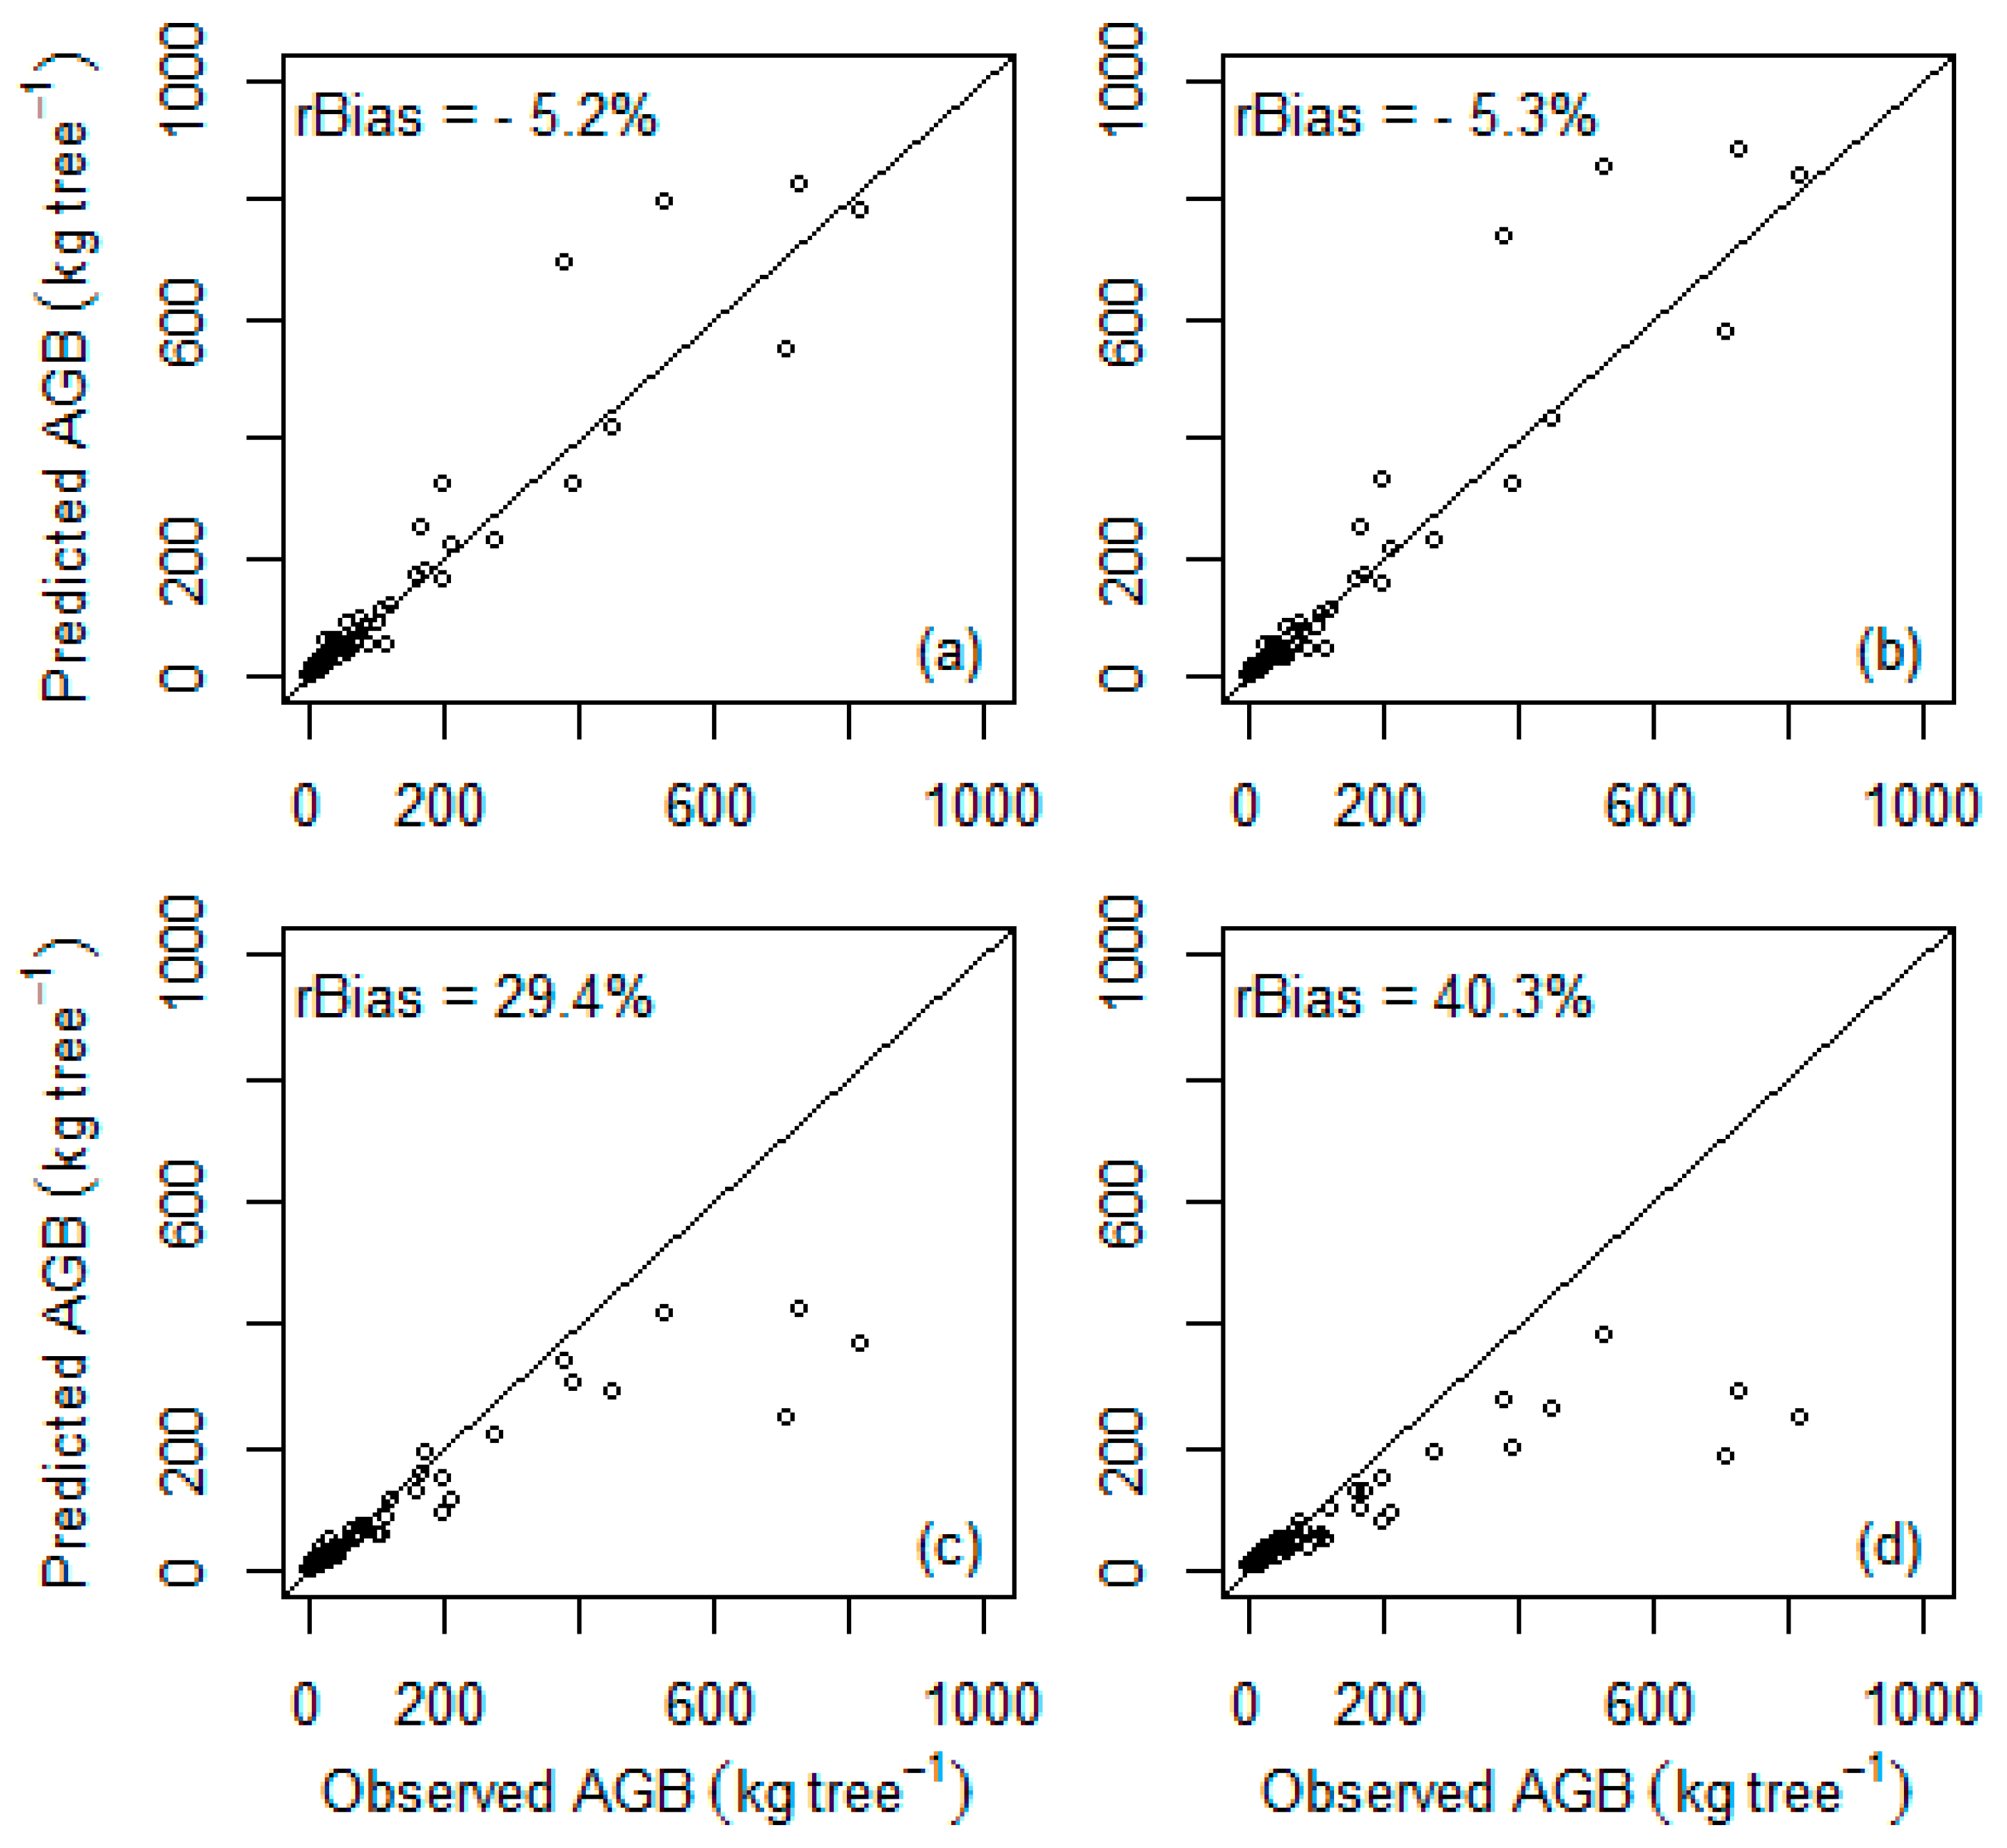
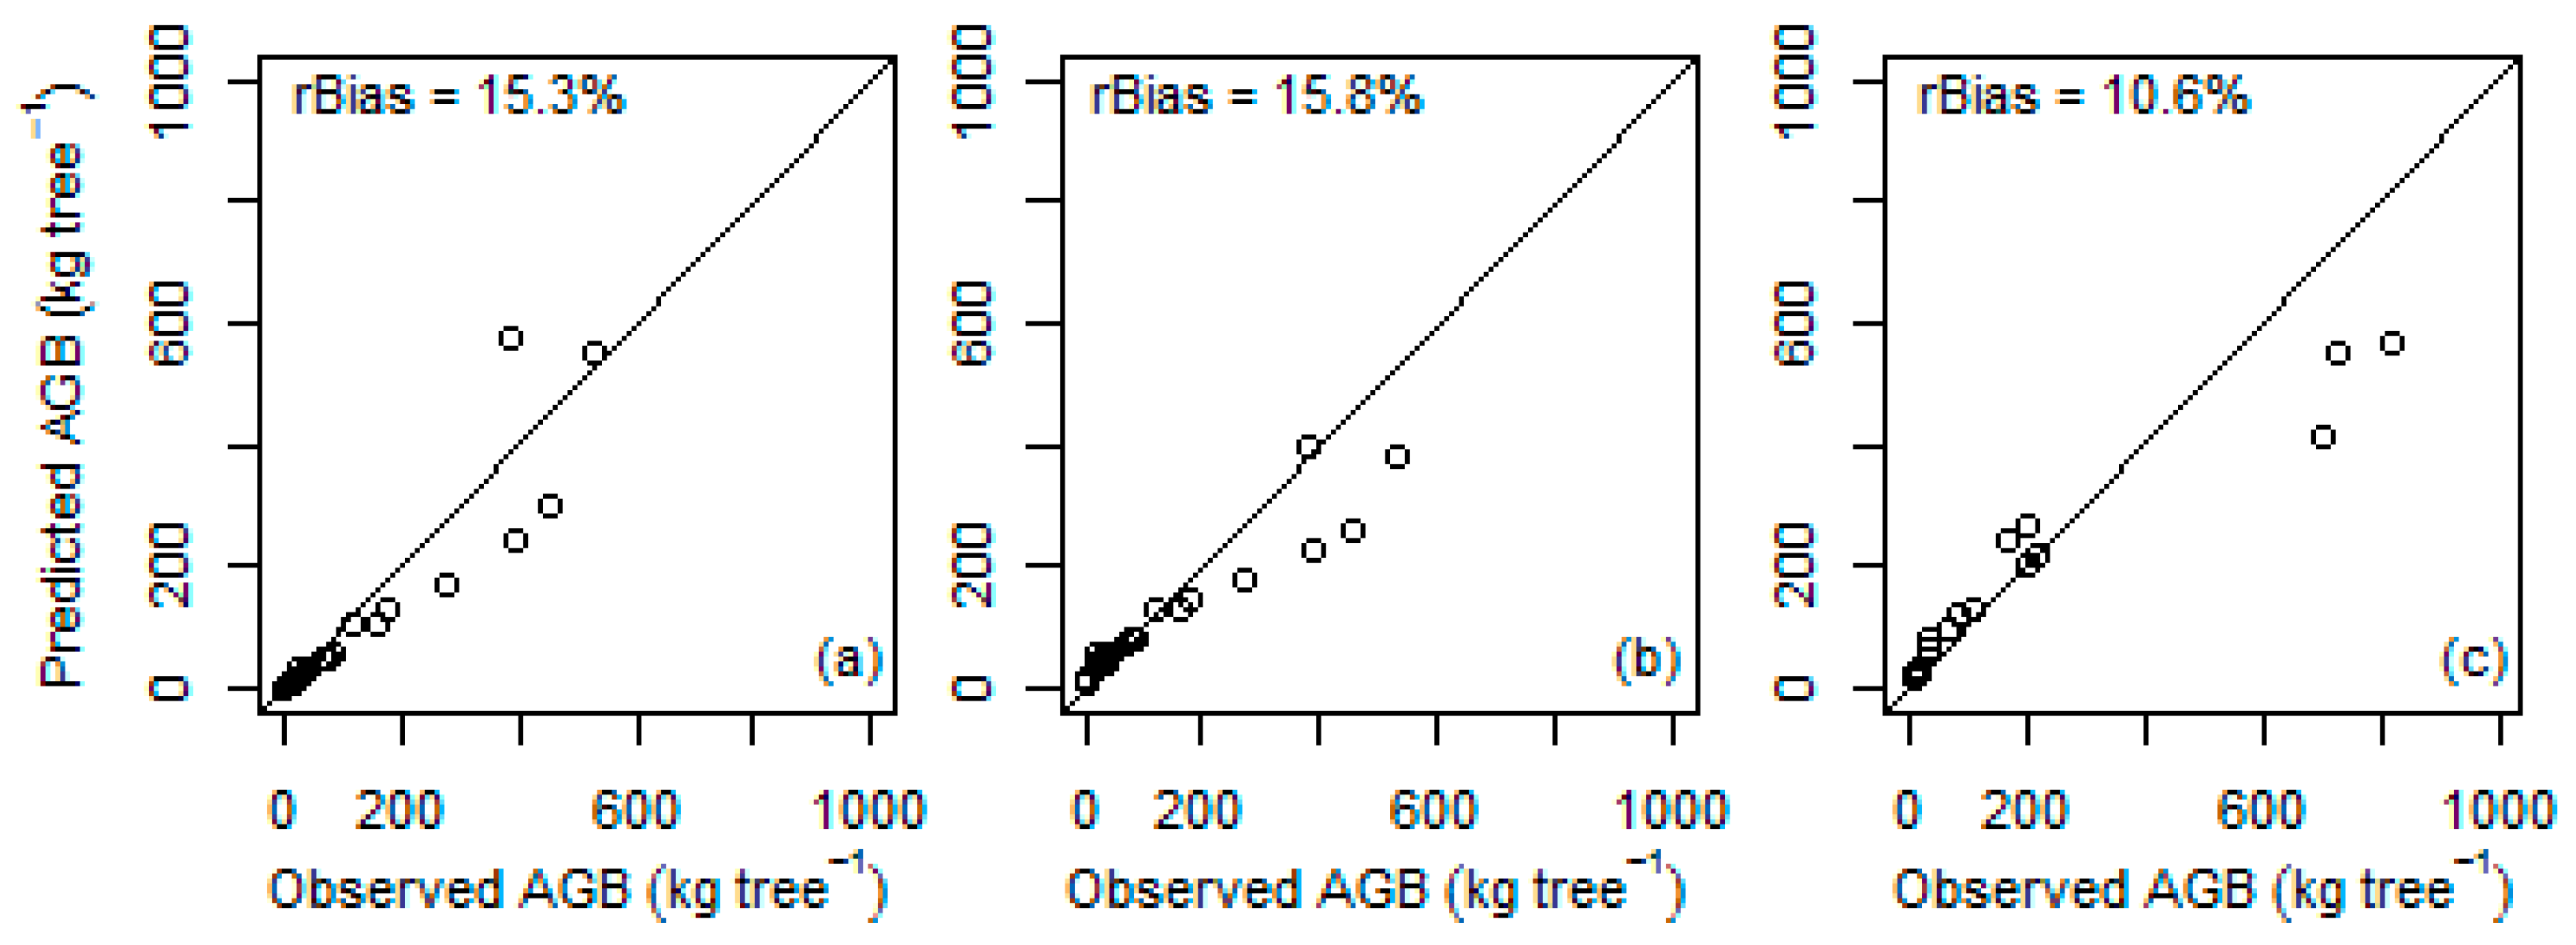
When the previously published general multispecies models were tested in our data set (Table 6, Figure 4), the models developed by Chave et al. [10] and Chave et al. [11] resulted in relatively low differences between observed and predicted values, which were not significantly different from zero (p > 0.05). On the other hand, the two general multispecies models developed by Ubuy et al. [19] and Mokria et al. [2] were significantly biased (p < 0.05) and underpredicted AGB by 29.4% and 40.3%, respectively. Similarly, when the previously developed species-specific models were tested, the differences between observed and predicted values were not significantly different from zero (Table 6, Figure 5).

4. Discussion

Use of a small sample size in the development of biomass models is a potential source of error in biomass estimation [10,41,42]. Particularly, this is mentioned as a limitation of local biomass models [15]. In the present study, we used 86 trees (consisting of ten dominant species, representing 76% of the total basal area of the forest) destructively sampled from a single site to develop local multispecies and species-specific biomass models. Considering the restrictions on destructive sampling in Ethiopia and costs associated with biomass measurement in general, the number of sample trees used in this study was much higher than in most previously published models based on data from the country.
We have used four commonly suggested predictor variables (i.e., DBH/DSH, H, CA, and ρ) to check their ability in explaining the variability in AGB. As confirmed in many studies, we found diameter (DBH/DSH) to be an important predictor variable explaining most of the variability (from about 94% and above). Several authors found stem diameter alone to be an effective predictor for AGB (e.g., [26,43]). In the review by Henry et al. [22] on available allometric models in sub-Saharan African forests, 63% of the biomass models used stem diameter (DBH) as a predictor variable along with other variables, which shows how important diameter is in explaining the variability in tree biomass.
Including tree height as a predictor variable in AGB models is usually recommended as it can improve model fit [44,45]. In our case, however, the inclusion of tree height did not improve the models. All models that included tree height as a predictor variable had nonsignificant model parameters for tree height. This could be due to frequent cutting and grazing activities in the forest [46] leading to more open-stand conditions where competition for light is low. Under such conditions, trees tend to invest more on radial growth than apical growth [47]. As a result of this, there will be limited increase in tree height while there is an increase in tree biomass, particularly as the tree gets older.
Crown dimension is known to vary greatly between species, reflecting different strategies of carbon allocation [48]. In our case, integrating crown area as a predictor variable for the multispecies models resulted in significant improvements regarding the goodness-of-fit criteria (rRMSE, rBias, and AIC). In support of our result, significant reduction in biases have been reported in many studies when crown dimension was taken into account in biomass models of different tropical forests [19,48,49].
Wood basic density variation in tropical tree species is high [50], particularly in dry forests [34,51]. Hence, including wood basic density as a predictor variable in multispecies AGB models is highly recommended by many authors [9,10,11,41]. As expected, the inclusion of wood basic density as a predictor variable improved the model fit in the case of multispecies models. But, wood basic density was not a significant predictor of AGB in the species-specific models, which implies that wood basic density variation within a species is narrow.
It can be difficult to measure DBH in woodlands and open forests where trees are short, with high basal ramification, resulting in large crown areas. The same applies to forests where trees are repeatedly cut and are therefore coppice. In such cases, the use of DSH measurements for predicting tree AGB would be a better option. Since Desa’a forest, and similar forests in Ethiopia, are largely dominated by shrub species and often cut [46], providing models with both options gives an advantage to use either DBH- or DSH-based models for estimating AGB depending on the availability of data. When there is a need to quantify the biomass removed in illegal cutting, the DSH-based models gives the opportunity to estimate AGB of harvested trees directly from measurements of stump diameter [43,52].
All models with significant model parameter estimates (Table 3) can potentially be applied for estimating AGB depending on the availability of data from a forest inventory. All models explained more than 94% of the variability in AGB with less than 5% bias. If data on tree DSH, CA, and ρ are available, the best model (M15) should be applied. Although it is important to incorporate all appropriate structural tree variables that affect variation in AGB [49], the use of a single and easy measurable variable is beneficial [47], especially when it is able to explain much of the variability. In our case, the two simple models, M1 and M9, which uses only DBH or DSH as a predictor variable, provided more or less the same predictive power (adjusted R2 = 0.94) as those including several predictor variables. Since many forest inventories are restricted to stem diameter measurements [45], it would be more convenient and cost effective to apply the simple models (M1 or M9) for estimating AGB.
It is not surprising that the best local multispecies model from this study performed better than the previously published general models (Table 6). Such a result also emphasizes the importance to develop local models to get more accurate biomass estimations when local estimates are required [9,18]. The two pan-tropical general multispecies models developed for dry tropical forests [10] and for all tropical forests [11] gave relatively good predictions with nonsignificant differences for our site (5.2% and 5.3% respectively). In agreement with our findings, Vieilledent et al. [51] found that the model by Chave et al. [10] performed well for dry forests in Madagascar. Contrary to our findings, significant biases were reported when the models by Chave et al. [10,11] were applied to data sets from other dry tropical forests [18,19,53].
The two general multispecies models by Ubuy et al. [19] and Mokria et al. [2] developed for exclosures resulted in significant biases (29.4% and 40.3%, respectively) when tested on our data. Our study site is found in the same geographical region (Tigray region) where the study by Ubuy et al. [19] was conducted. Similarly, the model by Mokria et al. [2] is based on sample trees from Ethiopia (Amhara region). But, trees in exclosures are relatively younger compared to the trees growing in Desa’a forest (i.e., climax forest) because the exclosures are at the early stage of succession. Hence, applying biomass models developed for exclosures to a climax forest can lead to considerable bias in biomass estimates, especially for larger trees (Figure 4). This suggests that different models should be developed for different forest types even if they are found in the same geographical regions.
Also, the local species-specific models by Worku and Soromessa [24] and by Solomon et al. [26] for Juniperus procera and by Kebede and Soromessa [25] for Olea europaea resulted in relatively large differences between observed and predicted values, although not significantly different from zero, when tested on our data. These results as well confirmed the need to develop local models also for individual species.
Although the models developed in this study are local, they can potentially be applied in dry Afromontane forests elsewhere in Ethiopia since no general models previously have been developed for this particular forest type. However, it is important at least to evaluate species composition and growing conditions related to rainfall and temperature before an application is done. For instance, applying the models developed in this study for moist Afromontane forests may not be appropriate, as the species composition and growing conditions in dry and moist areas are different. Information on rainfall and temperature may easily be derived from nearby weather stations. It is also likely that information on species distribution from a sample plot inventory is available in a situation where application of the models is under consideration, but if not, at least the presence of Juniperus procera and Olea europaea should be assessed because these two species represent almost half of the basal area observed in the study site where the data used for model development were collected. In the future, more data from other Afromontane forests in Ethiopia should be added to the present data in order to develop general models that cover a larger portion of this forest type in Ethiopia.

5. Conclusions

We provided different options for local multispecies and species-specific AGB models that can be used for different situations. In addition to DBH-based models, we provided DSH-based models because DSH might be easier to measure in multi-stemmed environments. We also provided optional models where diameters can be combined with different predictor variables depending on what is available from a forest inventory. All models in this study having all their model parameters significant should perform well in predicting AGB. Provided that DSH, CA, and ρ of a tree are available from the field inventory, the best multispecies model from this study (M15) will yield the most accurate AGB. However, when considering simplicity and inventory costs, our general recommendation is to use either M1 or M9, with DBH and DSH, respectively, as the only predictor variable. The best species-specific models for the two dominant species were those with DBH or DSH as sole predictor variables. Tests of some previously developed models on our data resulted in biases. This confirmed the need for developing local models to obtain accurate AGB estimates. Our models can potentially be applied in dry Afromontane forests elsewhere in Ethiopia. However, it is important to evaluate species composition, particularly the presence of Juniperus procera and Olea europaea, and growing conditions related to rainfall and temperature, before such an application is done.

Author Contributions

B.A.T. was responsible for the development of the research design, data collection, data analysis, and manuscript development. E.B. took part in the development of the research design, data analysis, and manuscript editing. M.M.R. took part in the analysis and in the manuscript editing. T.E. took part in the development of the research design, data analysis, and manuscript development.

Funding

This study was supported by MU-HU-NMBU institutional collaboration (phase IV) project (CRPO/CDANR/PhD/MU-NMBU/008/2010).

Acknowledgments

We thank WeForest project for sharing the inventory data that we used to get information on species and diameter class distribution of the forest for selecting representative trees for destructive sampling. We also thank all data collectors and the local community of Desa’a for their cooperation in the field work. Finally, we acknowledge the constructive comments and suggestions made by the two reviewers.

Conflicts of Interest

The authors declare no conflicts of interest.

References

  1. Shirima, D.D.; Munishi, P.K.T.; Lewis, S.L.; Burgess, N.D.; Marshall, A.R.; Balmford, A.; Swetnam, R.D.; Zahabu, E.M. Carbon storage, structure and composition of miombo woodlands in Tanzania’s Eastern Arc Mountains. Afr. J. Ecol. 2011, 49, 332–342. [Google Scholar] [CrossRef]
  2. Mokria, M.; Mekuria, W.; Gebrekirstos, A.; Aynekulu, E.; Belay, B.; Gashaw, T.; Bräuning, A. Mixed-species allometric equations and estimation of aboveground biomass and carbon stocks in restoring degraded landscape in northern Ethiopia. Environ. Res. Lett. 2018, 13, 24022. [Google Scholar] [CrossRef]
  3. Chidumayo, E.N. Is charcoal production in Brachystegia-Julbernardia woodlands of Zambia sustainable? Biomass Bioenergy 2019, 125, 1–7. [Google Scholar] [CrossRef]
  4. Ngugi, M.R.; Neldner, V.J.; Ryan, S.; Lewis, T.; Li, J.; Norman, P.; Mogilski, M. Estimating potential harvestable biomass for bioenergy from sustainably managed private native forests in Southeast Queensland, Australia. For. Ecosyst. 2018, 5. [Google Scholar] [CrossRef]
  5. Dube, T.; Gara, T.W.; Mutanga, O.; Sibanda, M.; Shoko, C.; Murwira, A.; Masocha, M.; Ndaimani, H.; Hatendi, C.M. Estimating forest standing biomass in savanna woodlands as an indicator of forest productivity using the new generation WorldView-2 sensor. Geocarto Int. 2016, 33, 178–188. [Google Scholar] [CrossRef]
  6. Worbes, M.; Raschke, N. Carbon allocation in a Costa Rican dry forest derived from tree ring analysis. Dendrochronologia 2012, 30, 231–238. [Google Scholar] [CrossRef]
  7. Brown, S. Estimating Biomass and Biomass Change of Tropical Forests: A Primer; Volume 134 of FAO Forestry Paper; Food and Agriculture Organization A Forest Resources Assessment publication: Rome, Italy, 1997. [Google Scholar]
  8. Henry, M.; Besnard, A.; Asante, W.A.; Eshun, J.; Adu-Bredu, S.; Valentini, R.; Bernoux, M.; Saint-André, L. Wood density, phytomass variations within and among trees, and allometric equations in a tropical rainforest of Africa. For. Ecol. Manag. 2010, 260, 1375–1388. [Google Scholar] [CrossRef]
  9. Basuki, T.M.; van Laake, P.E.; Skidmore, A.K.; Hussin, Y.A. Allometric equations for estimating the above-ground biomass in tropical lowland Dipterocarp forests. For. Ecol. Manag. 2009, 257, 1684–1694. [Google Scholar] [CrossRef]
  10. Chave, J.; Kira, T.; Chambers, J.Q.; Eamus, D.; Fölster, H.; Higuchi, N.; Andalo, C.; Cairns, M.A.; Ogawa, H.; Fromard, F.; et al. Tree allometry and improved estimation of carbon stocks and balance in tropical forests. Oecologia 2005, 145, 87–99. [Google Scholar] [CrossRef]
  11. Chave, J.; Chidumayo, E.; Ploton, P.; Saldarriaga, J.G.; Mencuccini, M.; Ortiz-Malavassi, E.; Vieilledent, G.; Muller-Landau, H.C.; Búrquez, A.; Eid, T.; et al. Improved allometric models to estimate the aboveground biomass of tropical trees. Glob. Chang. Biol. 2014, 20, 3177–3190. [Google Scholar] [CrossRef]
  12. Conti, G.; Enrico, L.; Casanoves, F.; Díaz, S. Shrub biomass estimation in the semiarid Chaco forest: A contribution to the quantification of an underrated carbon stock. Ann. For. Sci. 2013, 70, 515–524. [Google Scholar] [CrossRef] [Green Version]
  13. Vashum, K.T.; Jayakumar, S. Methods to Estimate Above-Ground Biomass and Carbon Stock in Natural Forests—A Review. J. Ecosyst. Ecography 2012, 2. [Google Scholar] [CrossRef]
  14. Chave, J.; Condit, R.; Lao, S.; Caspersen, J.P.; Foster, R.B.; Hubbell, S.P. Spatial and temporal variation of biomass in a tropical forest: Results from a large census plot in Panama. J. Ecol. 2003, 91, 240–252. [Google Scholar] [CrossRef]
  15. Ngomanda, A.; Obiang, N.L.E.; Lebamba, J.; Mavouroulou, Q.M.; Gomat, H.; Mankou, G.S.; Loumeto, J.; Iponga, D.M.; Ditsouga, F.K.; Koumba, R.Z.; et al. Site-specific versus pantropical allometric equations: Which option to estimate the biomass of a moist central African forest? For. Ecol. Manag. 2013, 312, 1–9. [Google Scholar] [CrossRef]
  16. Mokria, M.; Gebrekirstos, A.; Aynekulu, E.; Bräuning, A. Tree dieback affects climate change mitigation potential of a dry afromontane forest in northern Ethiopia. For. Ecol. Manag. 2015, 344, 73–83. [Google Scholar] [CrossRef]
  17. Wondrade, N.; Dick, O.B.; Tveite, H. Estimating above Ground Biomass and Carbon Stock in the Lake Hawassa Watershed, Ethiopia by Integrating Remote Sensing and Allometric Equations. For. Res. Open Access 2015, 4. [Google Scholar] [CrossRef] [Green Version]
  18. Tesfaye, M.A.; Bravo-Oviedo, A.; Bravo, F.; Ruiz-Peinado, R. Aboveground biomass equations for sustainable production of fuelwood in a native dry tropical afro-montane forest of Ethiopia. Ann. For. Sci. 2016, 73, 411–423. [Google Scholar] [CrossRef] [Green Version]
  19. Ubuy, M.H.; Eid, T.; Bollandsås, O.M.; Birhane, E. Aboveground biomass models for trees and shrubs of exclosures in the drylands of Tigray, northern Ethiopia. J. Arid Environ. 2018, 156, 9–18. [Google Scholar] [CrossRef]
  20. Feyisa, K.; Beyene, S.; Megersa, B.; Said, M.Y.; Angassa, A. Allometric equations for predicting above-ground biomass of selected woody species to estimate carbon in East African rangelands. Agrofor. Syst. 2016, 92, 599–621. [Google Scholar] [CrossRef]
  21. Yuen, J.Q.; Fung, T.; Ziegler, A.D. Review of allometric equations for major land covers in SE Asia: Uncertainty and implications for above- and below-ground carbon estimates. For. Ecol. Manag. 2016, 360, 323–340. [Google Scholar] [CrossRef]
  22. Henry, M.; Picard, N.; Trotta, C.; Manlay, R.J.; Valentini, R.; Bernoux, M.; Saint-André, L. Estimating tree biomass of sub-Saharan African forests: A review of available allometric equations. Silva Fenn. 2011, 45, 477–569. [Google Scholar] [CrossRef] [Green Version]
  23. Giday, K. Management Interventions to Assist Restoration of Degraded Dry Afromontane Forest N. Ethiopia. Ph.D. Thesis, KU Leuven University, Leuven, Belgium, 2013. [Google Scholar]
  24. Worku, E.; Soromessa, T. Allometric Equation for Biomass Determination in Juniperus procera Endl. and Podocarpus falcatus Mirb of Wof-Washa Forest: Implication for Climate Change Mitigation. Am. J. Life Sci. 2015, 3, 190–202. [Google Scholar] [CrossRef] [Green Version]
  25. Kebede, B.; Soromessa, T. Allometric equations for aboveground biomass estimation of Olea europaea L. subsp. cuspidata in Mana Angetu Forest. Ecosyst. Health Sustain. 2018, 4, 1–12. [Google Scholar] [CrossRef] [Green Version]
  26. Solomon, N.; Birhane, E.; Tadesse, T.; Treydte, A.C.; Meles, K. Carbon stocks and sequestration potential of dry forests under community management in Tigray, Ethiopia. Ecol. Process. 2017, 6, 20. [Google Scholar] [CrossRef]
  27. Woldemichael, L.; Bekele, T.; Nemomissa, S. Vegetation Composition in Hugumbirda-Gratkhassu National Forest Priority Area, South Tigray. Momona Ethiop. J. Sci. 2011, 2, 27–48. [Google Scholar] [CrossRef]
  28. BirdLife International. Available online: http://datazone.birdlife.org/site/factsheet/dessaa-forest-iba-ethiopia (accessed on 2 March 2019).
  29. Berihu, T.; Girmay, G.; Sebhatleab, M.; Berhane, E.; Zenebe, A.; Sigua, G.C. Soil carbon and nitrogen losses following deforestation in Ethiopia. Agron. Sustain. Dev. 2017, 37. [Google Scholar] [CrossRef] [Green Version]
  30. Hishe, H.; Giday, K.; Neka, M.; Soromessa, T.; Van Orshoven, J.; Muys, B. Detection of Olea europaea subsp. cuspidata and Juniperus procera in the dry Afromontane forest of northern Ethiopia using subpixel analysis of Landsat imagery. J. Appl. Remote Sens. 2015, 9, 95975. [Google Scholar] [CrossRef] [Green Version]
  31. WeForest. Available online: https://www.weforest.org/project/ethiopia-desaa (accessed on 14 March 2019).
  32. Wiemann, M.C.; Williamson, G.B. Density and Specific Gravity Metrics in Biomass Research; General Technical Report, FPL-GTR-208; USDA Forest Service, Forest Products Laboratory: Madison, WI, USA, 2012. [Google Scholar]
  33. Williamson, G.B.; Wiemann, M.C. Measuring wood specific gravity...correctly. Am. J. Bot. 2010, 97, 519–524. [Google Scholar] [CrossRef] [Green Version]
  34. Ubuy, M.H.; Eid, T.; Bollandsås, O.M. Variation in wood basic density within and between tree species and site conditions of exclosures in Tigray, northern Ethiopia. Trees 2018, 32, 967–983. [Google Scholar] [CrossRef]
  35. R Core Team. R: A Language and Environment for Statistical Computing; R Foundation for Statistical Computing: Vienna, Austria, 2018. [Google Scholar]
  36. Kachamba, D.J.; Eid, T.; Gobakken, T. Above- and belowground biomass models for trees in the miombo woodlands of Malawi. Forests 2016, 7, 38. [Google Scholar] [CrossRef] [Green Version]
  37. Eshete, G.; Ståhl, G. Functions for multi-phase assessment of biomass in acacia woodlands of the Rift Valley of Ethiopia. For. Ecol. Manag. 1998, 105, 79–90. [Google Scholar] [CrossRef]
  38. Giday, K.; Eshete, G.; Barklund, P.; Aertsen, W.; Muys, B. Wood biomass functions for Acacia abyssinica trees and shrubs and implications for provision of ecosystem services in a community managed exclosure in Tigray, Ethiopia. J. Arid Environ. 2013, 94, 80–86. [Google Scholar] [CrossRef]
  39. Birhane, E.; Treydte, A.C.; Eshete, A.; Solomon, N.; Hailemariam, M. Can rangelands gain from bush encroachment? Carbon stocks of communal grazing lands invaded by Prosopis juliflora. J. Arid Environ. 2017, 141, 60–67. [Google Scholar] [CrossRef]
  40. James, G.; Witten, D.; Hastie, T.; Tibshirani, R. An Introduction to Statistical Learning; Springer: New York, NY, USA, 2000; Volume 7, ISBN 9780387781884. [Google Scholar]
  41. Van Breugel, M.; Ransijn, J.; Craven, D.; Bongers, F.; Hall, J.S. Estimating carbon stock in secondary forests: Decisions and uncertainties associated with allometric biomass models. For. Ecol. Manag. 2011, 262, 1648–1657. [Google Scholar] [CrossRef]
  42. Roxburgh, S.H.; Poul, K.I.; Clifford, D.; England, J.R.; John Raison, R. Guidelines for constructing allometric models for the prediction of woody biomass: How many individuals to harvest? Ecosphere 2015, 6, 1–27. [Google Scholar] [CrossRef] [Green Version]
  43. Guedes, B.S.; Sitoe, A.A.; Olsson, B.A. Allometric models for managing lowland miombo woodlands of the Beira corridor in Mozambique. Glob. Ecol. Conserv. 2018, 13, e00374. [Google Scholar] [CrossRef]
  44. Feldpausch, T.R.; Lloyd, J.; Lewis, S.L.; Brienen, R.J.W.; Gloor, M.; Monteagudo Mendoza, A.; Lopez-Gonzalez, G.; Banin, L.; Abu Salim, K.; Affum-Baffoe, K.; et al. Tree height integrated into pantropical forest biomass estimates. Biogeosciences 2012, 9, 3381–3403. [Google Scholar] [CrossRef] [Green Version]
  45. Rutishauser, E.; Noor’an, F.; Laumonier, Y.; Halperin, J.; Hergoualch, K.; Verchot, L. Generic allometric models including height best estimate forest biomass and carbon stocks in Indonesia. For. Ecol. Manag. 2013, 307, 219–225. [Google Scholar] [CrossRef]
  46. Aynekulu, E. Forest Diversity in Fragmented Landscapes of Northern Ethiopia and Implications for Conservation. Ph. D. Thesis, Bonn-University, Bonn, Germany, 2011. [Google Scholar]
  47. Correia, A.C.; Faias, S.P.; Ruiz-Peinado, R.; Chianucci, F.; Cutini, A.; Fontes, L.; Manetti, M.C.; Montero, G.; Soares, P.; Tome, M. Generalized biomass equations for Stone pine (Pinus pinea L.) across the Mediterranean basin. For. Ecol. Manag. 2018, 429, 425–436. [Google Scholar] [CrossRef]
  48. Ploton, P.; Barbier, N.; Momo, S.T.; Rejou-Mechain, M.; Boyemba Bosela, F.; Chuyong, G.; Dauby, G.; Droissart, V.; Fayolle, A.; Calisto Goodman, R.; et al. Closing a gap in tropical forest biomass estimation: Taking crown mass variation into account in pantropical allometries. Biogeosciences 2016, 13, 1571–1585. [Google Scholar] [CrossRef] [Green Version]
  49. Goodman, R.C.; Phillips, O.L.; Baker, T.R. The importance of crown dimensions to improve tropical tree biomass estimates. Ecol. Appl. 2014, 24, 680–698. [Google Scholar] [CrossRef] [PubMed] [Green Version]
  50. Chave, J.; Condit, R.; Aguilar, S.; Hernandez, A.; Lao, S.; Perez, R. Error propagation and sealing for tropical forest biomass estimates. Philos. Trans. R. Soc. Lond. Ser. B Biol. Sci. 2004, 359, 409–420. [Google Scholar] [CrossRef] [PubMed]
  51. Vieilledent, G.; Vaudry, R.; Andriamanohisoa, S.F.D.; Rakotonarivo, O.S.; Randrianasolo, H.Z.; Razafindrabe, H.N.; Bidaud Rakotoarivony, C.; Ebeling, J.; Rasamoelina, M. A universal approach to estimate biomass and carbon stock in tropical forests using generic allometric models. Ecol. Appl. 2012, 22, 572–583. [Google Scholar] [CrossRef] [PubMed]
  52. Mugasha, W.A.; Manyanda, B.J.; Nzunda, E.F.; Malimbwi, R.E. Biomass and volume models based on stump diameter for assessing degradation of miombo woodlands in Tanzania. Int. J. For. Res. 2019, 2019, 1876329. [Google Scholar]
  53. Mugasha, W.A.; Eid, T.; Bollandsas, O.M.; Malimbwi, R.E.; Chamshama, S.; Zahabu, E.; Katani, J.Z. Allometric models for prediction of above- and belowground biomass of trees in the miombo woodlands of Tanzania. For. Ecol. Manag. 2013, 310, 87–101. [Google Scholar] [CrossRef]
Figure 1. Map of study site.
Forests 10 01114 g001
Figure 2. Illustration on how diameter at breast height (DBH) and diameter at stump height (DSH) were measured in different situations. For trees forking above 1.3 m, DSH was measured at 0.3 m (a) and DBH at 1.3 m (b). For trees forking below 1.3 m but above 0.3 m, DSH was measured at 0.3 m (c) and DBH was at 1.3 m (d,e). For trees forking below 0.3 m, DSH was measured at 0.3 m (f,g) and their DBH at 1.3 m (hk).
Forests 10 01114 g002
Figure 3. Scatter plot of tree aboveground tree biomass (AGB) vs. potential predictor variables.
Forests 10 01114 g003
Figure 4. Relationship between predicted and observed AGB of sample trees of all species pooled together (n = 86). (a) Chave et al. [10], (b) Chave et al. [11], (c) Ubuy et al. [19], (d) Mokria et al. [2]. The diagonal line shows a 1:1 relation. A positive and negative rBias indicates under- and over-prediction of AGB, respectively.
Forests 10 01114 g004
Figure 5. Relationship between predicted and observed AGB of Juniperus procera sample trees (n = 23) and Olea europaea sample trees (n = 16). (a) Worku and Soromessa [24] for Juniperus procera, (b) Solomon et al. [26] for Juniperus procera, and (c) Kebede and Soromessa [25] for Olea europaea. The diagonal line shows a 1:1 relation. A positive and negative rBias indicates under-and over-prediction of AGB, respectively.
Forests 10 01114 g005
Table 1. Mean and range of diameter at stump height (DSH), diameter at breast height (DBH), total height (H), and crown area (CA) of harvested sample trees.
SpeciesnDSH (cm)DBH (cm)H (m)CA (m2)
MeanRangeMeanRangeMeanRangeMeanRange
Juniperus procera Hochst. ex Endl.2321.25.2–51.018.14.2–45.28.55.4–13.317.10.7–69.2
Olea europaea L. subsp. Cuspidata (Wall. ex DC.) Ciffieri1621.65.1–47.319.34.6–41.26.63.5–10.517.02.7–51.9
Acacia etbaica Schweinf311.67.4–16.8105.7–16.03.73.0–4.18.83.3–18.7
Cadia purpurea Ait87.84.9–11.06.52.9–9.84.63.7–6.37.92.7–13.2
Tarchonanthus camphorantus L.710.15.7–16.79.35.3–16.34.83.9–7.711.05.9–19.9
Calpurnia aurea Benth.69.35.7–12.88.44.7–11.86.04.4–8.69.65.9–15.2
Euclea racemose Murray subsp. Schimperi (A. DC) F. White46.15.1–7.85.43.6–8.13.73.2–4.47.62.9–14.4
Acokanthera schimperi (A. DC.) Benth. & Hook.f. ex Schweinf.410.78.8–15.07.55.6–124.43.8–5.76.64.5–11.0
Rhus natalensis Bernh. ex Krauss79.45.4–14.48.44.3–12.24.53.1–5.69.03.6–15.2
Dodonaea angustifolia L. F.810.25.3–18.68.64.8–16.55.23.8–6.69.61.2–35.2
All8614.84.9–51.012.82.9–45.26.13.0–13.312.60.7–69.2
Table 2. Previously published models tested using the data set from this study.
Model Type Expression Reference
General multispecies (pan-tropical)AGB = 0.112 × (DBH2 × H × ρ)0.916Chave et al. [10]
General multispecies (pan-tropical)AGB = 0.0673 × (DBH2 × H × ρ)0.976Chave et al. [11]
General multispecies (Ethiopia)AGB = 0.3102 × DSH1.5155 × CW0.6453Ubuy et al. [19]
General multispecies (Ethiopia)AGB = 0.2451 × (DSH2 × H)0.7038Mokria et al. [2]
Local species-specific (Ethiopia)ln(AGB) = ln(−2.48) + 2.32 × ln(DBH)Worku and Soromessa [24]
Local species-specific (Ethiopia)AGB = 1.12 × DBH1.54Solomon et al. [26]
Local species-specific (Ethiopia)AGB = 0.866 × DBH1.432 × H0.608 × ρ1.067Kebede and Soromessa [25]
AGB is aboveground biomass in kg, DBH is diameter at breast height in cm, DSH is diameter at stump height in cm, H is total height in m, ρ is wood basic density in g cm−3, and CW is crown width in m.
Table 3. Model parameter estimates and statistical summary of multispecies AGB models under Model System I.
ModelModel ExpressionParameter Estimatesadj-R2rRMSE (%)rBias (%)AIC
aBcde
M1AGB = a × DBHb0.2982.034 0.93574.64.464.2
M2AGB = a × DBHb × Hc 0.3342.112−0.170 ns 0.93574.04.465.3
M3AGB = a × DBHb × CAc0.3101.8590.168 0.94069.33.558.8
M4AGB = a × DBHb × ρc0.3362.0410.473 0.93862.63.961.0
M5AGB = a × DBHb × Hc × CAd0.3271.902−0.080 ns0.163 0.94069.33.660.6
M6AGB = a × DBHb × Hc × ρd0.3272.0160.055 ns0.505 0.93862.33.862.9
M7AGB = a × DBHb × CAc × ρd0.3501.8640.1710.485 0.94356.93.054.8
M8AGB = a × DBHb × Hc × CAd × ρe0.3171.7600.199 ns0.1850.6000.94354.62.655.9
M9AGB = a × DSHb0.1702.128 0.94171.22.455.9
M10AGB = a × DSHb × Hc 0.1782.170−0.087 ns 0.94170.32.457.7
M11AGB = a × DSHb × CAc0.1841.9510.165 0.95666.81.650.1
M12AGB = a × DSHb × ρc0.1962.1410.625 0.95754.71.847.7
M13AGB = a × DSHb × Hc × CAd0.1851.957−0.011 ns0.164 0.94566.81.652.1
M14AGB = a × DSHb × Hc × ρd0.1792.0450.209 ns0.738 0.95754.31.448.4
M15AGB = a × DSHb × CAc × ρd0.2131.9650.1640.624 0.95250.40.940.9
M16AGB = a × DSHb × Hc × CAd × ρe0.1871.7990.316 ns0.1820.7950.95349.70.239.7
ns = nonsignificant model parameter estimates (p > 0.05); bold: best models according to performance criteria.
Table 4. Model parameter estimates and statistical summary of the best AGB models according to the performance criteria for two dominant species and for other species under Model System II.
ModelSpeciesnModel ExpressionParameter Estimatesadj-R2rRMSE (%)rBias (%)AIC
ab
M17Juniperus procera23AGB = a × DBHb0.1612.1990.96674.1−10.75.6
M18Juniperus procera23AGB = a × DSHb0.0952.2500.98237.2−5.6−8.8
M19Olea europaea16AGB = a × DBHb0.1732.2500.96843.7−11.88.6
M20Olea europaea16AGB = a × DSHb0.1252.2790.94844.73.116.3
M21Other species47AGB = a × DBHb0.4541.8480.81513.31.042.6
M22Other species47AGB = a × DSHb0.1902.1000.8469.90.933.9
“Other species” refers to all species except the two dominant ones.
Table 5. Predictive accuracy of Model System I and II for the 86 sample trees.
ModelOption/ModelObserved Mean (kg)Predicted Mean (kg)rRMSE (%)rBias (%)
System IDBH/M788.786.452.02.6 ns
DSH/M1588.788.346.50.4 ns
System IIDBH/M17, M19, M2188.789.055.8−0.4 ns
DSH/M18, M20, M2288.788.947.4−0.2 ns
nsp > 0.05. rRMSE is relative root mean-square-error. rBias is relative bias.
Table 6. Predictive accuracy of previously published models using our data set.
Model TypeReferencesnObserved Mean (kg)Predicted Mean (kg)rRMSE (%)rBias (%)
General multispeciesChave et al. [10]8688.793.360.1−5.2 ns
General multispeciesChave et al. [11]8688.793.568.3−5.3 ns
General multispeciesUbuy et al. [19]8688.762.693.229.4 **
General multispeciesMokria et al. [2]8688.752.9118.740.3 **
Local species-specificWorku and Soromessa [24]23132.1112.050.915.3 ns
Local species-specificSolomon et al. [26]23132.1178.650.615.8 ns
Local species-specificKebede and Soromessa [25]16213.3190.751.510.6 ns
** p < 0.01 and ns p > 0.05. n is number of sample trees. rBias is relative bias.