Article

Understory Plant Functional Types Alter Stoichiometry Correlations between Litter and Soil in Chinese Fir Plantations with N and P Addition

Jiangxi Provincial Key Laboratory of Silviculture, Jiangxi Agricultural University, Nanchang 330045, China
*
Author to whom correspondence should be addressed.
Forests 2019, 10(9), 742; https://doi.org/10.3390/f10090742
Submission received: 25 July 2019 / Revised: 16 August 2019 / Accepted: 23 August 2019 / Published: 28 August 2019
(This article belongs to the Special Issue Nutrient Cycling in Forest Ecosystems)

Abstract

:
Research Highlights: This study identifies the effect of nitrogen (N) and phosphorus (P) addition on stoichiometry correlations between understory plants and soil in subtropical Chinese fir plantations. Background and Objectives: Nitrogen and P are two nutrients limiting forest ecosystem production. To obtain more wood production, N and P are usually applied in plantation management. Changes in soil N and P will generally alter the stoichiometric characteristics of understory plants, which control carbon (C) and nutrient cycles between plants and soil. However, different correlations between plant and soil stoichiometry among functional groups of understory plants have not been investigated, which also impacted element cycling between plants and soil. Materials and Methods: Subtropical Chinese fir plantations were selected for N (100 kg ha−1 year−1) and P (50 kg ha−1 year−1) addition study. We collected fresh litter and the corresponding soil of four understory plants (Lophatherum gracile Brongn., Woodwardia japonica (L.f.) Sm., Dryopteris atrata (Kunze) Ching and Dicranopteris dichotoma (Thunb.) Berhn.) for study of C, N, and P stoichiometric ratios. Results: Nitrogen and P addition affected C, N, and P concentrations and stoichiometric ratios in litter and soil as well as correlations between litter and soil stoichiometric ratios. Understory plant species with different functional types impacted the correlations between plants and soil in C, N, and P stoichiometric ratios, especially correlations between litter C and soil C and N. Conclusions: Changes in soil N and P affect the stoichiometric ratios of understory plants. Functional groups impacted the correlation in C, N, and P stoichiometric ratios between plants and soil, indicating functional groups varied in their impacts on element cycling between plants and soil in plantations with exogenous nutrient addition, which should be considered in future management of plantations with intensive fertilization practice.

1. Introduction

Combining stoichiometry with biology, chemistry, and physics, ecological stoichiometry addresses the balance of carbon (C), nitrogen (N), and phosphorus (P) [1]. Carbon, N, and P, which act on nutrient cycling and utilization, play a very important role in the nutrient cycling process of the ecosystem and ecological stoichiometry [2]. Thus, numerous scholars focus on ecological stoichiometry [3]. Studying the stoichiometric characteristics of C, N, and P of the forest ecosystem can provide insight into the stability of the forest ecosystem in a certain region; in addition, it can clarify the proportion of the demand for environmental nutrients by plants and the drivers of change. Moreover, studying the stoichiometric characteristics in forest ecosystems can uncover the amount of nutrients returned to the soil from plant litter, as well as the nutrient supply of soil to plants in the ecosystem [4,5]. The C:N:P ratio of forest ecosystems has been shown to be significantly different with different vegetation types, climatic factors, and environmental factors [3,6,7]. The input of N and P directly changes the environmental factors of the forest ecosystem, and the addition of N and P affects the structure, function, and nutrient cycles of forest ecosystem [8]. Nitrogen inputs affect forest ecosystems in different ways. For example, N addition may cause an increase in leaf biomass and photosynthetic efficiency, and reduce the number of thin roots [9,10]. Nitrogen and P addition acts directly on leaves. Nitrogen and P addition leads to changes in the correlation of the stoichiometric ratio between plants and soil, affecting plant productivity and species diversity in communities, finally resulting in a change in the forest ecosystem [11,12,13,14]. Nitrogen addition reduced the C:N ratio and increased the N:P ratio of leaves, thus affecting the N and P balance in plants, resulting in the restriction of plant growth by P or N and P, thus reducing the productivity of the ecosystem [14,15]. The addition of P to the soil generally increases the P content in plant tissues and reduces the N:P ratio [16,17]. Nitrogen addition promotes P absorption in subtropical plants and accelerates plant growth, but the results are different from those in some temperate forests [18,19,20]. Therefore, to a large extent, the nutrient status of leaves can reflect a plant’s environmental status; there is a close relationship between leaf nutrient status and soil stoichiometric ratio [21].
Research has shown that the effect of N and P addition on vegetation type was related to ecosystem type, time, and dose of N and P addition [22,23,24]. At present, research is increasing on the nutrient circulation of forest ecosystems with a focus on ecological stoichiometry. Due to the improvement of forest quality and the advantage of high canopy productivity, there are many studies on the C, N, and P ecological stoichiometry of the plant-litter-soil system [25,26]. However, most previously published studies have focused on overstory plant species, largely ignoring understory plant species, which have a faster C and N turnover rate than the overstory plants. Moreover, understory species tend to be more sensitive to environmental changes, which limits our understanding of the nutrient cycles of ecosystems [27]. Under the current state of global climate change, understory vegetation plays a very important role in the C and N cycle of forest ecosystems and helps to maintain forest biodiversity and ecosystem stability [28]. Understory vegetation plays an important ecological role in nutrient cycling, soil physical and chemical properties, and community succession [29,30,31]. Previous research has shown that the addition of N and P to soil changed the species richness of understory vegetation and reduced plant diversity, highlighting that more research is needed on common understory plant species [32,33,34].
Chinese fir (Cunninghamia lanceolata (Lamb.) Hook.) is widely distributed in 14 provinces in China, including Zhejiang, Jiangxi, and Hunan [35,36,37]. Chinese fir has a history of more than 1000 years of planting because it is one of the most important fast-growing timber species in southern China; therefore, it plays an irreplaceable role in economic and ecological benefits [38]. In recent years, the management of understory vegetation in plantations and the application of fertilizer have significantly influenced the productivity of forest ecosystems [39,40]. However, the stoichiometric responses of subtropical fir plantation litter and soil to persistent exogenous N and P input are still not clear. Therefore, under the global climate change, in order to improve our understanding for the interaction between plant and soil in plantation forests ecosystem, we studied the response of C, N, and P concentrations and stoichiometric characteristics of four representative plants (two different functional types) in the lower layer of Chinese fir plantation to the addition of N and P in the subtropical red land area. We try to solve the following problems: (1) What is the reaction of C, N, P concentration and stoichiometric ratio in plant litter and soil to N and P addition; (2) How does N or P addition affect the stoichiometric ratios of different functional plants litter and soil?

2. Materials and Methods

2.1. Study Sites

This study was conducted at the Qianyanzhou Ecological Research station in Taihe County, Ji’an City, Jiangxi Province, China (115°03′29.2″ E, 26°44′29.1″ N). The research site is a typical red hilly region with subtropical monsoonal climate. The annual average precipitation is up to 1600 mm and the annual average temperature is approximately 18 °C [41]. The experimental site is within the native distribution of Chinese fir. The study was conducted in an experimental Chinese fir plantation that was established approximately 15 years ago. The coverage of the sample plot was between 75 and 85%, and the slope was between 20 and 30°. The natural atmospheric N deposition in this area was 49 kg N ha−1 year−1 [42].

2.2. Experimental Design

The experiment began in November 2011, and four treatments (control: CK, N addition, P addition, and N and P addition together) were established. These four treatments were arranged in a random complete block design, with a total of four blocks. There were 16 of 20 × 20 m plots. To prevent influence between the plots, the spacing between plots was greater than 20 m. Nitrogen and P were applied first in December 2011 and then four times each year (March, June, September, and December). Nitrogen (100 kg ha−1 year−1) was added in the form of NH4NO3, and P (50 kg ha−1 year−1) was added in the form of NaH2PO4 [43]. To more evenly distribute N and P addition plots in the study site, we added sand (8 kg plot−1) in the N plots, phosphate plots, and control (CK) plots. For fertilization we chose a date where the forecast predicted no rain for four consecutive days [27].

2.3. Sample Collection

In November 2018, we investigated the presence or absence of understory species in the Chinese fir plantation in each plot. From this preliminary data, we selected four dominant species (Lophatherum gracile Brongn., Woodwardia japonica (L.f.) Sm., Dryopteris atrata (Kunze) Ching and Dicranopteris dichotoma (Thunb.) Berhn.), which appeared in all 16 plots and formed communities, as sampling targets. Four communities were randomly selected in each plot. To collect plant samples, five individual plants and the corresponding soils were collected from each plot. These samples were immediately brought back to the laboratory in cooler. After sampling, the four collected plants were divided into different functional types (Gramineae and ferns) for nutritional analysis.
The leaves of each plant from all plots were collected and combined to produce one leaf sample. Leaf samples were air-dried, and then ground to pass through 0.149 mm sieve for determination of C, N, and P. Sub-sample of air-dried leaves were oven dried at 60 °C to obtain dry mass of measured leaves without residual water content. Soil samples were also processed by removing visible plant debris and rocks, passed through a 0.149 mm sieve to determine elements, or passed through a 2 mm sieve for determination of available nutrients. Sub-samples of soils were oven dried to a constant weight to obtain water content in the air-dried soil.

2.4. Litter and Soil Nutrient Measurement

Fresh soil samples through a 2 mm sieve were used for the determination of soil dissolved organic C (DOC) (VarioTOC, Elementar, Germany) and available N (AN, including NH4+ and NO3) [44]. Soil/water (2:5) was used to determine the pH value of soil [44]. Air-dried soil samples that had been passed through a 2 mm sieve were used for the determination of soil available P (AP) [44]. We measured AN and AP with a flow injection auto analyzer (Smartchem 200 Alliance Corp. France). Before analyzing total organic C (TOC), total N (TN), and total P (TP) in litter and soil samples, we ground the litter and air-dried soil samples and passed them through a 0.149 mm sieve. Then, we used a digester (FOSS. Tecator Digestor 20) to digest plant litter and soil and used a flow injection auto analyzer to analyze the TN and TP of the digested products. The stoichiometric ratio of C, N, and P of litter and soil was reported as mass ratio.

2.5. Data Analysis

Using the One-way analysis of variance (ANOVA) for four kinds of plants soil DOC, NH4+, NO3, AN, AP, and pH difference analysis, when the difference is significant, using LSD (least significant difference) comparison (p = 0.05). Nested ANOVAs were used to analyze the effects of N addition (N), phosphorous addition (P), function type plant (f), and understory species (S, nested within Function type plant) on litter and soil C, N, and P and their stoichiometry. The variation trends of C, N, and P concentrations in the litter of two functional plants and the soil were fitted by one-dimensional regression equation. All statistical analyses were conducted by JMP 9.0 (SAS Institute, Cary, NC, USA).

3. Results

3.1. Availability of Soil Nutrients and Carbon, Nitrogen, and Phosphorus (CNP) Concentration of Plant Litter and Soil

Seven years after the annual addition of N and P to the plantation, we found that the soil of L. gracile has a higher NO3-N content compared with the other three understory species. Moreover, the AP content in the soil of Dicranopteris dichotoma is significantly lower than that of the other plants (p < 0.01). DOC, NH4+-N, AN, and pH do not change among the four understory plant species (Table 1). Among the four species, L. gracile has higher concentrations of C and N in litter and N and P in associated soil (Table A1). The litter C, N, and P and soil C concentrations of W. japonica are all low (Table A1). The litter and soil C concentrations of Dryopteris atrata are all higher than the other species (p < 0.01). The litter and soil P concentrations of Dicranopteris dichotoma are all low (Table 1).

3.2. Effects of N and P Addition on Carbon, Nitrogen, and Phosphorus (C, N, and P) Concentrations and Stoichiometric Ratios of Different Functional Groups

Litter C, N, and the C:N ratio were significantly affected by N addition, the plant functional group, understory species, and the randomized complete block design. Litter P and the C:P ratio depended on P addition, understory species, and the randomized complete block design (Table 2). Litter P also depended on understory species × P addition (“S × P[f]”). The N:P ratio of litter depended on P, N × P, and the plant functional group. However, the results varied with blocks except L N/P (Table 2).

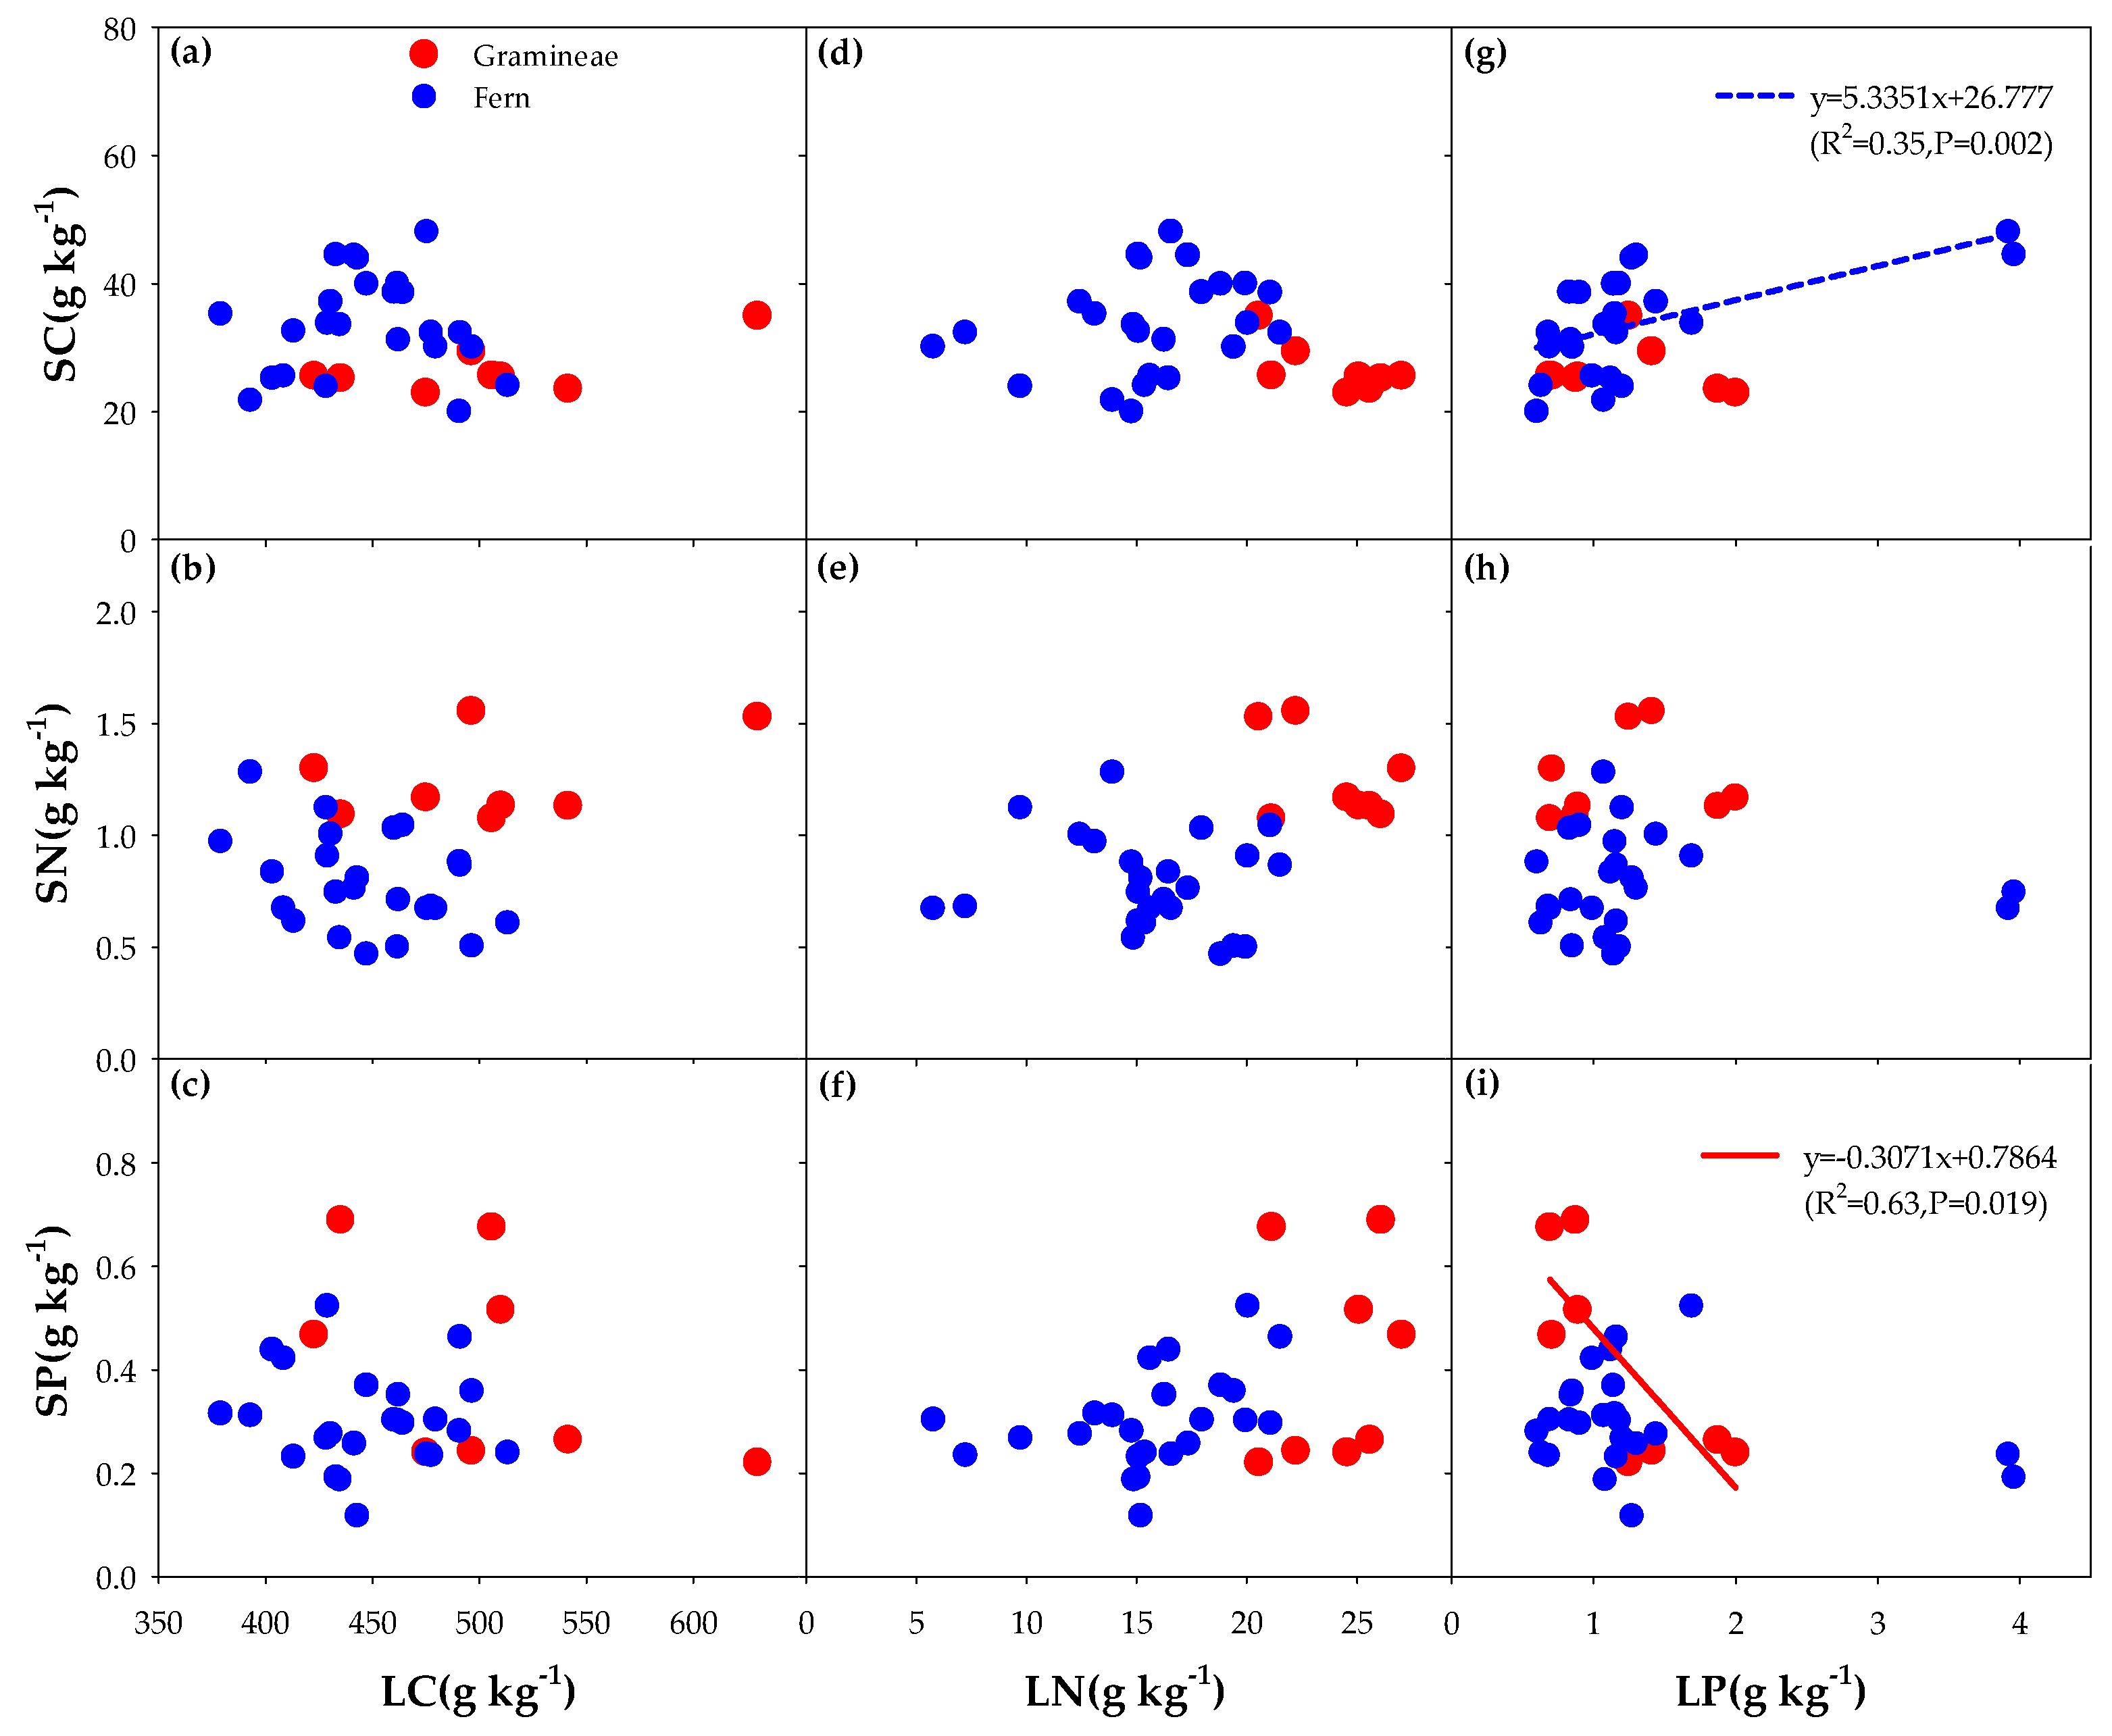
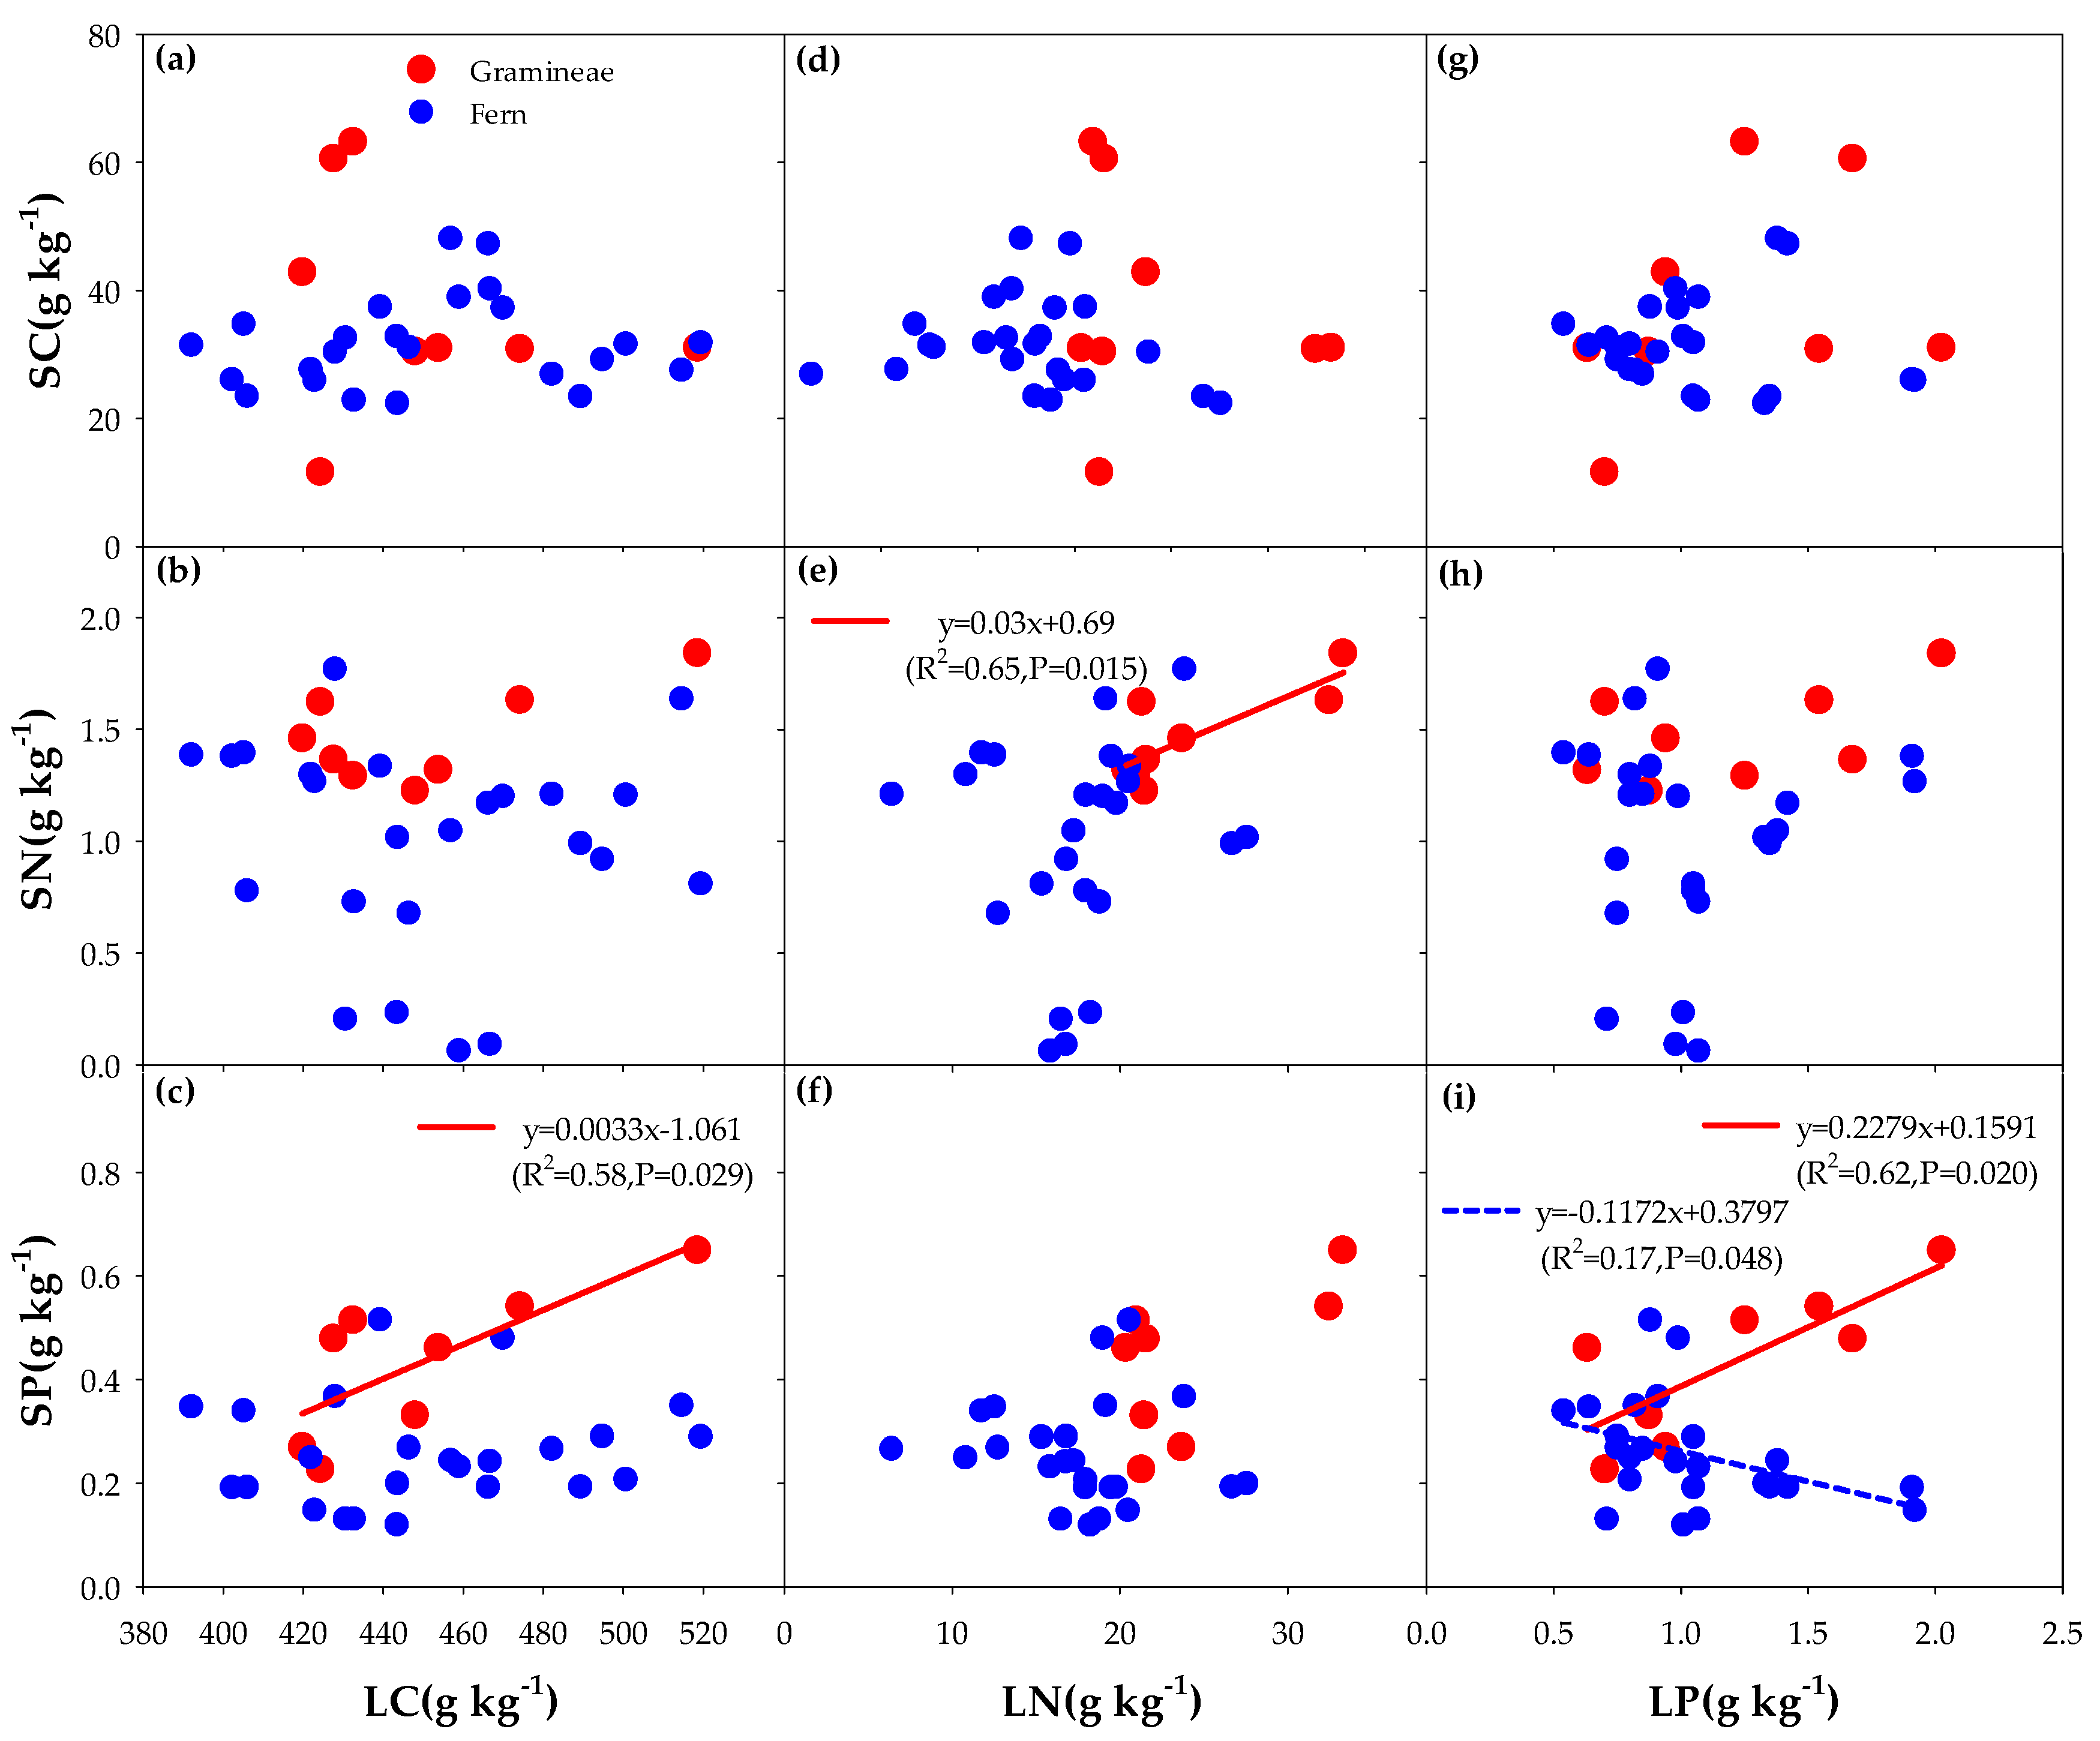
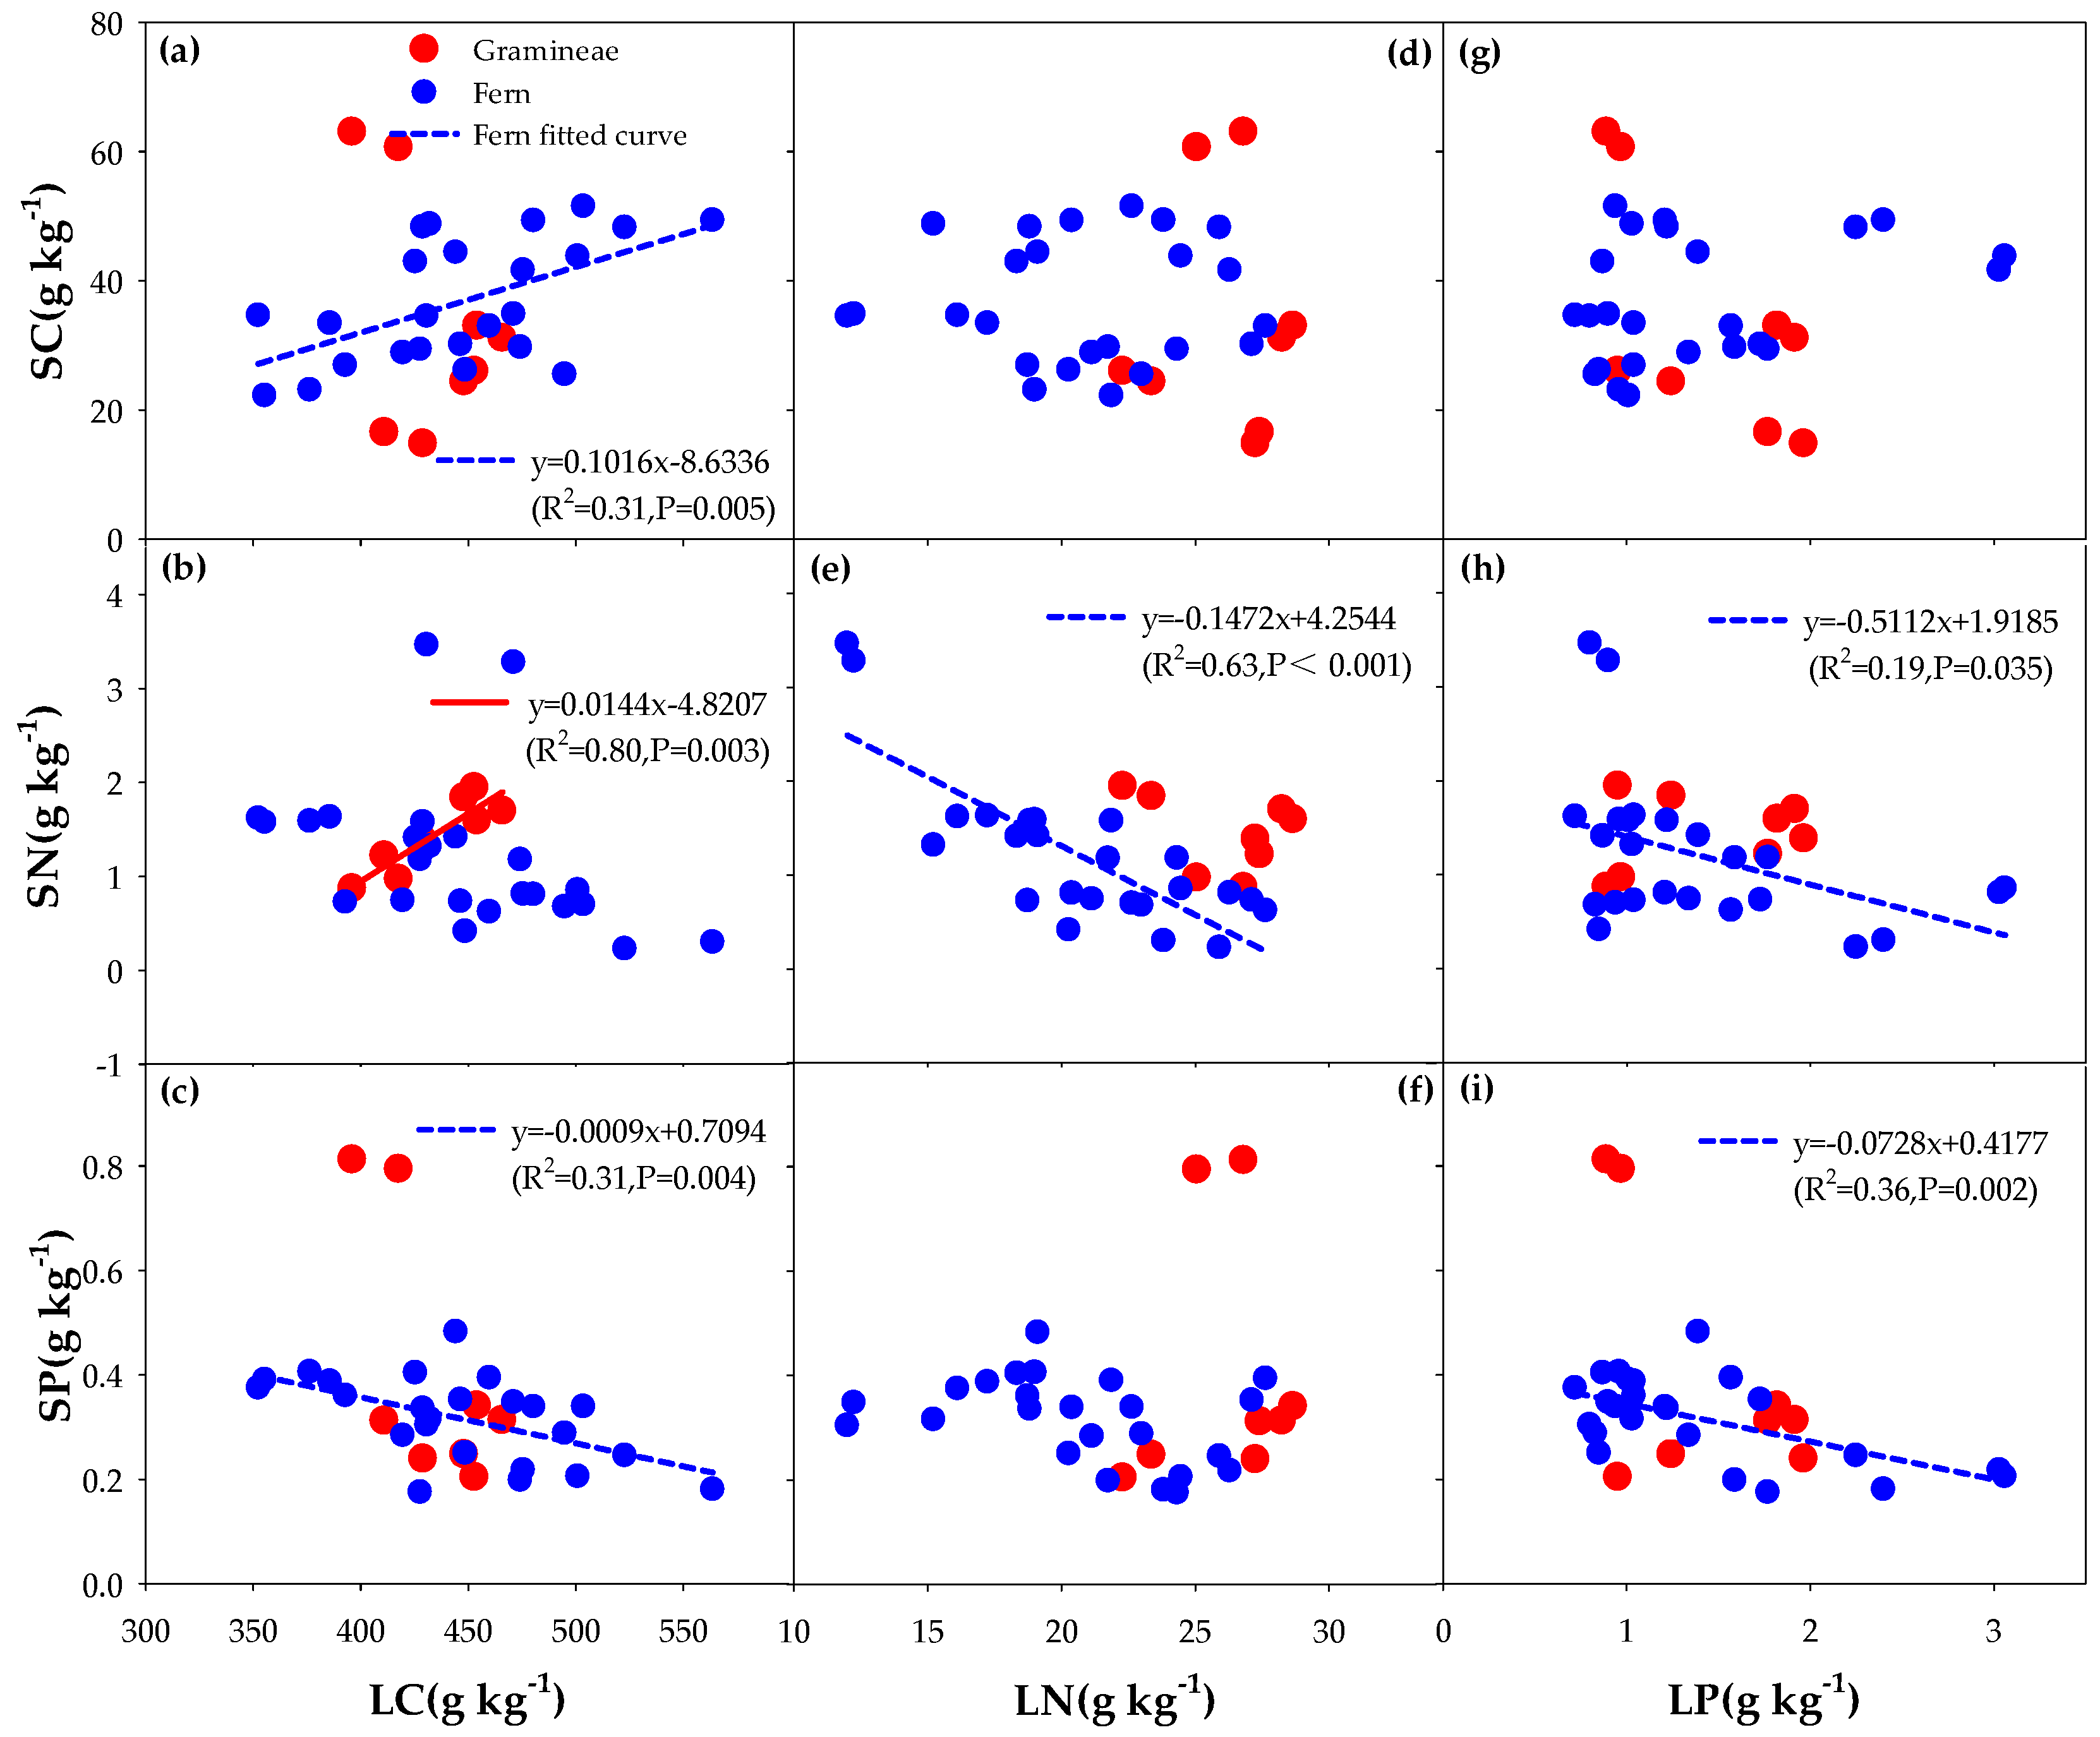
3.3. Correlation between the Litter of Different Functional Groups and Soil Carbon, Nitrogen, and Phosphorus (C, N, and P) with the Addition of N and P

Based on the unitary regression analysis, the litter N of the fern functional group was positively correlated with soil P (p = 0.051, Figure A1f) compared with the CK. In addition, for the fern functional group, the litter P was positively correlated with soil C (p = 0.002, Figure A1g) and negatively correlated with soil P (p = 0.019, Figure A1i). With the addition of N, the litter C of Gramineae was positively correlated with soil P (p = 0.029, Figure A2c); the litter N was positively correlated with soil N (p = 0.015, Figure A2e). The litter P and soil P were positively correlated in the Gramineae group but negatively correlated in the fern group (Figure A2i). With the addition of P, there was a negative correlation between the C and soil P of the litter of the fern group (p = 0.051, Figure A3c); the litter N and soil N were negatively correlated (p < 0.001, Figure A3e) in ferns but positively correlated (p = 0.008, Figure A3f) in Gramineae. Litter P is positively correlated with soil P in both the Gramineae and fern groups (Figure A3i). With the application of both N and P, the change of the litter C concentration in the fern group was affected by the change of soil C, soil N, and soil P concentration. The litter C concentration increased with the increase of soil C but decreased with the increase of soil N and soil P concentration (Figure 1a–c). The litter C concentration was negatively correlated with soil N (p = 0.059, Figure 1b) in the fern group, whereas soil N was positively correlated with litter C (p = 0.003, Figure 1b) in the Gramineae group. The litter N concentration of the fern group decreased with the increase of the soil N concentration (p < 0.001, Figure 1e). There was no correlation between litter N, soil C, and soil P of the two different plant functional groups (Figure 1d, f). Moreover, the litter P concentration was positively correlated with both soil N and soil P (Figure 1h, i) in the fern functional group.

3.4. Effects of N and P Addition on Carbon, Nitrogen, and Phosphorus (C, N, and P) Concentrations and Stoichiometric Ratios of the Soils Associated with Different Plant Functional Groups

A nested ANOVA showed that soil C was significantly affected by the understory species. Soil N and soil P were significantly affected by N addition, plant functional group, understory species, and randomized complete block design. The soil N also depended on P addition*plant functional group (Table 3). The soil C/N ratio and C:P ratio depended on the plant functional group, understory species, understory species*P addition, and randomized complete block design (Table 3; Figure 2). The soil C/P ratio depended on P addition*plant functional group. The soil N:P ratio depended on N addition, understory species, and randomized complete block design (Figure 2). Similarly, results of SN, SP, S C/N, SC/P, and SN/P varied with blocks (Table 3).

4. Discussion

Ecological stoichiometry plays an important role in the study of plants and soils within an entire ecosystem. Especially under global climate change, it is valuable to study the understory plant community and the nutrient cycle [45,46]. In the Chinese fir plantation, this study identified the differences in N and P nutrients availability in the soil associated with four understory species. Soil pH was lower than that of other study [43], and the soil of understory plants has a very low pH (3.31–3.37, soil/water, 2:5), indicating that these four species were acid-tolerant. In addition, there were significant differences in the concentrations of C, N, and P in litter and soil among the four species, indicating that species may be the factors contributing to this difference [2,47]. After the continuous addition of N and P, the C, N, and P concentration and stoichiometric ratio of the litter of different plant functional groups showed different degrees of variation compared to the CK. This change may be caused by changes in the C, N, and P cycles in the understory ecosystem after the addition of N and P [12,48,49]. With the addition of N and P, the C, N, and P concentrations of different plant functional groups and soil showed different degrees of correlation, and the correlation would change with different rates of N and P addition. However, most results were significantly affected by blocks, indicating potential variations in both litter and soil C and nutrients with spatial distribution of plots, which should be further considered in future studies.

4.1. Effects of Different Understory Vegetation Types on Stoichiometric Ratio

Understory vegetation plays an important role in maintaining biodiversity in forest ecosystems and soil nutrient cycling [50,51]. Most ecological indicators are correlated with different understory vegetation types [52]. Understory vegetation often participates in soil C and N nutrient cycling processes via multiple methods [53]. There are different correlations between water-soluble organic C and microbial biomass C of different understory vegetation types [54]. In this study, litter C, N, and C:N and soil N, P, C:N, and C:P in species of different functional groups are significantly correlated (Table 2 and Table 3). The litter from different species is significantly correlated with soil C, N, and P and the stoichiometric ratio (Table 2 and Table 3). This is consistent with Güsewell’s conclusion that plants have different C, N, and P concentrations in leaves due to the species and nutritional conditions [2]. These findings are consistent with Cheng et al.’s conclusions that indicated that the soil N utilization efficiency of Gramineae is higher than ferns [55]. In addition, litter from the Gramineae group has a lower C:N ratio, which is similar to the results of a study on the understory species of a Pinus massoniana plantation. Gramineae may be more conducive to improving the nutrient cycling rate in its dominant area [54].

4.2. Effect of Nitrogen (N) and Phosphorus (P) Addition on Stoichiometric Ratio

Nitrogen and P are the main limiting elements of plant growth in terrestrial ecosystems. It is generally believed that a N:P mass ratio lower than 14 indicates that plant growth is limited by N, while a N:P mass ratio higher than 16 indicates that plant growth is limited by P [47]. An unbalanced input of N and P will seriously affect the ecological stoichiometry, ultimately affecting the function of the ecosystem [15,56,57]. We found that N:P ratio of Gramineae litter (>16) was higher than ferns, After the addition of P, the N:P ratio of Gramineae decreased, but it was not significantly different from the CK (Figure 2i). Plants regulate their growth rate by adjusting the C:N:P ratio [58,59,60]. Because of the growth dilution effect, the available plant P concentration would decrease with increasing N [60]. However, our study did not find that N addition significantly reduced the P concentration of plant litter (Figure 2c, Table 2), which was in agreement with a study on the effect of long-term application of N and P fertilizer on plant N:P in a Tibetan alpine meadow [23]. It is possible that this effect is species specific or depends on the N application rate [61,62]. In comparison, the addition of N increased the N:P of litter and soil in the fern group (Figure 2i,l). The addition of P reduced the C:P and N:P of litter and soil in the fern group (Figure 2h,i,k,l). The separate addition of N and P had no significant effect on the CNP stoichiometric ratio of Gramineae, which indicates that the fern group was affected by the changes of a single environmental factor. This suggests that the fern population could rapidly expand if the environment was conducive to their favored growth conditions. Gramineae species have a good adaptability with the single change of N and P [53]. The co-addition of N and P reduced the C:N and C:P of litter (Figure 2g,h) of two of the different functional groups, increased the soil N:P (Figure 2i) of the fern group, and reduced the C:N ratio of understory species, which indicated that the addition of N and P together increased the N concentration in plants.
Coupling between N and P was observed, which plays an important role in the regulation of nutrient limitations and the strategies for plants to obtain nutrients in the changing environment [63,64]. These results show that the addition of N and P affects the correlation between litter and soil C, N, and P, and has different degrees of influence in different plant functional groups.
With the increasing deposition of N in southern China, the availability of soil P is limited, impacting the balance of C, N, and P in the ecosystem. In the context of global climate change, long-term experiments adding N and P are beneficial to understanding the nutrient cycle of understory vegetation in forest ecosystems and to cope with environmental changes. Future studies on understory vegetation management should focus on the effects of N and P addition and understory vegetation types on soil C and N cycles in plantations.

5. Conclusions

The C, N, and P concentrations of plants and soil vary greatly among different species, and these differences may be species dependent. The input of exogenous N and P changes the stoichiometric characteristics of understory plants to different degrees; thus, we believe that different species have different response mechanisms to changes of environmental factors. Different functional plant groups show different changes with the addition of N and P. The addition of N and P had an interactive effect on the N:P of litter, indicating that the growth of understory plants was dually restricted by N and P. Over the long-term, the addition of N and P may change the competitiveness of different functional plant groups in the forest, leading to a change in the community of understory plant species. Therefore, the response of the stoichiometric characteristics of understory plants to different N and P inputs should be studied in future research on understory vegetation.

Author Contributions

Conceptualization, L.Z. and J.X.; methodology, L.Z. and J.X.; software, J.X. and M.C.; investigation, J.X., H.F., Q.Z. and Y.G.; resources, L.Z.; data curation, J.P. and J.X.; writing—original draft preparation, J.X.; writing—review and editing, L.Z., X.X., X.F. and J.X.; supervision, X.G. and L.Z.; funding acquisition, X.F. and L.Z.

Funding

This research was funded by the National Natural Science Foundation of China (31770749) and the Research Project of Jiangxi Provincial Department of Forestry (No.201806).

Acknowledgments

The authors thank the following people for their help in this research. Li-Li Ma, Shu-Li Wang, Xi Yuan provided field assistance. Jia-Shun Peng assisted with lab analyses. Jiao Wu assisted with syntax modification.

Conflicts of Interest

The authors have declared that no competing interests exist.

Abbreviations

Ccarbon
Nnitrogen
Pphosphorus
DOCdissolved organic carbon
TOCtotal organic carbon
TNtotal nitrogen
TPtotal phosphorus
ANavailable nitrogen
APavailable phosphorus
LCtotal litter organic carbon
LNtotal litter nitrogen
LPtotal litter phosphorus
SCtotal soil organic carbon
SNtotal soil nitrogen
SPtotal soil phosphorus
Spunderstory species
Fplant functional group
B&Rblock as random effect
L C/Nlitter carbon to nitrogen ratio
L C/Plitter carbon to phosphorus ratio
L N/Plitter nitrogen to phosphorus ratio
S C/Nsoil carbon to nitrogen ratio
S C/Psoil carbon to phosphorus ratio
S N/Psoil nitrogen to phosphorus ratio

Appendix A

Table A1. The values of organic C (C), total N (N) and total P (P) in litter and soil of four plants under the addition of N and P (means ± SE).
Species No P AdditionP Addition
CKNCKN
Lophatherum gracile (Gramineae)LitterC502.10 ± 22.99449.88 ± 11.72474.09 ± 13.99434.28 ± 8.70
N24.04 ± 0.8524.38 ± 1.8923.00 ± 1.6326.14 ± 0.82
P1.21 ± 0.181.21 ± 0.181.69 ± 0.401.44 ± 0.17
soilC26.61 ± 1.3737.68 ± 6.0835.88 ± 8.3233.71 ± 6.54
N1.25 ± 0.071.47 ± 0.071.12 ± 0.031.44 ± 0.14
P0.41 ± 0.070.43 ± 0.050.37 ± 0.030.41 ± 0.09
Woodwardia japonica (Fern)LitterC420.27 ± 12.05421.31 ± 9.00442.22 ± 19.48393.95 ± 11.78
N15.36 ± 1.3917.56 ± 1.2316.43 ± 0.9318.95 ± 0.67
P1.23 ± 0.081.13 ± 0.181.33 ± 0.131.05 ± 0.08
soilC29.38 ± 2.0829.88 ± 2.1525.22 ± 1.7532.07 ± 2.97
N0.96 ± 0.071.18 ± 0.101.00 ± 0.131.34 ± 0.14
P0.38 ± 0.030.29 ± 0.050.40 ± 0.030.39 ± 0.02
Dryopteris atrata (Fern)LitterC443.67 ± 6.65457.00 ± 6.40454.05 ± 15.97483.93 ± 15.52
N16.62 ± 0.6819.82 ± 1.6518.77 ± 1.1425.17 ± 0.69
P1.88 ± 0.451.16 ± 0.092.57 ± 0.422.18 ± 0.22
soilC40.89 ± 1.9435.70 ± 3.4531.08 ± 1.6838.16 ± 3.02
N0.64 ± 0.050.60 ± 0.170.40 ± 0.030.74 ± 0.13
P0.24 ± 0.030.19 ± 0.040.40 ± 0.080.25 ± 0.03
Dicranopteris dichotoma (Fern)LitterC480.50 ± 6.65476.03 ± 13.68485.45 ± 19.59461.29 ± 10.67
N14.74 ± 1.9415.37 ± 1.9012.01 ± 1.5418.08 ± 1.55
P0.75 ± 0.040.84 ± 0.041.53 ± 0.170.97 ± 0.06
soilC30.64 ± 2.2729.51 ± 0.7034.01 ± 4.9739.89 ± 3.83
N0.77 ± 0.071.19 ± 0.1441.18 ± 0.151.53 ± 0.42
P0.30 ± 0.020.29 ± 0.020.38 ± 0.030.32 ± 0.01
Figure A1. Correlations between litter and soil C, N and P of four dominate species with two different functional types (Gramineae Lophatherum gracile and fern Woodwardia japonica, Dryopteris atrata and Dicranopteris dichotoma) in CK treatment.
Forests 10 00742 g0a1
Figure A2. Correlations between litter and soil C, N and P of four dominate species with two different functional types (Gramineae Lophatherum gracile and fern Woodwardia japonica, Dryopteris atrata and Dicranopteris dichotoma) in N addition treatment.
Forests 10 00742 g0a2
Figure A3. Correlations between litter and soil C, N and P of four dominate species with two different functional types (Gramineae Lophatherum gracile and fern Woodwardia japonica, Dryopteris atrata and Dicranopteris dichotoma) in P addition treatment.
Forests 10 00742 g0a3

References

  1. Elser, J.; Sterner, R.; Fagan, W.; Markow, T.; Cotner, J.; Hobbie, S.; Odell, G.; Weider, L.; Gorokhova, E.; Harrison, J. Biological stoichiometry from genes to ecosystems. Ecol. Lett. 2000, 3, 540–550. [Google Scholar] [CrossRef] [Green Version]
  2. Güsewell, S. N:P ratios in terrestrial plants: Variation and functional significance. New Phytol. 2004, 164, 243–266. [Google Scholar] [CrossRef]
  3. Han, W.; Fang, J.; Guo, D.; Zhang, Y. Leaf nitrogen and phosphorus stoichiometry across 753 terrestrial plant species in China. New Phytol. 2005, 168, 377–385. [Google Scholar] [CrossRef] [PubMed]
  4. Reich, P.B.; Oleksyn, J. Global patterns of plant leaf N and P in relation to temperature and latitude. Proc. Natl. Acad. Sci. USA 2004, 101, 11001–11006. [Google Scholar] [CrossRef] [PubMed] [Green Version]
  5. Ladanai, S.; Ågren, G.I.; Olsson, B.A. Relationships between tree and soil properties in picea abies and pinus sylvestris forests in sweden. Ecosystems 2010, 13, 302–316. [Google Scholar] [CrossRef]
  6. Bui, E.N.; Henderson, B.L. C:N:P stoichiometry in Australian soils with respect to vegetation and environmental factors. Plant Soil 2013, 373, 553–568. [Google Scholar] [CrossRef]
  7. Tian, H.; Chen, G.; Zhang, C.; Melillo, J.M.; Hall, C.A.S. Pattern and variation of C: N:P ratios in China’s soils: A synthesis of observational data. Biogeochemistry 2010, 98, 139–151. [Google Scholar] [CrossRef]
  8. Siddique, I.; Vieira, I.C.G.; Schmidt, S.; Lamb, D.; Carvalho, C.J.R.; Figueiredo, R.D.O.; Blomberg, S.; Davidson, E.A. Nitrogen and phosphorus additions negatively affect tree species diversity in tropical forest regrowth trajectories. Ecology 2010, 91, 2121–2131. [Google Scholar] [CrossRef]
  9. Wei, X.; Blanco, J.A.; Jiang, H.; Kimmins, J.H. Effects of nitrogen deposition on carbon sequestration in Chinese fir forest ecosystems. Sci. Total Environ. 2012, 416, 351–361. [Google Scholar] [CrossRef] [Green Version]
  10. Litton, C.M.; Raich, J.W.; Ryan, M.G. Carbon allocation in forest ecosystems. Glob. Chang. Biol. 2007, 13, 2089–2109. [Google Scholar] [CrossRef] [Green Version]
  11. Clark, C.M.; Tilman, D. Loss of plant species after chronic low-level nitrogen deposition to prairie grasslands. Nature 2008, 451, 712–715. [Google Scholar] [CrossRef] [PubMed]
  12. Peñuelas, J.; Sardans, J.; Rivas-Ubach, A.; Janssens, I.A. The human-induced imbalance between C, N and P in Earth’s life system. Glob. Chang. Biol. 2012, 18, 3–6. [Google Scholar] [CrossRef]
  13. Strengbom, J.; Walheim, M.; Näsholm, T.; Ericson, L. Regional differences in the occurrence of understorey species reflect nitrogen deposition in Swedish forests. Ambio 2003, 32, 91–97. [Google Scholar] [CrossRef] [PubMed]
  14. Menge, D.N.L.; Field, C.B. Simulated global changes alter phosphorus demand in annual grassland. Glob. Chang. Biol. 2007, 13, 2582–2591. [Google Scholar] [CrossRef]
  15. Sardans, J.; Rivas-Ubach, A.; Peñuelas, J. The elemental stoichiometry of aquatic and terrestrial ecosystems and its relationships with organismic lifestyle and ecosystem structure and function: A review and perspectives. Biogeochemistry 2012, 111, 1–39. [Google Scholar] [CrossRef]
  16. Mayor, J.R.; Wright, S.J.; Turner, B.L. Species-specific responses of foliar nutrients to long-term N and P additions in a lowland tropical forest. J. Ecol. 2014, 102, 36–44. [Google Scholar] [CrossRef]
  17. Huang, W.; Zhou, G.; Liu, J.; Zhang, D.; Xu, Z.; Liu, S. Effects of elevated carbon dioxide and nitrogen addition on foliar stoichiometry of nitrogen and phosphorus of five tree species in subtropical model forest ecosystems. Environ. Pollut. 2012, 168, 113–120. [Google Scholar] [CrossRef] [PubMed]
  18. Koller, E.K.; Press, M.C.; Callaghan, T.V.; Phoenix, G.K. Tight coupling between shoot level foliar N and P, leaf area, and shoot growth in Arctic dwarf shrubs under simulated climate change. Ecosystems 2016, 19, 326–338. [Google Scholar] [CrossRef]
  19. Zhang, Q.; Xie, J.; Lyu, M.; Xiong, D.; Wang, J.; Chen, Y.; Li, Y.; Wang, M.; Yang, Y. Short-term effects of soil warming and nitrogen addition on the N:P stoichiometry of Cunninghamia lanceolata in subtropical regions. Plant Soil 2016, 411, 395–407. [Google Scholar] [CrossRef]
  20. Braun, S.; Thomas, V.F.; Quiring, R.; Flückiger, W. Does nitrogen deposition increase forest production? The role of phosphorus. Environ. Pollut. 2010, 158, 2043–2052. [Google Scholar] [CrossRef]
  21. Chen, F.S.; Niklas, K.J.; Zeng, D.H. Important foliar traits depend on species-grouping: Analysis of a remnant temperate forest at the Keerqin sandy lands, China. Plant Soil 2011, 340, 337–345. [Google Scholar] [CrossRef]
  22. Heuck, C.; Smolka, G.; Whalen, E.D.; Frey, S.; Gundersen, P.; Moldan, F.; Fernandez, I.J.; Spohn, M. Effects of long-term nitrogen addition on phosphorus cycling in organic soil horizons of temperate forests. Biogeochemistry 2018, 141, 167–181. [Google Scholar] [CrossRef]
  23. Zhang, J.; Yan, X.; Su, F.; Li, Z.; Wang, Y.; Wei, Y.; Ji, Y.; Yang, Y.; Zhou, X.; Guo, H.; et al. Long-term N and P additions alter the scaling of plant nitrogen to phosphorus in a Tibetan alpine meadow. Sci. Total Environ. 2018, 625, 440–448. [Google Scholar] [CrossRef] [PubMed]
  24. Craft, C.B.; Vymazal, J.; Richardson, C.J. Response of everglades plant communities to nitrogen and phosphorus additions. Wetlands 1995, 15, 258–271. [Google Scholar] [CrossRef]
  25. Yang, Y.; Liu, B.R.; An, S.S. Ecological stoichiometry in leaves, roots, litters and soil among different plant communities in a desertified region of Northern China. Catena 2018, 166, 328–338. [Google Scholar] [CrossRef]
  26. Wang, W.Q.; Wang, C.; Sardans, J.; Zeng, C.S.; Tong, C.; Peñuelas, J. Plant invasive success associated with higher N-use efficiency and stoichiometric shifts in the soil–plant system in the Minjiang River tidal estuarine wetlands of China. Wetl. Ecol. Manag. 2015, 23, 865–880. [Google Scholar] [CrossRef]
  27. Wang, F.; Chen, F.; Wang, G.G.; Mao, R.; Fang, X.; Wang, H.; Bu, W. Effects of experimental nitrogen addition on nutrients and nonstructural carbohydrates of dominant understory plants in a Chinese fir plantation. Forests 2019, 10, 155. [Google Scholar] [CrossRef]
  28. Takafumi, H.; Hiura, T. Effects of disturbance history and environmental factors on the diversity and productivity of understory vegetation in a cool-temperate forest in Japan. For. Ecol. Manag. 2009, 257, 843–857. [Google Scholar] [CrossRef] [Green Version]
  29. Dobson, A.M.; Blossey, B.; Richardson, J.B. Invasive earthworms change nutrient availability and uptake by forest understory plants. Plant Soil 2017, 421, 175–190. [Google Scholar] [CrossRef]
  30. Wang, F.; Zou, B.; Li, H.; Li, Z. The effect of understory removal on microclimate and soil properties in two subtropical lumber plantations. J. For. Res. 2014, 19, 238–243. [Google Scholar] [CrossRef]
  31. Jules, M.J.; Sawyer, J.O.; Jules, E.S. Assessing the relationships between stand development and understory vegetation using a 420-year chronosequence. For. Ecol. Manag. 2008, 255, 2384–2393. [Google Scholar] [CrossRef]
  32. Lu, X.; Mo, J.; Gilliam, F.S.; Zhou, G.; Fang, Y. Effects of experimental nitrogen additions on plant diversity in an old-growth tropical forest. Glob. Chang. Biol. 2010, 16, 2688–2700. [Google Scholar] [CrossRef] [Green Version]
  33. Hurd, T.M.; Brach, A.R.; Raynal, D.J. Response of understory vegetation of Adirondack forests to nitrogen additions. Can. J. For. Res. 1998, 28, 799–807. [Google Scholar] [CrossRef]
  34. Rainey, S.M.; Nadelhoffer, K.J.; Silver, W.L.; Downs, M.R. Effects of chronic nitrogen additions on understory species in a red pine plantation. Ecol. Appl. 1999, 9, 949–957. [Google Scholar] [CrossRef]
  35. Bi, J.; Blanco, J.A.; Seely, B.; Kimmins, J.P.; Ding, Y.; Welham, C. Yield decline in Chinese-fir plantations: A simulation investigation with implications for model complexity. Can. J. For. Res. 2007, 37, 1615–1630. [Google Scholar] [CrossRef]
  36. Lu, Z.H.; Wu, G.; Ma, X.; Bai, G.X. Current situation of Chinese forestry tactics and strategy of sustainable development. J. For. Res. 2002, 13, 319–322. [Google Scholar]
  37. Chen, G.S.; Yang, Z.J.; Gao, R.; Xie, J.S.; Guo, J.F.; Huang, Z.Q.; Yang, Y.S. Carbon storage in a chronosequence of Chinese fir plantations in southern China. For. Ecol. Manag. 2013, 300, 68–76. [Google Scholar] [CrossRef]
  38. Tang, X.; Pérez-Cruzado, C.; Fehrmann, L.; Álvarez-González, J.G.; Lu, Y.; Kleinn, C. Development of a compatible taper function and stand-level merchantable volume model for Chinese fir plantations. PLoS ONE 2016, 11, e0147610. [Google Scholar] [CrossRef]
  39. Peng, Y.; Tian, D.; Thomas, S.C. Forest management and soil respiration: Implications for carbon sequestration. Environ. Rev. 2008, 16, 93–111. [Google Scholar] [CrossRef]
  40. Powers, R.F.; Busse, M.D.; McFarlane, K.J.; Zhang, J.W.; Young, D.H. Long-term effects of silviculture on soil carbon storage: Does vegetation control make a difference? Forestry 2013, 86, 47–58. [Google Scholar] [CrossRef]
  41. Chen, F.S.; Niklas, K.J.; Liu, Y.; Fang, X.M.; Wan, S.Z.; Wang, H. Nitrogen and phosphorus additions alter nutrient dynamics but not resorption efficiencies of Chinese fir leaves and twigs differing in age. Tree Physiol. 2015, 35, 1106–1117. [Google Scholar] [CrossRef] [PubMed] [Green Version]
  42. Lu, C.; Tian, H. Spatial and temporal patterns of nitrogen deposition in China: Synthesis of observational data. J. Geophys. Res. Space Phys. 2007, 112, 10–15. [Google Scholar] [CrossRef]
  43. Tang, Y.; Zhang, X.; Li, D.; Wang, H.; Chen, F.; Fu, X.; Fang, X.; Sun, X.; Yu, G. Impacts of nitrogen and phosphorus additions on the abundance and community structure of ammonia oxidizers and denitrifying bacteria in Chinese fir plantations. Soil Biol. Biochem. 2016, 103, 284–293. [Google Scholar] [CrossRef]
  44. Bao, S.D. Soil and Agricultural Chemistry Analysis, 3rd ed.; Agriculture Press: Beijing, China, 2008. (In Chinese) [Google Scholar]
  45. Zechmeister-Boltenstern, S.; Keiblinger, K.M.; Mooshammer, M.; Peñuelas, J.; Richter, A.; Sardans, J.; Wanek, W. The application of ecological stoichiometry to plant–microbial–soil organic matter transformations. Ecol. Monogr. 2015, 85, 133–155. [Google Scholar] [CrossRef]
  46. Metcalfe, D.B.; Fisher, R.A.; Wardle, D.A. Plant communities as drivers of soil respiration: Pathways, mechanisms, and significance for global change. Biogeosciences 2011, 8, 2047–2061. [Google Scholar] [CrossRef]
  47. Meuleman, A.F.M.; Koerselman, W. The Vegetation N:P Ratio: A new tool to detect the nature of nutrient limitation. J. Appl. Ecol. 1996, 33, 1441–1450. [Google Scholar]
  48. Marklein, A.R.; Houlton, B.Z. Nitrogen inputs accelerate phosphorus cycling rates across a wide variety of terrestrial ecosystems. New Phytol. 2011, 193, 696–704. [Google Scholar] [CrossRef]
  49. Lu, M.; Yang, Y.; Luo, Y.; Fang, C.; Zhou, X.; Chen, J.; Yang, X.; Li, B. Responses of ecosystem nitrogen cycle to nitrogen addition: A meta-analysis. New Phytol. 2011, 189, 1040–1050. [Google Scholar] [CrossRef]
  50. Wu, J.; Liu, Z.; Chen, D.; Huang, G.; Zhou, L.; Fu, S. Understory plants can make substantial contributions to soil respiration: Evidence from two subtropical plantations. Soil Biol. Biochem. 2011, 43, 2355–2357. [Google Scholar] [CrossRef]
  51. Wu, J.; Liu, Z.; Wang, X.; Sun, Y.X.; Zhou, L.; Lin, Y.; Fu, S. Effects of understory removal and tree girdling on soil microbial community composition and litter decomposition in two Eucalyptus plantations in South China. Funct. Ecol. 2011, 25, 921–931. [Google Scholar] [CrossRef]
  52. Yimer, F.; Ledin, S.; Abdelkadir, A. Soil organic carbon and total nitrogen stocks as affected by topographic aspect and vegetation in the Bale Mountains, Ethiopia. Geoderma 2006, 135, 335–344. [Google Scholar] [CrossRef]
  53. Zhao, J.; Wan, S.; Li, Z.; Shao, Y.; Xu, G.; Liu, Z.; Zhou, L.; Fu, S. Dicranopteris-dominated understory as major driver of intensive forest ecosystem in humid subtropical and tropical region. Soil Biol. Biochem. 2012, 49, 78–87. [Google Scholar] [CrossRef]
  54. Pan, P.; Zhao, F.; Ning, J.; Zhang, L.; Ouyang, X.; Zang, H. Impact of understory vegetation on soil carbon and nitrogen dynamic in aerially seeded Pinus massoniana plantations. PLoS ONE 2018, 13, e0191952. [Google Scholar] [CrossRef] [PubMed]
  55. Chen, J.; Stark, J.M. Plant species effects and carbon and nitrogen cycling in a sagebrush–crested wheatgrass soil. Soil Biol. Biochem. 2000, 32, 47–57. [Google Scholar] [CrossRef]
  56. Finzi, A.C.; Austin, A.T.; Cleland, E.E.; Frey, S.D.; Houlton, B.Z.; Wallenstein, M.D. Responses and feedbacks of coupled biogeochemical cycles to climate change: Examples from terrestrial ecosystems. Front. Ecol. Environ. 2011, 9, 61–67. [Google Scholar] [CrossRef]
  57. Penuelas, J.; Poulter, B.; Sardans, J.; Ciais, P.; Van Der Velde, M.; Bopp, L.; Boucher, O.; Godderis, Y.; Hinsinger, P.; Llusià, J.; et al. Human-induced nitrogen–phosphorus imbalances alter natural and managed ecosystems across the globe. Nat. Commun. 2013, 4, 2934. [Google Scholar] [CrossRef] [PubMed]
  58. Klausmeier, C.A.; Litchman, E.; Daufresne, T.; Levin, S.A. Optimal nitrogen-to-phosphorus stoichiometry of phytoplankton. Nature 2004, 429, 171–174. [Google Scholar] [CrossRef] [PubMed]
  59. Moe, S.J.; Stelzer, R.S.; Forman, M.R.; Harpole, W.S.; Daufresne, T.; Yoshida, T. Recent advances in ecological stoichiometry: Insights for population and community ecology. Oikos 2005, 109, 29–39. [Google Scholar] [CrossRef]
  60. Van Heerwaarden, L.M.; Toet, S.; Aerts, R. Nitrogen and phosphorus resorption efficiency and proficiency in six sub-arctic bog species after 4 years of nitrogen fertilization. J. Ecol. 2003, 91, 1060–1070. [Google Scholar] [CrossRef]
  61. Gusewell, S. Variation in nitrogen and phosphorus concentrations of wetland plants. Perspect. Plant Ecol. Evol. Syst. 2002, 5, 37–61. [Google Scholar] [CrossRef]
  62. Bubier, J.L.; Smith, R.; Juutinen, S.; Moore, T.R.; Minocha, R.; Long, S.; Minocha, S. Effects of nutrient addition on leaf chemistry, morphology, and photosynthetic capacity of three bog shrubs. Oecologia 2011, 167, 355–368. [Google Scholar] [CrossRef] [PubMed]
  63. Niklas, K.J.; Cobb, E.D. N, P, and C stoichiometry of Eranthis hyemalis (Ranunculaceae) and the allometry of plant growth. Am. J. Bot. 2005, 92, 1256–1263. [Google Scholar] [CrossRef] [PubMed]
  64. Elser, J.J.; Bracken, M.E.; Cleland, E.E.; Gruner, D.S.; Harpole, W.S.; Hillebrand, H.; Ngai, J.T.; Seabloom, E.W.; Shurin, J.B.; Smith, J.E. Global analysis of nitrogen and phosphorus limitation of primary producers in freshwater, marine and terrestrial ecosystems. Ecol. Lett. 2007, 10, 1135–1142. [Google Scholar] [CrossRef] [PubMed] [Green Version]
Figure 1. Correlations between litter and soil carbon, nitrogen, and phosphorus (C, N, and P) of four dominate species with two different functional types (Gramineae Lophatherum gracile and fern Woodwardia japonica, Dryopteris atrata and Dicranopteris dichotoma) with N (100 kg ha−1 year−1) and P (50 kg ha−1 year−1) addition.
Forests 10 00742 g001
Figure 2. Litter and soil carbon, nitrogen, and phosphorus (C, N, P), C/N, C/P and N/P of four dominate species with two different functional types (Gramineae Lophatherum gracile and fern Woodwardia japonica, Dryopteris atrata and Dicranopteris dichotoma) under four nutrient addition modes (CK, N, P and NP). Terms are the same as in Table 2.
Forests 10 00742 g002
Table 1. Litter and soil nutrients of four understory plant species (means ± SE). Superscript letters in the same line indicate a significant difference at p = 0.05 based on LSD (least significant difference) comparison. Lines without letters indicate that the difference is not significant. LC: litter total organic carbon (C); LN: litter total nitrogen (N); LP: litter total phosphorus (P); SC: soil total organic C; SN: soil total N; SP: soil total P.
FactorsLophatherum gracile Brongn. (Gramineae)Woodwardia japonica (L.f.) Sm. (Fern)Dryopteris atrata (Kunze) Ching (Fern)Dicranopteris dichotoma (Thunb.) Berhn.) (Fern)
DOC (mg kg−1)88.05 ± 6.88100.79 ± 8.23103.53 ± 10.5985.67 ± 4.64
NH4+-N (mg kg−1)5.26 ± 0.405.01 ± 0.405.23 ± 0.325.45 ± 0.51
NO3-N (mg kg−1)1.92 ± 0.19 A1.41 ± 0.09 B1.40 ± 0.09 B1.42 ± 0.15 B
AN (mg kg−1)7.18 ± 0.506.42 ± 0.446.63 ± 0.376.87 ± 0.64
AP (mg kg−1)1.17 ± 0.15 A1.15 ± 0.18 A1.34 ± 0.20 A0.56 ± 0.09 B
pH3.32 ± 0.053.31 ± 0.043.37 ± 0.043.33 ± 0.04
LC (g kg−1)465.09 ± 8.61 A419.44 ± 7.18 B459.67 ± 6.32 A475.82 ± 6.62 A
LN (g kg−1)24.39 ± 0.69 A17.07 ± 0.57 C20.10 ± 0.77 B15.05 ± 0.92 C
LP (g kg−1)1.39 ± 0.12 B1.18 ± 0.06 BC1.94 ± 0.18 A1.02 ± 0.07 C
SC (g kg−1)31.57 ± 2.10 BC27.87 ± 0.93 C37.78 ± 1.39 A35.88 ± 2.00 AB
SN (g kg−1)1.30 ± 0.04 A1.10 ± 0.05 B0.62 ± 0.05 C1.22 ± 0.10 AB
SP (g kg−1)0.43 ± 0.02 A0.39 ± 0.02 A0.29 ± 0.02 B0.32 ± 0.01 B
Table 2. ANOVAs on the effects of nitrogen (N) and phosphorus (P) deposition, plant functional group (F), understory species (Sp; nested within plant functional group, f), and their interactions on litter (raw decomposed leaves) C, N, P, and C/N/P. B&R indicates randomized complete block design. The six indicators include litter total organic C (LC), litter total N (LN), litter total P (LP), litter C to N ratio (L C/N), litter C to P ratio (L C/P), and litter N to P ratio (L N/P) along the first row of the table. df is the degrees of freedom. *: p < 0.05; **: p < 0.01; ***: p < 0.001.
FactordfLC (g kg−1)LN (g kg−1)LP (g kg−1)L C/NL C/PL N/P
MSFMSFMSFMSFMSFMSF
N282565.92 ***11310.10 ***0.702.303765.19 **3230.0290.332.47
P126.780.0217.181.5410.3734.22 ***56.650.78618,93637.03 ***98226.84 ***
N*P2244026.7128.542.560.812.6670.560.9827,0731.621564.26 *
f123,73417.00 ***2066185.37 ***0.010.04277738.41 ***29410.18147240.26 ***
N*f210,3237.40 ***21.971.970.120.4049.920.6928,0141.6858.891.61
P*f1497.300.3631.062.790.110.3864.550.8929280.1871.351.95
N*P*f236032.582.880.260.020.0536.050.508840.0523.270.64
Sp[f]247,21733.83 ***39835.69 ***13.8945.85 ***251734.81 ***660,74439.53 ***1744.76 ***
Sp*N[f]425451.8211.581.040.260.8668.920.9543790.261.590.04
Sp*P[f]227141.9419.891.793.3511.04 ***7.050.1038,4562.3080.972.21
B&R354653.92 ***20118.01 ***1.163.82 **4476.19 ***59,4423.56*43.521.19
Table 3. ANOVAs on the effects of N, P, and Species (Sp, nested within f) and their interactions with soil carbon, nitrogen, and phosphorus (C, N, P), soil C/N, soil C/P, and soil N/P. Terms are the same as in Table 2. B&R is randomized complete block design. df is the degrees of freedom. *: p < 0.05; **: p < 0.01; ***: p < 0.001.
FactordfSC (g kg−1)SN (g kg−1)SP (g kg−1)S C/NS C/PS N/P
MSFMSFMSFMSFMSFMSF
N21821.410.905.59 **0.053.49 *9140.2459642.9218.937.39 ***
P11090.840.120.730.053.2911780.3118650.913.381.32
N*P216.630.130.332.030.010.6414790.3913.270.015.322.08
f11861.443.7523.39 ***0.3021.79 ***31,6878.31 **41,99220.54 ***5.852.28
N*f22782.150.050.310.021.788210.2243812.142.971.16
P*f138.800.300.623.86 *0.053.5876802.0111,1115.43 *0.550.22
N*P*f23562.760.020.120.010.9210740.2827761.362.390.93
Sp[f]2132710.28 ***4.7729.77 ***0.139.57 ***90,28123.68 ***68,90133.70 ***20.708.08 ***
Sp*N[f]41761.360.120.780.011.0753641.4138021.862.050.80
Sp*P[f]222.990.180.120.760.042.9115,9404.18 *88204.31 *5.021.96
B&R33252.521.418.83 ***0.1712.44 ***26,8167.04 ***62563.06 *33.7213.16 ***

