Article

Historic Urban Tree Canopy Cover of Great Britain

Forest Research, Alice Holt Lodge, Farnham GU10 4LH, Surrey, UK
*
Author to whom correspondence should be addressed.
Forests 2020, 11(10), 1049; https://doi.org/10.3390/f11101049
Submission received: 14 August 2020 / Revised: 24 September 2020 / Accepted: 25 September 2020 / Published: 28 September 2020

Abstract

:
Research Highlights: Historic trend analysis of urban tree canopy cover change, while growing in popularity, remains uncommon and concentrated to just a handful of countries. Background and Objectives: Tree canopy cover is a relatively quick, easy to obtain and cost-effective urban forestry metric. It is used to provide insight into not only the coverage of a defined area but also an urban forest’s potential to provide benefits to those who live and work in the locality. On-going delivery of benefits is reliant on a sustained healthy canopy, and knowing how canopy coverage is changing over time can be informative for strategic urban forestry management planning. Materials and Methods: Changes in tree canopy cover is assessed for ten urban areas across Great Britain since the 1940s using a random point-based assessment of paired aerial imagery. Results: The study reveals a predominance of increasing trends over the long term, with just one town displaying a long-term decrease and two revealing “flat lined” trends. Over the past two decades, however, the trends are more variable, with six towns displaying no statistically significant change, one declining and just three increasing in canopy cover. Conclusions: The results indicate a need for ongoing research to broaden the geographic spread of trend analysis and investigation into the drivers of changes, but also to increase the number of time points considered.

1. Introduction

Tree canopy cover is defined as the layer of leaves, branches, and stems of trees that cover the ground when viewed from above (e.g., see [1,2]). Canopy cover is a relatively quick, easy to obtain and cost-effective metric of the urban forest [3] (herein defined as “all the trees in the urban realm—in public and private spaces, along linear routes and waterways and in amenity areas” [4,5]). Quantifying tree cover can provide useful insight into, for example, (i) comprehensiveness of coverage over a defined area, and (ii) an urban forest’s potential to provide ecosystem service benefits [6,7].
There are three main types of urban tree canopy cover assessments: historic, present-day, and future forecasts. Historic assessments are those which make use of historic information in order to examine changes in canopy cover over time. They may examine relatively short time periods (for example a few years) or cover many decades and tend to be limited by the availability of suitable data. They may be pan-city (see below) or at the sub-city scale, for example, to consider the impact of urbanization on natural systems (e.g., [8,9]).
Present-day canopy assessments provide a snapshot of the current state of the urban forest. Alone, this type of assessment cannot be used to monitor trends in canopy cover change. Numerous present-day canopy assessments have been completed [10,11]; they are commonly used to raise awareness of the importance of urban trees to politicians and the public alike, or to baseline an urban forest management plan target for increased canopy cover.
Future canopy assessments or “forecast” assessments tend to consider reasonable management strategy scenarios and known or assumed growth rates to project canopy cover change over a stated time frame.

1.1. Why Measure Historic Urban Canopy Cover?

Historic canopy assessments can be used in conjunction with present-day canopy assessments to contextualise understanding of the current state and causes of changes to an urban forest [12,13]. The mechanisms of change over time may have been natural [14], socioeconomic [8,15], or informed by strategic management [16]; understanding these can contribute to forecasting future change within an urban forest [6]. Thus, historic canopy assessments can inform future management in order to sustain ecosystem services for future generations [6,17,18,19,20].

1.2. Previous Assessments

Monitoring urban canopy cover change is becoming increasingly considered with the rise of remotely sensed (RS) datasets [7,14,20,21] and the emergence of automated approaches such as Object-based image analysis (OBIA) of maps, photographs, and RS-imagery. Both are inherently constrained (with respect to long term trend analysis) due to data accessibility, cost, and resolution [22]. Equally, conventional approaches utilizing aerial photograph analysis are constrained by the availability of suitable imagery, and the time-requirement. As such, relatively few, long-term historic canopy cover change assessments have been completed (Table 1). A comparison of these studies reveals several analysis gaps. Of the sixteen studies, ten took place in the United States, one in Canada, one in Australia, one in China, and two in Great Britain (GB) indicating a paucity of studies globally as well as for any single nation. The one published study from GB used fieldwork as the current measurement, which is time-consuming and expensive to replicate. Ten studies examined only two dates, indicating that there is a knowledge gap in trend analysis, and ten examined only one city or area for that country, and so could not perform a comparison between locations. The aim of this study is to assess the changes in tree canopy cover of ten urban areas across GB from 1940 (the date of the earliest free-of-charge available aerial imagery for GB) through to 2018.

2. Materials and Methods

2.1. Data Sources

Aerial Imagery from Google Earth Pro (7.3.2.5495 (64-bit) [29]) was selected, following a web and literature search of available data sources, as the most comprehensive single repository of aerial imagery for multiple cities over a long time period. This is consistent with previous studies [7,25,28]. For each city, imagery spanned multiple years and occasionally included multiple images for a single year. Images (and thus years) to be included in the study were selected according to comprehensiveness (where imagery was too patchy to provide the required coverage the whole time point was rejected); colour images available (where black + white and colour were available, the latter was selected); and visual quality. Resolution is invariably described in Google Earth; however, the resolution was determined in the range 15–30 m [29], which may lead to discrepancy at the size interface between shrub and tree (see Discussion Section 4.3). Data from “Britain from Above” [30] low-altitude aerial photographs were also considered (as similar in the methodological approach to Gillespie et al. [24]), however, the imagery would have required a more-lengthy analysis than was available for this study. This imagery was, however, used to supplement the Google Earth imagery, as detailed below.

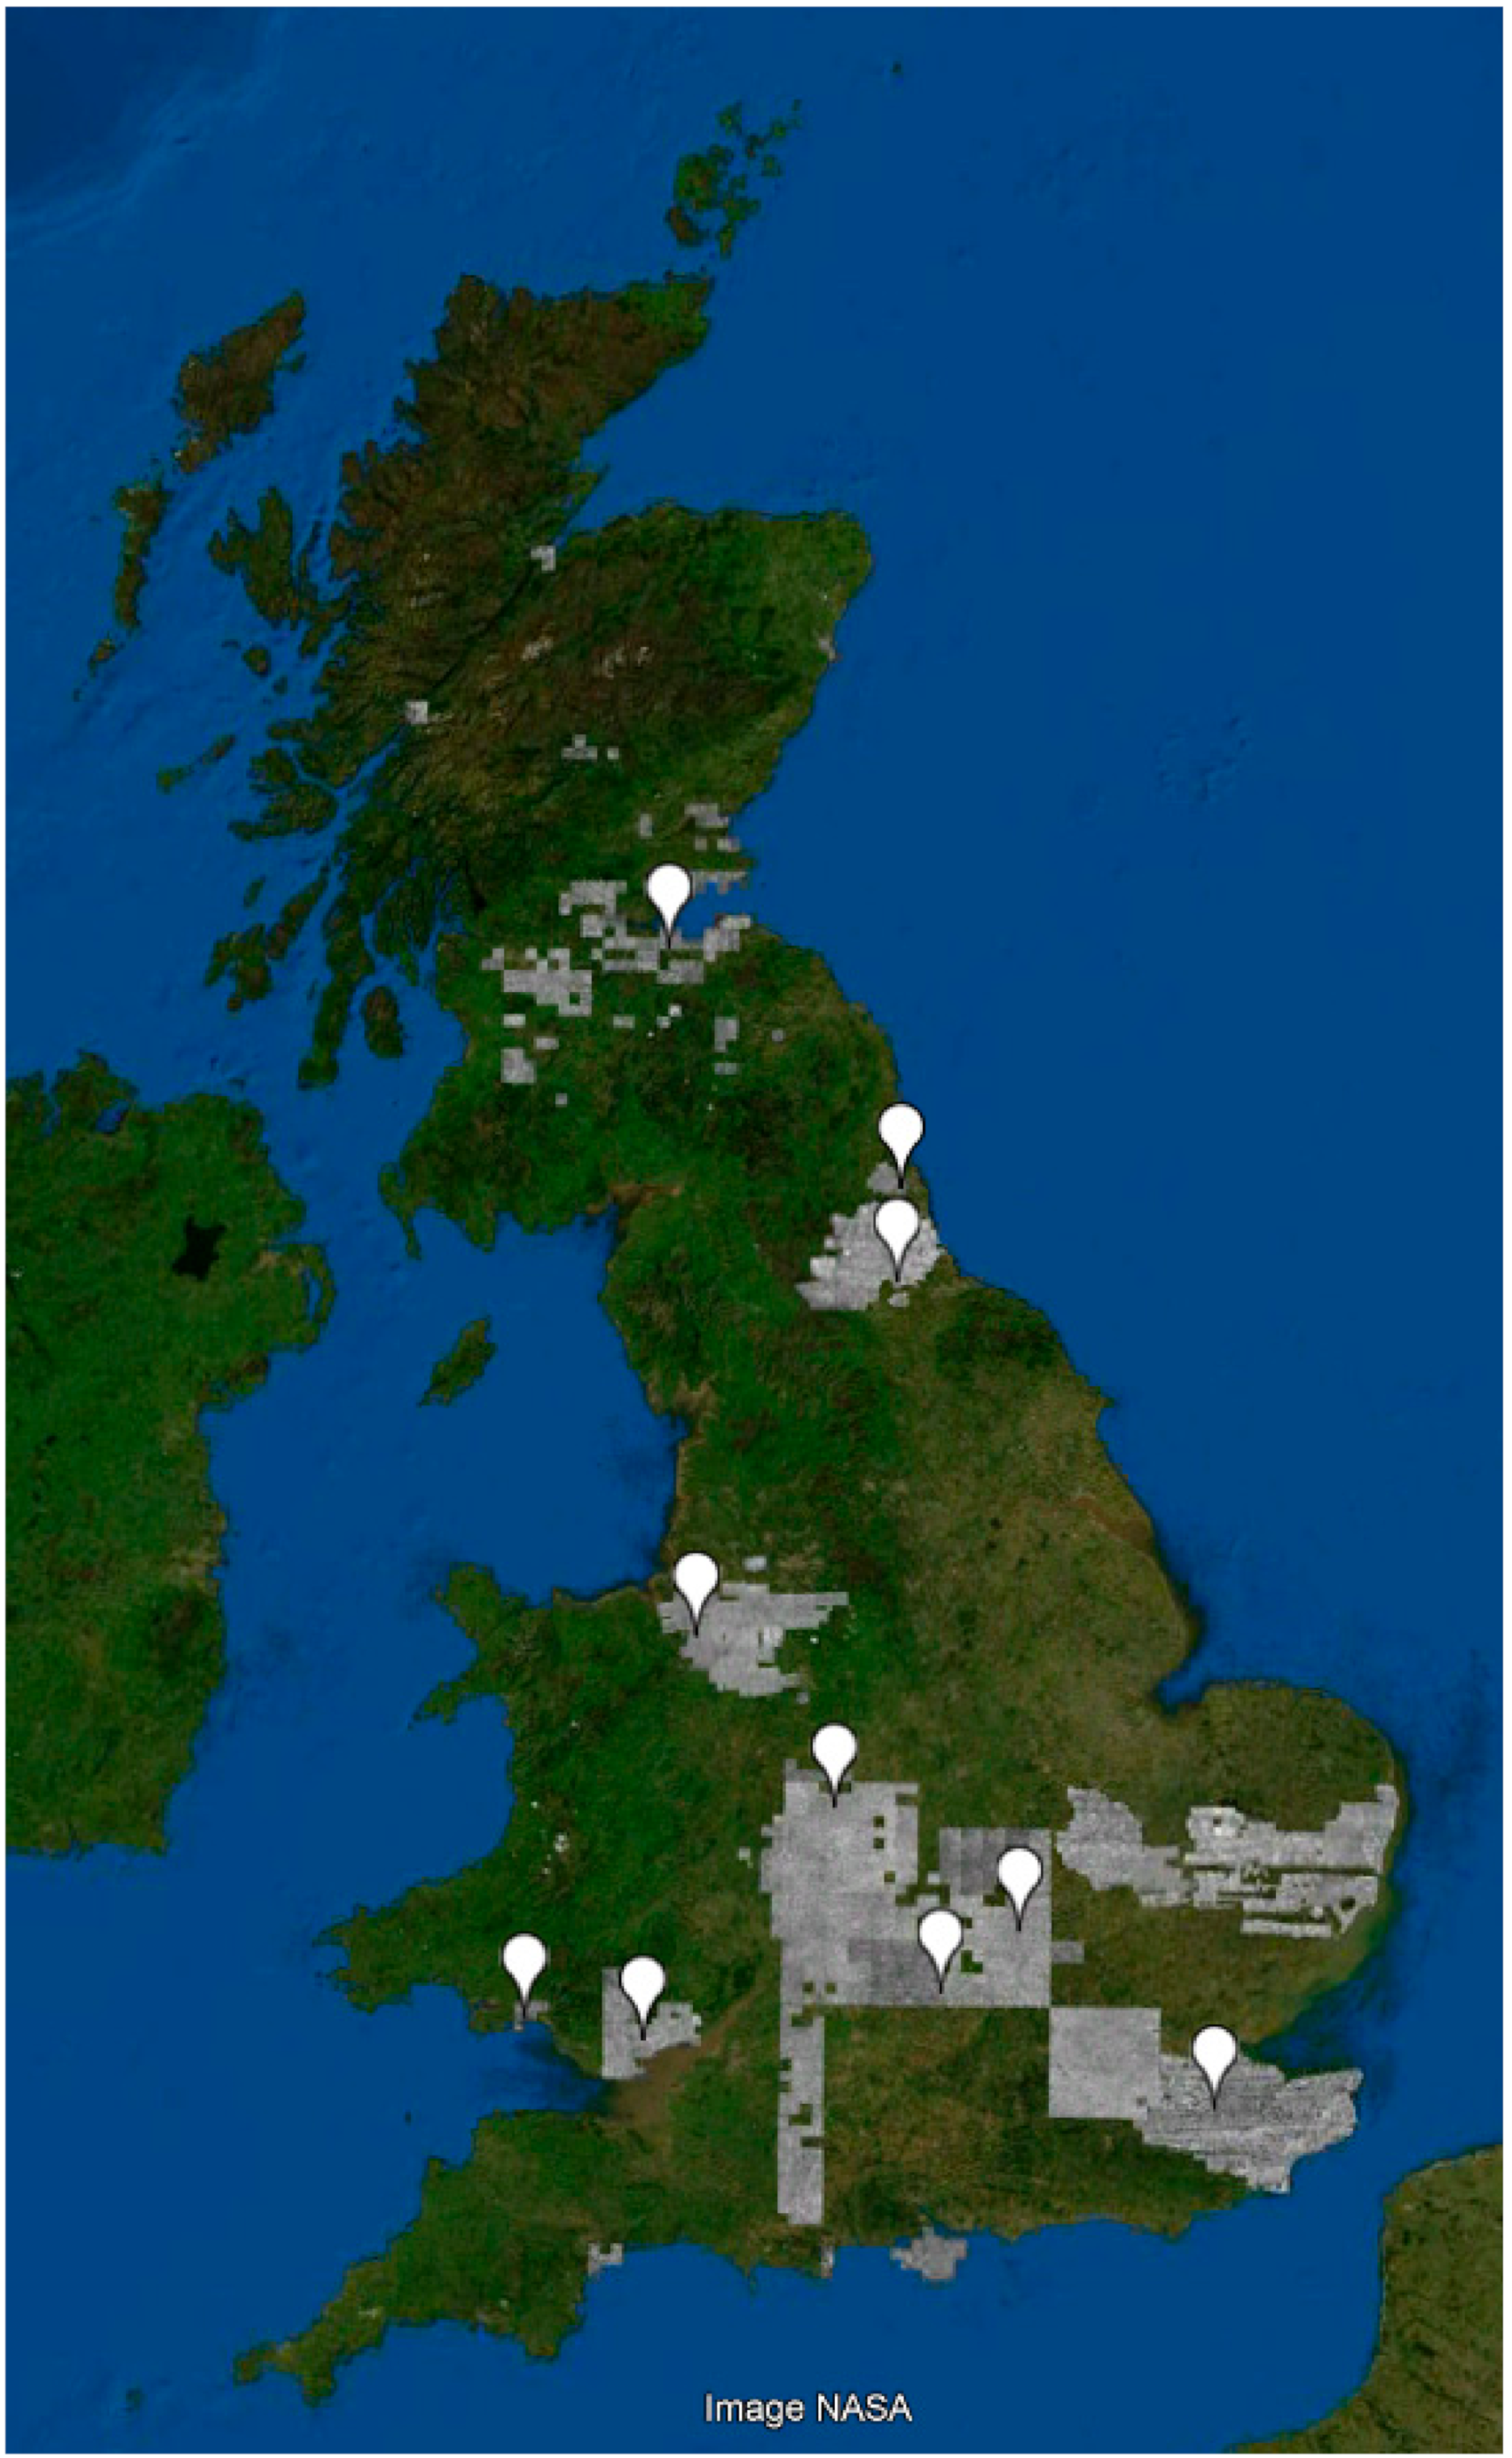
2.2. Study Locations

The following criteria were selected as the basis for choosing the study locations:
  • each of the three countries within Great Britain to be considered,
  • achieve a broad geographic spread for each of England, Scotland and Wales,
  • achieve a mixture of the size of towns,
  • decadal historic aerial photography availability,
  • comparable canopy cover survey data from within the past 5 years available.
The study locations were chosen and the rationale for their selection is presented in Table 2. The locations are shown in Figure 1 to reveal geographical coverage.

2.3. Survey Method

Reviewing previous historic canopy cover assessments revealed a range of four methodologies with potential for the current study (see Section 1.2). OBIA was discounted due to data and resource availability, leaving four options:
  • paired historical (non-aerial) photography (e.g., [18]),
  • random polygon assessment of paired aerial imagery (e.g., [17]),
  • digitizing canopies on low altitude aerial photography (e.g., [24]),
  • random point-based assessment of paired aerial imagery (see e.g., [7,26,27]).
Random point-based assessment of paired aerial imagery was chosen due to its ease of application, the availability of free-of-charge aerial imagery, and comparability to previous canopy cover studies conducted in GB. The method utilizes random points overlaid across aerial imagery. The random points were created within urban boundaries using the “Create Random Points” tool in ESRI’s ArcMap version 10.6.1. The urban boundaries used for all time points were the same as those used in Doick et al. [10] the primary repository of previous i-Tree Canopy assessments in GB. Where boundaries were not available—as in the case of Swansea—the boundary from Natural Resources Wales’ (NRW) hand mapping of Tree Cover in Wales’ Towns and Cities was selected [42]. The boundary was also unavailable for Milton Keynes, where the outline of the central 15 wards of Milton Keynes was used.
Most of the other GB canopy cover studies were conducted in i-Tree Canopy: an online tool part of the i-Tree Software Suite [43] designed to allow users to easily estimate various land cover classes, including tree cover. i-Tree Canopy recommends assessing a minimum of 500 sample points per study area. This is increased for larger towns, cities and metropolitan areas, typically by increasing sampling numbers to achieve a standard error of less than 2%. The number of points used was determined, firstly, according to the number of points used in previous studies, for comparability; this includes for Birmingham where the selected number of 500 is comparatively small for such a large study area. Secondly, where imagery was not available for any one year that point was removed for all years. See Table 2 for the final number of points assessed for each location.
Each of the sampling points was assessed for each of the dates using the historical imagery function on Google Earth. The points were labelled either 1 (denoting a tree) or 0 (zero; denoting non-tree). Each point was assessed for all years before moving onto the next point in order to help account for parallax (the effect whereby the position or direction of an object appears to differ when viewed from different positions) or georeferencing errors leading to uncertainty in positional accuracy (georeferencing is the process by which an image is mapped onto a coordinate system to allow it to be comparable and spatially relevant). With historic aerial imagery, it can be difficult to accurately map to the desired coordinate system due to changes in landmarks and/or image distortion. If parallax or positional uncertainty appeared to be at play, a note was made and the location was taken to be that as defined in the most recent survey. All surveying was undertaken by the secondary author and one other researcher to reduce error and inconsistency that may have occurred from using multiple assessors.
For some of the imagery from 1945, it was difficult to determine whether the point was a tree or not. In this case, the oblique aerial imagery from Britain from Above [30] (various dates) was employed. These images were not available for all points, however, where available they could be used to indicate the likelihood of a point containing a tree or not (Figure 2).
For each of the study locations (except Milton Keynes and Swansea) an independent canopy cover assessment had been undertaken in 2016 utilizing the comparable i-Tree Canopy (https://canopy.itreetools.org/) (photo-interpretation, random point-based approach) [10]. For Swansea, the independent assessment was via polygon analysis of hand-mapped aerial imagery, conducted in 2013 [42]. A comparison to these studies was employed to provide assurance on the suitability of the adopted methodology and the accuracy of our assessors. In each case, the assessed canopy cover percentage fell within the range of the reported error estimates of the independent study.

2.4. Statistical Analyses

Analysis to determine the change in canopy cover were conducted in R (version 3.5.2, R Core Team 2018). Pairwise comparisons of canopy cover were made between each year using the “pairwise.prop.test” function in R, within each city. This a two-sided hypothesis test for proportions, it tests the null hypothesis that two proportions are the same. The test uses Pearson’s Chi-Square statistic to derive p-values and confidence intervals for the difference in two-proportions. This test was chosen to directly compare the tree cover between any two given years.
Percentage canopy cover was then arcsine square-root transformed and analyzed using linear regression with year, centred in 1945, as a predictor variable. As canopy cover was significantly different in 1945, compared to all other years, a second analysis was run removing the 1945 time point to analyse the change in canopy cover from ~2000 onwards. A significant p-value in this analysis indicates an increase or decrease in canopy cover depending on the sign of the estimate. p-values were adjusted using multiple comparisons using the False Discovery Rate (FDR) method [44]. The FDR adjustment ranks ascending p-values (i) and uses the overall number of statistical tests (m) and specified FDR rate (Q = 0.05) to create an experiment-wide threshold for statistical significance, and thus controlling the number of false-positive discoveries:
i m × Q

3. Results

Figure 3A–C show the results of the historic canopy cover survey for the ten study locations. For each, the overall trend is revealed by the linear regression line, fitted to the full time period. The y-axes in Figure 3A–C are on the arcsine transformed scale but labelled according to the corresponding percentage canopy cover value. The regression estimates and p-values are shown in Table 3. The p-values for the pairwise comparisons of proportion of tree cover for each of the ten locations are provided in the Supplmentary Materials. Overall, since the 1940s, seven of the ten study locations experienced a statistically significant increase in canopy cover (p < 0.05; Table 3). The results are described for each study location below.

3.1. Canopy Cover Change: Scotland

In Scotland, only Edinburgh–Scotland’s capital, and an historic centre–met all the criteria for inclusion in the study, and despite aerial imagery being incomplete assessment was achieved at 805 points for six time points (Table 2; Figure 3C). Regression analyses revealed a significant increase in canopy cover from 1945 to 2018 (p = 0.001) (15.8% s.e. = 1.3% to 21.1% s.e. = 1.4%, respectively; errors are one SEM; Figure 3C). Change in canopy cover was no longer significant after the removal of the 1945 time point (p = 0.073); however, as the estimates for the regressions are comparable (total sample = 0.0009 vs. recent sample = 0.001) this is likely due to reduced power when removing a data point.

3.2. Canopy Cover Change: Wales

Changes in historic tree canopy cover were assessed in two locations in Wales. In Cardiff, the change was not statistically significant (p > 0.05): 17.5% s.e. = 1.3% in 1945 vs. 18.7% s.e. = 1.3% in 2018 (errors are one SEM) (Figure 3C and Table 3). With a standard error estimate of 1.3% on a canopy cover increase of just 1.2%, not only is the change not statistically significant, it would take over four decades at the current rate to measure a significant change. The regression estimate (gradient of the slope) (1945 to 2018) in Cardiff was the smallest of all the ten study locations. At the second location, Swansea, a significant increase was observed (p = 0.003; Table 3), rising from 18.8% s.e. = 1.8% in 1945 to 23.6% s.e. = 1.9% in 2018 (errors are one SEM) (Figure 3C). After removing the 1945 time point the association between year and canopy cover was no longer significant (Table 3) suggesting that the change in canopy cover was driven by changes from 1945–2001. At nearly 24%, the contemporary canopy cover of Swansea is high for a coastal location in GB [10] and greater than both the Welsh and GB urban averages [10,42] despite its history as an industrial city, and which continues to this day [34].

3.3. Canopy Cover Change: England

Seven locations were studied in England for historical canopy cover change. In comparison to Scotland and Wales, five out of seven towns showed increases in canopy cover from 1945 to 2018; however, decreases in canopy cover were observed in four out of seven towns after removing the 1945 time point from the analyses.

3.3.1. Canopy Cover Change: Birmingham

Trend analysis of canopy cover change in Birmingham revealed the second slowest rate of change of the ten locations investigated (estimate = 0.0003) (Table 3; Figure 3B) and the putative 5% increase from 21.4% s.e. = 1.8% in 1945 to 26.2% s.e. = 2.0% in 2006 did not result in an overall significant change due to a subsequent fallen in cover to 22.4% s.e. = 1.9% in 2018 (errors are one SEM). Indeed, the contemporary rate of change in canopy cover (1999–2018) was negative (estimate = −0.003, p = 0.009; Table 3). The large error estimates observed in Birmingham (SEM: 1.8–2%) are likely an artefact of the low sampling rate (only one sample per square-kilometre and the lowest sample density of any of the ten study locations; Table 2).

3.3.2. Canopy Cover Change: Chester

Analysis of canopy cover in Chester revealed a significant positive increase in canopy cover, changing from just 10.8% s.e. = 1.4% in 1945 (the third lowest initial coverages) to 17.2% s.e. = 1.7% in 2018 (errors are one SEM; Figure 3A) (p = 0.0002; Table 3). Furthermore, the regression estimate doubled between 2000–2018 in comparison to 1945–2005 (0.001 vs. 0.002, respectively; Table 3).

3.3.3. Canopy Cover Change: Darlington and Newcastle

The results for the north-eastern towns of Darlington and Newcastle showed many similarities despite notable differences in their characterizations: Darlington is a large market town, whereas Newcastle is a metropolitan hub with a strong regionally significant industrial heritage [38,40]. With canopy covers of 8.8% s.e. = 1.3% and 9.6% s.e. = 1.3% respectively (Figure 3A) (errors are one SEM), the towns had the lowest initial cover of all the study locations. Furthermore, both showed statistically significant increases in canopy cover between 1945 and 2018 (p < 0.05; Table 3) at 9.6% s.e. = 1.7% (Darlington) and 9.2% s.e. = 1.7% (Newcastle); they also displayed, respectively, the second and third largest increases between the earliest and latest time points. Pairwise comparisons of percentage canopy cover showed that canopy cover in 1945 in Darlington was significantly lower than all other measured time points (p < 0.0002; Table S4). Removing the 1945 time point from the regression analysis meant that the association with canopy cover became negative, though not significant (Table 3).

3.3.4. Canopy Cover Change: Maidstone

The town of Maidstone, with Birmingham, had the joint highest initial canopy cover (21%). It was the only study location to have a long-term negative canopy cover trend declining from 21.0% s.e. = 1.8% in 1940 to 18.8% s.e. = 1.8% in 2018 (errors are one SEM) (Figure 3A). This average rate of change appears, in part, to be mediated by a 4.6 percent-point increase between a lull of 15.2% in 2011 and the contemporary high of 19.8% in 2018. The contemporary direction of change is also, tentatively, negative (Table 3). While the final value might in part be a response to Maidstone’s “Green and Blue Infrastructure Strategy” [39,45] the typical standard errors of ca. 1.7% associated with this methodology (and the concomitant lack of statistical significance between the time points) again highlight the challenge of tracking canopy cover change with statistical confidence (see Discussion).

3.3.5. Canopy Cover Change: Milton Keynes

Milton Keynes, of all the study locations, had the highest canopy cover at 29.4% s.e. = 2% (2018; Figure 3B). It also had the greatest overall increase, at 13.2 percentage points. The rate of change in canopy coverage was positive and the joint highest of all the study locations (together with Darlington and Newcastle-estimate = 0.002) (p = 0.0002; Table 3). The rate of change between 2000–2018 was even greater than in the preceding 55 years, increasing (Table 3) from 24.8% s.e. = 1.9% in 2000 to 29.8% s.e. = 2.0% in 2018 (errors are one SEM).

3.3.6. Canopy Cover Change: Oxford

Trend analysis of historic canopy cover change in the small heritage-rich city of Oxford [41] revealed a slow increase, rising from 15.2% s.e. = 1.6% in 1945 to 18.6% s.e. = 1.7% in 2018 (errors are one SEM) (Figure 3B). From 2004 to 2018 there is a tentative negative change in canopy cover (Table 3). When all years are included the increase in canopy cover is significant; however, when the 1945 timepoint is removed canopy cover does not significantly change in Oxford, suggesting that the findings were driven by this single influential data point.

4. Discussion

4.1. Trends in Historic Urban Canopy Cover in Great Britain

This study considered the change in urban canopy cover for ten study locations across GB since the 1940s. For all but one location (Maidstone), a long-term trend of increasing canopy cover was observed and where the rate of change exceeded 0.1% per year, the overall increases were statistically significant. For many of the cities, the lower canopy cover in the 1940s is very likely a consequence of World War II with the destruction of trees through bombing, as occurred heavily in Maidstone, Swansea and Birmingham, and as required for timber for the war effort [35,46,47]. Indeed, in Maidstone, where aerial imagery was available for 1940 (i.e., before much of the bombing had occurred), the analysis indicated that canopy cover was higher at the beginning of the war (in 1940) than in the next available imagery post-war (in 1960). Studying the early 1990s war in the former Yugoslavia, Lacan and McBride [48] also report the destructive impact of war on urban forests.
Whilst the war was an influence in the mid-20th century, new factors subsequently impacted the urban forests of GB throughout the latter half of the century. Town planning, local as well as national socioeconomic fluctuations, and changes in vegetation preference and management activities have all been noted as influential factors determining urban forest content and spread [6]. This is particularly the case in Milton Keynes: as a new town conceived in the late 1960s, the area changed from primarily undeveloped farmland and small villages into a university town with a population of almost 230,000 in 2011 [16]. The original plan for Milton Keynes included a significant amount of tree planting and green infrastructure and, with this plan completed in 2008 [49], the town’s tree canopy cover has grown substantially (Figure 3A). At the current rate of expansion, Milton Keynes’ canopy cover will exceed 30% by 2030. According to Doick et al. [10], <3% of towns cities in GB have tree canopy cover > 30%.
The long-term change rate by itself, however, can mask much of the picture. For example, the equivalent 0.7% decadal rate of change recorded for Edinburgh between 1945 and 2018 was significant, yet for Oxford and Swansea with comparable canopy cover change rates (0.6 and 0.7% per decade, respectively) the trends were not statistically significant due to a reversing trend or an increase in inter-year variability amongst the latter time points (Figure 3). Indeed, four towns had a tentative negative trend from 2000 to 2018: Birmingham, Darlington, Maidstone, and Oxford. For Birmingham, the long-term average rate of change of 0.027% per annum masks the three-times greater rate of change and ca. 5% increase observed between 1945 (21.4% s.e. = 1.8%) and 2002 (26.2% s.e. = 2%)—an average per annum rate of change of 0.078%—because canopy cover subsequently went on to decrease to 24% in 2011 and 2013, and then to 22% in 2016 and 2018. The mixed picture of increasing then decreasing rates of change in Birmingham reflects the dynamic development and redevelopment of the city following WWII’s “Birmingham Blitz” and the collapse of Birmingham’s economy during the recession of the early 1980s [35]. Diaz-Porras et al. [18] found an initial decline in Sheffield’s urban canopy cover in the first half of the twentieth century followed by an increase later. These studies epitomize the challenges of monitoring changes in canopy coverage across a dynamic urban landscape and that even studies covering multiple decades represent only part of the story in the long history of towns and cities.

4.2. Implications for Urban Tree Canopy Cover Targets

Properly managed “urban forests” make important contributions to the planning, design and management of sustainable, resilient townscapes—they help make cities safer, more pleasant, more diverse and attractive, wealthier and healthier [50]. Unsurprisingly, many cities around the world have set targets for tree canopy cover. Previously summarized [10], a minimum target of 20% is reported, with 25% to 35% commonplace, and higher-level targets of 40% noted for both Melbourne, Australia and Toronto, Canada. Such targets are relatively uncommon in GB, with “one tree per resident” or “one tree per child” more widely observed. Some examples are however noteworthy: city of Bristol aims to double its tree canopy cover to 30% between 2018 and 2050 [51]; Wrexham town has a target to increase cover to 20% by 2026, from a 2009 baseline of 13% [52]; and a 3-percentage point increase in tree canopy cover by 2034 was proposed for Plymouth City from a baseline of 16% in 2017 [53]. Such aspirations seem modest in comparison to the international examples, and so it is interesting to consider what our historical trends may infer with respect to their appropriateness. The international examples typically set 20- to 25-year intervals for attaining their target; or an annual increase of 0.2 to 0.8% (average 0.4% per year). The GB examples equate to 0.17, 0.41 and 0.47% per annum (Plymouth, Wrexham and Bristol respectively). The average contemporary (past two decades) canopy cover change rates revealed in this study of 0.04% to 0.23% per annum (omitting those locations with a declining rate) suggest that only Plymouth, of the three stated targets, will likely attain their goal. Whilst it is a simplification to state these trends as annual rates of change, the inference is that targets may be a challenge without concerted effort via a locally relevant strategy. Specifically, repeating the methodology herein for the three locations will give an indication of their recent short-term trend and help indicate the extent of intervention required. Diaz-Porras [18] reported that trends of increasing canopy cover were not a guarantee for maintaining cover long-term, and the rise and fall of cover observed in our study would seem to support this conclusion. Understanding the magnitude of urban tree cover and how it is changing, is the first step towards a better comprehension and understanding of whether management actions have been effective [20].

4.3. Methodological Challenges

While seeking to highlight trends in canopy cover change over the past ca. 75 years in ten towns in GB, the study was not able to include data from the 1950s, 1960s (except Maidstone, one timepoint), 1970s or 1980s due to a lack of free-of-charge aerial imagery. Furthermore, the only 1990s timepoints available were for Maidstone 1990 and Birmingham 1999, and a modest five to seven time points were available for each location from 2000 onwards. Subsequently, the long-term trend analysis was strongly influenced by the 1940′s time point, notably so for Darlington, Oxford, and Swansea (see Results section). Future work should seek to identify other image databanks, including purchasing imagery where possible, in order to lengthen the study’s time period and/or increase the total number of time points analysed (see also comments in the final paragraph on image quality).
While the analysis of further imagery—if found to be available—could strengthen the study, the range and quantity of imagery available were sufficient to fulfil the current study’s aims and, as a national first, the results help speak to contemporary ad hoc concerns that urban canopy cover is universally decreasing: indeed, only four of the ten locations are revealed to have tentatively declining trends in canopy coverage since 2000. However, data variability (as indicated by the standard errors, and the subsequent statistical analysis) indicates that it is not possible to state with certainty the current direction, nor rate, of change in urban canopy cover. While statistical robustness can be improved by increasing the sampling rate this would require additional resource: approximately 1500 sample points (a trebling of the sampling duration and cost) are necessary to reduce the standard error to 1% for an area of 20% canopy cover. The results indicate a need for new ways to determine urban tree canopy cover from historic records, ideally approaches that are low cost, or automated.
The current study was also constrained by the number of locations that were assessed, limiting analysis of geographic or regional differences for the observed trends, and the drivers of change. While 1940s aerial imagery is sparse across GB, further analysis in the central belt of Scotland, England’s midlands, parts of Essex and Cambridgeshire, London, and the Isle of Wight could all be considered for future analysis comparable to the current study (Figure 1).
Resource limitations constrained point allocation to tree/non-tree only, omitting to including land-use classification. As such, some of the drivers of change such as urbanization (city expansion) could not be confirmed by the adopted methodology. For a national study, this would have been informative: Chen et al. [8] reported that urbanization from agricultural to a domestic land-use saw an increase in canopy cover, but only due to the establishment of tree nurseries that did not offer canopy closure or the full range of ecosystem services that urban trees have the potential to deliver [5]. Blackman and Yuan [14] note that the random-point-based method only shows the total coverage of the classes without locational information. Resources permitting, however, local authorities wishing to adopt historic trend analysis to inform future strategic direction may design their studies to also consider recording broad land-use categories, such as “agricultural” or “residential”. Such stratification in local adoption of the methodology could complement knowledge residing with local historians and natural heritage experts on the causes of change [54].
Finally, it was at times a challenge to confirm the presence of trees due to uncertainty in positional accuracy, and image quality. For example, some images were black and white, some had cloud coverage, and resolution varied leading to occasional blurring when zooming-in. Combining the 1945 lower altitude Britain From Above images helped, however, this was time-consuming and often only a single complementary image was available. The low resolution may also have led to a discrepancy at the size interface between shrub and tree. While this study only sought to identify points as tree/non-tree (present/absent) and zooming in and out can be a useful approach with these studies for gaining size perspective, the low resolution of some images is likely to have led to some smaller trees being misclassified as non-tree. Future research could seek to identify (or purchase) high-resolution imagery or make use of the extensive catalogue of oblique imagery available for England [55], though this would require consideration of the impact of image angle on the results and would be more time consuming than the current methodology. However, if proven reliable, it could widen both the number of locations for which historical analysis could be conducted, as well as the number of time points that could be considered. Alternatively, growth in OBIA and OBIA-fused techniques offer considerable promise, especially where open-source solutions start to compete with proprietary solutions [14,21].

5. Conclusions

Historic canopy cover trend analysis is uncommon and constrained to only a few countries worldwide. In the UK, there is only one such published study and one unpublished and they both focus on a single locality. Understanding how canopy cover is changing is required to inform strategic management of urban forests and highlight the changes in the benefits that they provide to nature and society and how this will be impacted by changes in climate, socio-economic pressures, and management regimes. Assessing urban tree canopy cover change for ten towns across GB using a random point-based assessment of paired aerial images from the 1940s to 2018 revealed a generally upward trend. However, uncertainty exists in contemporary rates and directions of change and tentatively support concerns that tree cover is in decline in urban GB. The results indicate a need for ongoing research to broaden the geographic spread of analysis, coupled with greater emphasis on the drivers of change, and a need for novel, cost-effective means to detect and monitor urban tree canopy cover change.

Supplementary Materials

The following are available online at https://www.mdpi.com/1999-4907/11/10/1049/s1, Pairwise comparisons of tree cover, for each of the ten locations. Table S1: p-values for the pairwise comparisons of proportion of tree cover in Birmingham; Table S2: p-values for pairwise comparisons of proportion of tree cover in Cardiff; Table S3: p-values for pairwise comparisons of proportion of tree cover in Chester; Table S4: p-values for pairwise comparisons of proportion of tree cover in Darlington; Table S5: p-values for pairwise comparisons of proportion of tree cover in Edinburgh; Table S6: p-values for pairwise comparisons of proportion of tree cover in Maidstone; Table S7: p-values for the pairwise comparisons of proportion of tree cover in Milton Keynes; Table S8: p-values for the pairwise comparisons of proportion of tree cover in Newcastle; Table S9: p-values for the pairwise comparisons of proportion of tree cover in Oxford; Table S10: p-values for the pairwise comparisons of proportion of tree cover in Swansea.

Author Contributions

Conceptualization and Methodology, K.J.D. and A.B.; Formal Analysis, A.B. and T.-K.C.; Investigation, A.B.; Resources, K.J.D.; Data Curation, A.B.; Writing, A.B. and K.J.D.; Writing—Review & Editing, K.J.D. and T.-K.C.; Visualization, K.J.D. and T.-K.C.; Supervision, K.J.D.; Project Administration, K.J.D.; Funding Acquisition, K.J.D. All authors have read and agreed to the published version of the manuscript.

Funding

This work was supported by the FORESTRY COMMISSION.

Acknowledgments

Thanks to Philip Metcalf (National Forest Company, England) and Dave Nowak (USDA Forest Service) for sharing their findings and insights into historic canopy cover mapping, and Kate Sparrow for help with the manuscript preparation.

Conflicts of Interest

The authors declare no conflict of interest.

References

  1. Grove, J.M.; O’Neil-Dunne, J.; Pelletier, K.; Nowak, D.; Walton, J. A Report on New York City’s Present and Possible Urban Tree Canopy; United States Department of Agriculture, Forest Service: Northeastern Area, South Burlington, VT, USA, 2006. [Google Scholar]
  2. Pasher, J.; McGovern, M.; Khoury, M.; Duffe, J. Assessing carbon storage and sequestration by Canada’s urban forests using high resolution earth observation data. Urban For. Urban Green. 2014, 13, 484–494. [Google Scholar] [CrossRef]
  3. Moskal, L.M.; Styers, D.M.; Halabisky, M. Monitoring urban tree cover using object-based image analysis and public domain remotely sensed data. Remote Sens. 2011, 3, 2243–2262. [Google Scholar] [CrossRef] [Green Version]
  4. UFWACN. Introducing England’s Urban Forests: Definition, Distribution, Composition and Benefits; Urban Forestry and Woodlands Advisory Committees Network: England, UK, 2016. [Google Scholar]
  5. Davies, H.J.; Doick, K.J.; Handley, P.; O’Brien, L.; Wilson, J. Delivery of Ecosystem Services by Urban Forests; Forestry Commission Research Report 26; Forestry Commission: Edinburgh, UK, 2017; 34p. [Google Scholar]
  6. Nowak, D.J. Historical vegetation change in Oakland and its implications for urban forest management. J. Arboric. 1993, 19, 313–319. [Google Scholar]
  7. Nowak, D.J.; Greenfield, E.J. Declining urban and community tree cover in the United States. Urban For. Urban Green. 2018, 32, 32–55. [Google Scholar] [CrossRef]
  8. Chen, L.; Wang, L.; Li, G.; Ma, F.; Zhang, Z. Understanding treescape changes as the basis of urban forest planning in fringe areas. Ecol. Indic. 2018, 95, 117–126. [Google Scholar] [CrossRef]
  9. Templeton, L.K.; Neel, M.C.; Groffman, P.M.; Cadenasso, M.L.; Sullivan, J.H. Changes in vegetation structure and composition of urban and rural forest patches in Baltimore from 1998 to 2015. For. Ecol. Manag. 2019, 454, 117665. [Google Scholar] [CrossRef]
  10. Doick, K.J.; Davies, H.J.; Moss, J.; Coventry, R.; Handley, P.; Rogers, K.; Simpkin, P. The Canopy Cover of England’s Towns and Cities: Baselining and setting targets to improve human health and well-being. In Trees, People and the Built Environment III, International Urban Trees Research Conference; University of Birmingham: Birmingham, UK, 2017. [Google Scholar]
  11. Canopy Cover Map for the UK. Available online: http://forestry.maps.arcgis.com/apps/webappviewer/ index.html?id=d8c253ab17e1412586d9774d1a09fa07 (accessed on 11 September 2020).
  12. Baily, B.; Riley, M.; Aucott, P.; Southall, H. Extracting digital data from the first Land Utilisation Survey of Great Britain-methods, issues and potential. Appl. Geogr. 2011, 31, 959–968. [Google Scholar] [CrossRef]
  13. Parmehr, E.G.; Amati, M.; Taylor, E.J.; Livesley, S.J. Estimation of urban tree canopy cover using random point sampling and remote sensing methods. Urban For. Urban Green. 2016, 20, 160–171. [Google Scholar] [CrossRef]
  14. Blackman, R.; Yuan, F. Detecting Long-Term Urban Forest Cover Change and Impacts of Natural Disasters Using High-Resolution Aerial Images and LiDAR Data. Remote Sens. 2020, 12, 1820. [Google Scholar] [CrossRef]
  15. McGovern, M.; Pasher, J. Canadian urban tree canopy cover and carbon sequestration status and change 1990–2012. Urban For. Urban Green. 2016, 12, 227–232. [Google Scholar] [CrossRef] [Green Version]
  16. Milton Keynes. Available online: https://en.wikipedia.org/wiki/Milton_Keynes (accessed on 7 July 2020).
  17. Merry, K.; Siry, J.; Bettinger, P.; Bowker, J.M. Urban tree cover change in Detroit and Atlanta, USA, 1951–2010. Cities 2014, 41, 123–131. [Google Scholar] [CrossRef]
  18. Díaz-Porras, D.F.; Gaston, K.J.; Evans, K.L. 110 Years of change in urban tree stocks and associated carbon storage. Ecol. Evol. 2014, 4, 1413–1422. [Google Scholar] [CrossRef] [PubMed]
  19. Nowak, D.J.; Hoehn, R.E.; Bodine, A.R.; Greenfield, E.J.; O’Neil-Dunne, J. Urban forest structure, ecosystem services and change in Syracuse, NY. Urban Ecosyst. 2016, 19, 1455–1477. [Google Scholar] [CrossRef]
  20. Nowak, D.J.; Greenfield, E.J. The increase of impervious cover and decrease of tree cover within urban areas globally (2012–2017). Urban For. Urban Green. 2020, 49, 126648. [Google Scholar] [CrossRef]
  21. Ellis, E.A.; Matthews, A.J. Object-based delineation of urban tree canopy: Assessing change in Oklahoma City, 2006–2013. Comput. Environ. Urban Syst. 2019, 73, 85–94. [Google Scholar] [CrossRef]
  22. Katz, D.S.W.; Batterman, S.A.; Brines, S.J. Improved Classification of Urban Trees Using a Widespread Multi-Temporal Aerial Image Dataset. Remote Sens. 2020, 12, 2475. [Google Scholar] [CrossRef]
  23. Berland, A. Long-term urbanization effects on tree canopy cover along an urban-rural gradient. Urban Ecosyst. 2012, 15, 721–738. [Google Scholar] [CrossRef]
  24. Gillespie, T.W.; Pincetl, S.; Brossard, S.; Smith, J.; Saatchi, S.; Pataki, D.; Saphores, J.D. A time series of urban forestry in Los Angeles. Urban Ecosyst. 2012, 15, 233–246. [Google Scholar] [CrossRef]
  25. Nowak, D.J.; Greenfield, E.J. Tree and impervious cover change in US cities. Urban For. Urban Green. 2012, 11, 21–30. [Google Scholar] [CrossRef] [Green Version]
  26. Kaspar, J.; Kendal, D.; Sore, R.; Livesley, S.J. Random point sampling to detect gain and loss in tree canopy cover in response to urban densification. Urban For. Urban Green. 2017, 24, 26–34. [Google Scholar] [CrossRef]
  27. Roman, L.A.; Fristensky, J.P.; Eisenman, T.S.; Greenfield, E.J.; Lundgren, R.E.; Cerwinka, C.E.; Hewitt, D.A.; Welsh, C.C. Growing canopy on a college campus: Understanding urban forest change through archival records and aerial photography. Environ. Manag. 2017, 60, 1042–1061. [Google Scholar] [CrossRef] [PubMed]
  28. Metcalfe, P. Historic Urban Canopy Cover of Swadlincote; Burton-upon-Trent: England, UK, 2018; Unpublished data. [Google Scholar]
  29. Google Earth Pro. Available online: https://earth.google.co.uk (accessed on 28 August 2019).
  30. Britain from Above. Available online: https://britainfromabove.org.uk/ (accessed on 28 May 2019).
  31. Edinburgh. Available online: https://en.wikipedia.org/wiki/Edinburgh (accessed on 10 September 2020).
  32. ONS. Estimates of the Population for the UK, England and Wales, Scotland and Northern Ireland. Mid-2019: April 2020 Local Authority District Codes Version of this Dataset. Available online: https://www.ons.gov.uk/peoplepopulationandcommunity/populationandmigration/populationestimates/datasets/populationestimatesforukenglandandwalesscotlandandnorthernireland (accessed on 10 September 2020).
  33. Cardiff. Available online: https://en.wikipedia.org/wiki/Cardiff (accessed on 10 September 2020).
  34. Swansea. Available online: https://en.wikipedia.org/wiki/Swansea (accessed on 10 September 2020).
  35. Birmingham. Available online: https://en.wikipedia.org/wiki/Birmingham (accessed on 10 September 2020).
  36. Chester. Available online: https://en.wikipedia.org/wiki/Chester (accessed on 10 September 2020).
  37. 2011 Census Results. People and Population Profile, Chester locality. Available online: http://inside.cheshirewestandchester.gov.uk/GetFile?fileUrl=/KeyStatistics/2011CensusPeopleAndPopProfileChesterLocality.pdf&extension=pdf (accessed on 10 September 2020).
  38. Darlington. Available online: https://en.wikipedia.org/wiki/Darlington (accessed on 10 September 2020).
  39. Maidstone. Available online: https://en.wikipedia.org/wiki/Maidstone (accessed on 10 September 2020).
  40. Newcastle. Available online: https://en.wikipedia.org/wiki/Newcastle_upon_Tyne (accessed on 10 September 2020).
  41. Oxford. Available online: https://en.wikipedia.org/wiki/Oxford (accessed on 10 September 2020).
  42. NRW. Town Tree Cover in the City and County of Cardiff; Natural Resources Wales: Aberystwyth, Wales, UK, 2016. [Google Scholar]
  43. i-Tree Canopy. Available online: https://canopy.itreetools.org/ (accessed on 16 May 2019).
  44. Benjamini, Y.; Hochberg, Y. Controlling the false discovery rate: A practical and powerful approach to multiple testing. J. R. Stat. Soc. Ser. B 1995, 57, 289–300. [Google Scholar] [CrossRef]
  45. Maidstone Borough Council Green and Blue Infrastructure Strategy. Available online: http://www.maidstone.gov.uk/__data/assets/pdf_file/0004/164659/Green-and-Blue-Infrastructure-Strategy-June-2016.pdf (accessed on 7 July 2020).
  46. Swansea–A Brief History. Available online: http://www.swanseamuseum.co.uk/swansea-a-brief-history (accessed on 7 July 2020).
  47. Maidstone Grammar School: MGS and War. Available online: https://www.mgs.kent.sch.uk/about-mgs/history/mgs-and-war/ (accessed on 7 July 2020).
  48. Lacan, I.; McBride, J.R. War and trees: The destruction and replanting of the urban and peri-urban forest of Sarajevo, Bosnia and Herzegovina. Urban For. Urban Green. 2009, 8, 133–148. [Google Scholar] [CrossRef]
  49. History of Milton Keynes. Available online: https://www.milton-keynes.gov.uk/planning-and-building/conservation-and-archaeology/history-of-mk (accessed on 2 February 2019).
  50. Salbitano, F.; Borelli, S.; Conigliaro, M.; Chen, Y. Guidelines on Urban and Peri-Urban Forestry; FAO Forestry Paper No.178; Food and Agriculture Organization of the United Nations: Rome, Italy, 2016; 169p. [Google Scholar]
  51. Bristol Green Capital Partnership: New Ambitious Target Launched to Double City Tree Canopy Cover by 2050. Available online: https://bristolgreencapital.org/new-ambitious-target-launched-double-city-tree-canopy-cover-2050/ (accessed on 28 May 2020).
  52. Wrexham County Borough Council (WCBC). Wrexham’s Tree and Woodland Strategy (2015–2025): A Strategy for the Sustainable Management, Protection and Enhancement of Wrexham County Borough’s Tree Population; WCBC: Wrexham, Wales, UK, 2016; 115p. [Google Scholar]
  53. Rogers, K.; Handley, H. Plymouth Policy Area Tree Canopy Cover Assessment; Treeconomics: Exeter, UK, 2017; 55p. [Google Scholar]
  54. Johnson, M. Trees in Towns and Cities: A History of British Urban Arboriculture; Oxbow Books: Oxford, UK, 2017; ISBN 978-1-909686-62-5. [Google Scholar]
  55. Aerial Photos. Available online: https://historicengland.org.uk/images-books/archive/collections/aerial-photos/ (accessed on 7 August 2020).
Figure 1. The chosen urban areas shown on a map of Great Britain, with the base map of available 1940/45 aerial photography data shown in black and white (Aerial photography acquired from Google Earth Pro: Google Maps, 2020. maps.google.com [online] [Accessed 7 May 2019].
Forests 11 01049 g001
Figure 2. Images to show the use of oblique aerial imagery available from Britain from above to check the classification of points where poor quality constrained classification using aerial photography alone.
Forests 11 01049 g002
Figure 3. Change in tree canopy cover in the ten study locations in England in (A) Chester, Darlington, Milton Keynes and Newcastle; (B) Birmingham, Maidstone and Oxford; and in (C) Edinburgh, Scotland and Cardiff and Swansea, Wales. All error bars are one standard error of the mean. In each case, lines represent the linear regression line for all time points. The scale of the y-axis is for the arcsine transformed values, but the annotation represents the original percentage canopy cover values.
Forests 11 01049 g003aForests 11 01049 g003b
Table 1. Summary of previous assessments.
StudyMethod(s)LocationTime Period
[6]
Nowak (1993)
Random point-based approach; photo and map interpretationsOakland, California1939–1993
(54 years)
[23]
Berland (2012)
Random polygons distanced along a transectMinnesota’s Twin Cities, Metropolitan Area1937–2009
(72 years)
[24]
Gillespie et al. (2012)
Low altitude oblique aerial photographs compared to recent aerial photography; polygon approachLos Angeles, California1920s–1960s, and 2006
(86 years)
[25]
Nowak and Greenfield (2012)
Photo-interpretation; paired points through time20 cities in the conterminous USApprox. 5 years (different in each area dependent on the imagery available)
[18]
Diaz-Porras et al. (2014)
Photo-interpretation; paired points through time (not aerial)Sheffield, England1900s–1950s–2010
(110 years)
[17]
Merry et al. (2014)
Photo-interpretation; paired points through time
Photo-interpretation; polygon approach
Detroit, Michigan and
Atlanta, Georgia
1951–2010
(59 years)
[15]
McGovern and Pasher (2016)
Photo-interpretation; paired points through timeUrban areas, Canada1991 and 2011
(20 years)
[19]
Nowak et al. (2016)
Photo-interpretation; paired points through timeSyracuse, New York1994–1999–2003–2006–2009
(15 years)
[26]
Kaspar et al. (2017)
Photo-interpretation; paired points through time6 Melbourne Suburbs, Australia2010–2015
(5 years)
[27]
Roman et al. (2017)
Random point-based approachUniversity of Pennsylvania, Philadelphia1970–2012
(42 years)
[7]
Nowak and Greenfield (2018)
Photo-interpretation; paired points through timeUrban/community and urban land in all 50 states and the District of ColumbiaApprox. 5 years (dependent on the imagery available)
[21]
Ellis and Matthews (2019)
OBIA on LiDAR-Image fusionOklahoma City, Oklahoma, USA2006–2013
(7 years)
[14]
Blackman and Yuan (2020)
OBIA on historic maps and aerial imagery, contemporary ortho- and aerial imagery.
Plus, Photo-interpretation; paired points through time
City of St Peter, Minnesota, USA1938–2019
(81 years)
[20]
Nowak and Greenfield (2020)
Photo-interpretation; paired points through timeLand cover change in urban areas by continent, and worldwide2012–2017
(5 years)
[28]
Metcalfe (n.d.)
Photo-interpretation; paired points through timeSwadlincote, Derbyshire, England1999–2019
(20 years)
Table 2. The rationale for the selection and number of points used to assess the canopy cover of each study location.
Location (Size: km2)Rationale for SelectionNo. of Assessment Points (points/km2)Character (and Population Estimate)
Scotland
Edinburgh (91.1)Only city for which decadal aerial photography is available in Scotland for 1945. Aerial photography available for 1945 (partial), 2005, 2008, 2010, 2015, 2018. Independent “present-day *” canopy cover assessment completed in 2016, for comparison.805 (8.8)Capital city
Historic centre (524,930) [31,32]
Wales
Cardiff (50.7)Aerial photography available for 1945 (partial), 2001, 2009, 2012, 2016, 2018. Independent present-day canopy cover assessment completed in 2016.925 (18.2)Capital city
Coastal location (366,903) [32,33]
Swansea (59.1)Only other Welsh town with historic aerial photography available; aerial photographs available for 1945, 1999, 2003, 2005, 2008, 2010, 2013, 2018. Western location helps provide geographic coverage. Size provides coverage of a smaller city in wales. Independent present-day canopy cover assessment completed in 2013.500 (8.5)Industrial heritage
Coastal location (246,993) [32,34]
England
Birmingham (496.5)The largest city assessed. Aerial photography available for 1945, 1999, 2001, 2003, 2006, 2011, 2013, 2018. Independent present-day canopy cover assessment completed in 2016.500 (1.0)Major city and metropolitan borough
(1,141,816) [32,35]
Chester (19.7)A smaller city located in central-west England where there was otherwise limited imager availability. Aerial photography available for 1945, 2005, 2009, 2011, 2015, 2016, 2018. Independent present-day canopy cover assessment completed in 2016.493 (25.0)Small city
Historic walled city
(79,645) [36,37]
Darlington (18.6)One of two urban areas with historic imagery located in the North of England. Aerial photography available for 1945, 2001, 2005, 2006, 2008, 2014, 2018. Independent present-day canopy cover assessment completed in 2016.488 (26.2)Large town
Market town
(106, 803) [32,38]
Maidstone (15.5)Aerial photography available for 1940, 1960, 1990, 2003, 2008, 2011, 2015, 2018. Chosen primarily for the available imagery—covering a long time period with frequent coverage. Independent present-day canopy cover assessment completed in 2016.500 (32.3)Large town
Strong commercial and retail centres
(171,826) [32,39]
Milton Keynes (90.5)Aerial photography available for 1945, 2000, 2005, 2007, 2017, 2018. A new town, this was expected to be interesting with reference to the planning of the city.500 (5.5)Major town
New town built in 1960s
(269,457)[16,32]
Newcastle (147.6)Located in the north of England. Aerial photography available for 1945 (partial), 2001, 2005, 2008, 2012, 2015, 2018. Independent present-day canopy cover assessment completed in 2016.521 (3.5)City and metropolitan borough.
Industrial heritage (302,820) [32,40]
Oxford (23.9)Located in central southern England. Aerial photography available for 1945, 2004, 2007, 2009, 2013, 2014, 2017, 2018. Independent present-day canopy cover assessment completed in 2016.500 (20.9)Small city.
Strong cultural heritage
(152,457) [32,41]
* Present-day canopy cover assessments [10,42].
Table 3. Summary statistics for the linear regression analysis in historic canopy cover change at ten study locations (where estimate represents the gradient of the line, SE is the standard error of the regression estimate, R2 the coefficient of determination, and p is the false discovery rate (FDR) p-values).
CountryLocation1940/45–2018
(Overall Trend)
2000–2018
(Recent Two Decades)
EstimateSER2pEstimateSER2p
Scotland
Edinburgh0.00090.00010.970.0010.0010.00040.790.073
England
Birmingham0.00030.00040.110.385−0.0030.00050.830.009
Chester0.0010.00010.980.00020.0020.00020.970.004
Darlington0.0020.00030.920.001−0.00030.00040.120.551
Maidstone−0.00080.00030.510.057−0.0010.00050.450.142
Milton Keynes0.0020.00010.990.00020.0030.00040.940.018
Newcastle0.0020.00020.940.00090.0030.00060.860.018
Oxford0.00080.00020.820.003−0.00070.00050.250.322
Wales
Cardiff0.00020.00010.480.0920.00080.00030.710.072
Swansea0.00090.00020.870.0030.00040.00070.090.566

