Abstract
Sustainable forest management requires accurate estimates of wood volume. At present, red pine (Pinus resinosa Sol. ex Aiton) is the most widely planted conifer tree species in southern Ontario, Canada. Therefore, inside and outside bark volume equations were developed for red pine trees grown in plantations. One hundred and fifty red pine trees were sampled from 30 even-aged plantations from across Ontario, Canada. Height-diameter pairs along the boles of sampled trees used to calculate stem volumes were obtained from stem analysis. Equations fitted to the data were a combined variable, modified combined variable, and modified form of dimensionally compatible volume equations. These equations were compared for their goodness-of-fit statistics, logical consistency, and predictive accuracy. The goodness-of-fit characteristics for all three equations were comparable for both inside and outside bark volumes. However, the estimated values for the intercept for the modified form of the dimensionally compatible and modified combined variable volume equations were negative and nonsignificant. The combined variable volume equation resulted in logically consistent parameter estimates in the presence of random effects parameters. Therefore, this equation was selected as the inside and outside bark volume equation for red pine trees grown in plantations. A nonlinear mixed-effects modeling approach was applied in fitting the final volume equation that included a weight (power function) to address heteroscedasticity. The equations developed here can be used to calculate inside and outside bark volumes of red pine plantations in boreal forests in Eastern Canada. These equations would require both diameter at breast height (DBH) and total height values in meters.
1. Introduction
Accurate estimates of tree volume are needed to develop forest management plans and calculate continuous wood supply. Tree volumes are calculated using equations developed by establishing the relationship among volume, total tree height, and diameter at breast height (DBH). If taper equations are available, tree volumes can be calculated by integrating these equations over the heights of the trees. These equations provide additional information about tree form and can be used to estimate volume for any part of the stem [1]. However, if the entire tree stem volume is of interest, then volume equations are more convenient and simpler to use than taper equations. Total stand volume can be obtained by summing individual tree volumes.
Accurate estimates of tree volume are also important to calculate tree and stand biomass and carbon stocks [2]. Tree biomass is determined by multiplying wood density and tree volume. Similarly, carbon content can be estimated based on a fraction of total biomass [3].
Trees grown in plantations taper more than those in natural stands. Therefore, for a given diameter at breast height and total tree height, a plantation grown tree will have less wood volume than the one from a naturally regenerated stand [4,5]. As a result, calculating the volume of plantation grown trees with equations developed using data from natural stands would overestimate tree volume [6]. If we use these estimates in developing forest management plans, estimates of sustainable wood supply, tree and stand biomass, and carbon stocks could be at risk [7,8,9,10]. Hence, the need for distinct volume equations for plantations and natural stands [11].
The province of Ontario currently has about 71.1 million ha of forests, which amounts to about 17% of Canada’s and 2% of the world’s forests. About half of this forest is managed for commercial purposes. The managed forest is divided into 41 management units. Before trees are harvested from these forests, the Crown Forest Sustainability Act [12] requires that each unit have an approved management plan that provides a sustainable supply of wood into the future. On average, 100,000 hectares of forests were harvested annually between 2009 and 2018 [13] and most of harvested forests were regenerated by planting trees. At present, red pine (Pinus resinosa Ait.) is the most commonly planted conifer tree species in southern Ontario, Canada [14]. Two widely used taper equations have been evaluated for estimating the total volumes of red pine plantations.
Jiang and Brooks [15] presented compatible volume, taper, and wet equations for a red pine plantation in West Virginia, USA. Since a volume equation can be obtained by integrating a taper equation, they integrated Max and Burkhart’s [16] segmented polynomial taper equation to obtain a volume equation for red pine plantations. Similarly, Li et al. [17] integrated Kozak’s [18] taper equation and compared the volumes estimated using this equation with those calculated using previously developed volume equations for red pine.
Sharma [6] recently developed taper equations for red pine plantations by incorporating stand density information. However, integrating these equations over total height to calculate tree volumes is computationally extensive and resulting models are difficult to code in a spreadsheet. On the other hand, volume equations that are independently developed from taper equations are very straightforward to use and tree volumes can be calculated in a spreadsheet. Since these types of volume equations are not yet available for red pine trees grown in plantations, the objective of this study was to develop total inside and outside bark volume equations for plantation grown red pine trees to fill this gap.
2. Methods
2.1. Data
Thirty even-aged pure red pine plantations (sites) were sampled from across Ontario, Canada (Figure 1) to obtain the study data. In each plantation, a variable size circular temporary sample plot (TSP) was established. The minimum plot size was 400 m2. However, plot size was increased (if required) to include a minimum of 80 trees.
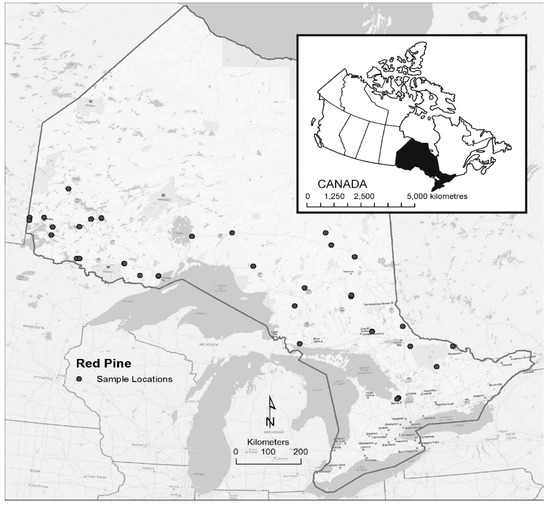
Figure 1.
Distribution of red pine plantation plots sampled across Ontario, Canada.
Ontario’s growth and yield standards [19] were followed to measure the trees in a plot. All live trees were measured and stem density (trees per ha) and total basal area (BA per ha) were calculated for each plot. All red pine trees growing in the plot were numbered in sequence and the cumulative basal area was determined. The total cumulative basal area was divided into five classes. From each class, one tree that was determined as planted and had not sustained any visible deformities, such as major stem injuries or dead, broken, or forked tops, was randomly selected for destructive sampling. As a result, 5 trees were sampled from each plot (TSP) for a total of 150 trees from all sample locations. Table 1 displays the summary statistics for all sampled trees and associated stand characteristics.

Table 1.
Summary statistics for measured characteristics of plantation grown red pine trees from Ontario used in this study. BA = basal area per ha; trees ha−1 = density; DBH = diameter at breast height; height = total height; IB = inside bark; OB = outside bark.
Each sampled tree was cut for three disks below breast height at 0.15 m, 0.5 m, and 0.9 m and one at breast height (1.3 m). Nine additional disks were cut above breast height by dividing the remaining height of the tree by 10 and cutting disks at the resulting interval. This resulted in 13 disks per tree. In total, 1950 disks were sampled from all trees for stem analysis. The largest outside bark diameter and the one perpendicular to it, both passing through the pith, were measured at each stem height where disks were cut. These diameters were averaged to obtain the mean outside bark diameter at that stem height. Each sampled tree and disk were given a unique code. All disks from a tree were placed in a large breathable bag, transported, and stored at –10 °C until 24 h before processing. Since the shape of sampled disks is not necessarily circular, geometric mean radius is generally used as a measure of inside bark radius [20]. Therefore, inside bark geometric mean radius was computed from the diameters obtained from the major (r1) and minor (r2) axes on each disk (i.e., r = (r1 × r2)0.5).
Inside and outside bark volumes of each section between two consecutive disks were calculated using Smalian’s formula [21]. These volumes for the sections above the last disk (top section) and below the butt (first disk) were calculated by assuming a cone and cylinder, respectively. Total inside bark volume for a tree was obtained by accumulating all section volumes calculated using all inside bark diameters from this tree. Similarly, the total outside bark volume was obtained by summing up all section volumes calculated using all outside bark diameters from the same tree. Summary statistics for these inside and outside volumes are listed in Table 1.
2.2. Volume Equations
Sharma and Oderwald [22] developed a volume equation that can be used with any system of units with data from natural stands of loblolly pine (Pinus taeda L.) trees [22,23]. Their equation can be written as:
where
- V = total volume (inside or outside bark, m3) of a tree;
- D = outside bark diameter at breast height (DBH; m);
- H = total tree height (m);
- ε is an error term;
- β and γ are fixed-effects parameters to be estimated.
It is clear from Equation (1) that if D = 0, then V = 0. Therefore, Equation (1) provides unbiased volume estimates if we use it to calculate volumes above breast height. In practice, however, a tree accumulates some volume before it reaches breast height and foresters want to estimate total volume from the ground. To address this problem, Sharma [11] modified Equation (1) by adding a constant (fixed-effects parameter), α, to the right-hand side of the equation. This ensures that V includes the volume accumulated by a tree before it reaches breast height, i.e.,
Sharma [11] used Equation (2) to model the relationship among volume, height, and DBH for jack pine and black spruce trees grown in plantations. Therefore, this modified form of dimensionally compatible volume equation (Equation (2)) was considered in this study. Two other commonly used volume equations were also considered: The combined variable volume equation [21] and the modified combined variable volume equation [24]. The combined variable volume equation is mathematically expressed as:
Similarly, the mathematical expression for the modified combined variable volume equation is:
where δ is a fixed-effects parameter to be estimated and all other variables are as defined earlier.
Although individual plots are usually in different stands, data used to develop volume equations often contain measurements from numerous trees from a particular sample plot (site). These multiple measurements from the same plot (sampling unit) may be highly correlated. This violates the basic assumption of independent observations [25].
The problem of autocorrelation within a sampling unit (plot) can be addressed using the mixed-effects modeling technique [26,27,28], correlation structure [29], or both [30]. Data used in this study included height and diameter measurements from multiple trees from a plot. Therefore, a mixed-effects modeling technique was used to address the autocorrelation problem. Details about mixed-effects modeling were documented by Vonesh and Chinchilli [31] and Pinheiro and Bates [32].
Equations (2)–(4) were first fitted to the dataset using linear (Equation (3)) and nonlinear (Equations (2) and (4)) least squares procedures in SAS [33]. Goodness-of-fit statistics (mean square error, MSE, and coefficient of determination, R2) and bias in estimating volumes by diameter (DBH) and height classes were estimated for these equations. The equation resulting in better fit statistics (highest R2 and lowest MSE) and logical consistency was selected as the best equation to use for estimating volumes for red pine plantations.
The best equation was then fitted using NLMIXED procedure (built-in procedure in SAS that was developed to fit nonlinear mixed-effects models) to incorporate random effects. Random-effects parameters were sequentially added to the fixed-effects coefficients starting at the intercept (α) at tree and site scales if they were significant and improved Akaike’s information criterion (AIC) [34]. The equation with the smallest values of goodness-of-fit statistics was selected as the final volume equation.
To check for possible heteroscedasticity (i.e., unequal variability across values), residuals (observed–predicted) of volume estimates were calculated for both inside and outside bark volumes for all trees. These residuals were plotted against predicted inside and outside bark volumes. If the heteroscedasticity was obvious in the plots, this was addressed by stipulating a variance function [32]. Two variance functions (power and exponential) were considered here. The one resulting in a smaller value of AIC was selected as the variance function to account for heteroscedasticity. Finally, inside and outside bark volume equations were evaluated by comparing bias and root mean square error (RMSE) in estimating inside and outside bark volumes by volume and taper equations.
3. Results and Discussion
The volume equations were first fitted using DBH (in cm) and height (in m). The R2 obtained by fitting Equations (2)–(4) to the data was similar for inside and outside bark volume equations (Table 2). However, for both inside and outside bark volumes, MSE values were slightly smaller for Equations (2) and (4) than for Equation (3). For Equations (2) and (4), these values were almost identical across volume types. The intercept was positive but not significant for Equation (3) but was negative and nonsignificant for both Equations (2) and (4). This negative and nonsignificant intercept was not anticipated as the intercept represents the amount of average value of total volume (from ground) accumulated by a tree until it reaches breast height. In other words, the intercept is the total volume when DBH is zero and total height is 1.3 m. Therefore, for all logically consistent volume equations, the intercept should be positive and significantly different from zero.
Table 2.
Fit statistics for Equations (2)–(4) for plantation grown red pine in Ontario. (R2 = coefficient of determination, MSE = mean square error).
Equations (2)–(4) were further evaluated by introducing random effects. The NLMIXED procedure in SAS was used to fit equations with random effects. As described earlier, in fitting these equations, random effects parameters were sequentially added to the fixed effects. Once the random effects were introduced, the regression did not converge. Several efforts were made to fit the equations by changing initial values of the parameters but none of the ones with random effects converged. Therefore, both inside and outside bark volume equations were fitted by changing the unit of DBH from cm to m.
When the unit of DBH was changed, all equations with random effects parameters converged without any problems. It is logical to use the same unit for both DBH and height of a tree in developing a volume equation. This approach provides the estimates for parameters that are dimensionally consistent (see [3] for details). Therefore, the same unit (m) was used for both DBH and total height in fitting the volume equations. Random effects were added to fixed effects parameters starting at the intercept () at tree and site scales. However, only the random effect associated with β was significant at site scale for both inside and outside bark volumes for all equations. This outcome indicated that the variation among sites was more significant in explaining the variation in tree volumes than the variation among trees. In the presence of random effects, the intercept was positive and significant for Equation (3) for both inside and outside bark but still negative and nonsignificant, and therefore logically inconsistent, for Equations (2) and (4). Therefore, Equation (3) was selected as most appropriate for both inside and outside bark volumes. With random effects associated with β at site scale, Equation (3) can be written as:
where Vij is the inside or outside bark volume of tree j (j = 1, 2, ….5) and site i (i = 1, 2,…30) with DBH and total height as Dij and Hij, respectively. Random effect, bi, is normally distributed with mean zero and variance σp2 (i.e., bi ~ N(0, σp2)). Similarly, εij is normally distributed with mean zero and variance σe2 (i.e., εij ~ N(0, σe2)). Where heteroscedasticity exists, a variance function will multiply σe2. Other variables are as defined earlier.
Equation (5) was further analyzed by addressing autocorrelation and heteroscedasticity in the data. As mentioned, the intercept was positive and significant for both volume equations (inside and outside bark). However, the residuals plotted against predicted volumes indicated some heteroscedasticity in the dataset (not shown here). Therefore, Equation (5) was fitted to the data with an exponential and power variance functions individually.
The variance function with a power to DBH provided better fits (smaller AIC values) than the exponential function for both inside and outside bark volume equations. Therefore, the power function was selected as the variance function. The weight (power of DBH) was positive for both volume equations (Table 3). Introducing weight into volume equations significantly reduced the AIC values for both inside and outside volumes. The AIC value decreased to −425.4 from −579.9 for inside bark and from −443.9 to −522.0 for outside bark volume equations. However, adding the random effect in the presence of weight function only reduced the AIC values from −579.9 to −601.7 for inside bark and −522.0 to −526.3 for outside bark volume equations. The random effect was marginally significant (p values 0.01 and 0.08 for inside and outside bark volumes, respectively).
Table 3.
Parameter estimates (standard error) and fit statistics of Equation (5) fitted to inside and outside bark volume data using a nonlinear mixed-effects method for red pine plantations in Ontario.
Finally, inside and outside bark volumes of all red pine trees were estimated (predicted) using Equation (5). The predicted values were plotted against their observed counterparts (Figure 2). The predicted values were randomly clustered around the 1:1 line for both inside and outside bark volumes. Model accuracy was verified by examining the bias resulting from inside and outside volume equations. For this, all red pine trees were divided into 5-cm and 5-m DBH and height classes, respectively. Bias in estimating inside and outside bark volumes and associated standard error were calculated for each DBH and height class (Table 4). The biases and standard errors were very small for both inside and outside bark volumes for all DBH and height classes.
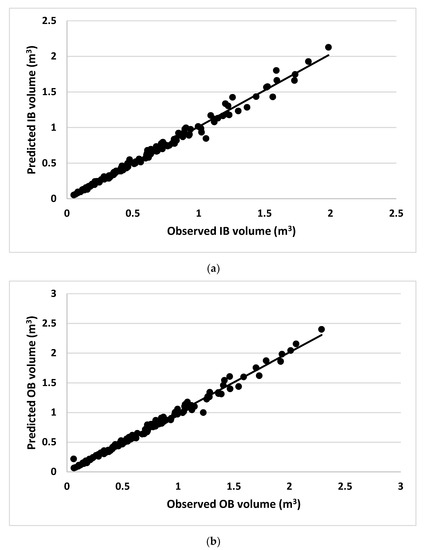
Figure 2.
Predicted volumes plotted against observed volumes for red pine in Ontario for (a) inside bark (IB) and (b) outside bark (OB). The solid line represents the 1:1 line for both inside and outside bark volumes.
Table 4.
Bias (observed–predicted) and its standard error of the residuals from volume equation (Equation (5)) and taper equation with stand density [6] for red pine plantations grown in Ontario, Canada.
Recently, Sharma [6] developed taper equations to estimate inside and outside bark diameters for red pine plantations using height-diameter measurements along the boles of the same trees used in this study. These equations were derived by incorporating stand density information. In general, volumes calculated using taper equations are more accurate than those estimated using volume equations. Therefore, biases resulting from volume equations were compared with those obtained from taper equations. For this comparison, bias in estimating volumes (inside and outside bark) and its standard error were calculated for each 5-cm DBH and 5-m height class using Equation (5) and taper equations developed by Sharma [6] (Table 4). Similarly, percent bias and RMSE in estimating inside and outside bark volumes were calculated for each DBH and height class for both volume and taper equations (Table 5).
Table 5.
Percent bias and root mean square error (RMSE) of the residuals from volume equation (Equation (5)) and taper equation with stand density [6] for red pine plantations grown in Ontario, Canada.
Biases resulting from volume equations were very similar to those obtained using taper equations for each DBH and height classes. The bias was slightly higher for the taper equation than for the volume equation, especially for big trees. Similarly, the bias was slightly smaller for the taper equation than for the volume equation for small trees. However, the standard errors for volume equations for both DBH and height classes were consistently smaller than their counterparts for taper equations. This indicated that the fit to the data was better for volume equations than for taper equations. These results confirm that the volume equations (both inside and outside bark) presented in this study can be used to accurately estimate the volumes of red pine plantations.
Overall, the percent bias was slightly smaller for taper equations than for volume equations for both inside and outside bark. Similarly, the overall percent bias was slightly smaller for DBH class than for height class for both volume and taper equations, especially for inside bark volumes. For outside bark volumes, the biases for DBH and height classes were very similar for both volume and taper equations. The maximum bias for inside bark volume equation was 1.98% for DBH class and 2.40% for height class. On the other hand, the maximum bias for outside bark volume equation was 3.76% for DBH class and 3.04% for height class. For RMSE, these values were consistently smaller for volume equations than for taper equations, except for inside bark height class.
Li et al. [17] calculated RMSE values in estimating outside bark volumes of red pine trees using a taper equation they fitted and two previously developed volume equations. The smallest value of RMSE they reported for red pine was 0.0912 using their taper equation. The largest value of RMSE obtained in this study was 0.007222 for the inside bark volume equation. This value is about 12-times smaller than that reported by Li et al. [17].
Jiang and Brooks [15] also compared inside and outside bark volumes of red pine trees estimated by integrating Max and Burkhart’s [16] taper equation with those obtained using a tree volume equation. The volume equation they used was the modified combined variable volume equation (Equation (4) without intercept used in this study). They reported that the volume equation resulted in biased estimates when applied to their data set from northern West Virginia. This is consistent with the results found in this study as the estimates for the intercept of this volume equation for both inside and outside bark volumes were not logically consistent (negative).
Sharma [11] compared three volume equations evaluated here based on model characteristics (e.g., goodness-of-fit statistics, predictive accuracy, and logical consistency) using inside and outside bark volume data collected from jack pine and black spruce plantations. He found the modified dimensionally compatible volume equation superior to other equations for all three characteristics for both inside and outside bark volumes for both species.
In this study, all three equations provided very similar results in terms of goodness-of-fit statistics and predictive accuracy for both inside and outside bark volumes. However, estimates of all parameters were logically consistent only for combined variable volume equation for both inside and outside bark volumes. These results indicate that no universal volume model is superior for all species and stand types. All empirical models are species- and stand type-specific. Therefore, to accurately estimate tree and stand volumes, species- and stand type-specific models are required.
4. Conclusions
Inside and outside bark volume equations were developed for red pine plantations. Combined variable, modified combined variable, and modified form of dimensionally compatible volume equations were fitted to data collected from across Ontario, Canada, and compared for their goodness-of-fit statistics, logical consistency, and predictive accuracy for inside and outside bark volumes.
The goodness-of-fit characteristics among equations were similar for inside and outside bark volumes. However, for the modified form of dimensionally compatible and modified combined variable volume equations, the intercept was negative and differed significantly from zero. On the other hand, in the presence of random effects parameter for the combined variable volume equation for inside and outside bark volumes, the intercept was positive and significantly different from zero. Therefore, the combined variable volume equation was selected as the inside and outside bark volume equation for plantation grown red pine trees. The final model included a weight (power function) to address heteroscedasticity.
The equations developed here can be used to accurately estimate inside and outside bark volumes of red pine plantations across Ontario, with the caveat that DBH measurements may need to be converted as these equations require measurements in meters.
Funding
This research received no external funding.
Acknowledgments
This study was supported by the Ontario Ministry of Natural Resources and Forestry and its Climate Change program. The author is grateful to John Parton and Chris Stratton, Biodiversity and Monitoring Section, for coordinating data collection and Lisa Buse for editing an earlier version of the manuscript.
Conflicts of Interest
The authors declare no conflict of interest.
References
- Burkhart, H.E.; Tome, M. Modeling Forest Trees and Stands; Springer: Dordrecht, NL, USA, 2012; 457p. [Google Scholar]
- Temesgen, H.; Affleck, D.; Poudel, K.; Gray, A.; Sessions, J. A review of the challenges and opportunities in estimating above ground forest biomass using tree-level models. Scand. J. For. Res. 2015, 30, 326–335. [Google Scholar] [CrossRef]
- Schlesinger, W.H. Biogeochemistry, an Analysis of Global Change; Academic Press: New York, NY, USA, 1991. [Google Scholar]
- Garber, S.M.; Maguire, D.A. Modeling stem taper of three central Oregon species using nonlinear mixed effects models and autoregressive error structures. For. Ecol. Manag. 2003, 179, 507–522. [Google Scholar] [CrossRef]
- Sharma, M.; Parton, J. Modeling stand density effects on taper for jack pine and black spruce plantations using dimensional analysis. For. Sci. 2009, 55, 268–282. [Google Scholar]
- Sharma, M. Incorporating stand density effects in modelling the taper of red pine plantations. Can. J. For. Res. 2020. [Google Scholar] [CrossRef]
- Bluhm, A.A.; Garber, S.M.; Hibbs, D.F. Taper Equation and Volume Tables for Plantation-Grown Red Alder; General Technical Report. PNW-GTR-735; U.S. Department of Agriculture, Forest Service, Pacific Northwest Research Station: Portland, OR, USA, 2007; 74p.
- Hilt, D.E.; Dale, M.E. Stem Form Changes in Upland Oaks after Thinning; Res. Pap. NE-433; U.S. Department of Agriculture, Forest Service, Northeastern Forest Experiment Station: Broomall, PA, USA, 1979; 7p.
- Larson, P.R. Stem form development of forest trees. For. Sci. Monogr. 1963, 5, 41. [Google Scholar] [CrossRef]
- Valenti, M.A.; Cao, Q.V. A comparison of the effects of one-step and twostep pruning on loblolly pine stem form. South. J. Appl. For. 1986, 10, 251–253. [Google Scholar] [CrossRef]
- Sharma, M. Inside and outside bark volume models for jack pine (Pinus banksiana) and black spruce (Picea mariana) plantations in Ontario, Canada. For. Chron. 2019, 95, 50–57. [Google Scholar] [CrossRef]
- Statutes of Ontario. Crown Forest Sustainability Act, revised. R.S.O. 1998. Chapter 25 and Ontario Regulation 167/95; Government (provincial) of Ontario: Toronto, ON, Canada, 1995.
- [OMNRF] Ontario Ministry of Natural Resources and Forestry. Sustainable Growth: Ontario’s Forest Sector Strategy 2020; Ontario Ministry of Natural Resources and Forestry: Sault Ste. Marie, ON, Canada, 2020.
- McLaughlin, J.A.; Hsiang, T.; Halicki Hayden, G.; Greifenhagen, S. Mortality in Southern Ontario Red Pine Plantations: Causes, Consequences, and Management Options; Forest Research Report No. 69; Ontario Ministry of Natural Resources, Ontario Forest Research Institute: Sault Ste. Marie, ON, Canada, 2010.
- Jiang, L.; Brooks, J.R. Taper, volume, and weight equations for red pine in West Virginia. North. J. Appl. For. 2008, 25, 151–153. [Google Scholar] [CrossRef]
- Max, T.A.; Burkhart, H.E. Segmented polynomial regression applied to taper equations. For. Sci. 1976, 22, 283–289. [Google Scholar]
- Li, R.; Weiskittel, A.R.; Dick, A.R.; Kershaw, J.A.; Seymour, R.S. Regional stem taper equations for eleven conifer species in the Acadian Region of North America: Development and assessment. North. J. Appl. For. 2012, 29, 5–14. [Google Scholar] [CrossRef]
- Kozak, A. My last words on taper equations. For. Chron. 2004, 80, 507–514. [Google Scholar] [CrossRef]
- Hayden, J.; Kerley, D.; Carr, T.K.; Hallarn, J. Field Manual for Establishing and Measuring Permanent Sample Plots; Ontario Ministry of Natural Resources, Ontario Forest Research Institute: Sault Ste. Marie, ON, Canada, 1995. [Google Scholar]
- Subedi, N.; Sharma, M. Evaluating height–age determination methods for jack pine and black spruce plantations using stem analysis data. North. J. Appl. For. 2010, 27, 50–55. [Google Scholar] [CrossRef]
- Avery, T.E.; Burkhart, H.E. Forest Measurements; McGraw-Hill: New York, NY, USA, 2002; 456p. [Google Scholar]
- Sharma, M.; Oderwald, R.G. Dimensionally compatible volume and taper equations. Can. J. For. Res. 2001, 31, 797–803. [Google Scholar] [CrossRef]
- Sharma, M.; Oderwald, R.G.; Amateis, R.L. A consistent system of equations for tree and stand volume. For. Ecol. Manag. 2002, 165, 183–191. [Google Scholar] [CrossRef]
- Newnham, R.M. A modification to the combined-variable formulas for computing tree volumes. J. For. 1967, 65, 719–720. [Google Scholar]
- Gregoire, T.G. Generalized error structure for forestry yield models. For. Sci. 1987, 33, 423–444. [Google Scholar]
- Schielzeth, H.; Nakagawa, S. Nested by design: Model fitting and interpretation in a mixed model era. Methods Ecol. Evol. 2013, 4, 14–24. [Google Scholar] [CrossRef]
- Sharma, M.; Parton, J. Height-diameter equations for boreal tree species in Ontario using a mixed-effects modeling approach. For. Ecol. Manag. 2007, 249, 187–198. [Google Scholar] [CrossRef]
- Subedi, N.; Sharma, M. Individual-tree diameter growth equation for black spruce and jack pine plantations in northern Ontario. For. Ecol. Manag. 2011, 261, 2140–2148. [Google Scholar] [CrossRef]
- Diéguez-Aranda, U.; Burkhart, H.E.; Amateis, R.L. Dynamic site model for loblolly pine (Pinus taeda L.) plantations in the United States. For. Sci. 2006, 52, 262–272. [Google Scholar]
- Subedi, N.; Sharma, M. Climate-diameter growth relationships of black spruce and jack pine trees in boreal Ontario, Canada. Glob. Chang. Biol. 2013, 19, 505–516. [Google Scholar] [CrossRef] [PubMed]
- Vonesh, E.F.; Chinchilli, V.M. Linear and Nonlinear Models for the Analysis of Repeated Measurements; Marcel Dekker Inc.: New York, NY, USA, 1997; 560p. [Google Scholar]
- Pinheiro, J.C.; Bates, D.M. Mixed-Effects Models in S and S-PLUS; Springer: New York, NY, USA, 2000. [Google Scholar]
- SAS Institute; SAS Institute Inc.: Cary, NC, USA, 2004.
- Akaike, H. A Bayesian analysis of the minimum AIC procedure. Ann. Inst. Stat. Math. 1978, 30, 9–14. [Google Scholar] [CrossRef]


© 2020 by the author. Licensee MDPI, Basel, Switzerland. This article is an open access article distributed under the terms and conditions of the Creative Commons Attribution (CC BY) license (http://creativecommons.org/licenses/by/4.0/).