Article

Differential Regulation of Anthocyanins in Cerasus humilis Fruit Color Revealed by Combined Transcriptome and Metabolome Analysis

1
Key Laboratory of Saline-alkali Vegetation Ecology Restoration (Northeast Forestry University), Ministry of Education, Harbin 150040, China
2
Department of Genetics, College of Life Science, Northeast Forestry University, Harbin 150040, China
3
College of Food Science, Key Laboratory of Dairy Science, Ministry of Education, Northeast Agricultural University, Harbin, Heilongjiang 150030, China
*
Author to whom correspondence should be addressed.
Forests 2020, 11(10), 1065; https://doi.org/10.3390/f11101065
Submission received: 2 September 2020 / Revised: 29 September 2020 / Accepted: 30 September 2020 / Published: 1 October 2020
(This article belongs to the Section Forest Ecophysiology and Biology)

Abstract

:
Coloring is an important appearance quality of fruit. In order to evaluate the relationship between metabolites and fruit color, we analyzed the metabolites and transcriptional profiles of two different Cerasus humilis cultivars: “RF” (cv. Zhangwu, red fruit) and “YF” (cv. Nongda No.5, yellow fruit). The results of identification and quantification of metabolites showed that there were significant differences in the contents of 11 metabolites between RF and YF. Transcriptomics was used to analyze the expression patterns of genes related to the anthocyanin biosynthesis pathway, and subsequently, the regulation network of anthocyanin biosynthesis was established to explore their relationship with color formation. QRT-PCR, performed for 12 key genes, showed that the expression profiles of the differentially expressed genes were consistent with the results of the transcriptome data. A co-expression analysis revealed that the late genes were significantly positively correlated with most of the different metabolites. The results of the study provide a new reference for improving the fruit color of Cerasus humilis in the future.

1. Introduction

Cerasus humilis (Bge.) Sok, which belongs to the genus Cerasus in the family Rosaceae, is a small dwarf shrub that originated in China. The fruit of C. humilis can be eaten as a fruit; they are known as “calcium fruits”, owing to their relatively high calcium content [1,2,3]. They have a bright color, crystal beauty, and display an exceptionally wide diversity of fruit colors, including purple, red, yellow, and green [4]. This tree species has the advantages of early bearing, high yield, cold resistance, drought resistance, barren resistance, anti-wind abilities, sand-fixation, and soil conservation [5]. As a strategic tree species for sustainable development, C. humilis has been proven to be promising for building an eco-economic industrial chain in China. C. humilis seeds (semen pruni) have been used as a traditional Chinese medicine for heat-clearing and water-disinhibiting [6,7]. In recent years, because of their rich functional components, C. humilis has attracted more and more attention from consumers and researchers. Moreover, it has the characteristics of being highly nutritious, resistant, and having high bond retention, It is known as the third generation fruit tree variety together with the blueberry, raspberry, and Hippophae rhamnoides L. [8,9,10].
Fruit color is an important quality characteristic of fruit and an important index by which to evaluate fruit quality, as well as being one of the most important factors in attracting consumers [11,12]. Flavonoid biosynthesis is controlled by a variety of exogenous and endogenous factors, and is the most studied secondary metabolic pathway in plants, in which anthocyanins and procyanidins are the end product of the flavonoid metabolic pathway [13]. Anthocyanins, as one of the main pigments that form fruit colors, accumulate in specific organs, tissues and cells, displaying significant chemical diversity [14,15]. The structure of anthocyanins determines the color of fruit, and different plant species contain different anthocyanins [16]. The color of apples and peaches are mainly formed by anthocyanins [17,18]. In grapes, however, anthocyanins and delphinidin are synthesized first, then converted to other pigments [11]. In strawberries, pelargonidin is the main anthocyanin [19]. In addition to endowing plant organs with various colors, anthocyanins play an important role in pollination, seed transmission, protection against UV damage, and defense against pathogen infection [20,21,22,23]. At the same time, anthocyanins are known to have antioxidant, anti-insulin resistance, and anti-inflammatory effects [24,25,26]. Therefore, anthocyanins also have good application prospects in the field of functional foods [27,28].
Despite the economic potential of C. humilis, its genome sequencing has not yet been completed. Therefore, researchers have used other technologies to acquire information, to improve production and health-related benefits. In recent years, transcriptome sequencing has been an effective strategy of the discovery and identification of genes involved in secondary metabolite biosynthesis [29,30]. For example, Xu et al. [31] found key genes responsible for betalain-/anthocyanidin-production in bougainvilleas by transcriptome sequencing. Similarly, Yu et al. [32] illustrated the molecular regulatory mechanism of radish formation by transcriptome sequencing. Additionally, metabolomics analysis could be regarded as a technical means of association analysis, together with other data, to analyze the function of genes involved in the metabolic pathway of interest and also provide powerful supporting information for gene mining [33,34,35]. In recent years, combined metabolome and transcriptome analyses in fruits have clarified the relationship between contents of various secondary metabolites and corresponding differentially expressed genes, broadening our horizons of plant color regulation [36,37,38]. Until now, C. humilis has been seen as a resistant ornamental plant. It is necessary to cultivate new varieties to improve ornamental and fruit quality, however no studies have yet taken into account the differences in gene expression and metabolism between fruits from different kinds of C. humilis.
The anthocyanin biosynthesis pathway has been well studied in some fruit trees, such as apples, pears, and peaches [17,20,37]. Its biosynthesis is regulated by a highly conserved structure and regulatory genes [13]. The anthocyanin biosynthesis pathway involves a variety of metabolic processes, including ten core structural genes: PAL, C4H, 4CL, CHS, CHI, F3H, F3’H, DFR, ANS, and UFGT [39]. Blocking the anthocyanin biosynthesis pathway could directly lead to a change of pigment production, and the color of fruit peel [13]. In addition to the structural genes, transcription factor (TF) regulates the transcription and spatiotemporal expression of the structural genes by binding their own DNA binding domains and the promoter regions of target genes, to promote fruit peel color change [40]. For fruit color diversity within populations, understanding their special anthocyanin biosynthesis pathways will help breeders predict evolutionary differences.
In this study, we systematically studied the anthocyanin metabolism differences and differences in gene expression between YF and RF. We performed a metabonomics analysis of YF and RF to understand the differences in metabolites between them. Additionally, to identify differentially expressed genes (DEGs) related to anthocyanin metabolism in YF and RF, transcriptomic analysis was carried out. Our research provides valuable information to further elucidate the molecular mechanism of fruit color formation in C. humilis, and provides novel gene resources for C. humilis plant breeding. In addition, these results could be a useful reference for relevant research on color changes in other fruit species.

2. Materials and Methods

2.1. Plant Materials and Treatments

Three year old C. humilis cultivars “Zhangwu” (RF) and “Nongda No.5” (YF) were used as experimental materials and planted at Xiangyang farm, Harbin, Heilongjiang Province (45°47′0″ N, 126°55′15″ E). RF is a special cultivar from Northeast China; its fruit has red skin and red flesh, and when ripe the whole fruit turns blood red. YF is a variety bred by Shanxi Agricultural University, and its fruit has yellow skin and yellow flesh; when ripe, the whole fruit turns yellow. Mature fruits were collected and used in this experiment. After enucleation, the fruit peel was immediately frozen in liquid nitrogen and stored in the refrigerator at −80 °C until required for metabolite analysis and RNA extraction. Three biological repeats were performed for each sample.

2.2. Metabolite Extraction and Profiling

Vacuum freeze-drying technology was used to freeze dry the samples. Then, the samples were ground (30 Hz, 1.5 min) into powder by a grinding instrument (MM 400, Retsch). We weighed 100 mg of powder and dissolved it in 1.0 mL extract (70% methanol aqueous solution). The dissolved samples were refrigerated at 4 °C overnight, and in order to improve the extraction rate, three vortex-mixings were carried out during this period. After centrifugation at 10,000· g for 10 min, the supernatant was aspirated and filtered with a microporous membrane (0.22 μm pore size). Each obtained sample was then stored in a sample injection bottle for UPLC-MS/MS analysis. Meanwhile, a quality control standard was established. Each quality control (QC) sample was made by mixing 200 μL of supernatant of all biological test samples in equal volume. The mixed samples were used to observe and analyze the repeatability within the same batch. The data acquisition instrument system included Ultra Performance Liquid Chromatography (UPLC) and Tandem Mass Spectrometry (MS/MS) [41,42,43].

2.3. Qualitative and Quantitative Analysis of Metabolites

Based on the self-built MWBD (metaware database) and public database of metabolite information, qualitative analysis of the primary and secondary spectrum data mass spectrometry was carried out. Linear ion trap (LIT) and triple quadrupole (QQQ) scans were acquired on a triple quadrupole-linear ion trap mass spectrometer (Q TRAP), API 6500 Q TRAP LC/MS/MS System, equipped with an ESI Turbo Ion-Spray interface, operating in positive ion mode and controlled by Analyst 1.6 software (AB Sciex, Beijing, China). The ESI source operation parameters were as follows: ion source, turbo spray; source temperature 500 C; ion spray voltage (IS) 5500 V; ion source gas I (GSI), gas II (GSII), and curtain gas (CUR) were set at 55, 60, and 25.0 psi, respectively; the collision gas (CAD) was high. Instrument tuning and mass calibration were performed with 10 and 100 μmol/L polypropylene glycol solutions in QQQ and LIT modes, respectively. QQQ scans were acquired as MRM experiments with collision gas (nitrogen) set to 5 psi. The declustering potential (DP) and collision energy (CE) for individual MRM transitions were undertaken with further DP and CE optimization. A specific set of MRM transitions were monitored for each period, according to the metabolites eluted within this period. The metabolites with fold change ≥2 and fold changes ≤0.5 were selected as final differential metabolites [44,45].

2.4. RNA Extraction and Transcriptome Sequencing

Total RNA was extracted from 0.5 g RF and 0.5 g YF using an Omega RNA Extraction Kit (Biel, Switzerland). Transcriptome sequencing using 150 bp paired-end Illumina HiSeq and the construction of an RNA-Seq library was carried out by Annoroad Biotechnology (Zhejiang, China). Trinity Software for de novo assembly was developed by the broad Institute and the Hebrew University of Jerusalem. Trinity represents a new method to effectively and accurately reconstruct transcriptome data from RNA sequences. Trinotate is a comprehensive annotation suite designed for automatic functional annotation of transcriptomes, particularly de novo assembled transcriptomes, from model or non-model organisms. Trinotate makes use of a number of different, well-referenced methods for functional annotation, including homology search of the known sequence data (BLAST+/SwissProt), protein domain identification (HMMER/PFAM), protein signal peptides, and transmembrane domain prediction (signalP/tmHMM), and leverages various annotation databases (EMBL Uniprot eggNOG/GO/Kegg databases) [46,47,48].

2.5. Expression Level Analysis

DESeq2 was used to analyze the differential expression between groups with biological duplication. The statistical method of the negative binomial distribution was used to standardize the data. In order to control false positive, the obtained p value was corrected by Benjamini and Hochberg’s approach. Genes with q < 0.05 and |log2_Ratio| ≥ 1 were selected as differential expression genes (DEGs) [49].
GO (Gene Ontology, http://geneontology.org/) enrichment analysis was performed for the DEGs. According to the number of DEGs contained in each GO term, the hypergeometric test was used to identify the significantly enriched GO terms against the whole genome background. After the calculated P values were corrected by multiple testing, GO terms with a q value <0.05 were selected as significantly enriched in the DEGs. The main biological functions of DEGs can be determined by Go enrichment analysis. KEGG (Kyoto Encyclopedia of Genes and Genomes, http://www.kegg.jp/) is a genome-wide metabolic pathway database. The hypergeometric test was applied to the enrichment analysis of KEGG pathways. The calculated p-value was corrected by multiple testing, taking q < 0.05 as the threshold value. Pathways meeting this condition were defined as significantly enriched pathways in DEGs [20].

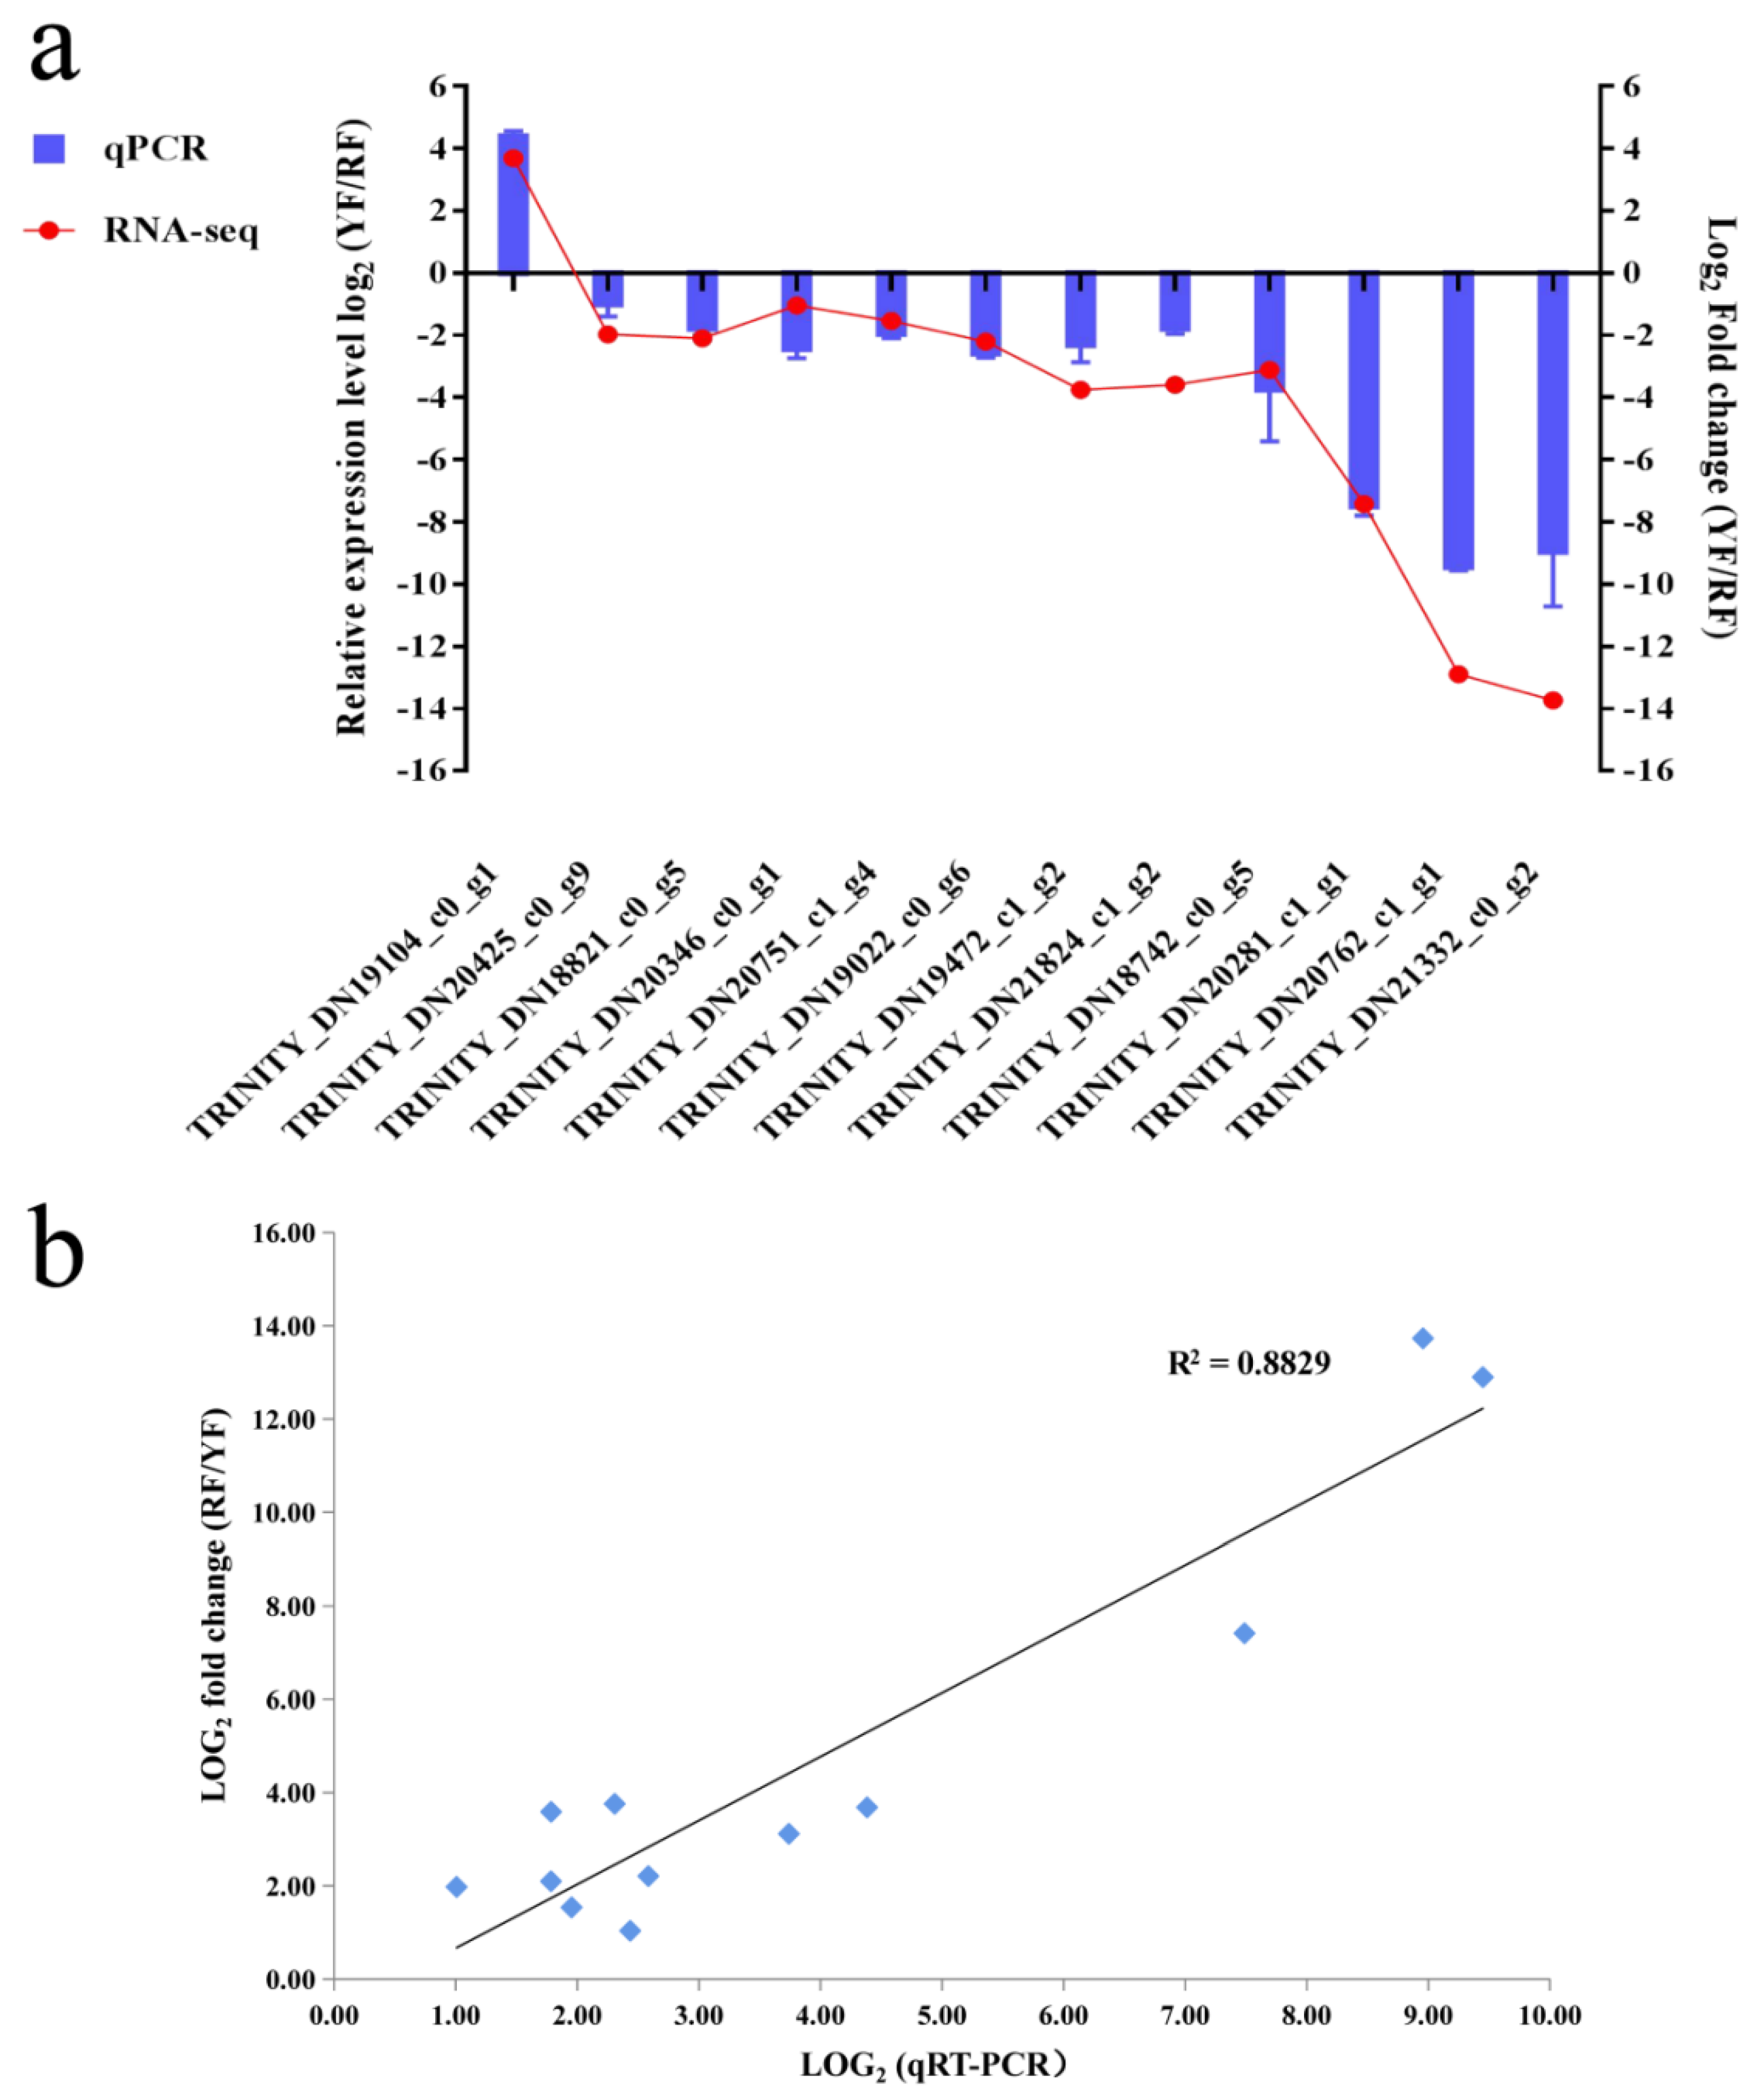
2.6. Quantitative Real-Time PCR and Expression Validation

In order to validate the RNA-seq results, quantitative real-time PCR (qRT-PCR) was performed on the peel samples. Total RNA isolation was conducted using an Omega RNA Extraction Kit (Biel, Switzerland) according to the given protocol. The qRT-PCR analysis was carried out using the Roche LightCycler 480 II Real-Time PCR System (Roche, Basel, Switzerland) with a 96-well plate. The UltraSYBR Mixture (Low ROX) (CWBIO, Beijing, China) was used for all PCR reactions, according to the instruction protocols. The qRT-PCR primers were designed using IDT (https://sg.idtdna.com/Scitools/Applications/RealTimePCR/) (Table S1). All analyses (including three biological repetitions) were quantified in triplicate.

2.7. Statistical Analysis

The expression level of different genes compared to the control was calculated according to the 2−ΔΔCT method. The correlation between qRT-PCR and RNA-seq was analyzed using Excel [50]. Some figures were presented using Adobe Illustrator CS6. Metabolome data statistics and transcriptome sequencing were prepared on Metware Biotechnology (Wuhan, China) and Annoroad Biotechnology (Zhejiang, China), respectively.

3. Results

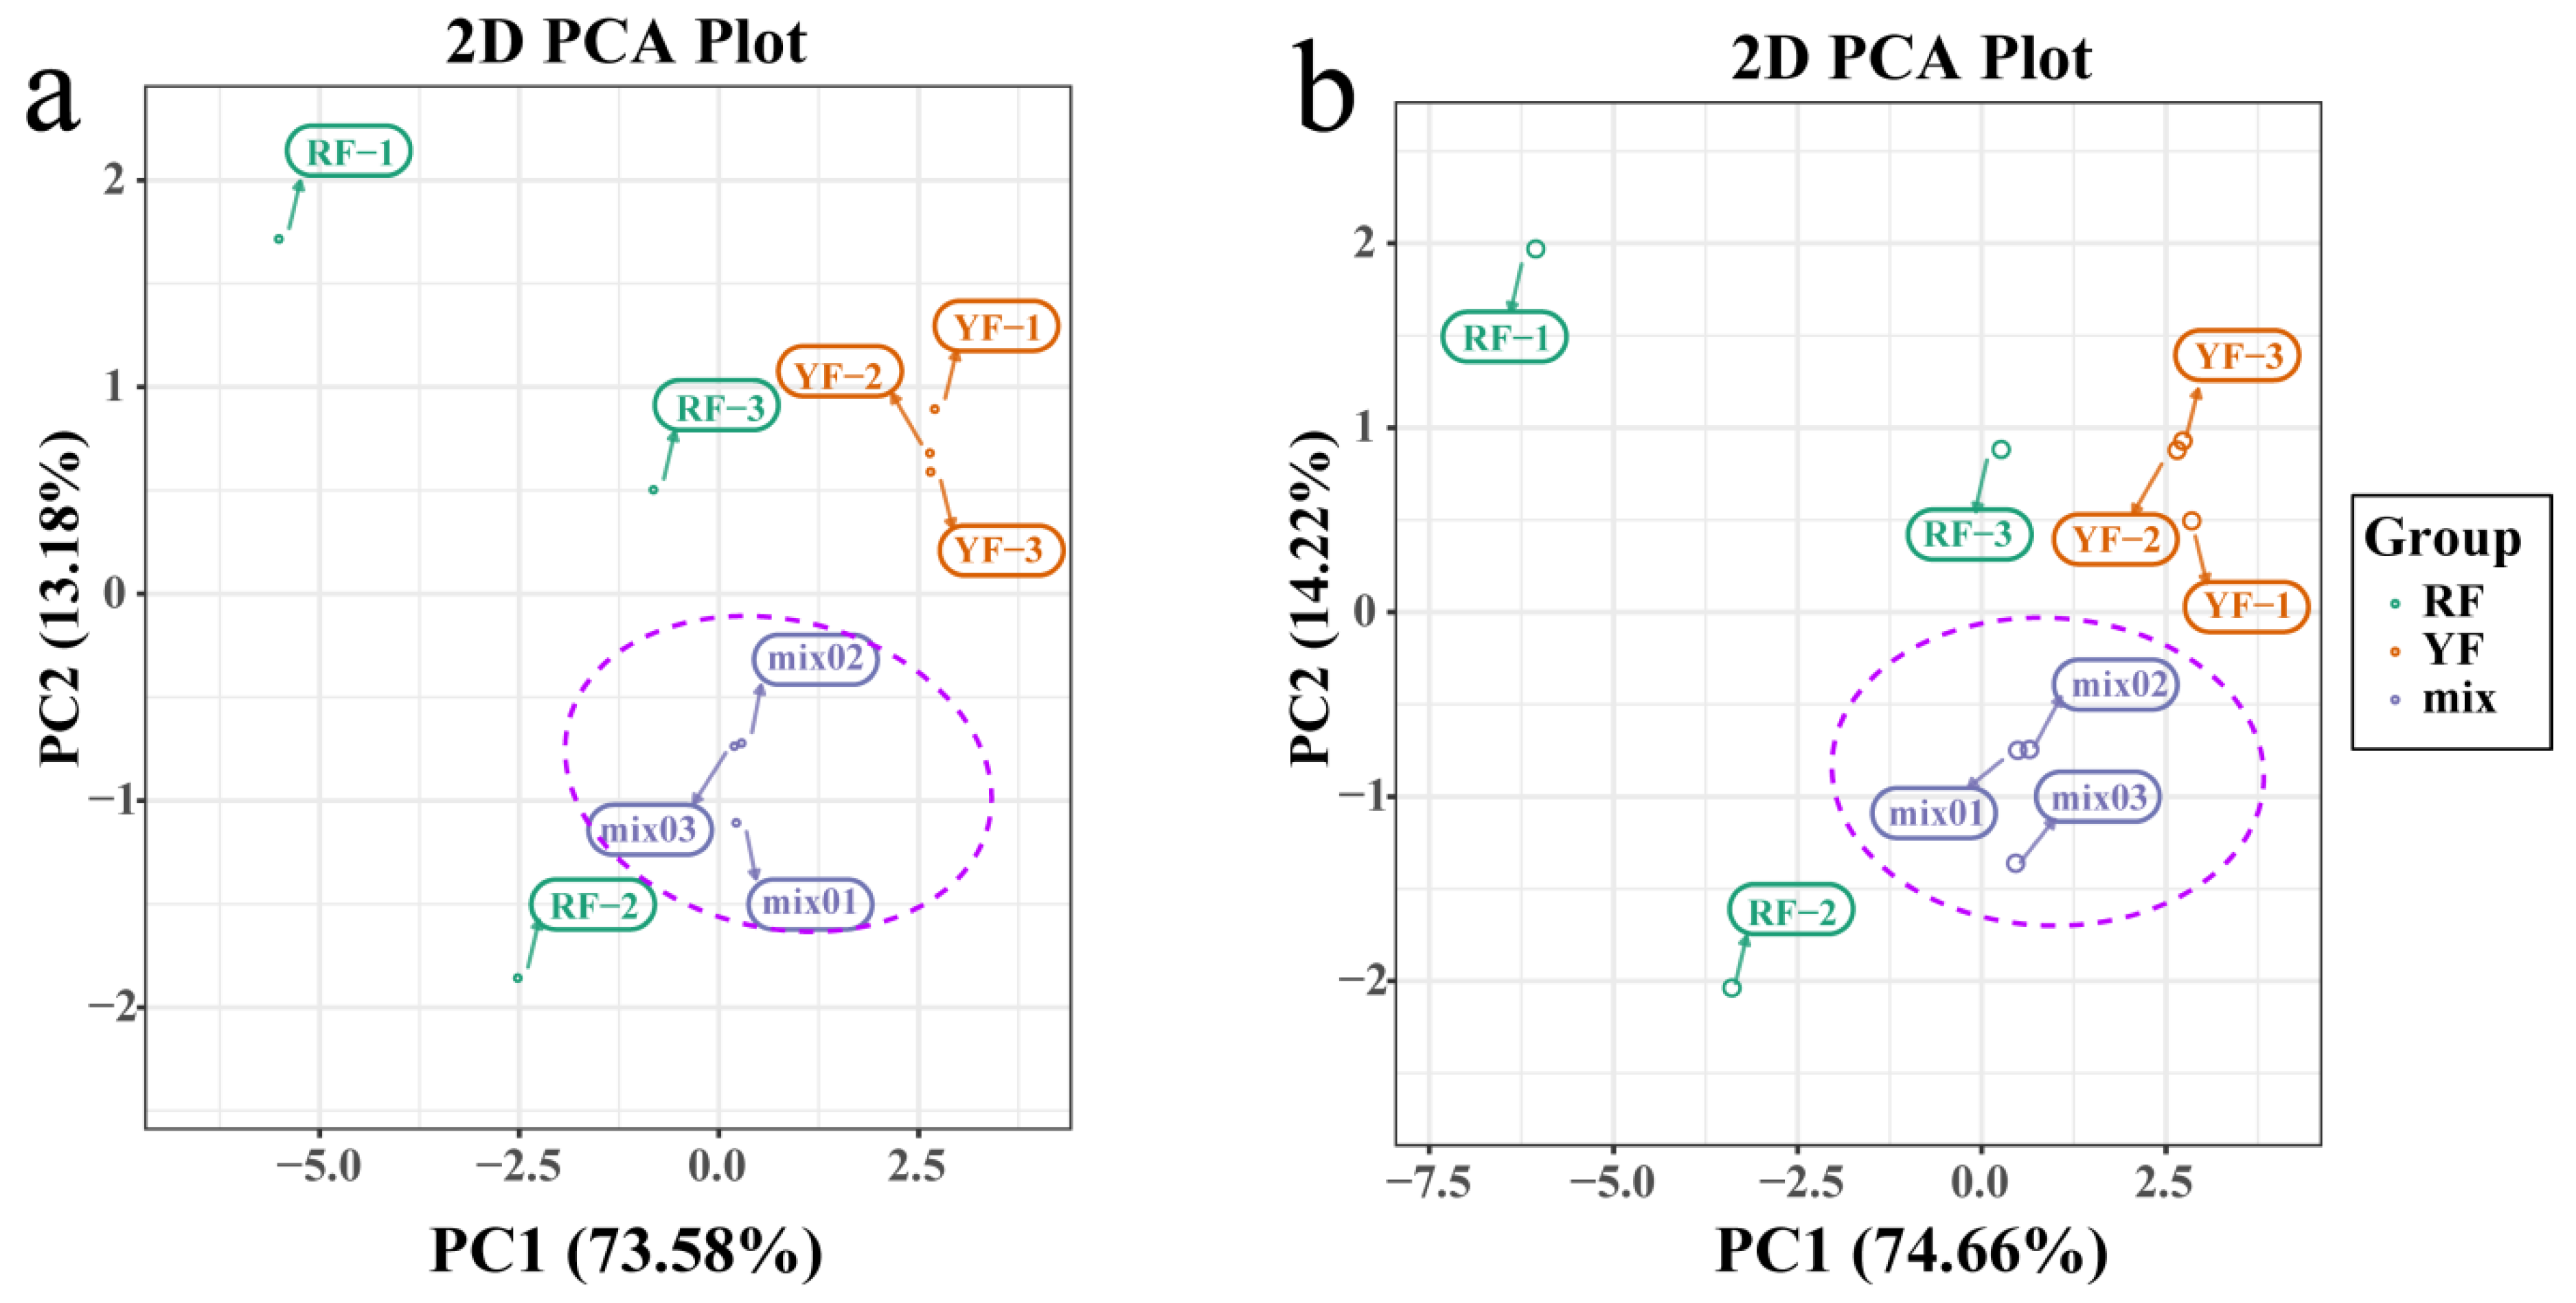
3.1. Metabolomics Analysis of C. humilis Fruit Peel

The ion flow diagram of all samples (total ion currents (TIC) each point in time for all the ions in the mass spectrogram strength after adding and continuously depicting the map) and the MRM metabolites detection multimodal graph, abscissa for the retention time of the detected metabolites (the retention time, Rt), and the vertical for ion detection of ion flow intensity (CPS, count per second), are shown in Figure S1. To detect anthocyanins in the two cultivars, the extracts from the peels of RF and YF were analyzed by MRM, and 11 metabolites were identified as having significantly different contents, among which peonidin O-hexoside, cyanidin 3-O-malonylhexoside, pelargonidin O-acetylhexoside, cyanidin 3-O-glucoside (kuromanin), cyanidin 3-O-rutinoside (Keracyanin), cyanidin 3,5-O-diglucoside (cyanin), cyanidin 3-O-galactoside, and peonidin 3-O-glucoside chloride were found to be abundant in RF, whereas they could not be detected in YF (Table 1).
To compare RF and YF metabolites, datasets obtained from the ESI Turbo Ion-Spray interface by electrospray ionization (ESI+ and ESI) were subjected to principal component analysis (PCA). It has been shown that metabolites from mature stage of RF and YF are clearly separated in the score plots, where the first principal component (PC1) was plotted against the second principal component (PC2). For the ESI+ mode, PC1 and PC2 represented 73.58% and 113.18% of the total variation, respectively (Figure 1a). For the ESI- mode, PC1 and PC2 accounted for 74.66% and 14.22% of the variation, respectively (Figure 1b). These results suggest significant biochemical differences between RF and YF.

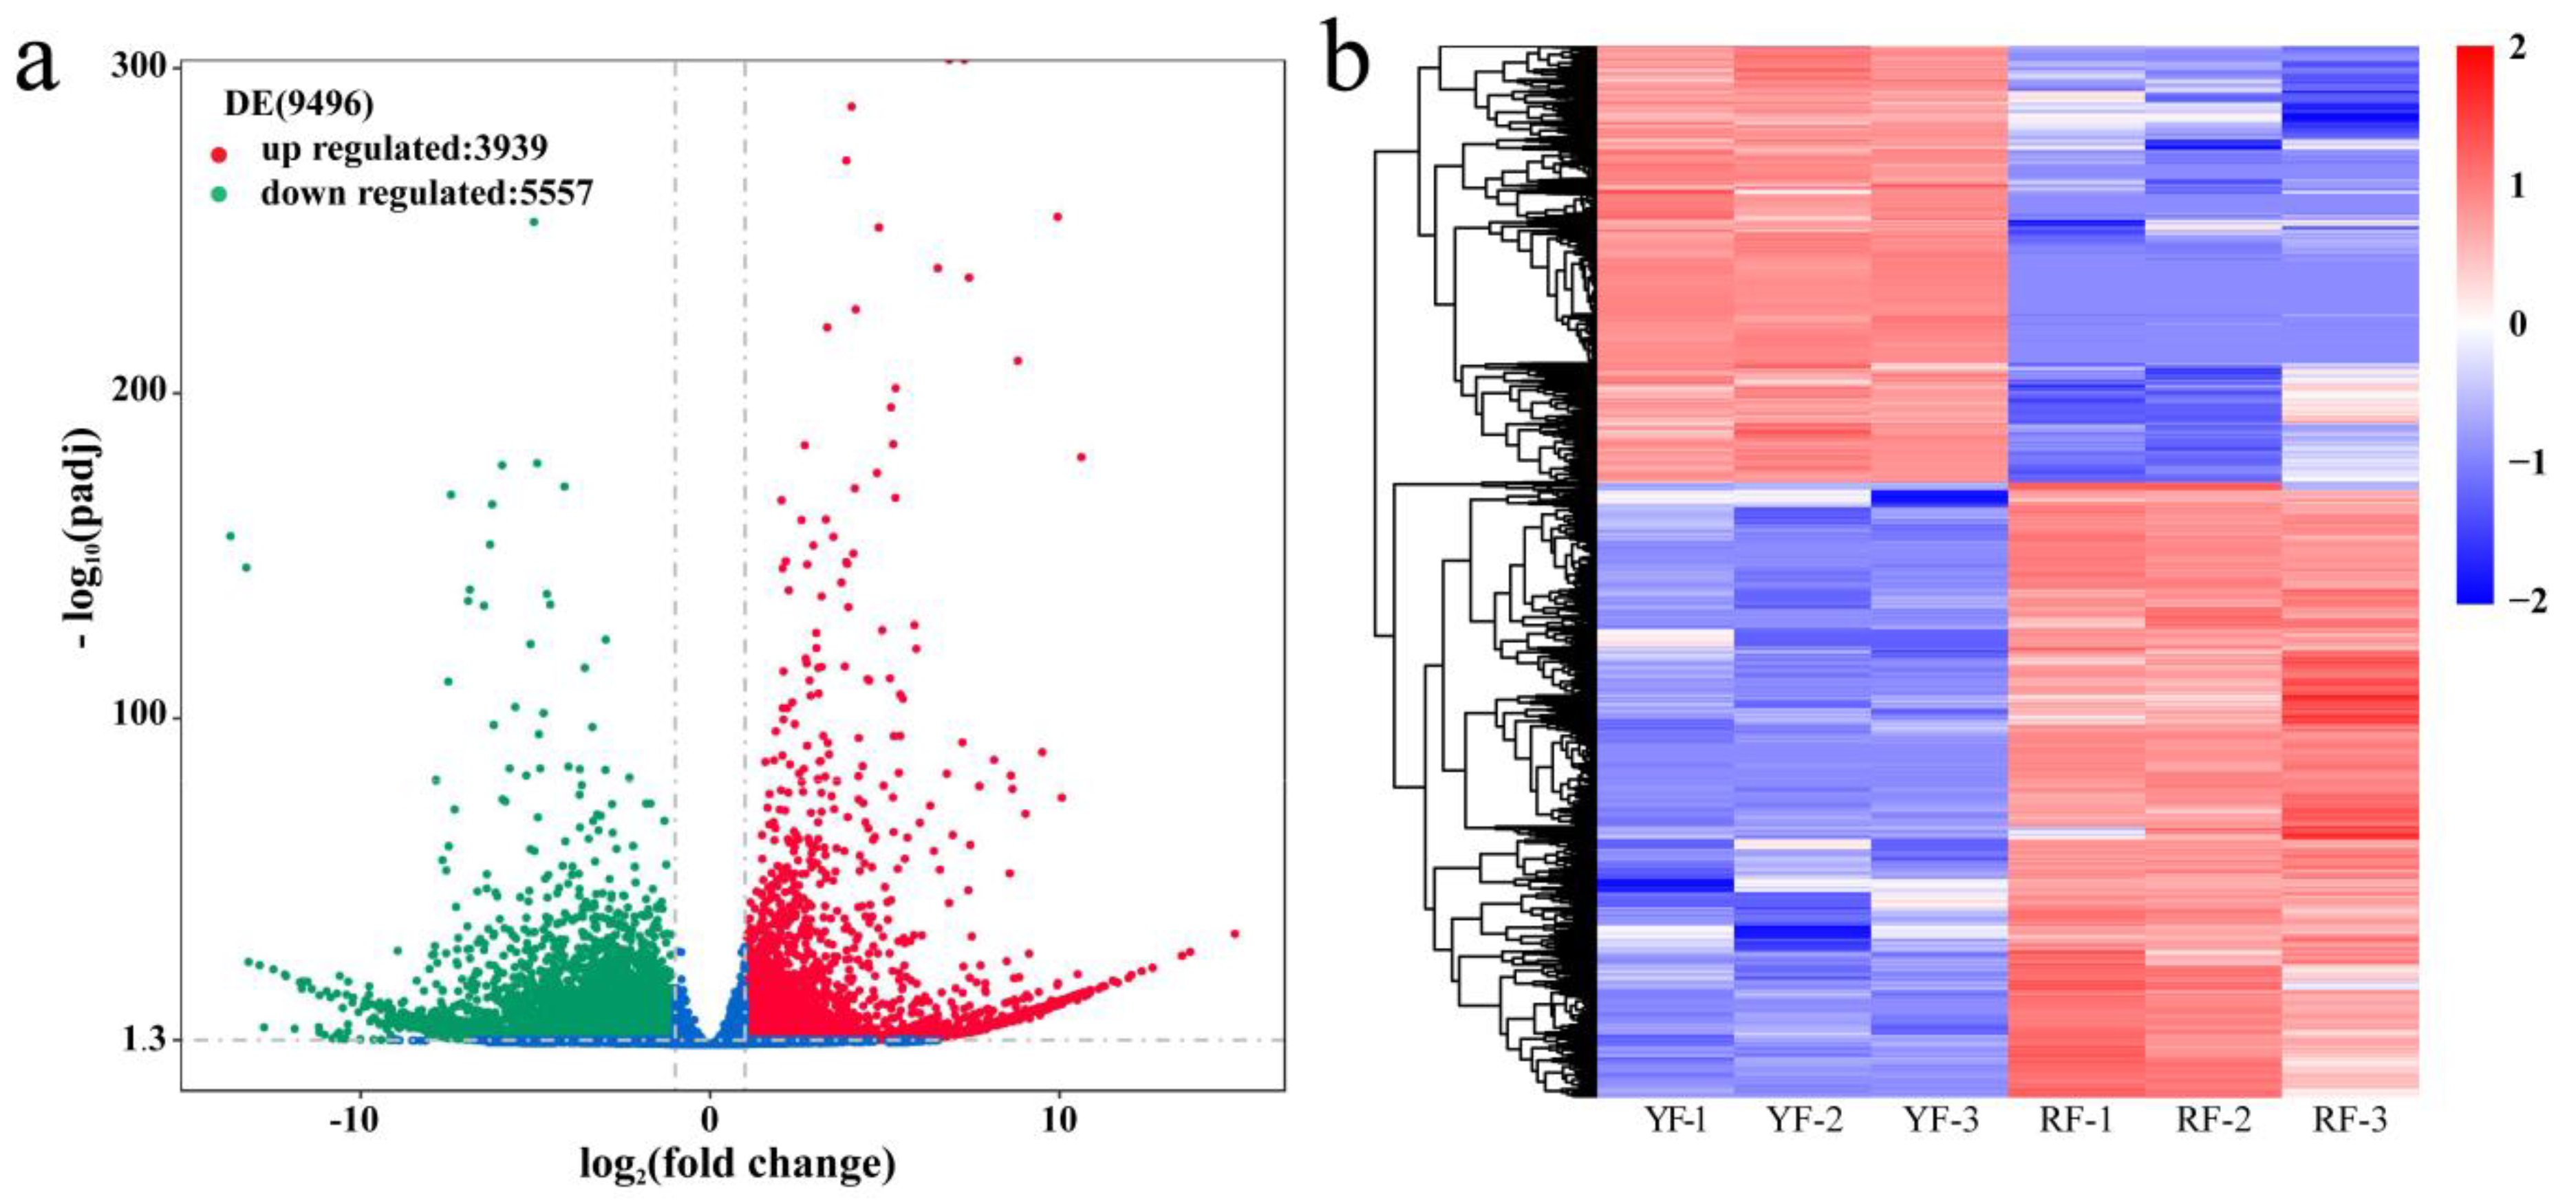
3.2. Assembly and Annotation of the C. humilis Fruit Peel Transcriptome

Six RNA libraries (RF-1, RF-2, and RF-3 for the red fruit peel and YF-1, YF-2, and YF-3 for the yellow fruit peel) were prepared and analyzed. In total, 284,739,040 raw reads were obtained from the six libraries. The raw reads in this study were deposited in the National Center for Biotechnology Information (NCBI) Sequence Read Archive (SRA) database (accession number: SAMN15805207 and SAMN15088359). For further analysis, after raw read quality filtering, 138,849,652 and 124,195,294 clean reads were obtained from the RF and YF libraries, respectively, among which the average GC content was 46.3% (Table 2). In addition, the Q30 percentages of all six libraries were above 93%, indicating that the sequencing and RNA qualities were high, and the data obtained was reliable enough for further profile studies on gene expression. Trinity software was used to assemble the obtained clean reads, resulting in 50,003 unigenes with an N50 length of 1972 nt and an average length of 1019.05 nt (max length 16,782 and min length 201). The length of 7953 (15.9%) of these unigenes exceeded 2 kb.
A total of 50,003 unigenes of C. humilis were annotated by BLAST alignment with seven public databases (NT, NR, Uniprot database, RNAMMER, eggNOG, Gene Ontology (GO), and KEGG). In summary, 29,653 unigenes could be annotated using the NR database (non-redundant protein database), representing 59.3% of the total, the highest percentage. In addition, there were 25,555, 24,179, and 17,489 unigenes annotated only using the NT, BLASTX, and BLASTP databases, respectively (Figure 2).
Three categories with 59 GO terms were obtained according to GO classification, namely biological process, cellular component and molecular function (Figure S2). In the biological process, 58.51% unigenes were associated with the metabolic process between RF and YF. Through KOG (EuKaryotic Orthologous Groups of proteins database) analysis, 19,157 unigenes were classified into 25 functional categories (Figure S3). The KOG and GO annotations showed that unigenes expressed in C. humilis fruit peel encode various proteins related to metabolism.

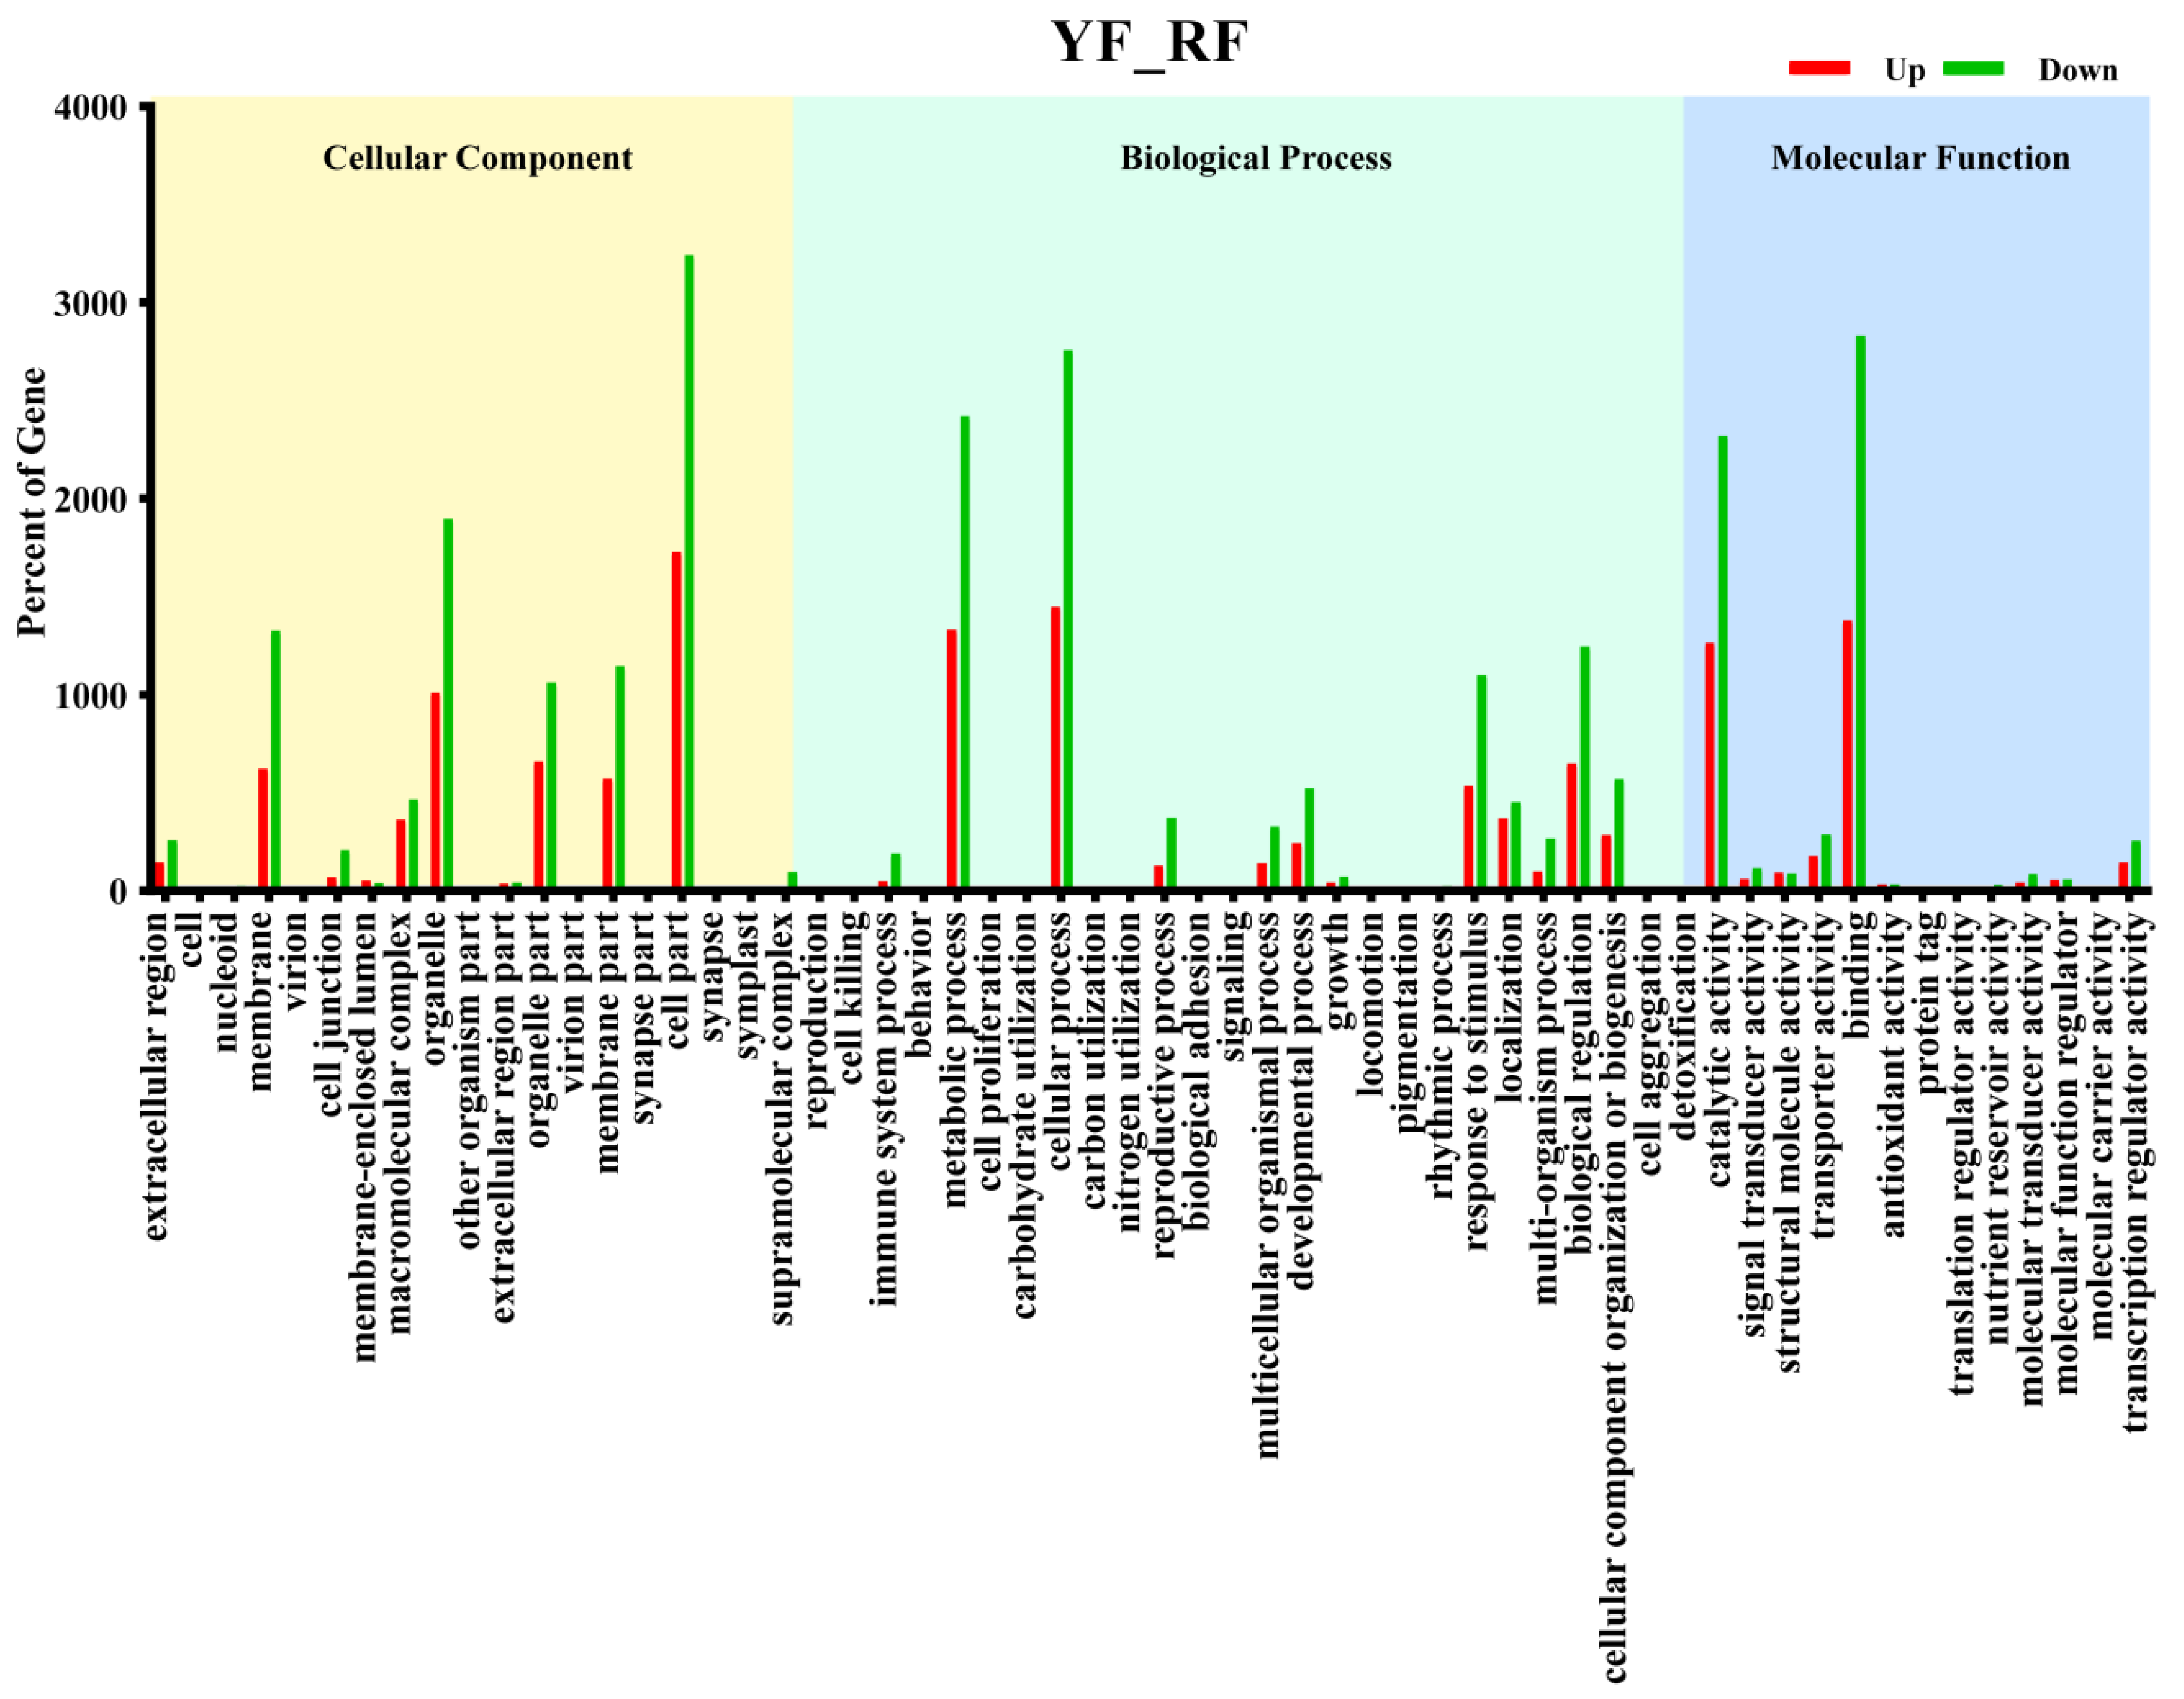
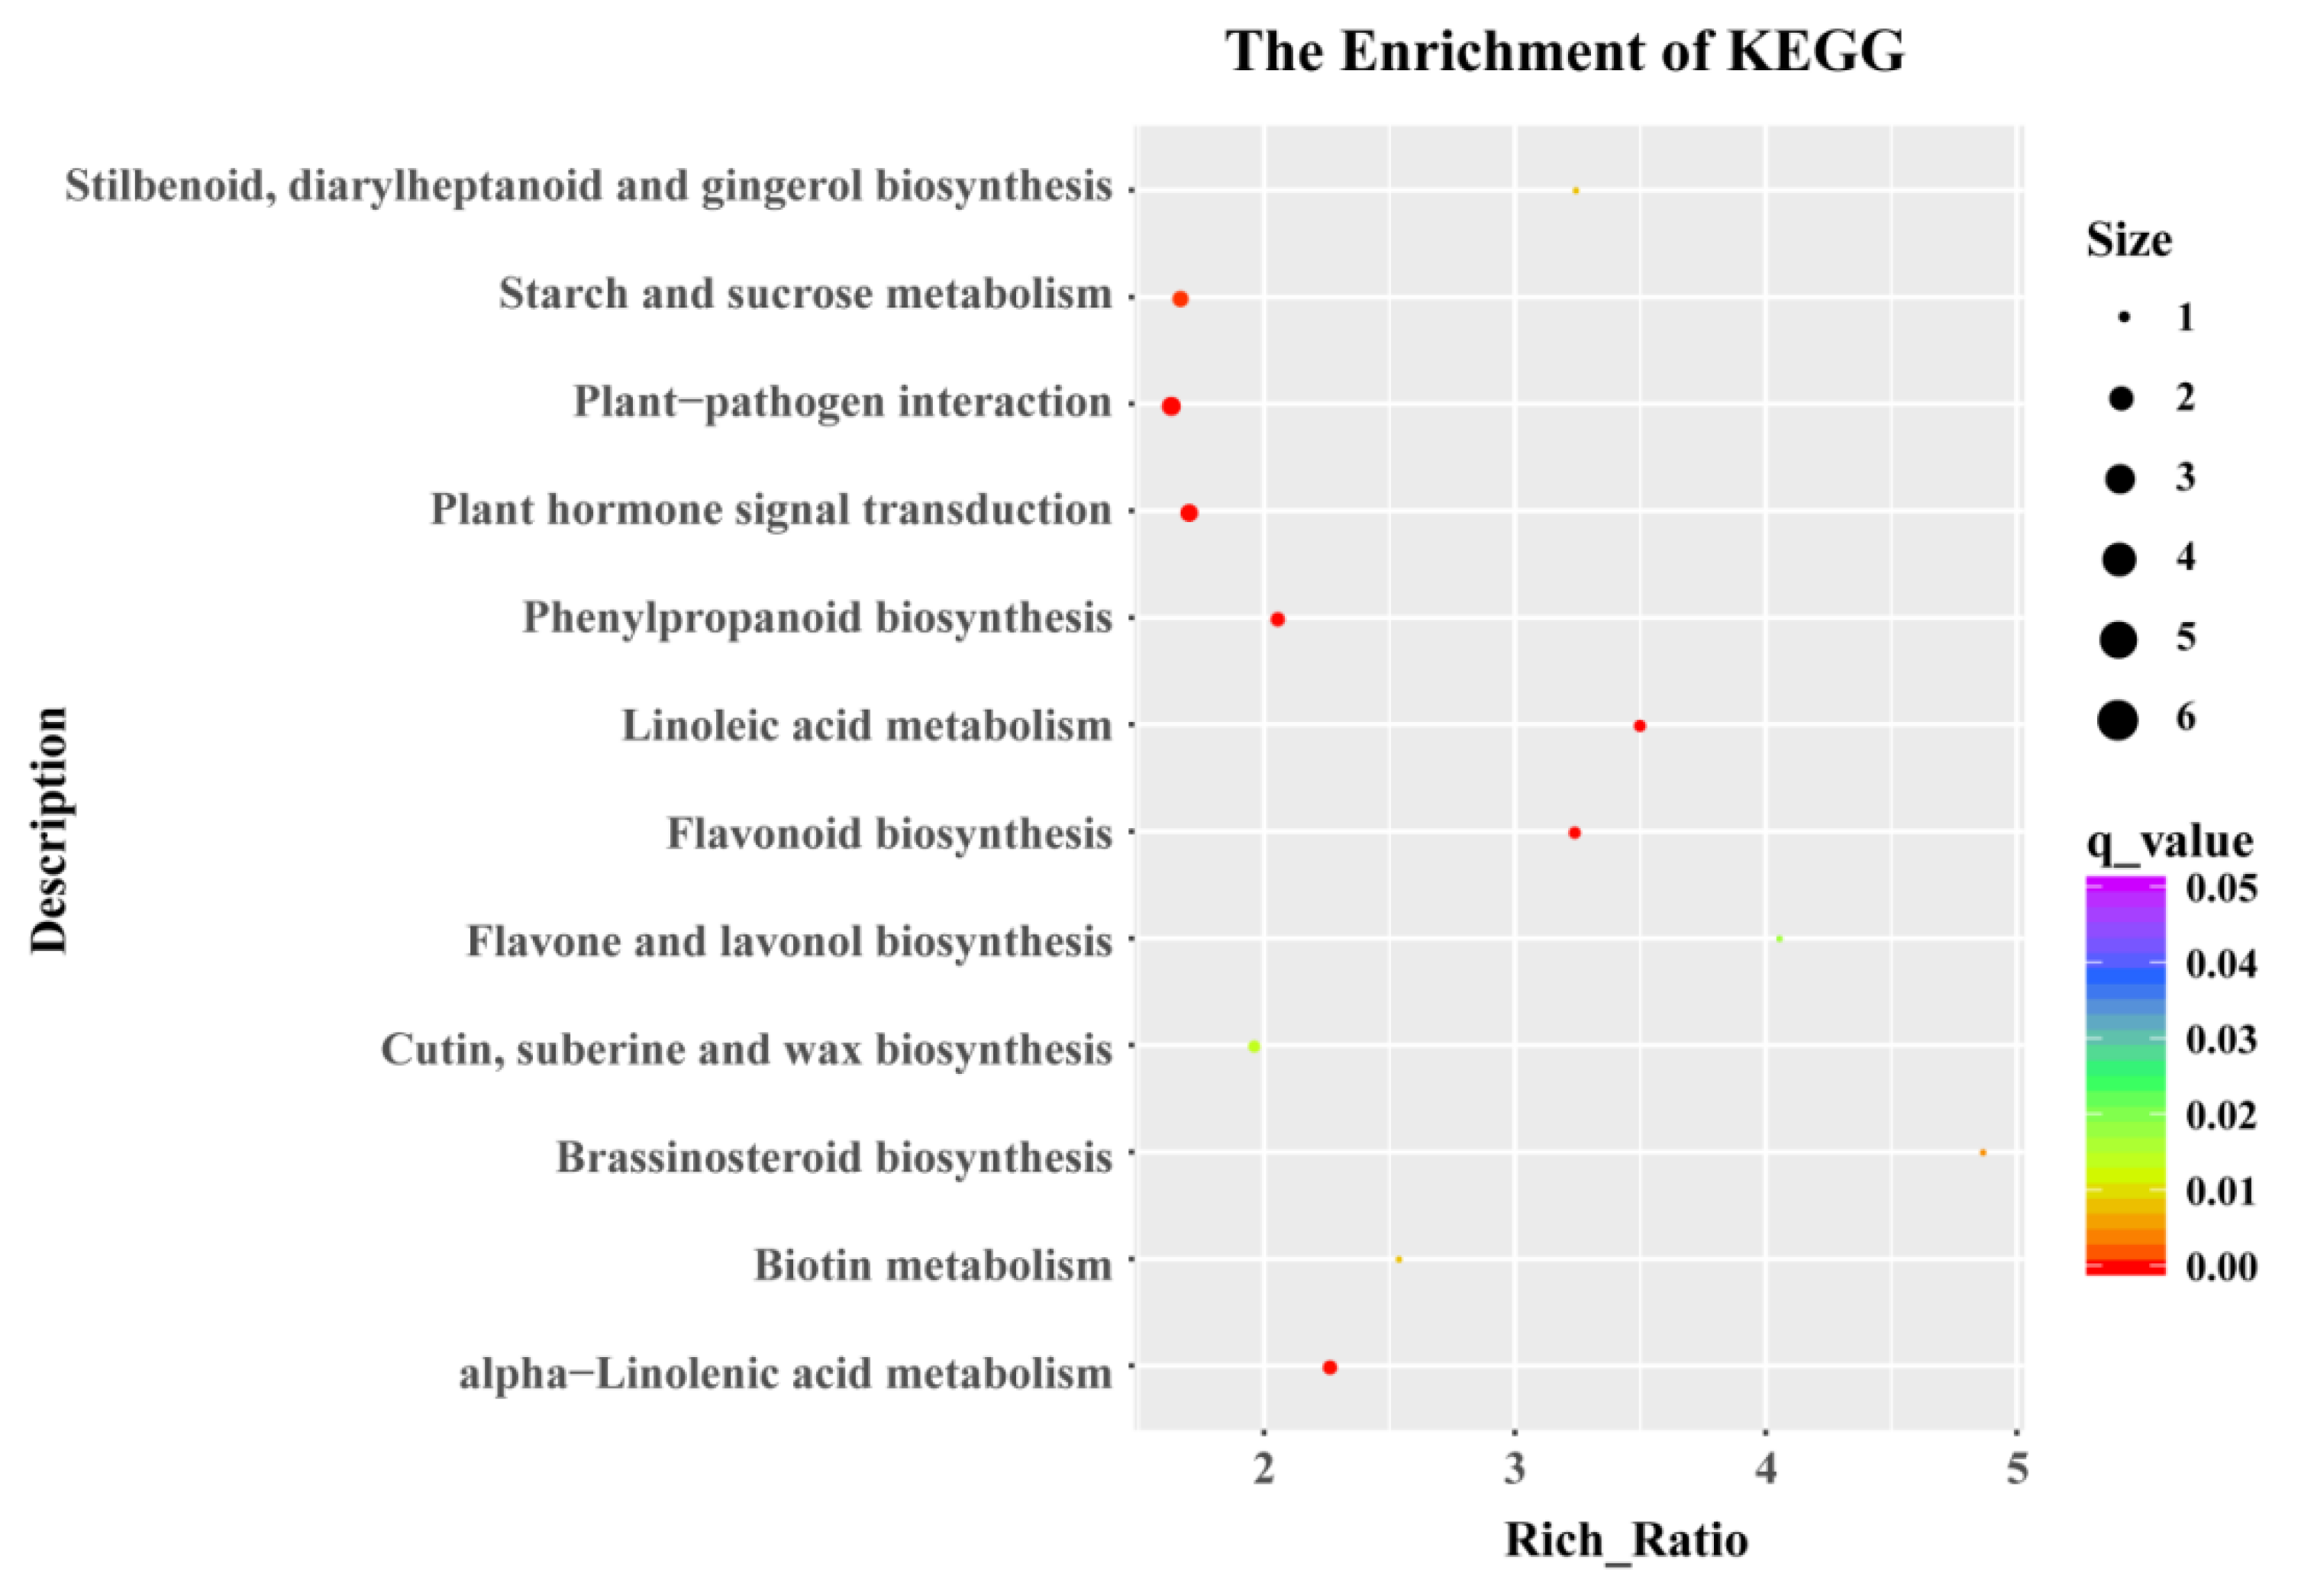
3.3. GO Enrichment and KEGG Pathway Analysis of DEGs

Next, we compared differential expression between yellow and red coloration in C. humilis fruit peel. As a consequence, a total of 9496 DEGs (3939 up-regulated and 5557 down-regulated genes) between the YF and RF libraries were detected through the hierarchical clustering of DEGs (Figure 3a,b). In the heat map, the change of expression level is indicated by the blue, white and red gradient, respectively. Red indicates a higher expression level, and blue represents a lower expression level. The expression patterns of the yellow and red fruit peel libraries were compared, revealing that the colors of the same variety were similar.
Gene ontology (GO) is an internationally standardized gene function classification system that describes the properties of genes and gene products in organisms. We functionally categorized the differentially expressed unigenes using GO terms, showing that 9496 unigenes of DEGs (q value < 0.05) were divided into three major categories and 58 subcategories: 19 were cellular components, 26 were biological processes, and 13 were molecular functions. For the cellular component category,‘cell part and organelle were the top enriched terms, whereas in the biological process category, most of the DEGs were enriched in cellular processes and metabolic processes, and in the molecular function category, most of the DEGs were participants in binding and catalytic activity (Figure 4). These results represent an overall condition of the DEG functions, providing information to understand inter-varietal differences at the gene function level.
KEGG analysis provides information and further understanding on how C. humilis regulates its biological functions, biosynthesis of secondary metabolites, and multiple gene interactions at the transcriptome and molecular level. It has been shown that the DEGs are enriched in the 130 KEGG pathways, among which the most significantly enriched pathways were linoleic acid metabolism, plant-pathogen interaction, flavonoid biosynthesis and phenylpropanoid biosynthesis. These pathways are mainly composed of down-regulated DEGs (Figure 5). Among the 130 KEGG pathways, there are two pathways related to color formation; namely, the flavonoids synthesis pathway (ko00941) and anthocyanin synthesis pathway (ko00942), with 36 unigenes and 1 unigene, respectively. The pathways annotated by these DEGs were closely related to the abundance of metabolites of YF and RF.

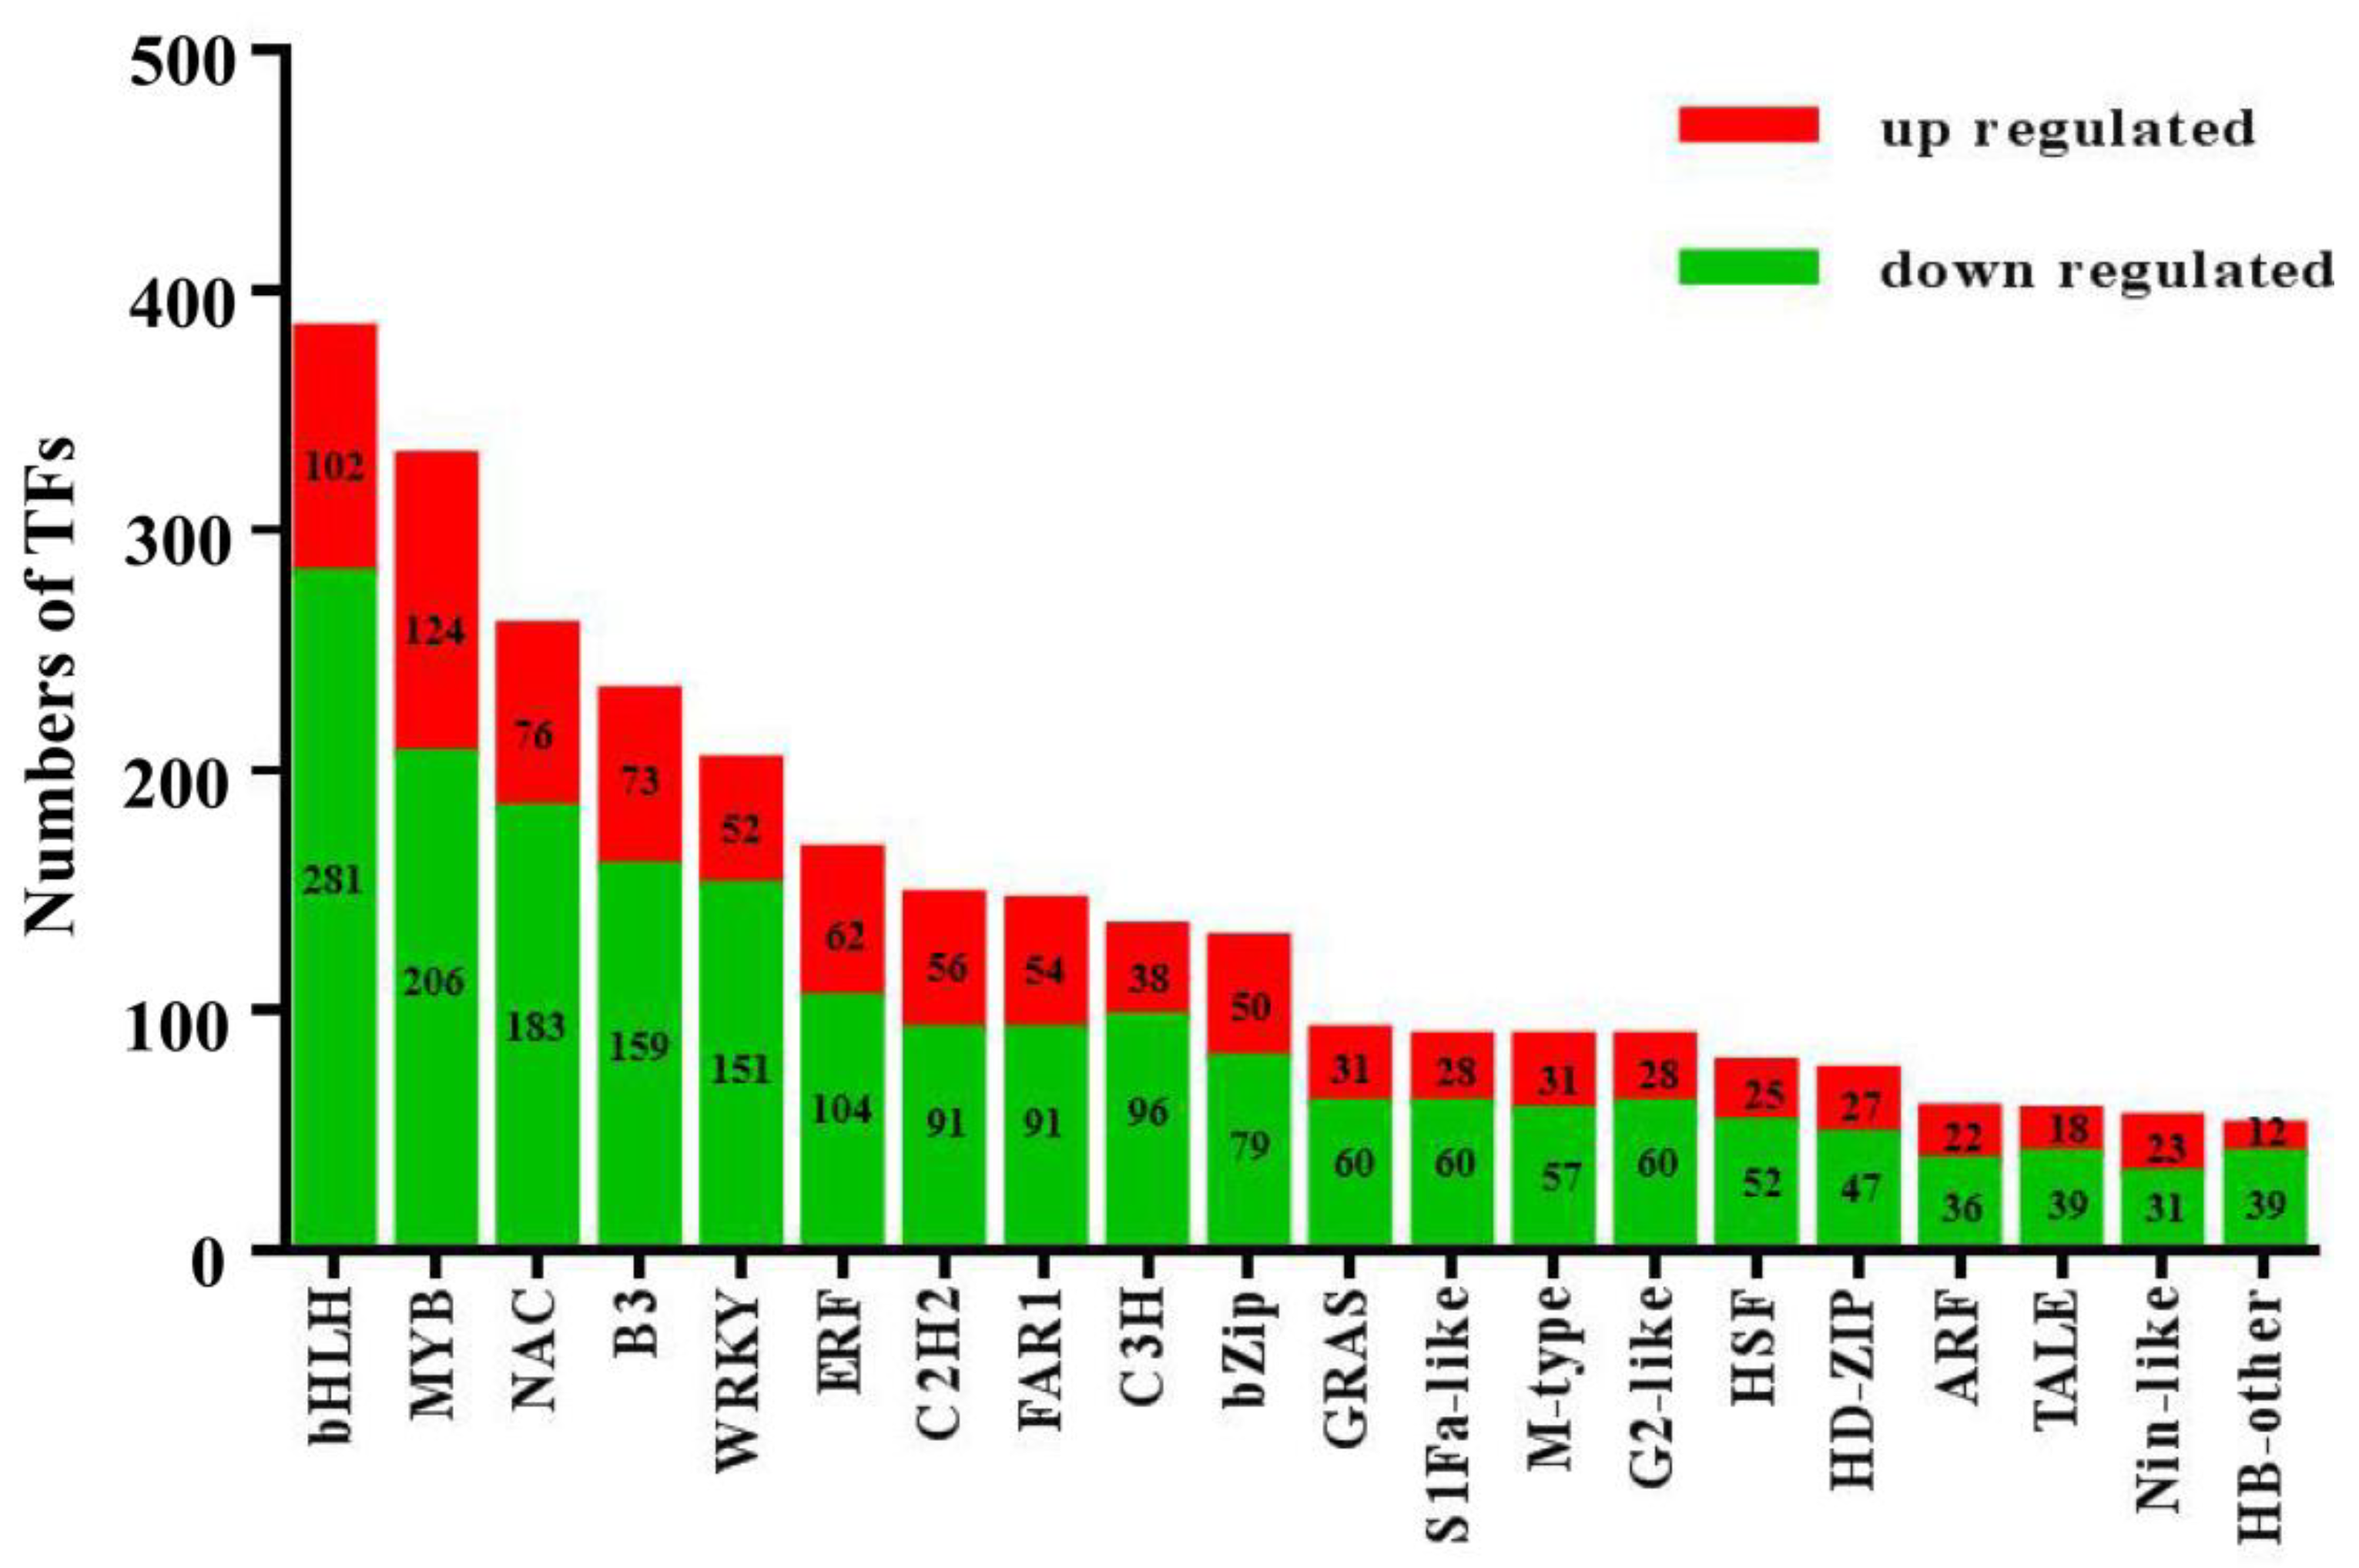
3.4. Analysis of Transcription Factors

Transcription factors (TFs) are important regulatory factors, which can activate or inhibit the expression of structural genes by binding to their promoter sequences. A total of 3571 TF genes were identified through transcriptome data analysis, and could be grouped into 55 transcription factor families (Table S2), the majority of which were bHLH and MYB, followed by the NAC, B3, WRKY, ERF, FAR1, C2H2 and C3H transcription factor families (Figure 6). It has been widely confirmed that members of the bHLH and MYB families regulate anthocyanin biosynthesis in plants. In the present study, we identified 383 and 330 unigenes in the bHLH and MYB families, with 102 and 124 up-regulated and 281 and 206 down-regulated, in YF vs. RF, respectively (Table S3). It is worth noting that three genes were annotated as being associated with R2R3-MYB (TRINITY_DN18821_c0_g5, TRINITY_DN20762_c1_g1 and TRINITY_DN23575_c1_g1). In particular, the MYB TF (TRINITY_DN20762_c1_g1) was only highly expressed in RF, but not in YF (Table S4).

3.5. Regulatory Network of Anthocyanin Biosynthetics

In order to confirm the expression profiles of key DEGs involved in the anthocyanin biosynthesis pathway, real-time quantitative PCR (qRT-PCR) was used to verify the 12 DEGs with different peel coloration in two varieties of C. humilis, and the gene expression profiles were analyzed (Figure 7a). The qRT-PCR was highly correlated with RNA-seq data, showing consistency in up-regulation and down-regulation of DEG expression (Figure 7b). The Pearson’s correlation coefficient between RNA-seq and qRT-PCR was 0.8829 (Figure 7b). These results indicate that the RNA-seq data were reliable.
For a better understanding of the relationship between metabolites and genes in anthocyanin biosynthesis, we combined all metabolites and transcriptome data to establish a network. We clearly found the relationship between gene expression and metabolites in the whole anthocyanin biosynthesis pathway of different varieties (Figure 8).
Two main classes of functional enzymes exist in this pathway; the early biosynthetic enzymes catalyze all flavonoid synthesis, and later biosynthetic enzymes, which are required for the synthesis of anthocyanins. First, compared with the RF group, the YF group had no significant changes in the early genes (such as PAL, C4H, 4CL, CHS, and CHI) of anthocyanin synthesis. Subsequently, F3H was responsible for the conversion of naringenin to dihydrokaempferol, as this was significantly up-regulated in the YF group. However, transcriptome data showed that the late genes of anthocyanin synthesis (such as DFR, ANS, and UFGT) in the RF group were significantly higher than those in the YF group. Therefore, these candidate genes obtained from this study could be used for further study to uncover the coloring mechanism of C. humilis fruit peel (Table S5).

3.6. Integrated Analysis of the Transcriptome and Metabolome of Anthocyanins

Ten differential metabolites were obtained from anthocyanins, among which highly positive correlations were obtained among all of the metabolites (Pearson correlation coefficient >0.85). Moreover, the correlation analysis between anthocyanin biosynthesis-related genes and metabolites showed highly positive correlations among most genes and metabolites across the whole level. However, three genes (TRINITY_DN19104_c0_g1, TRINITY_DN22982_c3_g2 and TRINITY_DN23387_c0_g1) were negatively correlated with all other genes and metabolites, and the three genes have highly positive correlations with each other (Figure 9a). The results of metabonomics and transcriptome analysis showed a significant negative correlation between the three genes (TRINITY_DN19104_c0_g1, TRINITY_DN23387_c0_g1 and TRINITY_DN22982_c3_g2) and pmb0545 (Rosinidin O-hexoside) in the metabolites (Pearson correlation coefficient > −0.98) (Figure 9b). In addition, eight genes (TRINITY_DN20425_c0_g9, TRINITY_DN9931_c0_g2, TRINITY_DN9931_c0_g1, TRINITY_DN18971_c0_g3, TRINITY_DN21824_c1_g2, TRINITY_DN19472_c1_g2, TRINITY_DN20281_c1_g1 and TRINITY_DN21332_c0_g2) were significantly correlated with most of the differential metabolites (Figure 9b, Table S6); their regulatory relationships need to be further studied.

4. Discussion

4.1. Effect of Content and Types of Anthocyanins on Coloration in Yellow and Red Fruit Peel

Fruit color is an important trait that affects the edible value of fruit to consumers, and the relationship between color formation and anthocyanin accumulation has been extensively studied for many years. Currently, several reports have described key genes and enzymes for fruit color formation and accumulation in many fruits, including apples and peaches [17,18]. However, the mechanism of anthocyanin biosynthesis in C. humilis is still obscure. In this study, the differences in anthocyanin metabolites in different varieties of C. humilis were qualitatively and quantitatively analyzed, and the UPLC-MS/MS (anthocyanin targeted) method was used to analyze the types of anthocyanin-related metabolites in different varieties of C. humilis for the first time. Based on target metabolomics analysis, a total of 16 metabolites of anthocyanins were identified, of which 11 were significantly different (Table 1). Among the three main categories of pigmented glycosides, pelargonidin mainly shows orange/red, cyanidin mainly shows pink/magenta and delphinidin mainly shows purple/blue. Interestingly, cyanidin and pelargonidin contents were higher in RF but only cyanidin O-syringic acid and pelargonidin 3-O-beta-D-glucoside (Callistephin chloride) were detected in YF (Table 1). Zhou et al. [50] found that cyanidin O-syringic acid, petunidin 3-O-glucoside, and pelargonidin 3-O-β-d-glucoside were detected in pink tea flowers, while these secondary metabolites were not detected in white flowers. Similarly, anthocyanins were found in red Lycoris longitude, however no anthocyanins were found in white and yellow flowers [51]. Such a result provides us with insight into the difference between red and yellow coloring in C. humilis fruit peel.

4.2. Key Genes in the Anthocyanin Pathway Affect Coloration in Yellow and Red Fruit Peel

The genes in the pathway of anthocyanin metabolism are relatively conservative in different plants; for instance, for genes related to anthocyanin synthesis in C. humilis fruit peel, 23 transcripts encoding 11 enzymes were isolated. Three of the 11 were phenylalanine synthesis genes, including PAL, C4H and 4CL; six were flavonoid synthase genes, including CHS, CHI, F3H, F3’H, DFR, and ANS; one was a proanthocyanidin synthase gene, LAR; and one was an anthocyanin synthase gene, UFGT [36,38,52]. In our studies, the expression analysis of early genes showed that the expression of F3H in YF was higher than that in RF (Figure 8), suggesting that a large amount of dihydrokaempferol could be produced in YF, but this could not eventually outflow into anthocyanin synthase. Similar reports have revealed the role of naringenin chalcone as a yellow pigment in the coloring of yellow flowers [53]. Therefore, we speculated that this could be the reason for the color formation of YF. Our results also showed that DFR was significantly more upregulated in RF than in YF (Table S5). DFR led dihydrokaempferol and dihydroquercetin into the final pathway of anthocyanin synthesis [22]. It is worth mentioning that ANS and UFGT showed higher expression levels in RF, with several hundred more folds than YF (Table S5). The conversion of leucopelargonidin and leucocyanidin into unstable anthocyanins occurred under the catalysis of ANS [54]. These unstable anthocyanins were further glycosylated by UFGT to form stable anthocyanins, which finally showed color [55]. Therefore, we speculate that ANS and UFGT are two key genes that determine the color of RF.

4.3. Impact of Different Varieties on TFs

Several studies have shown that the MBW protein complex, composed of R2R3-MYB and bHLH TFs, plays an important role in regulating the transcription of anthocyanin biosynthesis-related genes, together with WD40 protein [12,13,56]. The activity of R2R3-MYB has a unique role in determining the function of the complex, which could promote or inhibit the transcription of structural genes. In this study, three R2R3-MYB TFs were identified by RNA-seq analysis, and all of them were significantly up-regulated in RF. We speculated that they may play a key role in the anthocyanin synthesis of RF (Table S4). For example, Meng et al. [57] found overexpression of the R2R3-MYB transcription factor LeAN2 could promote anthocyanin accumulation in transgenic tobacco. Similarly, Yao et al. reported that PyMYB114 could increase anthocyanin biosynthesis in red-skinned pears [58]. In contrast, Zhou et al. reported that the overexpression of VvMYBC2L2 in tobacco resulted in a significant decrease in petal anthocyanin concentration [59]. However, the results of the current work can only show the expression of TFs in different varieties of C. humilis. The molecular mechanisms of interactions between these TFs and the promoter sequences of structural genes require further elucidation.

4.4. Integrated Analysis of the Transcriptome and Metabolome

Anthocyanins are the final product of plant development, and play an important role in regulating the color changes of fruits. In this study, combined metabonomics and transcriptome analysis showed that three late genes, DFR, ANS and UFGT, were significantly positively correlated with most of the different metabolites (Figure 9b), which provided a reference for the correlations between anthocyanin metabolites and genes. These late genes are likely regulated by upstream genes, which may finally lead to changes in the metabolism of downstream pathways. The results provide valuable information for explaining the color difference of C. humilis. Nevertheless, the specific mechanism still needs further research and exploration.

5. Conclusions

In this study, we sequenced and analyzed the transcriptome and metabolome in red and yellow fruit peel. A total of 9496 DEGs were identified in the transcriptome of C. humilis, of which 3939 were up-regulated and 5557 were down-regulated. A total of 16 anthocyanin metabolites were detected, including 11 differential metabolites. Through the combined analysis of the transcriptome and metabolomic data, we investigated the regulatory network and correlation analysis of anthocyanin accumulation in different varieties. Additionally, we screened out the key TFs and structural genes that may participate in anthocyanin accumulation. The results of this study provide a deeper understanding of the molecular mechanism of anthocyanin accumulation in C. humilis and lay a foundation for breeding new varieties of C. humilis.

Supplementary Materials

The following are available online at https://www.mdpi.com/1999-4907/11/10/1065/s1, Figure S1: The total ion current (TIC) of Cerasus humilis fruit peel, Figure S2: Statistics of annotation information of assembled unigenes in Cerasus humilis. Gene Ontology (GO) classification of unigenes, Figure S3: Statistics of annotation information of assembled unigenes in Cerasus humilis. KOG function annotation of putative proteins, Table S1: Primer sequences for qRT-PCR, Table S2: The numbers of transcription factors, Table S3: The percent of transcription factors involved in the top 20 transcription factor families, Table S4: MYB TF expression in RF and YF, Table S5: Anthocyanin biosynthesis-related genes, Table S6: Correlation analysis of anthocyanin synthesis genes and metabolites.

Author Contributions

X.J. and X.S. conceived and designed the experiments. X.J. and L.Z. performed the experiments. X.J., J.R., S.L. D.W. and X.S. analyzed the data. X.J., J.R. and X.S. wrote the manuscript. All authors have read and agreed to the published version of the manuscript.

Funding

This work was supported by Fundamental Research Funds for the Central Universities (Grant No. 2572018CG02), the National Natural Science Foundation of China (Grant No. 31901660), and Special Project of Science and Technology Basic Resources Investigation (2019FY100502-5).

Acknowledgments

We thank Annoroad Biotechnology Co., Ltd for helping with RNA-sequencing, and Metware Biotechnology Co., Ltd for metabolomic analysis.

Conflicts of Interest

The authors declare that they have no competing interests.

References

  1. Yin, Z.; Ren, J.; Zhou, L.; Sun, L.; Wang, J.; Liu, Y.; Song, X. Water deficit mechanisms in perennial shrubs Cerasus humilis leaves revealed by physiological and proteomic analyses. Proteome Sci. 2016, 15, 9. [Google Scholar] [CrossRef] [PubMed] [Green Version]
  2. Wang, F.; Wang, J.W.; Sun, L.J.; Song, X.S. The molecular cloning and functional characterization of ChNAC1, a NAC transcription factor in Cerasus humilis. Plant Growth Regul. 2019, 89, 331–343. [Google Scholar] [CrossRef]
  3. Ren, J.; Sun, L.N.; Zhang, Q.Y.; Song, X.S. Drought Tolerance Is Correlated with the Activity of Antioxidant Enzymes in Cerasus humilis Seedlings. BioMed Res. Int. 2016, 2016, 9851095. [Google Scholar] [CrossRef] [Green Version]
  4. Wang, P.; Mu, X.; Du, J.; Gao, Y.G.; Bai, D.; Jia, L.; Zhang, J.; Ren, H.; Xue, X. Flavonoid content and radical scavenging activity in fruits of Chinese dwarf cherry (Cerasus humilis) genotypes. J. For. Res. 2017, 29, 55–63. [Google Scholar] [CrossRef]
  5. Wang, R.F.; Huang, F.L.; Zhang, J.; Zhang, Q.Y.; Sun, L.N.; Song, X.S. Establishment of a high-frequency regeneration system in Cerasus humilis, an important economic shrub. J. For. Res. 2017, 21, 244–250. [Google Scholar] [CrossRef]
  6. Wang, P.; Mu, X.; Gao, Y.G.; Zhang, J.; Du, J. Successful induction and the systematic characterization of tetraploids in Cerasus humilis for subsequent breeding. Sci. Hortic. 2020, 265, 109216. [Google Scholar] [CrossRef]
  7. Fan, S.; Wu, P.; Xing, G. Nutritional Composition and Development of Chinese Dwarf Cherry (Cerasus Humilis (Bge.) Sok.). Int. J. Nutr. Food Sci. 2019, 8, 30. [Google Scholar] [CrossRef] [Green Version]
  8. Negi, P.; Chauhan, A.; Sadia, G.; Rohinishree, Y.; Ramteke, R. Antioxidant and antibacterial activities of various seabuckthorn ((Hippophae rhamnoides L.) seed extracts. Food Chem. 2005, 92, 119–124. [Google Scholar] [CrossRef]
  9. Bunea, A.; Rugina, D.; Sconta, Z.; Pop, R.M.; Pintea, A.; Socaciu, C.; Tabaran, F.; Grootaert, C.; Struijs, K.; VanCamp, J. Anthocyanin determination in blueberry extracts from various cultivars and their antiproliferative and apoptotic properties in B16-F10 metastatic murine melanoma cells. Phytochemistry 2013, 95, 436–444. [Google Scholar] [CrossRef]
  10. Borges, G.; Degeneve, A.; Mullen, W.; Crozier, A. Identification of flavonoid and phenolic antioxidants in black currants, blueberries, raspberries, red currants, and cranberries. J. Agric. Food Chem. 2010, 58, 3901–3909. [Google Scholar] [CrossRef]
  11. Yang, B.; He, S.; Liu, Y.; Liu, B.; Ju, Y.; Kang, D.; Sun, X.; Fang, Y. Transcriptomics integrated with metabolomics reveals the effect of regulated deficit irrigation on anthocyanin biosynthesis in Cabernet Sauvignon grape berries. Food Chem. 2020, 314, 126170. [Google Scholar] [CrossRef] [PubMed]
  12. Li, Y.; Fang, J.; Qi, X.; Lin, M.; Zhong, Y.; Sun, L.; Cui, W. Combined Analysis of the Fruit Metabolome and Transcriptome Reveals Candidate Genes Involved in Flavonoid Biosynthesis in Actinidia arguta. Int. J. Mol. Sci. 2018, 19, 1471. [Google Scholar] [CrossRef] [PubMed] [Green Version]
  13. Zhang, Y.; Zhou, T.; Dai, Z.; Dai, X.; Li, W.; Cao, M.; Li, C.; Tsai, W.C.; Wu, X.; Zhai, J.; et al. Comparative Transcriptomics Provides Insight into Floral Color Polymorphism in a Pleione limprichtii Orchid Population. Int. J. Mol. Sci. 2019, 21, 247. [Google Scholar] [CrossRef] [PubMed] [Green Version]
  14. Tanaka, Y.; Sasaki, N.; Ohmiya, A. Biosynthesis of plant pigments: Anthocyanins, betalains and carotenoids. Plant J. 2008, 54, 733–749. [Google Scholar] [CrossRef] [PubMed]
  15. He, J.; Giusti, M.M. Anthocyanins: Natural colorants with health-promoting properties. Annu. Rev. Food Sci. Technol. 2010, 1, 163–187. [Google Scholar] [CrossRef]
  16. Welch, C.R.; Wu, Q.; Simon, J.E. Recent Advances in Anthocyanin Analysis and Characterization. Curr. Anal. Chem. 2008, 4, 75–101. [Google Scholar] [CrossRef] [Green Version]
  17. Cheng, J.; Wei, G.; Zhou, H.; Gu, C.; Vimolmangkang, S.; Liao, L.; Han, Y. Unraveling the mechanism underlying the glycosylation and methylation of anthocyanins in peach. Plant Physiol. 2014, 166, 1044–1058. [Google Scholar] [CrossRef] [Green Version]
  18. Li, W.F.; Mao, J.; Yang, S.J.; Guo, Z.G.; Ma, Z.H.; Dawuda, M.M.; Zuo, C.W.; Chu, M.Y.; Chen, B.H. Anthocyanin accumulation correlates with hormones in the fruit skin of ’Red Delicious’ and its four generation bud sport mutants. BMC Plant Biol. 2018, 18, 363. [Google Scholar] [CrossRef] [Green Version]
  19. Xue, L.; Wang, Z.; Zhang, W.; Li, Y.; Wang, J.; Lei, J. Flower pigment inheritance and anthocyanin characterization of hybrids from pink-flowered and white-flowered strawberry. Sci. Hortic. 2016, 200, 143–150. [Google Scholar] [CrossRef]
  20. Yang, Y.; Yao, G.; Yue, W.; Zhang, S.; Wu, J. Transcriptome profiling reveals differential gene expression in proanthocyanidin biosynthesis associated with red/green skin color mutant of pear (Pyrus communis L.). Front. Plant Sci. 2015, 6, 795. [Google Scholar] [CrossRef] [Green Version]
  21. Kong, J.M.; Chia, L.S.; Goh, N.K.; Chia, T.F.; Brouillard, R. Analysis and biological activities of anthocyanins. Phytochemistry 2003, 64, 923–933. [Google Scholar] [CrossRef]
  22. Fang, H.; Dong, Y.; Yue, X.; Hu, J.; Jiang, S.; Xu, H.; Wang, Y.; Su, M.; Zhang, J.; Zhang, Z.; et al. The B-box zinc finger protein MdBBX20 integrates anthocyanin accumulation in response to ultraviolet radiation and low temperature. Plant Cell Environ. 2019, 42, 2090–2104. [Google Scholar] [CrossRef] [PubMed]
  23. Crifo, T.; Petrone, G.; Lo Cicero, L.; Lo Piero, A.R. Short cold storage enhances the anthocyanin contents and level of transcripts related to their biosynthesis in blood oranges. J. Agric. Food Chem. 2012, 60, 476–481. [Google Scholar] [CrossRef] [PubMed]
  24. Zhu, Y.; Ling, W.; Guo, H.; Song, F.; Ye, Q.; Zou, T.; Li, D.; Zhang, Y.; Li, G.; Xiao, Y.; et al. Anti-inflammatory effect of purified dietary anthocyanin in adults with hypercholesterolemia: A randomized controlled trial. Nutr. Metab. Cardiovasc. Dis. 2013, 23, 843–849. [Google Scholar] [CrossRef]
  25. Inaguma, T.; Han, J.; Isoda, H. Improvement of insulin resistance by Cyanidin 3-glucoside, anthocyanin from black beans through the up-regulation of GLUT4 gene expression. BMC Proc. 2011, 5 (Suppl. 8), P21. [Google Scholar] [CrossRef] [Green Version]
  26. Hwang, J.W.; Kim, E.K.; Lee, S.J.; Kim, Y.S.; Choi, D.K.; Park, T.K.; Moon, S.H.; Jeon, B.T.; Park, P.J. Anthocyanin effectively scavenges free radicals and protects retinal cells from H2O2-triggered G2/M arrest. Eur. Food Res. Technol. 2011, 234, 431–439. [Google Scholar] [CrossRef]
  27. Kuhnen, S.; Menel Lemos, P.M.; Campestrini, L.H.; Ogliari, J.B.; Dias, P.F.; Maraschin, M. Carotenoid and anthocyanin contents of grains of Brazilian maize landraces. J. Sci. Food Agric. 2011, 91, 1548–1553. [Google Scholar] [CrossRef]
  28. Abdel-Aal, E.S.M.; Abou-Arab, A.A.; Gamel, T.H.; Hucl, P.; Young, J.C.; Rabalski, I. Fractionation of Blue Wheat Anthocyanin Compounds and Their Contribution to Antioxidant Properties. J. Agric. Food Chem. 2008, 56, 11171–11177. [Google Scholar] [CrossRef]
  29. Wang, Z.; Gerstein, M.; Snyder, M. RNA-Seq: A revolutionary tool for transcriptomics. Nat. Rev. Genet. 2009, 10, 57–63. [Google Scholar] [CrossRef]
  30. Reuter, J.A.; Spacek, D.V.; Snyder, M.P. High-throughput sequencing technologies. Mol. Cell 2015, 58, 586–597. [Google Scholar] [CrossRef] [Green Version]
  31. Xu, S.; Huang, Q.; Lin, C.; Lin, L.; Zhou, Q.; Lin, F.; He, E. Transcriptome comparison reveals candidate genes responsible for the betalain-/anthocyanidin-production in bougainvilleas. Funct. Plant Biol. 2016, 43, 278–286. [Google Scholar] [CrossRef] [PubMed]
  32. Yu, R.; Du, X.; Li, J.; Liu, L.; Hu, C.; Yan, X.; Xia, Y.; Xu, H. Identification and differential expression analysis of anthocyanin biosynthetic genes in root-skin color variants of radish (Raphanus sativus L.). Genes Genom. 2020, 42, 413–424. [Google Scholar] [CrossRef] [PubMed]
  33. Zou, S.; Wu, J.; Shahid, M.Q.; He, Y.; Lin, S.; Liu, Z.; Yang, X. Identification of key taste components in loquat using widely targeted metabolomics. Food Chem. 2020, 323, 126822. [Google Scholar] [CrossRef] [PubMed]
  34. Yan, N.; Du, Y.; Liu, X.; Chu, M.; Shi, J.; Zhang, H.; Liu, Y.; Zhang, Z. A comparative UHPLC-QqQ-MS-based metabolomics approach for evaluating Chinese and North American wild rice. Food Chem. 2019, 275, 618–627. [Google Scholar] [CrossRef]
  35. Johanningsmeier, S.D.; Harris, G.K.; Klevorn, C.M. Metabolomic Technologies for Improving the Quality of Food: Practice and Promise. Annu. Rev. Food Sci. Technol. 2016, 7, 413–438. [Google Scholar] [CrossRef] [Green Version]
  36. Zhang, Z.; Tian, C.; Zhang, Y.; Li, C.; Li, X.; Yu, Q.; Wang, S.; Wang, X.; Chen, X.; Feng, S. Transcriptomic and metabolomic analysis provides insights into anthocyanin and procyanidin accumulation in pear. BMC Plant Biol. 2020, 20, 129. [Google Scholar] [CrossRef] [Green Version]
  37. Xu, J.; Yan, J.; Li, W.; Wang, Q.; Wang, C.; Guo, J.; Geng, D.; Guan, Q.; Ma, F. Integrative Analyses of Widely Targeted Metabolic Profiling and Transcriptome Data Reveals Molecular Insight into Metabolomic Variations during Apple (Malus domestica) Fruit Development and Ripening. Int. J. Mol. Sci. 2020, 21, 4797. [Google Scholar] [CrossRef]
  38. Wan, L.; Lei, Y.; Yan, L.; Liu, Y.; Pandey, M.K.; Wan, X.; Varshney, R.K.; Fang, J.; Liao, B. Transcriptome and metabolome reveal redirection of flavonoids in a white testa peanut mutant. BMC Plant Biol. 2020, 20, 161. [Google Scholar] [CrossRef] [Green Version]
  39. Holton, T.A.; Cornish, E.C. Genetics and Biochemistry of Anthocyanin Biosynthesis. Plant Cell. 1995, 7, 1071–1083. [Google Scholar] [CrossRef]
  40. Twyford, A.D.; Caola, A.M.; Choudhary, P.; Raina, R.; Friedman, J. Loss of Color Pigmentation Is Maintained at High Frequency in a Monkey Flower Population. Am. Nat. 2018, 191, 135–145. [Google Scholar] [CrossRef]
  41. Wishart, D.S.; Tzur, D.; Knox, C.; Eisner, R.; Guo, A.C.; Young, N.; Cheng, D.; Jewell, K.; Arndt, D.; Sawhney, S.; et al. HMDB: The Human Metabolome Database. Nucleic Acids Res. 2007, 35, D521–D526. [Google Scholar] [CrossRef] [PubMed]
  42. Fraga, C.G.; Clowers, B.H.; Moore, R.J.; Zink, E.M. Signature-Discovery Approach for Sample Matching of a Nerve-Agent Precursor Using Liquid Chromatography-Mass Spectrometry, XCMS, and Chemometrics. Anal Chem. 2010, 82, 4165–4173. [Google Scholar] [CrossRef] [PubMed]
  43. Chen, W.; Gong, L.; Guo, Z.; Wang, W.; Zhang, H.; Liu, X.; Yu, S.; Xiong, L.; Luo, J. A novel integrated method for large-scale detection, identification, and quantification of widely targeted metabolites: Application in the study of rice metabolomics. Mol. Plant. 2013, 6, 1769–1780. [Google Scholar] [CrossRef] [PubMed] [Green Version]
  44. Yang, C.; Yang, H.; Xu, Q.; Wang, Y.; Sang, Z.; Yuan, H. Comparative metabolomics analysis of the response to cold stress of resistant and susceptible Tibetan hulless barley (Hordeum distichon). Phytochemistry 2020, 174, 112346. [Google Scholar] [CrossRef]
  45. Su, P.; Zhao, L.; Li, W.; Zhao, J.; Yan, J.; Ma, X.; Li, A.; Wang, H.; Kong, L. Integrated metabolo-transcriptomics and functional characterization reveals that the wheat auxin receptor TIR1 negatively regulates defense against Fusarium graminearum. J. Int. Plant Biol. 2020. [Google Scholar] [CrossRef]
  46. Simao, F.A.; Waterhouse, R.M.; Ioannidis, P.; Kriventseva, E.V.; Zdobnov, E.M. BUSCO: Assessing genome assembly and annotation completeness with single-copy orthologs. Bioinformatics 2015, 31, 3210–3212. [Google Scholar] [CrossRef] [Green Version]
  47. Grabherr, M.G.; Haas, B.J.; Yassour, M.; Levin, J.Z.; Thompson, D.A.; Amit, I.; Adiconis, X.; Fan, L.; Raychowdhury, R.; Zeng, Q.; et al. Full-length transcriptome assembly from RNA-Seq data without a reference genome. Nat. Biotechnol. 2011, 29, 644–652. [Google Scholar] [CrossRef] [Green Version]
  48. Anders, S.; Huber, W. Differential expression analysis for sequence count data. Genome Biol. 2010, 11, R106. [Google Scholar] [CrossRef] [Green Version]
  49. Wang, L.; Feng, Z.; Wang, X.; Wang, X.; Zhang, X. DEGseq: An R package for identifying differentially expressed genes from RNA-seq data. Bioinformatics 2010, 26, 136–138. [Google Scholar] [CrossRef]
  50. Zhou, C.; Mei, X.; Rothenberg, D.O.; Yang, Z.; Zhang, W.; Wan, S.; Yang, H.; Zhang, L. Metabolome and Transcriptome Analysis Reveals Putative Genes Involved in Anthocyanin Accumulation and Coloration in White and Pink Tea (Camellia sinensis) Flower. Molecules 2020, 25, 190. [Google Scholar] [CrossRef] [Green Version]
  51. He, Q.; Shen, Y.; Wang, M.; Huang, M.; Yang, R.; Zhu, S.; Wang, L.; Xu, Y.; Wu, R. Natural variation in petal color in Lycoris longituba revealed by anthocyanin components. PLoS ONE 2011, 6, e22098. [Google Scholar] [CrossRef] [PubMed] [Green Version]
  52. Zhang, Q.; Wang, L.; Liu, Z.; Zhao, Z.; Zhao, J.; Wang, Z.; Zhou, G.; Liu, P.; Liu, M. Transcriptome and metabolome profiling unveil the mechanisms of Ziziphus jujuba Mill. peel coloration. Food Chem. 2020, 312, 125903. [Google Scholar] [CrossRef] [PubMed]
  53. Ono, E.; Fukuchi-Mizutani, M.; Nakamura, N.; Fukui, Y.; Yonekura-Sakakibara, K.; Yamaguchi, M.; Nakayama, T.; Tanaka, T.; Kusumi, T.; Tanaka, Y. Yellow flowers generated by expression of the aurone biosynthetic pathway. Proc. Natl. Acad. Sci. USA 2006, 103, 11075–11080. [Google Scholar] [CrossRef] [Green Version]
  54. Shi, S.G.; Li, S.J.; Kang, Y.X.; Liu, J.J. Molecular characterization and expression analyses of an anthocyanin synthase gene from Magnolia sprengeri Pamp. Appl. Biochem. Biotech. 2015, 175, 477–488. [Google Scholar] [CrossRef] [PubMed]
  55. Wu, X.; Gong, Q.; Ni, X.; Zhou, Y.; Gao, Z. UFGT: The Key Enzyme Associated with the Petals Variegation in Japanese Apricot. Front. Plant Sci. 2017, 8, 108. [Google Scholar] [CrossRef] [Green Version]
  56. Chen, Y.; Pan, W.; Jin, S.; Lin, S. Combined metabolomic and transcriptomic analysis reveals key candidate genes involved in the regulation of flavonoid accumulation in Anoectochilus roxburghii. Process Biochem. 2020, 91, 339–351. [Google Scholar] [CrossRef]
  57. Meng, X.; Yin, B.; Feng, H.L.; Zhang, S.; Liang, X.Q.; Meng, Q.W. Overexpression of R2R3-MYB gene leads to accumulation of anthocyanin and enhanced resistance to chilling and oxidative stress. Biol. Plant. 2014, 58, 121–130. [Google Scholar] [CrossRef]
  58. Yao, G.; Ming, M.; Allan, A.C.; Gu, C.; Li, L.; Wu, X.; Wang, R.; Chang, Y.; Qi, K.; Zhang, S.; et al. Map-based cloning of the pear gene MYB114 identifies an interaction with other transcription factors to coordinately regulate fruit anthocyanin biosynthesis. Plant J. 2017, 92, 437–451. [Google Scholar] [CrossRef] [PubMed] [Green Version]
  59. Zhu, Z.; Li, G.; Liu, L.; Zhang, Q.; Han, Z.; Chen, X.; Li, B. A R2R3-MYB Transcription Factor, VvMYBC2L2, Functions as a Transcriptional Repressor of Anthocyanin Biosynthesis in Grapevine (Vitis vinifera L.). Molecules 2018, 24, 92. [Google Scholar] [CrossRef] [Green Version]
Figure 1. Differential anthocyanin metabolite analysis based on principal component analysis (PCA). (a) Principal component analysis (PCA) score plot derived from metabolite ions acquired using the electrospray ionization positive ion mode (ESI+). (b) PCA score plot derived from metabolite ions acquired using the electrospray ionization negative ion mode (ESI-).
Forests 11 01065 g001
Figure 2. Venn diagram of the number of unigenes annotated by four protein databases.
Forests 11 01065 g002
Figure 3. Analysis of differentially expressed genes (DEGs) in Cerasus humilis. (a) Comparison of the gene transcription profile of the YF and RF libraries. The red dots represent the up-regulated genes, and the green dots represent the down-regulated genes. (b) Heat map of DEGs based on hierarchical clustering analysis.
Forests 11 01065 g003
Figure 4. Functional categorization of DEGs with transcriptional changes between the yellow and red fruit. Red indicates up-regulated and green indicated down-regulated genes.
Forests 11 01065 g004
Figure 5. Scatterplot of the significantly enriched KEGG pathway in YF vs. RF.
Forests 11 01065 g005
Figure 6. The number of transcription factors involved in the top 20 transcription factor families. The x-axis represents the numbers of transcription factors, and the y-axis represents the top 20 transcriptions. The 2854 TF genes were divided into 20 families, of which 932 were up-regulated and 1922 down-regulated.
Forests 11 01065 g006
Figure 7. Quantitative real-time PCR (qRT-PCR) validation of 12 DEGs. (a) Expression patterns of 12 genes involved in anthocyanin biosynthesis. Each column represents an average of three biological replicates, with standard errors indicated by vertical bars. (b) Correlation of the expression levels of 12 selected genes measured by qRT-PCR and RNA-seq. RF: red fruit; YF: yellow fruit.
Forests 11 01065 g007
Figure 8. Cerasus humilis fruit peel unigenes thought to be included in the anthocyanin biosynthetic pathway, and their gene expression levels. The heatmap was created according to the average expression levels of related biosynthetic genes based on the RPKM values. A color bar is presented at the top right. Blue indicates low expression, and red indicates high expression. Abbreviations are as follows: PAL (phenylalanine ammonia-lyase); C4H (phenylalanine ammonia-lyase); 4CL (4-coumarate-CoA ligase); CHS (chalcone synthase); CHI (chalcone isomerase); F3H (flavanone 3-hydroxylase); F3’H (flavonoid 3′-hydroxylase); DFR (dihydroflavonol reductase); ANS (anthocyanidin synthase); UFGT (UDP-glucose: flavonoid-3-O-glycosyltranferase); LAR (leucoanthocyanidin reductase).
Forests 11 01065 g008
Figure 9. Correlation analysis of different metabolites and DEGs. (a): Red indicates a positive correlation, and green indicates a negative correlation. (b): Results of the correlation analysis between DEGs and metabolites. Positive correlations are indicated by a solid line, and negative correlations are indicated by a dotted line. Red indicates a metabolite, and green indicates a gene.
Forests 11 01065 g009
Table 1. Type and content of anthocyanins in RF and YF.
IndexQ1 (Da)Q3 (Da)Molecular Weight (Da)CompoundsRFSEYFSE
pma1590463.12 301.1463.12 Peonidin O-hexoside4.88 × 1068.01 × 1052.84 × 1062.04 × 106
pmb0542535.10 287.2535.10 Cyanidin 3-O-malonylhexoside6.49 × 1043.55 × 1045.02 × 1041.47 × 104
pmb0545477.10 315.1477.10 Rosinidin O-hexoside8.57 × 1041.42 × 1045.00 × 1043.57 × 104
pmb0837577.10 289.1576.10 Procyanidin A39.04 × 1052.31 × 1055.68 × 1053.37 × 105
pmb2957465.10 285.2466.10 Cyanidin O-syringic acid7.77 × 1072.76 × 1075.27 × 1072.50 × 107
pmb2962473.10 269.1474.10 Pelargonidin O-acetylhexoside4.27 × 1053.03 × 1053.65 × 1056.22 × 104
pme0094447.30 285.1448.30 Cyanidin 3-O-glucoside (Kuromanin)8.81 × 1062.57 × 1065.69 × 1063.12 × 106
pme0431577.00 289.1576.13 Procyanidin A15.34 × 1063.00 × 1064.17 × 1061.17 × 106
pme0432575.00 287.1576.13 Procyanidin A24.84 × 1042.84 × 1043.84 × 1041.00 × 104
pme0434577.00 125.2578.14 Procyanidin B25.29 × 1065.74 × 1052.93 × 1062.36 × 106
pme0436577.10 125.2578.14 Procyanidin B35.70 × 1061.99 × 1063.85 × 1061.86 × 106
pme1773595.00 287.2595.00 Cyanidin 3-O-rutinoside (Keracyanin)7.50 × 1074.54 × 1076.02 × 1071.48 × 107
pme1777611.00 287.1611.00 Cyanidin 3,5-O-diglucoside (Cyanin)6.50 × 1055.03 × 1055.76 × 1057.36 × 104
pme3392433.10 271.1433.10 Pelargonidin 3-O-beta-D-glucoside (Callistephin chloride)1.1.3 × 1085.29 × 1078.29 × 1073.01 × 107
pmf0027449.10 287.2448.10 Cyanidin 3-O-galactoside3.10 × 1071.08 × 1072.09 × 1071.01 × 107
pmf0203463.12 301.1498.09 Peonidin 3-O-glucoside chloride4.26 × 1064.38 × 1052.35 × 1061.91 × 106
Note: SE, Standard Error; Q1, parent ions; Q3, characteristic fragments.
Table 2. Summary of the sequencing quality of six RNA libraries of Cerasus humilis.
SampleRaw_ReadsClean_ReadsQ30GC
RF-1(S4A)507092084686907493.42%46.1%
RF-2(S4B)498528444685115093.56%46.23%
RF-3(S4C)483480764512942893.45%46.02%
YF-1(YA)444706484089411293.91%46.37%
YF-2(YB)452437384140817893.92%46.57%
YF-3(YC)461145264189300493.99%46.49%

