Abstract
Research Highlights: This paper integrates disparate research results pertaining to climate change impacts to 12 co-occurring forest tree species and their climatypes such that management options for the ecosystem as a whole become discernible. Background and Objectives: The ecosystem under analysis is the Thuja-Tsuga forest ecosystem, occupying ca. 121,500 km2 in a largely mountainous setting in the interior northwest, USA. Our goal is to present land management options tied directly to climate-change in a straightforward framework for both the current and future generations. Materials and Methods: By merging synecological and genecological concepts in a climatic framework, we simplify complex interactions in a manner that relates directly to climate change impacts. Species and climatype distributions are redefined in terms of mean annual temperature and elevation of forested landscapes. Results: For each 2 °C increase in temperature, plant associations should shift upwards ca. 400 m, provided precipitation remains at or near contemporary levels, which, for this ecosystem, vary between 300 mm and 1450 mm. Management guidelines are developed for (a) selecting climatypes of the species suited to the climate at the leading edge of the migration front, (b) anticipating decline at the trailing edge, and (c) converting climatypes in areas where species should persist. Conclusions: Our results can provide robust strategies for adapting forest management to the effects of climate change, but their effectiveness is dependent on the implementation of global warming mitigation actions.
1. Introduction
Warming climates increase atmospheric energy which, in turn, increases weather variability such that extreme climatic events are reaching new thresholds [1]. Direct effects to the world’s terrestrial and aquatic ecosystems have been pronounced and widespread. Species are coping by altering physiology, morphology, phenology, or genetics, leading toward an erosion of the fitness of organisms to their environments [2]. For forest trees, climate change has increased the incidence of insects and disease [3,4,5,6], advanced spring phenologies [7,8], and lengthened growing seasons [9]. As trees become less attuned physiologically to their environment, forest health deteriorates and mortality accrues. Restoring a semblance of balance between ecological distributions and the climate requires contraction at the trailing edge of the migration front [10,11,12,13,14,15,16,17] and immigration at the leading edge [16,17,18].
Vegetation change, however, is not necessarily an orderly process. Time lags exist between the forest renewal processes encompassing physiological decline, mortality, disturbance, migration, and colonization. These lags, known collectively as the migration lag [19], are exacerbated when climate change is rapid [20], thereby increasing the time required for a semblance of equilibrium to be approached between the vegetation and the new climate.
Climate change impacts to forests are complicated additionally by the genetic structures of tree species. Most broadly distributed species encounter more climate variation across their range than can be accommodated by the adaptability of individual trees [21,22]. In such species, adaptation to heterogeneous environments has been achieved through environmental selection operating on genetic variation to produce clines in fitness-related traits that parallel the environmental gradients [23]. In many temperate and boreal species, the clines reflect a trade-off between growth potential and cold hardiness [23,24,25]. This trade-off develops as selection favors adaptation to either specific environments or adaptability across a range of environments (specialization vs. flexibility) to produce clines that can be either steep when specialization is favored or gentle when adaptability is favored [26,27,28,29]. Although clines are continuous, populations occurring along a cline can be grouped into climatypes [30,31], the climatic ecotypes of Turesson [32], that are composed of adaptively similar populations. Climatypes, therefore, are merely classifications of continuous genetic variation. Species with steep clines (e.g., Pseudotsuga menziesii (Mirb.) Franco) will have many climatypes. Those with gentle clines (e.g., Thuja plicata Donn ex D. Donn) will have a few climatypes and those with flat clines (e.g., Pinus monticola Douglas ex D. Donn) will have none.
When clines and climatypes are prominent features of the adaptive genetic system, impacts from a change in climate can reverbate throughout a species distribution as well as at the trailing and leading edges. While species with flat clines will be affected by climate change primarily at the distribution margins, those with steep clines will lose fitness throughout their distribution [27]. Under the natural system, the maintenance of population fitness and forest health during change invokes the evolutionary process. Since evolutionary changes accumulate over generations, another lag, the adaptation lag [33], is superimposed on migration lags to further delay adjustment of the vegetation to a new climate. Many analyses (e.g., [34,35]) have shown, in fact, that the rate the climate is changing is far faster than natural systems are able to overcome the migration and adaptation lags. Fossil records [36] indicate that such conditions result in vegetation of diminished richness and diversity.
Land managers face the task of integrating these biological complexities with (a) rates of climate change that are rapid compared to the lifespan of trees [20], and (b) the uncertainty surrounding climate-change projections [37]. Adaptive planning, therefore, may seem opaque at best and unsolvable at worst [38,39]. While tools such as niche models [40], species distribution models [41], or models of species importance [42] can provide guidelines for management of individual species, with few exceptions (e.g., [43,44]) management of ecosystems as a whole has received less emphasis.
Our goal is to integrate disparate research results pertaining to climate-change impacts to species and their climatypes such that options for land managers can be viewed in a straightforward framework for both the current and future generations. The foundation for our analysis is the ecological classifications of Rexford Daubenmire [45,46] for the Thuja-Tsuga forest ecosystem of the inland northwestern USA and adjacent Canada (Figure 1). We deal with only the USA portion, ca. 121,500 km2 where (a) the Daubenmire system is basic to contemporary forest planning, and (b) genecological analyses have been completed for most of the region’s endemic conifers. We combine the genecology and synecology with their climatic descriptors to address our goals.
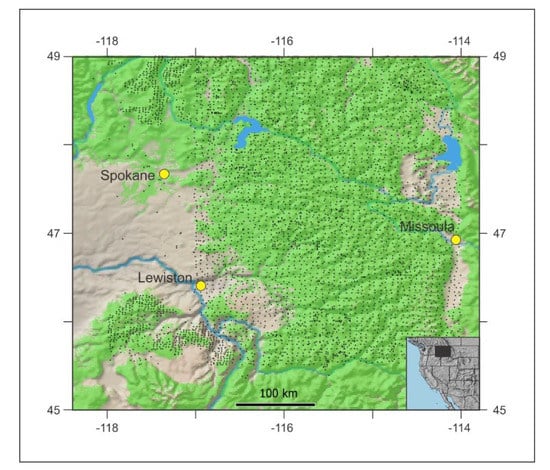
Figure 1.
Forested lands of the Thuja-Tsuga ecosystem (green shading) of the inland Northwest USA with dots locating forest inventory’s permanent sample plots.
2. Methods
The portion of Thuja-Tsuga ecosystem with which we deal, roughly −118 to −114 longitude by 45.5 to 49 latitude (Figure 1), is a mountainous home to 12 conifer species: Pinus ponderosa Laws., Pseudotsuga menziesii, Larix occidentalis Nutt., Pinus contorta Douglas ex Louden, Abies grandis (Douglas ex D. Donn) Lindl, Pinus monticola, Thuja plicata, Tsuga heterophylla (Raf.) Sarg., Picea engelmannii Parry ex Engelm., Abies lasiocarpa (Hook.) Nutt., Tsuga mertensiana (Bong.) Carrier, Pinus albicaulis Engelm. Forest inventory in this region is served by ca. 5100 ground plots (Figure 1) at elevations ranging from 300 to 1000 m. Modeled estimates of climate [47] for these ground plots show mean annual temperature of forested lands to vary between −2.8 °C and 12.5 °C and mean annual precipitation to range from 331 mm to 1455 mm. Climate estimates used in our analyses are the modeled climate estimates from the ground plots of Figure 1 that are derived from 1961–1990 normals and were used in the analyses of Rehfeldt et al. [47]. We consider these normals to be the reference period from which global warming and its effects are measured.
The ecosystem’s conifers were arranged by Daubenmire [46] in an altitudinal ordination (Figure 2, top), which he visualized as paralleling a climatic gradient from warm and dry at low elevation to cool and moist at high. Subsequent analyses [47] designed to quantify the underlying climatic bases of Daubenmire’s ordinaton found the lower altitudinal distribution limits to be most closely related to a summer dryness index and the upper limits to winter cold, measured by negative degree-days (Figure 2, bottom). These analyses found no other climate variables that could convert the two-dimensional ordination of Figure 2 into three-dimensional climate space. While Figure 2 (bottom) clearly demonstrates the climatic basis of Daubenmire’s ordination, topoclimatic and edaphic effects along with successional trends that would separate, for instance, the occurrence P. menziesii and T. heterophylla are not represented.
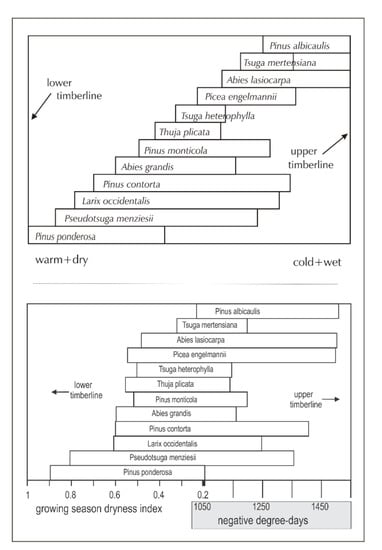
Figure 2.
(top) Conceptual ordination of 12 species along an environmental gradient from warm-dry to cool-moist (left to right) as re-drawn from Daubenmire [46]. (bottom) Climatic quantification [47] of the conceptual ordination.
While Figure 2 relates ecological distributions directly to climate, the analytical results tend to be opaque from the practical viewpoint, that is, they lack an intuitive transparency tying Figure 2 directly to topographic landscapes. The ordination also lacks a direct correspondence to the variables used to report global temperature increases, that is, mean temperature.
To convert Figure 2 from its conceptual and climatic bases into a form more intuitive and, therefore, better suited for management, we used the relationships in Figure 3 to replace the bivariate climate gradient with a singled variable, mean annual temperature, which is closely related to both the summer dryness index (Figure 3, top left) and negative degree-days (Figure 3, top right), and incorporate an additional scale for elevation, which is also closely related to mean annual temperature (Figure 3, bottom). The conversions were made visually. Regression models were not fit to the scatter plots of Figure 3 largely because fitting a nonlinear function to these distributions seemed superfluous.
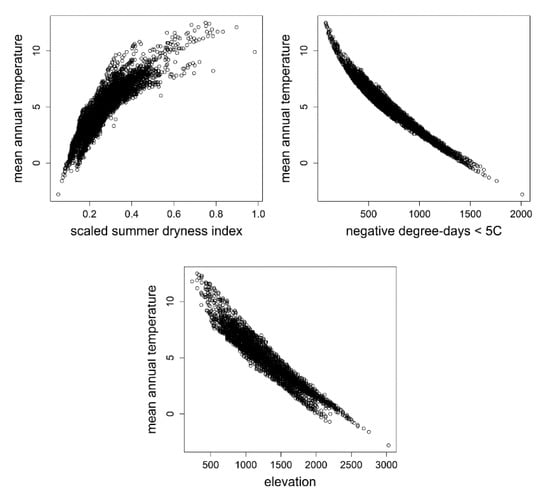
Figure 3.
(top left) Scatter plot relating the summer dryness index to mean annual temperature. (top right) Scatter plot relating negative degree-days to mean annual temperature. (bottom) Scatter plot relating elevation to mean annual temperature. Climate data are modeled climate estimates for the ca. 5100 ground plots of Figure 1 that were used in the analyses of Rehfeldt et al. [47].
The addition of an approximate elevation to Daubenmire’s ordination allowed species distributions to be subdivided into climatypes according to the research results of Table 1. The addition of mean annual temperature then allowed the ordination to be re-cast for an increase in temperature. We illustrate the effects of global warming with +2 °C and +4 °C temperature increases and assume no change in precipitation, that is, the reference period variation in precipitation does not change.

Table 1.
Altitudinal breadth of climatypes for eight of the tree species in the Thuja-Tsuga ecosystem and their literature references. Genetic variation has not been studied in A. grandis, T. heterophylla, T. mertensiana, and A. lasiocarpa.
3. Results
Figure 4 shows Daubenmire’s ordination (Figure 2, top) in relation to mean annual temperature and elevation. Species distributions are plotted linearly for mean annual temperature, which forces the scale for elevation to be nonlinear (see Figure 3). This nonlinear relationship has its greatest impact for low elevations. Having a scale showing elevation provides a link to topographic maps and, therefore, forested landscapes.
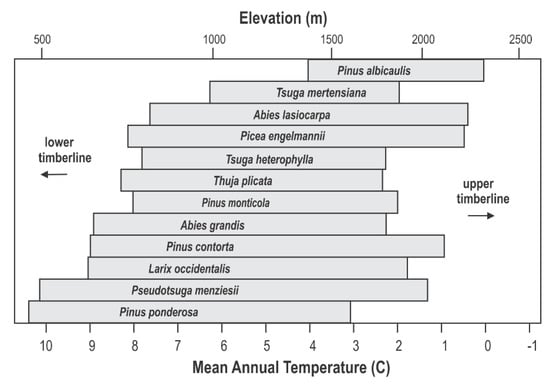
Figure 4.
Ordination of 12 conifer species of Figure 2 according to mean annual temperature and elevation for USA’s inland northwest.
The scale for elevation in Figure 4 also provides a link to the genecology studies that have been conducted for 8 of the 12 species. Since most of these studies were completed before climate data became readily available, their results related genetic differentiation to elevation, widely assumed to be a surrogate for the climate. This genecological research produced the data in Table 1 that we use to segment species distributions into climatypes (Figure 5, top). The ordination in Figure 5 has been drawn using a linear scale for elevation, thereby forcing the scale for mean annual temperature to be nonlinear. Elevation is truncated at 2600 m because the land base >2600 m is miniscule in this region (see Figure 3, bottom graph). In this figure, the limits of distribution of climatypes in the top panel were drawn in reference to mean annual temperatures during the 1961–1990 reference period. The climatypes, therefore, reflect the clines in genetic variability that were produced by climatic selection in the generations leading up to and including the reference period. Differences among species in the number of climatypes and their climatic breadth reflects the ecological amplitude of the species as well as the steepness of the genetic cline.
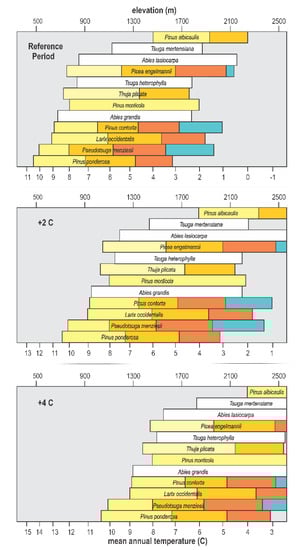
Figure 5.
Ordination of Figure 4 with species distributions segmented into climatypes (colors) and plotted with a linear elevation scale for mean temperatures of the 1961–1990 reference period (top), and for an increase in temperature of 2 °C (middle) and 4 °C (bottom). The number and breath of climatypes for each species corresponds to Table 1. White bars code species whose genetic structures have not been studied.
With species distributions now depicted as functions of temperature at both the leading and trailing edges (Figure 5, top), plotting the impact of a change in temperature becomes straightforward. We chose +2 °C (Figure 5, middle) and +4 °C (Figure 5, bottom) to illustrate responses. The middle panel of this figure shows that a warming of +2 °C would shift the climate currently occupied by these species and their climatypes upwards by ca. 400 m at the trailing edge and ca. 350 m at the leading edge. A warming of +4 °C would shift the altitudinal distribution of the contemporary habitat an additional 400 m at the trailing edge, but immigration at the leading edge would most likely be limited by both the elevation of the ridgeline and substrate, that is, rock. Figure 5 is based on temperature alone and the assumption, therefore, that precipitation will remains similar to that of the reference period (see discussion).
All panels in Figure 5 depict a quasi-equilibrium state at which this group of 12 species and their climatypes inhabit climates in which their fitness is suitable for optimal growth and productivity. For the middle and bottom panels, this would occur when the species and their climatypes somehow occur in the new location of the temperature regime they inhabited in the reference period. While there are no means for projecting a timeline for this to happen, the process by which the top panel in Figure 5 is converted to the middle and bottom panels is known.
Provenance tests in forestry are climate-change experiments (see [57]) in which populations or their wind-pollinated descendants are moved from their home climate to the climate of a planting site. In a re-analysis of P. contorta provenances, temperature-driven response functions were produced for 10 climatypes to describe growth in relation to site temperature and temperature change [58]. In Figure 6, the functions for four climatypes have been re-cast to show the innately controlled plastic responses of the climatypes. The top graph shows growth in relation to a temperature change. The location of a climatype in the reference period is denoted by a dot at a climate change of zero. The bottom panel shows growth responses in relation to mean annual temperature of forest sites. In re-casting this figure, the x-axis was converted from negative degree-days to mean annual temperature in the same way that Figure 4 was produced using Figure 3.
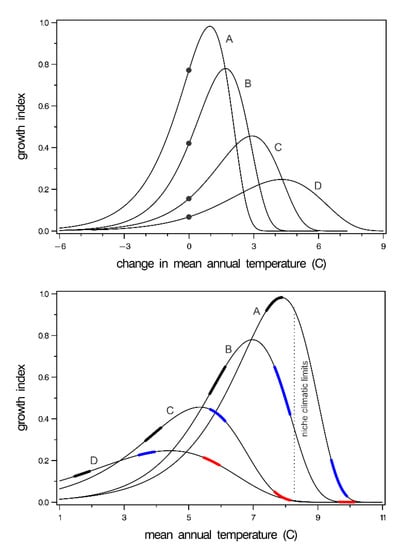
Figure 6.
(top) Response of four climatyes (lines) of Pinus contorta to change in temperature. Dots show the growth expected at the home provenance having, therefore, a climate change of zero. Lines labeled A to D depict climatypes from lowest to highest elevation. (bottom) Response of the same four climatypes to mean annual temperature. Thickened portion of response functions shows growth of climatypes at the temperature of their home (black), +2 °C (blue), and +4 °C (red). Niche climate limits are based on ground plot data. Both panels are redrawn from Rehfeldt et al. [55].
The analyses on which Figure 6 is derived illustrated two principles: (1) climatypes occupy climates colder than where they grow best, presumably by competitive exclusion by faster growing trees, and (2) the temperature difference between the site where they occur and where they grow best increases as the climate where they occur becomes colder. Thus, the top panel of Figure 6 shows that, at a climate change of zero, the climate is colder than where the climatypes grow the best. Both panels show that the discrepancy increases as the inhabited climate becomes colder. The bottom graph shows further that the populations within a climatype occur where they can be competitively exclusive while still being competitively excluded from where they grow the best. The growth potential-temperature cline, incidentally, would be represented by a line connecting the apex of each curve in the bottom graph.
The panels together illustrate clearly that climatypes will respond differently to change. Climatypes from cold climates will respond favorable to warming climates for a much longer period than climatypes from warm climates. This differential response is clearly illustrated in the bottom graph where the thickened portion of the response functions colored black shows growth in the reference period climate, that is, the temperature of their home provenance. The portion colored blue shows their growth as if their home temperature had increased by 2 °C, and the portion colored red shows their growth at +4 °C. With warming of +2 °C, two climatypes would be in decline. At +4 °C, all climatypes would be beyond their ecological optimum and, therefore, be in decline. The climatic limits of the species as indicated by the populations of Figure 1 is shown by the hashed line for reference.
The graphs of Figure 6 pertain to P. contorta, but the same principles are evident in Pinus banksiana [59], Pinus sylvestris [35], and three species of Eurasian Larix [60]. It is also well known for many additional species that populations inhabit climates cooler than where they grow the best [61,62,63]. It is likely, therefore, the adaptive system illustrated in Figure 6 is a widespread feature of species exhibiting clines controlled by the trade-off between maximizing growth to survive competition and requirements for cold hardiness [22,34]. The resolution of this compromise will produce species-specific response curves (e.g., Figure 6) with the number of climatypes and the breadth of the functions being dependent on the steepness of the cline.
4. Discussion
Our analysis concerns the Tsuga-Tsuga ecosystem, a part of the temperate coniferous forests of western North America. The ecosystem is home to 12 conifers that occur in an altitudinal sequence, with species distributions limited by the winter cold at upper elevations and by a balance between temperature and precipitation at lower elevations. We assume that precipitation during global warming will remain unchanged from the 1961–1990 reference period and illustrate climate-change impacts at +2 °C and +4 °C. Resulting impacts would be direct and immediate at high elevation thermic limits but would depend also on precipitation anomalies at the low elevations. Because our projections are specific to the ecological associations of and climatic relationships in the Tsuga-Tsuga ecosystem, they pertain solely to this ecosystem.
We describe potential impacts on the current generation of forests and project them for future generations as a response to temperature increase. For each 2 °C warming, climatic niche of 12 species are projected to shift upwards in elevation by about 400 m. Yet, we treat the species assemblage as reacting to the same climate variables when, in fact, plant associations did not respond as a unit to the Pleistocene climate changes [36,64]. It is well established that species respond individualistically to changes in climate. Our position is that if the reference period and future climates are analogous, then species and climatypes adapted to reference period climates will be adapted to the same climate in the future.
When future climates have no reference period analogs, the outcome of competitive interactions is expected to change, potentially altering the climatic limits of species distributions [64,65]. Climate analyses suggest, moreover, that no-analog climates should become more frequent in USA’s inland northwest as global warming ensues (Figure 8 in Ref. [65], Figure 16 in Ref. [66]). In fact, analyses of North American biomes suggest that no-analog climates late in the current century may result in the Thuja-Tsuga ecosystem becoming of increasing prominence in Canada, while USA’s interior northwest becomes suited to vegetation occurring today in coastal biomes (Figure 8 in Ref. [67]). As no-analog climates increase in frequency, projections lose relevance. Consequently, our results pertain to forests of the current generation and to those of the near future but become increasingly less germane for more distant generations. We limit our assessment of climate change impacts to +2 °C and +4 °C for the same reason.
Plant distributions are controlled by precipitation and the interaction of precipitation with temperature as well as by temperature alone (Figure 2). We over-simplify climatic limits of distribution by ordering species along a temperature gradient, thereby forcing projections for the future to rely solely on change in temperature. The relevance of Figure 5, therefore, depends on the confidence one has in temperature increasing while precipitation remains as it was during the reference period. With regard to temperature, general circulation models tend to be consistent and robust [68] because energy and heat are reasonably well understood by atmospheric physicists. Yet air masses, clouds, and precipitation are more poorly understood. For our window, a compilation of 42 models projects future precipitation to increase between 0% and 10%, but the increase is small compared to the variability among predictions. In fact, only 80% of the models agree that precipitation will increase while the remainder predict a decrease [68]. For the tree species of the Thuja-Tsuga ecosystem, small increases in precipitation might act to reduce impacts somewhat at the trailing edge, which tends to be under the control of a dryness index, but should, at the same time, have little effect at the leading edge, which is a thermal limit controlled by winter cold (see Figure 2). Large changes in precipitation, despite their low probability, could hasten development of climates without reference period analogs [65,69], thereby leading to a realignment of plant associations [65,69].
Climatypes are designed by humans classifying continuous genetic variation. They are constructed by grouping populations along a cline such that the groups contain populations that are similar in terms of adaptation. In forest trees, the most prominent adaptive clines parallel temperature gradients. Since temperature gradients tend to be continuous, so too are the clines. Because continuous systems are difficult to convert into managerial guidelines, discrete units, that is, climatypes, are defined by classifying the continuous genetic variation. Yet, climatypes do not exist as discrete ecological entities. The climatypes of Figure 4 are one set of innumerable classifications, all of which could be valid. While the breadth of the climatype is important, its placement along the gradient is not.
An upward shift of the Thuja-Tsuga communities is directly relevant to management. Obviously, both lower and upper timberlines will rise. This means that the forest area will decrease because species occupy smaller and smaller areas as they move upwards. Upward migration is also limited by the altitude of ridge lines and the substrate typical of high elevations. In addition, migration in our ecosystem will affect diversity, as the species-rich forests of the mid-elevations invade the subalpine zone. As warming temperatures relax limits governing distributions [70], upward migration of species has enriched European forest communities [17,71,72,73]. Yet, as an increase in diversity at upper elevations increases management options, a concomitant loss of diversity and fewer options occur at lower elevations.
Even though species may react to climate change individualistically in the long term, Figure 2, Figure 3, Figure 4 and Figure 5 illustrate clearly that the process by which vegetation adjusts to change forces an interdependence on species’ responses. Each species has a leading edge and a trailing edge. Therefore, in species-rich assemblages, the trailing edge of one species is often the leading edge of another. Consequently, rates of immigration of one species often are limited by rates of demise and mortality in other species. Rates are dependent also by the occurrence of disturbance to prepare sites for colonization. Because lags in these ecological processes are inevitable, the conclusion reached by many [74] is that maintaining forest health, modifying composition, and maintaining productivity while providing amenities will require intensive management.
4.1. Managing the Current Generation
The two panels of Figure 6 illustrate together the fate of existing populations. Because climatypes occupy climates colder than where they grow the best, most climatypes initially gain in growth as the climate begins to warm. As warming continues, growth of those climatypes near the species’ trailing edge soon reaches the ecological optimum and then rapidly declines. Climatypes in cool climates near the species’ leading edge can absorb warming temperatures for a prolonged period before growth declines. Yet, with warming of +4 °C, all climatypes would be beyond their ecological optimum, with some projected to be in climates beyond the current climatic limits of the species. Decline, however, may be abrupt in cases associated with extreme weather, insect outbreaks, and disease, or decline may be prolonged when arising from physiological deterioration.
As decline in growth ensues, trees become less fit for their environment. Forest health deteriorates as productivity declines. Poorly adapted plants, moreover, are under physiological stress, thereby becoming vulnerable to insects and diseases [2]. An appropriate stratagem for managers to maintain healthy, productive forests would be to anticipate the period of decline, recognize that decline will occur at different times for disparate climatypes, harvest, and convert to a suitable species and/or climatype.
4.2. Considerations for Future Generations
The greatest challenge to the maintenance of healthy and productive forests in the next and subsequent generations is in having species and climatypes growing at the new location of the climate to which that climatype is genetically fit. The goal, therefore would be to maintain a semblance of equilibrium between plant distributions and climate. While widespread planting programs, including assisted migration when appropriate, would address the problem directly, the immense scope of a reforestation program required for making the conversions implied in Figure 5 leads toward the conclusion that the ecological consequences of poorly adapted forests cannot be averted everywhere by means of artificial regeneration. Natural reproduction, therefore, likely will be a common default approach for forest renewal.
As a default, natural regeneration carries liabilities except for those lands inhabited today by climatypes also suited for the future. The uncertainties surrounding seed production, seed dispersal, and seedling establishment make timely immigration problematic, especially when the distance from seed source to reforestation site is large [19]. Likewise, conversion of one climatype to another via natural reproduction and natural selection could require several generations, with each generation needing to survive long enough to reproduce [34,35]. These contingencies promote migration and adaptation lags that will act to impede timely immigration.
Regardless of the forest renewal strategy, however, it seems clear that management objectives concentrating on forest health and productivity are likely to supplant objectives focusing on conservation, recreation, watersheds, grazing, or wildlife, which commonly drive current forest renewal plans [75].
5. Conclusions
Like innumerable similar analyses, our synthesis projects climate-change impacts to the Thuja-Tsuga ecosystem to be extraordinarily large. For each +2 °C change in temperature, plant distributions are projected to rise ca. 400 m. Changes of this magnitude would result in widespread disruption of the balance between plant distributions and climate. We provide a template for maintaining forest health and productivity during these times of change. While our modeled results provide a foundation for adaptive planning, models and their predicted effects are guidelines. Models cannot replace the intimate knowledge of professionals dealing with species—environmental interactions. Model output needs to be integrated with edaphic, microsite, and topographical effects; seral stages; and the unique silvical characteristics of the species. Models can guide managers toward robust strategies that will be useful for dealing with a changing climate, but their effectiveness is dependent on the implementation of global warming mitigation actions. Efficacy of guidelines such as ours will be voided by continual warming, particularly if rapid, as (1) management actions become negated before reaching fruition, (2) evolution of novel climates accelerates to alter competitive relationships among species, and (3) human survival itself takes on an overriding priority.
Author Contributions
Conceptualization, G.E.R., M.V.W., and R.A.M. Methodology, G.E.R., M.V.W., and R.A.M. Writing, G.E.R. and M.V.W. Visualization, G.E.R., M.V.W., and R.A.M. Funding acquisition, M.V.W. All authors have read and agreed to the published version of the manuscript.
Funding
Partial funding was provided by the Special Technology Development Program of the USDA Forest Service R1-2020-01 and R1-2020-02.
Acknowledgments
We appreciate critical reviews provided by Ned Klopfenstein, James Worrall, Mary Williams, and Andrew Bower.
Conflicts of Interest
The authors declare no conflict of interest.
References
- Schwartz, J. The Siberian Heat Wave? Yes, Climate Change Was a Big Factor. New York Times, 15 July 2020. [Google Scholar]
- Scheffers, B.R.; De Meester, L.; Bridge, T.C.L.; Hoffmann, A.A.; Pandolfi, J.M.; Corlett, R.T.; Butchart, S.H.M.; Pearce-kelly, P.; Kovacs, K.M.; Dudgeon, D.; et al. The broad footprint of climate change from genes to biomes to people. Science 2016, 354, aaf7671. [Google Scholar] [CrossRef] [PubMed]
- Sáenz-Romero, C.; Mendoza-Maya, E.; Gómez-Pineda, E.; Blanco-García, A.; Endara-Agramont, A.R.; Lindig-Cisneros, R.; López-Upton, J.; Trejo-Ramírez, O.; Wehenkel, C.; Cibrián-Tovar, D.; et al. Recent evidence of Mexican temperate forest decline and the need for ex situ conservation, assisted migration, and translocation of species ensembles as adaptive management to face projected climatic change impacts in a megadiverse country. Can. J. For. Res. 2020, 50, 843–854. [Google Scholar] [CrossRef]
- Bebber, D.P.; Ramotowski, M.A.T.; Gurr, S.J. Crop pests and pathogens move polewards in a warming world. Nat. Clim. Chang. 2013, 3, 985–988. [Google Scholar] [CrossRef]
- Anderegg, W.R.L.; Kane, J.M.; Anderegg, L.D.L. Consequences of widespread tree mortality triggered by drought and temperature stress. Nat. Clim. Chang. 2013, 3, 30–36. [Google Scholar] [CrossRef]
- Weed, A.S.; Ayres, M.P.; Hicke, J.A. Consequences of climate change for biotic disturbances in North American forests. Ecol. Monogr. 2013, 83, 441–470. [Google Scholar] [CrossRef]
- Parmesan, C. Ecological and evolutionary responses to recent climate change. Annu. Rev. Ecol. Evol. Syst. 2006, 37, 637–669. [Google Scholar] [CrossRef]
- Root, T.L.; Price, J.T.; Hall, K.R.; Schneider, S.H.; Rosenzweig, C.; Pounds, J.A. Fingerprints of global warming on wild animals and plants. Nature 2003, 421, 57–60. [Google Scholar] [CrossRef]
- Reyes-Fox, M.; Steltzer, H.; Trlica, M.J.; McMaster, G.S.; Andales, A.A.; LeCain, D.R.; Morgan, J.A. Elevated CO2 further lengthens growing season under warming conditions. Nature 2014, 510, 259–262. [Google Scholar] [CrossRef]
- Allen, C.D.; Macalady, A.K.; Chenchouni, H.; Bachelet, D.; McDowell, N.; Vennetier, M.; Kitzberger, T.; Rigling, A.; Breshears, D.D.; Hogg, E.H.; et al. A global overview of drought and heat-induced tree mortality reveals emerging climate change risks for forests. For. Ecol. Manag. 2010, 259, 660–684. [Google Scholar] [CrossRef]
- Breshears, D.D.; Cobb, N.S.; Rich, P.M.; Price, K.P.; Allen, C.D.; Balice, R.G.; Romme, W.H.; Kastens, J.H.; Floyd, M.L.; Belnap, J.; et al. Regional vegetation die-off in response to global-change-type drought. Proc. Natl. Acad. Sci. USA 2005, 102, 15144–15148. [Google Scholar] [CrossRef]
- Gitlin, A.R.; Sthultz, C.M.; Bowker, M.A.; Stumpf, S.; Paxton, K.L.; Kennedy, K.; Muñoz, A.; Bailey, J.K.; Whitham, T.G. Mortality gradients within and among dominant plant populations as barometers of ecosystem change during extreme drought. Conserv. Biol. 2006, 20, 1477–1486. [Google Scholar] [CrossRef] [PubMed]
- Jump, A.S.; Hunt, J.M.; Peñuelas, J. Rapid climate change-related growth decline at the southern range edge of Fagus sylvatica. Glob. Chang. Biol. 2006, 12, 2163–2174. [Google Scholar] [CrossRef]
- Michaelian, M.; Hogg, E.H.; Hall, R.J.; Arsenault, E. Massive mortality of aspen following severe drought along the southern edge of the Canadian boreal forest. Glob. Chang. Biol. 2011, 17, 2084–2094. [Google Scholar] [CrossRef]
- Shaw, J.D.; Steed, B.E.; DeBlander, L.T. Forest Inventory and Analysis (FIA) annual inventory answers the question: What is happening to pinyon-juniper woodlands? J. For. 2005, 103, 280–285. [Google Scholar]
- Woodall, C.W.; Oswalt, C.M.; Westfall, J.A.; Perry, C.H.; Nelson, M.D.; Finley, A.O. An indicator of tree migration in forests of the eastern United States. For. Ecol. Manag. 2009, 257, 1434–1444. [Google Scholar] [CrossRef]
- Lamprecht, A.; Semenchuk, P.R.; Steinbauer, K.; Winkler, M.; Pauli, H. Climate change leads to accelerated transformation of high-elevation vegetation in the central Alps. New Phytol. 2018, 220, 447–459. [Google Scholar] [CrossRef]
- Tchebakova, N.M.; Parfenova, E.I.; Soja, A.J. Potential climate-induced vegetation change in Siberia in the 21st century. In Environmental Change in Siberia; Baltzer, H., Ed.; Springer: Dordrecht, The Netherlands, 2010; pp. 67–82. [Google Scholar]
- Davis, M.B. Lags in vegetation response to greenhouse warming. Clim. Chang. 1989, 15, 75–82. [Google Scholar] [CrossRef]
- Davis, M.B.; Shaw, R.G. Range Shifts and Adaptive Responses to Quaternary Climate Change. Science 2001, 292, 673–679. [Google Scholar] [CrossRef]
- Aitken, S.N.; Yeaman, S.; Holliday, J.A.; Wang, T.; Curtis-McLane, S. Adaptation, migration or extirpation: Climate change outcomes for tree populations. Evol. Appl. 2008, 1, 95–111. [Google Scholar] [CrossRef]
- Rehfeldt, G.E.; Wykoff, W.R.; Ying, C.C. Physiologic Plasticity, Evolution, and Impacts of a Changing Climate on Pinus contorta. Clim. Chang. 2001, 50, 355–376. [Google Scholar] [CrossRef]
- Morgenstern, E.K. Geographic Variation in Forest Trees; UBC Press: Vancouver, BC, Canada, 1996. [Google Scholar]
- Grime, J.P. Plant Strategies and Vegetation Processes; John Wiley and Sons: Hoboken, NJ, USA, 1979. [Google Scholar]
- Loehle, C. Height Growth Rate Tradeoffs Determine Northern and Southern Range Limits for Trees. J. Biogeogr. 1998, 25, 735–742. [Google Scholar] [CrossRef]
- Rehfeldt, G.E. Microevolution of conifers in the northern Rocky Mountains: A view from common gardens. In Proceedings of the Eighth North American Forest Biology Workshop, Logan, UT, USA, 30 July–1 August 1984; pp. 32–46. [Google Scholar]
- Rehfeldt, G.E. Evolutionary genetics, the biological species and the ecology of the interior cedar-hemlock forests. In Proceedings of the Symposium: Interior Cedar-Hemlock-White Pine Forests: Ecology and Management, Spokane, WA, USA, 2–4 March 1993; Baumgartner, D.M., Lotan, J.E., Tonn, J.R., Eds.; Department of Natural Resources, Washington State University: Pullman, WA, USA, 1994; pp. 91–100. [Google Scholar]
- Leites, L.P.; Rehfeldt, G.E.; Steiner, K.C. Adaptation to climate in five eastern North America broadleaf deciduous species: Growth clines and evidence of the growth-cold tolerance trade-off. Perspect. Plant Ecol. Evol. Syst. 2019, 37, 64–72. [Google Scholar] [CrossRef]
- Rehfeldt, G.E.; Leites, L.P.; St. Clair, J.B.; Jaquish, B.C.; Sáenz-Romero, C.; López-Upton, J.; Joyce, D.G. Comparative genetic responses to climate in the varieties of Pinus ponderosa and Pseudotsuga menziesii: Clines in growth potential. For. Ecol. Manag. 2014, 324, 138–146. [Google Scholar] [CrossRef]
- Tchebakova, N.M.; Rehfeldt, G.E.; Parfenova, E.I. Impacts of climate change on the distribution of Larix spp. and Pinus sylvestris and their climatypes in Siberia. Mitig. Adapt. Strateg. Glob. Chang. 2006, 11, 861–882. [Google Scholar] [CrossRef]
- Rehfeldt, G.E.; Tchebakova, N.M.; Parfenova, E.I.; Pandalai, S.G. Genetic responses to climate and climate-change in conifers of the temperate and boreal forests. Recent Res. Dev. Genet Breed 2004, 1, 113–130. [Google Scholar]
- Turesson, G. The genotypical response of the plant species to the Habitat. Hereditas 1922, 3, 211–350. [Google Scholar] [CrossRef]
- Mátyás, C. Adaptation lag: A general feature of natural populations. (Invited lecture). In Proceedings of the WFGA-IUFRO Symposium, Olympia, WA, USA, 20–25 August 1990; No. 2.226. 10p. [Google Scholar]
- Rehfeldt, G.E.; Ying, C.C.; Spittlehouse, D.L.; Hamilton, D.A. Genetic responses to climate in Pinus contorta: Niche breadth, climate change, and reforestation. Ecol. Monogr. 1999, 69, 375–407. [Google Scholar] [CrossRef]
- Rehfeldt, G.E.; Tchebakova, N.M.; Parfenova, Y.I.; Wykoff, W.R.; Kuzmina, N.A.; Milyutin, L.I. Intraspecific responses to climate in Pinus sylvestris. Glob. Chang. Biol. 2002, 8, 912–929. [Google Scholar] [CrossRef]
- Betancourt, J.L. Late Quaternary Biogeography of the Colorado Plateau. In Packrat Middens, the Last 40,000 Years of Biotic Change; Betancourt, J.L., Van Devender, T.R., Martin, P.S., Eds.; Univ. Arizona Press: Tucson, AZ, USA, 1990; pp. 259–302. [Google Scholar]
- Millar, C.I.; Stephenson, N.L.; Stephens, S.L. Climate change and forests of the future: Managing in the face of uncertainty. Ecol. Appl. 2007, 17, 2145–2151. [Google Scholar] [CrossRef]
- Keenan, R.J. Climate change impacts and adaptation in forest management: A review. Ann. For. Sci. 2015, 72, 145–167. [Google Scholar] [CrossRef]
- Yousefpour, R.; Jacobsen, J.B.; Thorsen, B.J.; Meilby, H.; Hanewinkel, M.; Oehler, K. A review of decision-making approaches to handle uncertainty and risk in adaptive forest management under climate change. Ann. For. Sci. 2012, 69, 1–15. [Google Scholar] [CrossRef]
- Wang, T.; Campbell, E.M.; O’Neill, G.A.; Aitken, S.N. Projecting future distributions of ecosystem climate niches: Uncertainties and management applications. For. Ecol. Manag. 2012, 279, 128–140. [Google Scholar] [CrossRef]
- Elith, J.; Leathwick, J.R. Species distribution models: Ecological explanation and prediction across space and time. Annu. Rev. Ecol. Evol. Syst. 2009, 40, 677–697. [Google Scholar] [CrossRef]
- Iverson, L.; Prasad, A.; Matthews, S. Modeling potential climate change impacts on the trees of the northeastern United States. Mitig. Adapt. Strateg. Glob. Chang. 2008, 13, 487–516. [Google Scholar] [CrossRef]
- Gómez-Pineda, E.; Sáenz-Romero, C.; Ortega-Rodríguez, J.M.; Blanco-García, A.; Madrigal-Sánchez, X.; Lindig-Cisneros, R.; Lopez-Toledo, L.; Pedraza-Santos, M.E.; Rehfeldt, G.E. Suitable climatic habitat changes for Mexican conifers along altitudinal gradients under climatic change scenarios. Ecol. Appl. 2020, 30, e02041. [Google Scholar] [CrossRef]
- Aubry, C.; Devine, W.; Shoal, R.; Bower, A.; Miller, J.; Maggiulli, N. Climate Change and Forest Biodiversity: A Vulnerability Assessment and Action Plan for National Forests in Western Washington; US Department of Agriculture, Forest Service, Pacific Northwest Region: Olympia, WA, USA, 2011.
- Daubenmire, R.; Daubenmire, J.B. Forest Vegetation of Eastern Washington and Northern Idaho; Technical Bulletin 6; Washington State University: Pullman, WA, USA, 1968; p. 104. [Google Scholar]
- Daubenmire, R. Vegetation: Identification of typal communities. Science 1966, 151, 291–298. [Google Scholar] [CrossRef]
- Rehfeldt, G.E.; Ferguson, D.E.; Crookston, N.L. Quantifying the abundance of co-occurring conifers along inland northwest (USA) climate gradients. Ecology 2008, 89, 2127–2139. [Google Scholar] [CrossRef]
- Rehfeldt, G.E. Ecological adaptations in Douglas-Fir (Pseudotsuga menziesii var. glauca): A Synthesis. For. Ecol. Manag. 1989, 28, 203–215. [Google Scholar] [CrossRef]
- Rehfeldt, G.E. Ecological Genetics of Pinus contorta: A synthesis. Silvae Genet. 1988, 37, 131–135. [Google Scholar]
- Rehfeldt, G.E. A model of genetic variation for Pinus ponderosa in the Inland Northwest (USA): Applications in gene resource management. Can. J. For. Res. 1991, 21, 1491–1500. [Google Scholar] [CrossRef]
- Rehfeldt, G.E. Adaptation of Picea engelmannii populations to the heterogeneous environments of the Intermountain West. Can. J. Bot. 1994, 72, 1197–1208. [Google Scholar] [CrossRef]
- Rehfeldt, G.E. Genetic variation, climate models and the ecological genetics of Larix occidentalis. For. Ecol. Manag. 1995, 78, 21–37. [Google Scholar] [CrossRef]
- Warwell, M.V.; Shaw, R.G. Climate-related genetic variation in a threatened tree species, Pinus albicaulis. Am. J. Bot. 2017, 104, 1205–1218. [Google Scholar] [CrossRef] [PubMed]
- Bower, A.D.; Aitken, S.N. Ecological genetics and seed transfer guidelines for Pinus albicaulis (Pinaceae). Am. J. Bot. 2008, 95, 66–76. [Google Scholar] [CrossRef]
- Rehfeldt, G.E. Genetic structure of western red cedar populations in the Interior West. Can. J. For. Res. 1994, 24, 670–680. [Google Scholar] [CrossRef]
- Rehfeldt, G.E. Ecotypic differentiation in populations of Pinus monticola in north Idaho—Myth or reality? Am. Nat. 1979, 114, 627–636. [Google Scholar] [CrossRef]
- Mátyás, C. Modeling climate change effects with provenance test data. Tree Physiol. 1994, 14, 797–804. [Google Scholar] [CrossRef]
- Rehfeldt, G.E.; Leites, L.P.; Joyce, D.G.; Weiskittel, A.R. Role of population genetics in guiding ecological responses to climate. Glob. Chang. Biol. 2018, 24, 858–868. [Google Scholar] [CrossRef]
- Mátýas, C.; Yeatman, C.W. Effect of geographical transfer on growth and survival of jack pine (Pinus banksiana Lamb.) populations. Silvae Genet. 1992, 41, 370–376. [Google Scholar]
- Rehfeldt, G.E.; Tchebakova, N.M.; Milyutin, L.I.; Parfenova, E.I.; Wykoff, W.R.; Kouzmina, N.A. Assessing population responses to climate in Pinus sylvestris and Larix spp. of Eurasia with climate-transfer models. Eurasian J. For. Res. 2003, 6, 83–98. [Google Scholar]
- Namkoong, G. Nonoptimality of local races. In Proceedings of the 10th Southern Forest Tree Improvement Conference, College Station, TX, USA, 17–19 June 1969; pp. 149–153. [Google Scholar]
- Schmidtling, R.C. Use of provenance tests to predict response to climatic change: Loblolly pine and Norway spruce. Tree Physiol. 1994, 14, 805–817. [Google Scholar] [CrossRef] [PubMed]
- Carter, K.K. Provenance tests as Indicators of growth response to climate change in 10 north temperate tree species. Can. J. For. Res. 1996, 26, 1089–1095. [Google Scholar] [CrossRef]
- Jackson, S.T.; Overpeck, J.T. Responses of plant populations and communities to environmental changes of the late Quaternary. Paleobiology 2000, 26, 194–220. [Google Scholar] [CrossRef]
- Williams, J.W.; Jackson, S.T. Novel climates, no-analog communities, and ecological surprises. Paleoecology 2007, 5, 475–482. [Google Scholar] [CrossRef]
- Rehfeldt, G.E.; Crookston, N.L.; Warwell, M.V.; Evans, J.S. Empirical analyses of plant-climate relationships for the western United States. Int. J. Plant Sci. 2006, 167, 1123–1150. [Google Scholar] [CrossRef]
- Rehfeldt, G.E.; Crookston, N.L.; Sáenz-Romero, C.; Campbell, E.M. North American vegetation model for land-use planning in a changing climate: A solution to large classification problems. Ecol. Appl. 2012, 22, 119–141. [Google Scholar] [CrossRef]
- Kirtman, B.; Power, S.B.; Adedoyin, A.J.; Boer, G.J.; Bojariu, R.; Camilloni, I.; Doblas-Reyes, F.; Fiore, A.M.; Kimoto, M.; Meehl, G.; et al. Near-term climate change: Projections and predictability. In Climate Change 2013: The Physical Science Basis. The Working Group I Contribution to the Fifth Assessment Report of the Intergovernmental Panel on Climate Change; Cambridge University Press: Cambridge, UK; Cambridge, MA, USA, 2013; Volume 9781107057, pp. 953–1028. [Google Scholar]
- Jackson, S.T.; Betancourt, J.L.; Booth, R.K.; Gray, S.T. Ecology and the ratchet of events: Climate variability, niche dimensions, and species distributions. Proc. Natl. Acad. Sci. USA 2009, 106, 19685–19692. [Google Scholar] [CrossRef]
- Körner, C. Alpine Treelines. Functional Ecology of the Global High Elevation Tree Limits, 1st ed.; Springer: Basel, Switzerland, 2012; ISBN 978-3-0348-0395-3. [Google Scholar]
- Matteodo, M.; Wipf, S.; Stöckli, V.; Rixen, C.; Vittoz, P. Elevation gradient of successful plant traits for colonizing alpine summits under climate change. Environ. Res. Lett. 2013, 8, 024043. [Google Scholar] [CrossRef]
- Stöckli, V.; Wipf, S.; Nilsson, C.; Rixen, C. Using historical plant surveys to track biodiversity on mountain summits. Plant Ecol. Divers. 2012, 4, 415–425. [Google Scholar] [CrossRef]
- Grabherr, G.; Gottfried, M.; Pauli, H. Climate effects on mountain plants. Nature 1994, 369, 448. [Google Scholar] [CrossRef]
- Rehfeldt, G.E.; Jaquish, B.C.; Sáenz-Romero, C.; Joyce, D.G.; Leites, L.P.; St. Clair, J.B.; López-Upton, J. Comparative genetic responses to climate in the varieties of Pinus ponderosa and Pseudotsuga menziesii: Reforestation. For. Ecol. Manag. 2014, 324, 147–157. [Google Scholar] [CrossRef]
- Keiter, R.; Boling, T.; Milkman, L. Legal perspectives on ecosystem management: Legitimizing a new federal land management policy. In Ecological Stewardship, A Common Reference for Ecosystem Management, Volume III; Sexton, W.T., Malk, A.J., Szaro, R.C., Johnson, N.C., Eds.; Elsevier Science Ltd.: Kidlington, UK, 1999; pp. 9–41. [Google Scholar]


Publisher’s Note: MDPI stays neutral with regard to jurisdictional claims in published maps and institutional affiliations. |
© 2020 by the authors. Licensee MDPI, Basel, Switzerland. This article is an open access article distributed under the terms and conditions of the Creative Commons Attribution (CC BY) license (http://creativecommons.org/licenses/by/4.0/).