Article

An Assessment of the Spatial Variability of Tropical Swamp Forest along a 300 km Long Transect in the Usumacinta River Basin, Mexico

by
Rubén Martínez-Camilo
1,†,
José Alberto Gallardo-Cruz
2,*,
Jonathan V. Solórzano
1,‡,
Candelario Peralta-Carreta
1,§,
Derio Antonio Jiménez-López
1,‖,
Ofelia Castillo-Acosta
3,
Miguelina Sánchez-González
1 and
Jorge A. Meave
4
1
Centro del Cambio Global y la Sustentabilidad A. C., Villahermosa 86080, Tabasco, Mexico
2
Centro Transdisciplinar Universitario para la Sustentabilidad, Universidad Iberoamericana, Mexico City 01219, Mexico
3
División Académica de Ciencias Biológicas, Universidad Juárez Autónoma de Tabasco, Villahermosa 86150, Tabasco, Mexico
4
Departamento de Ecología y Recursos Naturales, Facultad de Ciencias, Universidad Nacional Autónoma de México, Coyoacán, Mexico City 04510, Mexico
*
Author to whom correspondence should be addressed.
Present address: Coordinación de Villa Corzo, Facultad de Ingeniería, Universidad de Ciencias y Artes de Chiapas, Villa Corzo 30520, Chiapas, Mexico.
Present address: Centro de Investigaciones en Geografía Ambiental, Universidad Nacional Autónoma de México, Morelia 58190, Michoacán, Mexico.
§
Present address: División Académica de Ciencias Biológicas, Universidad Juárez Autónoma de Tabasco, Villahermosa 86150, Tabasco, Mexico.
Present address: Departamento de Conservación de la Biodiversidad, El Colegio de la Frontera Sur, San Cristóbal de las Casas 29290, Chiapas, Mexico.
Forests 2020, 11(12), 1238; https://doi.org/10.3390/f11121238
Submission received: 23 October 2020 / Revised: 20 November 2020 / Accepted: 20 November 2020 / Published: 24 November 2020
(This article belongs to the Section Forest Ecology and Management)

Abstract

:
The provision of valuable ecosystem services by tropical swamp forests (mainly carbon sequestration and storage in biomass and soil) explains their ecological importance. Current efforts toward the conservation of these ecosystems, however, face strong limitations as their spatial variation is largely unknown, particularly in regions where they occur over large areas. Here, we analyze the α-diversity (i.e., effective number of species or true diversity) and community structure variability of three tropical swamp forest communities distributed along an approximately 300 km long portion of the Usumacinta River Basin, southern Mexico. We sampled eighty-three 625-m2 plots to characterize the diversity and structural attributes of the woody plant communities. We recorded 2302 individuals belonging to 60 species and 25 families. Both α-diversity and structural attributes differed significantly among the three communities. The most inland community stood out for having the highest α-diversity for three true diversity values. Interestingly, the mangrove Rhizophora mangle L. was one of the dominant species, both in the swamp forest located closest to the coast and in the community farthest away from the sea. Basal area and density of individuals also had their maxima in the most inland swamp forest. The diversity and structural differences observed among the examined swamp forests seem to be related to contrasting environmental conditions, such as water salinity, distance to the coastline, and the hydrological dynamics of the Usumacinta River. We emphasize the urgency to conserve R. mangle populations in the swamp forest located farthest away from the coast due to its unusual habitat association, which appears to be a relictual condition.

1. Introduction

Wetlands are important ecosystems that provide valuable environmental services (mainly carbon sequestration and storage in biomass and soil) and host high biodiversity [1,2,3,4,5]. This ecosystem type is characterized by the (almost) permanent presence of water-saturated soils [1]. Despite this common feature, wetlands comprise a large suite of plant communities, ranging from those dominated by herbs and shrubs to those where trees are the prevailing structural component [1,4].
Among the tree-dominated wetland plant communities, the tropical swamp forest is one of the most important and representative forms, as well as one of the most heterogeneous both in terms of floristic composition and structure [5,6]. Such heterogeneity is reflected across spatial scales [7] and has been related to variations in hydrological conditions (i.e., flood regime), chemical and physical water properties (e.g., salinity), soil attributes (e.g., organic matter content), and the relief of the terrain where they occur [6,7,8,9]. Most studies that have analyzed the variation of tropical swamp forest attributes have focused on coastal forests dominated by Rhizophora mangle L. and usually evaluate the effects of local environmental conditions on certain forest attributes (e.g., [9,10,11,12,13,14,15,16,17]). Such bias has resulted in substantial knowledge gaps regarding the magnitude and nature of the spatial variation of these forests across their large geographical range, and more importantly, its underlying causes.
The Usumacinta River Basin hosts the largest area of coastal and continental wetlands in Mesoamerica, including a large share of tropical swamp forests, mainly in the lower sector of the basin [18,19]. The Usumacinta is one of the largest sources of freshwater being discharged into the Gulf of Mexico, second only to the Mississippi River [20]. Within the Usumacinta River Basin, tropical swamp forests are mainly concentrated across extensive areas near the coastline, but they also occur further inland on the banks of the Usumacinta and its main tributaries [21]. The wide distribution of tropical swamp forests in this region, particularly the large gradient of distances to the sea encompassed within its geographic range, provides an ideal scenario to examine the spatial variability of community attributes, and to attempt to gain new insights on the environmental factors responsible for such heterogeneity. To this end, we focused on three representative communities located at increasing distances from the coast along the Usumacinta or its tributaries. Previous studies examined the spatial variation of wetland forest in this region in a much smaller area [22,23], but no attempt has been made to scale up this analysis to sites separated by hundreds of kilometers. Wetland forest literature provides much evidence for environmental effects related to the vicinity of the sea, in particular intrusion of seawater salinity, intense tidal regimes, and even disturbance from frequent coastal climatic phenomena (e.g., [9,13,14,15,16,24]). Yet, forests located far away from the coastline are clearly not influenced by the sea in any way, rather, they are subjected to particular hydrological regimes determined by the natural dynamics of rivers and the climatic seasonality (i.e., yearly precipitation patterns) across the basin. For these reasons, we anticipated that swamp forests across this large geographic range should display a larger heterogeneity than that observed in more restricted areas closer to the sea, in particular that reported by Chávez et al. [22] and Solórzano et al. [23] in the same area.
We emphasize that the knowledge on the heterogeneity of tropical swamp forest attributes is crucial for informing conservation strategies and supporting their proper management [23]. Therefore, our goal was to assess the spatial variation of community attributes of three tropical swamp forest communities distributed over a 300-km long sector of the lower Usumacinta River Basin in the Gulf of Mexico Coastal Plain, Mexico. We focused on the characterization of diversity and structural attributes in three communities: (1) a coastal tropical swamp forest dominated by R. mangle; (2) a tropical swamp forest associated to a lagoon complex fed by the frequent raisings and overflows of the Usumacinta River; and (3) the tropical swamp forest of the San Pedro River, a major tributary of the Usumacinta that joins it in the final part of its course. This latter community bears particular relevance, given the presence of R. mangle in an area that is more than 300 km away from the coastline. Hence, a further objective of this study was to provide the first quantitative description of this community, as well as to assess how distinctly different it is relative to the other tropical swamp forests occurring in the region.

2. Materials and Methods
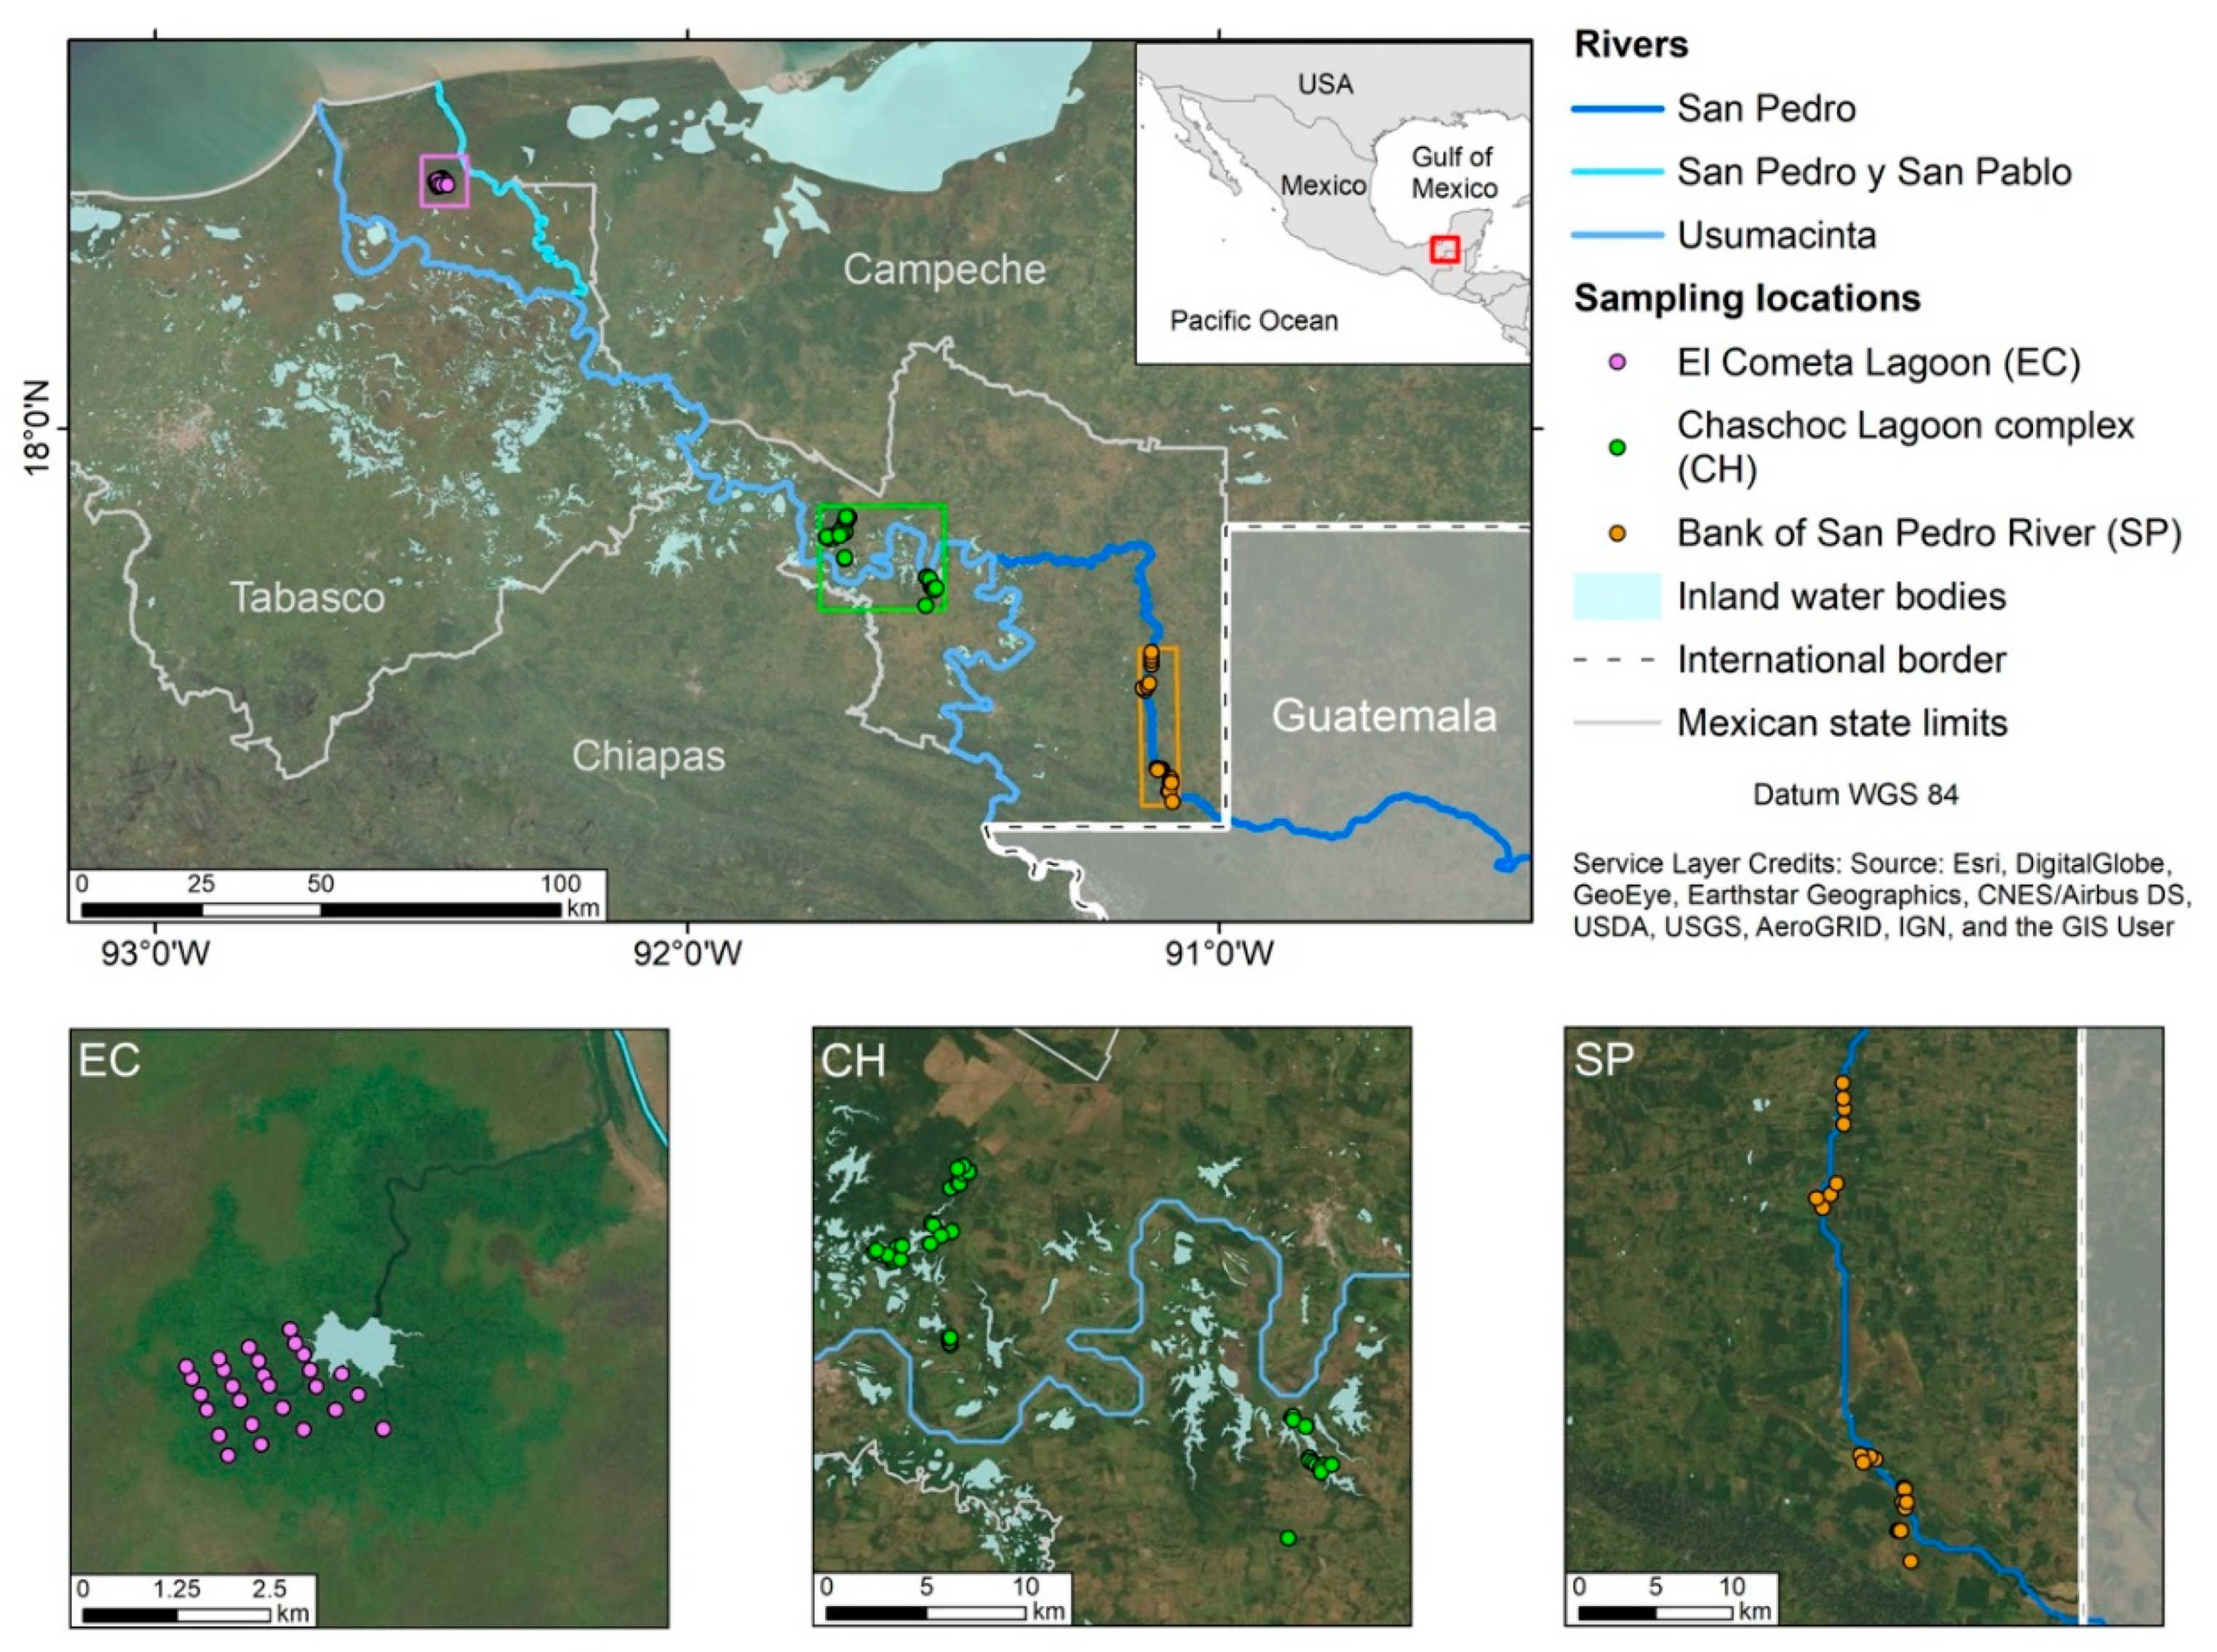
2.1. Study Area

The study was conducted in the lower Usumacinta Basin (Figure 1). As a whole, the Usumacinta Basin is a naturally defined region stretching over 7 million hectares that includes a broad range of landscapes, from the cold Guatemalan Highlands in the Cuchumatanes region, where the headwaters of this complex fluvial network are located, down to the discharge zone in the Gulf of Mexico [25]. In the basin, three sectors (low, middle, and high) can be distinguished according to topographic, geomorphological, and hydrological features [25]. The lower sector corresponds to the region where the main rivers approach the Mexican coastline of the Gulf of Mexico; this sector is predominantly a discharge zone that encompasses extensive continental wetlands of the San Pedro river in Guatemala, along with large wetland areas across the deltaic plain of the Usumacinta in Mexico. This coastal region boasts the largest diversity of aquatic plants in Mesoamerica [26,27,28].
In this sector of the basin, we selected three sites along the course of the Usumacinta River and its tributary or distributary rivers. Each of these sites is representative of the most contrasting environmental conditions prevailing in the lower Usumacinta Basin regarding flooding regime, water properties, and substrates. These sites were (1) El Cometa Lagoon (EC), located in the vicinity of the San Pedro y San Pablo river and connected to it by a short canal; (2) the Chaschoc Lagoon complex (CH), located along the Usumacinta River; and (3) the inland bank of the San Pedro River (SP). EC is located in the Gulf of Mexico coastal plain within the Pantanos de Centla Biosphere Reserve, where the most extensive and best-preserved tracts of Rhizophora mangle-dominated forests can be found in the basin. This forest community thrives in an almost permanently flooded condition. The most striking environmental feature in this latter area is the recurrent intrusion of a salt wedge that produces periodic changes in water salinity, in addition to very deep (>2 m) organic soils [29]. In turn, CH lies approximately 100 km away from the coast, in an area where the course of the Usumacinta is characterized by very wide meanders, along with a multitude of associated oxbow lakes of different shapes and sizes; most of these dry out seasonally and they only fill up when the river overflows and the water leaves its channel, creating a water column several meters in depth [30]. The substrate in this area is characterized by clayey soils and the accumulation of large volumes of sediment. Finally, SP is located much further inland, some 200 km in a straight line from the coast and around 300 km along the meandering course of the Usumacinta; at this site, swamp forest patches occur on river banks that are permanently flooded. For this region of limestone bedrock, there are earlier reports of the presence of isolated, relictual populations of R. mangle, which is clearly an ecological and geographical anomaly for this species [31].

2.2. Data Collection

We used a total of eighty-three 625-m2 (25 × 25 m) plots to characterize the tropical swamp forest; all plots were georeferenced with a GPS receiver (TrimbleGEO7). The plot distribution per community was EC = 27 plots, CH = 35 plots, SP = 21 plots. In each plot, we recorded all woody plants with a diameter at breast height (DBH) ≥ 10 cm. For each plant, we measured DBH with a diameter tape and maximum height with a Sndway SW-E80 range finder or a Vertex (Laser Technology TruPulse 200, Dongguan Sndway Co., Ltd., Dongguan, China). Although we tried to determine the taxonomic identity of every individual to species level, this was not always possible, and thus we recognized these entities as morphospecies. All names were verified and updated according to The Plant List database (http://www.theplantlist.org/).

2.3. Analysis

In order to compare α-diversity among sites, we calculated the effective number of species using the Hill numbers approach. Hill numbers allow for the determination of the sensitivity of effective species richness (D) to species’ relative abundances (q) [32]. The three diversity orders calculated were order zero true diversity (0D), which is the absolute species richness; first order diversity (1D), which represents the number of abundant species (calculated as the exponential of Shannon’s Index); and second order diversity (2D), which is interpreted as the number of dominant species (calculated as the inverse of Simpson’s index) [32]. Given the differences in tree density between communities, the data were standardized by rarefaction before calculating the effective numbers of species [33,34]. To assess the significance of the differences in 0D, 1D, and 2D among communities, we calculated 95% confidence intervals for species accumulation curves through bootstrapping [35]. Additionally, for each community, we constructed a rank abundance curve to examine the abundance patterns of species and to ultimately identify the dominant species in each community.
We based the structural description of the three communities on three variables: (i) density of individuals; (ii) basal area, calculated as the sum of the individual basal area values in the plot; and (iii) community canopy height, calculated as the mean height of the ten tallest trees recorded in the plot [36]. Basal area for each stem was approximated to the area of a circle with radius equal to DBH divided by 2. Density of individuals and basal area values were scaled to 1 ha.
We analyzed the differences among the three communities’ structural attributes through analysis of variance (ANOVA), after verification of normality of residuals. When significant, we then conducted post hoc pairwise Tukey tests. In all analyses, we used α = 0.05 as the significance threshold. All analyses were conducted in R version 4.0.2 [37]; for diversity analyses, we used the iNEXT package [35].

3. Results

3.1. Overall Community Characterization

We recorded a total of 2302 woody individuals that represented 60 species and 25 families (Table 1). Leguminosae was the most speciose family (13 species), well above the following nine families, each one represented by two species only; all the remaining families were represented by a single species each (Table 1). Notable species given their high abundances across sites were Pachira aquatica Aubl. (430 individuals), Haematoxylum campechianum L. (316), Terminalia buceras (L.) C.Wright (299), Rhizophora mangle L. (241), and Salix humboldtiana Willd. (183) (Table 1). These five species alone accounted for 63.8% of all sampled individuals. We detected 12 species represented by 1 individual only (singletons).
SP was the community hosting the largest richness (58% of all species), in strong contrast with EC, which was the most species-poor community (eight species, or 13% of the total; Table 2). On the other hand, CH was the community hosting the largest diversity at the family level, slightly higher than that observed in SP (19 vs. 16 families, respectively). Furthermore, in EC, six families were recorded, among which only Combretaceae was represented by two species. Regarding density of individuals, SP ranked first (44.4 ± 17.8 individuals), while CH ranked second (23.9 ± 16.5 individuals), and EC ranked third (19.8 ± 8.0 individuals). The sampling effort for the three sites was insufficient according to the rarefied species accumulation curve (Figure 2). For CH and SP communities, this situation was particularly evident (Figure 3).

3.2. Diversity and Dominance

SP was the community with the highest α-diversity according to the three true diversity values, although the values differed depending on the relative contribution of species abundances (Figure 4). According to 0D, SP (37 species) and CH (36 species) were not significantly different (Figure 4a) from each other, but both differed significantly from EC (10 species). Regarding 1D, SP was significantly higher than both EC and CH (Figure 4b). Finally, the differences became attenuated after considering the effect of dominant species; for 2D, SP (6.3 species) and CH (5.3 species) did not differ significantly, whilst EC was significantly lower that the former two communities (4.4 species; Figure 4c).
The rank abundance curves of CH and SP showed a similar pattern, which consisted in a gradual reduction in the abundance of the most frequent species, as well as a good share of singletons and doubletons (Figure 5b,c, respectively). Singletons and doubletons are important community components in SP and CH, with 14 and 10 species, respectively, all of which occurred exclusively in one community. The pattern observed in EC was notably different, as half of the few species recorded here were very abundant (Figure 5a). Importantly, the identities of the most abundant species differed between sites. Although EC and SP hosted more species in common, their composition differed greatly from CH. In EC, the most abundant species were, in decreasing order (Figure 5a), R. mangle, T. buceras, and P. aquatica; in CH, H. campechianum, S. humboldtiana, and Zygia conzatti had the highest abundances (Figure 5b); lastly, for SP, the group of abundant species comprised P. aquatica, T. buceras, and Lonchocarpus hondurensis. Notably, in this inland site, R. mangle ranked fourth in terms of abundance (Figure 5c).

3.3. Forest Structure

The structural attributes evaluated differed considerably among the three communities. The largest community basal area values were recorded at SP (mean = 28.84 m2 ha−1) and CH (27.03 m2 ha−1). These two mean values differed significantly from that recorded at EC (mean = 17.27 m2 ha−1; p < 0.05; Figure 6a). On the other hand, SP had the largest density of individuals (710 ind. ha−1), a value more than twice as large as those recorded in EC and CH (317.04 and 381.71 ind. ha−1, respectively; p < 0.05; Figure 6b). Similarly, for canopy height, we found significant differences among sites (p < 0.05; Figure 6c), with EC having the tallest mean canopy height (15.1 m).
Woody plant species contributed differentially to the structural attributes of the three communities (Table 3). Species with the largest contributions were R. mangle and T. buceras in EC, H. campechianum in CH, and T. buceras and P. aquatica in SP. Notably, R. mangle made the largest contributions to basal area and tree density. The tallest species recorded in the study (i.e., those species attaining heights >15 m) were R. mangle at EC, and Enterolobium cyclocarpum and Cedrela odorata at CH; in fact, some trees of the latter species were taller than 30 m. A comparison of mean height for R. mangle between EC and SP revealed that the trees in EC were twice as tall as the tallest trees recorded in SP (8.25 m vs. 17.42 m, respectively; Table 3). The tallest R. mangle trees reached heights around 26 m at EC.

4. Discussion

To our knowledge, this is the first study to examine the variation of α-diversity and structural attributes of three tropical swamp forest communities in the Usumacinta River Basin at a regional level. In addition, this is also the first report of the structure and diversity of a tropical swamp forest with R. mangle located more than 300 km away from the sea. The three swamp forest communities analyzed occur in floodplains, but they differ in their proximity to the coast.

4.1. Diversity and Dominance

Interestingly, EC, the community most closely located to the coastline, had the lowest α-diversity. This result agrees with the frequently reported pattern where plant communities closer to the coast tend to have lower species richness in comparison to communities located further inland [9,10,12,13,16,38,39]. Additionally, communities closer to the coast usually host one or few mangrove species. This pattern has been reported in the regions of Western Africa, Western Atlantic and The Caribbean, and Eastern Pacific [11]. All mangrove species of different genera have morphological and physiological adaptations that enable them to tolerate stressing conditions derived from water saturation and salinity [8,11,40]. In the case of our study, although the EC site was the one closer to the coast, it showed a non-pure mangrove species composition, which suggests that this site can be seen as an ecotone between pure mangrove communities and tropical swamp forest communities [22,23]. This probably explains the difference between the dominant species in EC (R. mangle, T. buceras, and P. aquatica) and those recorded in areas closer to the coast, where in addition to R. mangle, other mangrove species have been reported such as Avicennia germinans and Laguncularia racemosa [22,29,41,42,43]. For the same region, besides water salinity, there is a significant influence of the geomorphological and topograhic variation of the terrain that drives the occurrence of different tree associations in Tabasco’s coastal plain [22,23,42]. This variation results in the presence of highly heterogenous forests across the lower portion of the Usumacinta Basin, particularly within the Pantanos de Centla Biosphere Reserve [42].
Our results show that α-diversity is twice as large in swamp forest communities located far from the coast, which are also more complex in species composition. Moreno-Casasola et al. [6] reported a similar increase in α-diversity with increasing distances to the coast in river bank communities. It has been frequently reported that forest communities are less diverse when they are subjected to high water salinity, in comparison to those under fresh water conditions [6,43]. Moreover, it is important to highlight that tropical swamp forest communities in SP and CH are located in the vicinity of hilly areas where non-flooded tropical forest communities occur; these upland forests may act as sources of propagules of many other species, which explains at least in part the presence of floristic elements from those communities such as Alseis yucatanensis, Calophyllum brasiliense, Manilkara zapota, Tabebuia rosea, and Z. conzattii. Infante-Mata et al. [43] reported a similar finding for floodplain tree communities.
Notably, the most similar communities by floristic composition and species dominance were the most distant ones, i.e., EC and SP, with a good number of shared species between them, mainly R. mangle, T. buceras, P. aquatica, L. hondurensis, and Chrysobalanus icaco. The presence of a R. mangle population in SP continues to be intriguing, given its geographical location, approximately 300 km away from the sea. Actually, we have recorded the presence of R. mangle individuals further inland on the banks of the San Pedro River, closer to the Mexico–Guatemala border. However, we acknowledge that this is not a unique example of this situation; in the USA, the range of this species in some extensive wetland regions (e.g., Everglades National Park, Florida, USA) extends well beyond the limit of the coastlines by dozens of kilometers inland [44,45,46]. Yet, in these cases, distances from the coast are not as large as in the case of the R. mangle population of the San Pedro River. The peculiarity of this community is also related to the presence of mangrove companion species, such as P. aquatica, which also has adventitious roots and physiological adaptations that enable it to grow in flooded conditions but with low salinity [38]. The occurrence of R. mangle in the swamp forest along the San Pedro river has been intermittently mentioned since the second half of the 20th century [31,47,48,49], but we are still lacking an estimate of the time when these populations became isolated from other coastal tropical swamp forests in the region, and ignore how this separation took place.

4.2. Community Structure

Both basal area and density values were higher in those sites further away from the coast. This may be related to the effects of salinity and other environmental variables that create stressing conditions near the sea. These variables play an important role in other flooded forests dominated by mangrove species, where salinity and geomorphology shape the structural attributes of the community [9,14,43,50]. Increasing salinity has also been related to reductions in stem diameter and density of individuals [14,16]. Therefore, the high basal area and density values in CH and SP may be favored by the absence of salt in the water.
Mean canopy height was the only structural attribute for which the community at EC had the highest values (even though the tallest trees were recorded in CH). Overall, mean canopy height in both CH and SP never exceeded 12 m, in strong contrast to the heights recorded at EC. Across all three sites, only 75 trees were taller than 20 m, among which 50 were recorded at EC, most of them being R. mangle. This suggests a considerably more homogeneous canopy height for EC, and ultimately a better developed mature forest, relative to the other study sites. Canopy heights at EC are similar to those reported for other swamp forests dominated by R. mangle [13] or even higher than other communities located in Mexico [9] and in South America [14], but they are considerably shorter than the mangroves located in the Soconusco region (Pacific Coast Plain in Chiapas), which are considered the tallest mangrove communities in Mexico [51,52]. Nevertheless, close to the EC sampling site, along the San Pedro y San Pablo River, higher values of both canopy height and biomass have previously been reported [22]. The heights of R. mangle trees growing on the banks of the SP were always lower than 12 m (mean height = 8.45 m). In general, these are short trees compared with those from other analogue communities in southern Mexico, except for those found in some localities along the coasts of Quintana Roo, Yucatán [7], and Baja California [53,54] states, where dwarfed mangrove forest never reaches heights above 5 m.
Finally, we highlight the importance of comparing two distinct flooded forest communities characterized by the presence of R. mangle in the lower Usumacinta River Basin, each of them having its own diversity and structure. Although certainly the two communities are important for biological conservation and their provision of ecosystem services, we emphasize our concern for the future of the community located on the San Pedro River, given its relictual condition and the extremely small area it occupies, probably < 11 ha [49].

5. Conclusions

The swamp forest communities of the lower Usumacinta Basin exhibit a high structural and diversity heterogeneity across space. Such heterogeneity is determined by multiple environmental factors, among which water salinity and geomorphology seem to be of particular importance, although the ecological neighborhood may also play a considerable role. Most studies that emphasize the importance of swamp forests have focused on communities located in the close vicinity of the river mouths, in areas where large coastal lagoons exist or in saline or brackish environments with high sediment deposition. However, swamp forests located in continental areas distant from the coast have received much less attention, despite the fact that they are also highly threatened, if not more so, by human activities, which has resulted in a worrisome large shrinkage of their original extent. No single tract of the San Pedro flooded forest is currently included in any nature protection area, which makes its conservation even more uncertain.

Author Contributions

R.M.-C., J.A.G.-C., J.V.S., and C.P.-C. designed the study; R.M.-C., J.A.G.-C., J.V.S., C.P.-C., D.A.J.-L., O.C.-A., and M.S.-G. conducted the fieldwork; R.M.-C., J.A.G.-C., and J.V.S. analyzed the results; R.M.-C., J.A.G.-C., J.V.S., and J.A.M. wrote the first version of the article; all authors contributed equally to the final manuscript. All authors have read and agreed to the published version of the manuscript.

Funding

This study was funded by the Mexican Council of Science and Technology (CONACYT, grant FORDECyT 273646) and by the Universidad Iberoamericana 14th DINV grant.

Acknowledgments

Rosa Nejapa Mendoza, Freddi López Pérez, and Mónica Alamilla Landero provided assistance during fieldwork.

Conflicts of Interest

The authors declare no conflict of interest.

References

  1. Bruland, G.L. Coastal wetlands: Function and role in reducing impact of land-based management. In Coastal Watershed Management; Fares, A., El-Kadi, A.I., Eds.; WIT Press: Southampton, UK, 2008; pp. 1–40. [Google Scholar]
  2. Flores-Verdugo, F.J.; Moreno-Casasola, P.; Lanza-Espino, G.; Agraz-Hernández, C. El manglar, otros humedales costeros y el cambio climático. In Vulnerabilidad de las Zonas Costeras Mexicanas Ante el Cambio Climático; Botello, A.V., Villanueva-Fragoso, S., Gutiérrez, J., Rojas-Galaviz, J.L., Eds.; SEMARNAT-INE-Universidad Nacional Autónoma de México-Universidad Autónoma de Campeche: Campeche, Mexico, 2010; pp. 165–188. [Google Scholar]
  3. Piadade, M.T.F.; Ferreira, C.S.; Franco, A.C. Estrategias reproductivas de la vegetación y sus respuestas al pulso de la inundación en las zonas inundables de la Amazonía Central. Ecosistemas 2010, 19, 52–66. [Google Scholar]
  4. Davidson, N.C. How much wetland has the world lost? Long-term and recent trends in global wetland area. Mar. Freshw. Res. 2014, 65, 934–941. [Google Scholar] [CrossRef]
  5. Sasmito, S.D.; Taillardat, P.; Clendenning, J.N.; Cameron, C.; Friess, D.A.; Murdiyarso, D.; Hutley, L.B. Effect of land-use and land-cover change on mangrove blue carbon: A systematic review. Glob. Chang. Biol. 2019, 25, 4291–4302. [Google Scholar] [CrossRef] [PubMed]
  6. Moreno-Casasola, P.; Infante-Mata, D.; López-Rosas, H. Tropical freshwater marshes and swamps of North America. In Wetland habitats of North America: Ecology and Conservation Concerns; Batzer, D., Ed.; University of California Press: Berkeley, CA, USA, 2012; pp. 267–282. [Google Scholar]
  7. López-Portillo, J.; Ezcurra, E. Los manglares de México: Una revisión. Madera Bosques 2002, 8, 27–51. [Google Scholar] [CrossRef] [Green Version]
  8. Duke, N.C.; Ball, M.C.; Ellison, J.C. Factors influencing biodiversity and distributional gradients in mangroves. Glob. Ecol. Biogeogr. Lett. 1998, 7, 27–47. [Google Scholar] [CrossRef] [Green Version]
  9. Campo, J.T.F.; Olvera-Vargas, M.; Figueroa-Rangel, B.L.; Cuevas-Guzmán, R.; Iñiguez-Dávalos, L.I. Patterns of spatial diversity and structure of mangrove vegetation in Pacific West-Central Mexico. Wetlands 2018, 38, 919–931. [Google Scholar]
  10. Schaeffer-Novelli, Y.; Cintrón-Molero, G.; Adamie, R.R.; Camargo, T.M. Variability of mangrove ecosystems along the Brazilian coast. Estuaries 1990, 13, 204–218. [Google Scholar] [CrossRef]
  11. Ricklefs, R.E.; Latham, R.E. Global patterns of diversity in mangrove floras. In Species Diversity in Ecological Communities: Historical and Geographical Perspectives; Ricklefs, R.E., Schluter, D., Eds.; University of Chicago Press: Chicago, IL, USA, 1993; pp. 215–229. [Google Scholar]
  12. Murray, M.R.; Zisman, S.A.; Furley, P.A.; Munro, D.M.; Gibson, J.; Ratter, J.; Bridgewater, S.; Minty, C.D.; Place, C.J. The mangroves of Belize Part 1. distribution, composition and classification. For. Ecol. Manag. 2003, 174, 265–279. [Google Scholar] [CrossRef]
  13. Agraz-Hernández, C.M.; García-Zaragoza, C.; Iriarte-Vivar, S.; Flores-Verdugo, F.J.; Moreno-Casasola, P. Forest structure, productivity and species phenology of mangroves in the La Mancha lagoon in the Atlantic coast of Mexico. Wetl. Ecol. Manag. 2011, 19, 273–293. [Google Scholar] [CrossRef]
  14. Duque-Estrada, G.C.; Gómez-Soares, M.L.; Oliveira-Chavez, F.; Fernández-Cavalcanti, V. Analysis of the structural variability of mangrove forests through the physiographic types approach. Aquat. Bot. 2013, 111, 135–143. [Google Scholar] [CrossRef]
  15. Costa, P.; Dórea, A.; Mariano-Neto, E.; Barros, F. Are there general spatial patterns of mangrove structure and composition along estuarine salinity gradients in Todos os Santos Bay? Estuar. Coast. Shelf Sci. 2015, 166, 83–91. [Google Scholar] [CrossRef]
  16. Gomes-Soares, M.L.; Oliveira-Chaves, F.; Duque-Estrada, G.D.; Fernandez, V. Mangrove forests associated with salt flats: A case study from southeast Brazil. Braz. J. Oceanogr. 2017, 65, 102–115. [Google Scholar] [CrossRef] [Green Version]
  17. Nguyen, L.T.M.; Hoang, H.T.; Ta, H.V.; Park, P.S. Comparison of mangrove stand development on accretion and erosion sites in Ca Mau, Vietnam. Forests 2020, 11, 615. [Google Scholar] [CrossRef]
  18. Mifsut, I.M.; Castro, M. La cuenca del río Usumacinta: Perfil y perspectivas para su conservación y desarrollo sustentable. In Las Cuencas Hidrográficas de México, Diagnóstico y Priorización; Cotler-Ávalos, H., Ed.; SEMARNAT: México City, Mexico, 2010; pp. 193–197. [Google Scholar]
  19. Carabias, J.; Zorrilla, M.; Escobedo, A.H.; Gallardo, A.; Rodríguez, Y.; Fernández, A.I.; Charruau, P.; Martínez, M.; Rodríguez, A. Diagnóstico Integral de la Cuenca Baja del Río Usumacinta en Tabasco; Centro del Cambio Global y La Sustentabilidad A.C.: Villahermosa, Mexico, 2015. [Google Scholar]
  20. Kolb, M.; Galicia, L. Challenging the linear forestation narrative in the Neo-tropic: Regional patterns and processes of deforestation and regeneration in southern Mexico. Geogr. J. 2011, 178, 147–161. [Google Scholar] [CrossRef]
  21. Thom, B.G. Mangrove ecology and deltaic geomorphology: Tabasco, Mexico. J. Ecol. 1967, 55, 301–343. [Google Scholar] [CrossRef]
  22. Chávez, D.; Gallardo-Cruz, J.A.; Solórzano, J.V.; Peralta-Carreta, C.; Enríquez, M.; Meave, J.A. Spatial correlates of floristic and structural variation in a Neotropical wetland forest. Wetl. Ecol. Manag. 2020, 28, 341–356. [Google Scholar] [CrossRef]
  23. Solórzano, J.V.; Gallardo-Cruz, J.A.; Peralta-Carreta, C.; Martínez-Camilo, R.; de Oca, A.F.M. Plant community composition patterns in relation to microtopography and distance to water bodies in a tropical forested wetland. Aquat. Bot. 2020, 167, 103295. [Google Scholar] [CrossRef]
  24. Barba-Macías, E.; Alva-Juárez, M.A.; Calva-Benítez, L.G. Guía Ilustrada para la Identificación de Plantas Acuáticas en Humedales de Tabasco; El Colegio de la Frontera Sur: Villahermosa, Mexico, 2013. [Google Scholar]
  25. De la Maza, J.; Carabias, J. Usumacinta: Bases para una Política de Sustentabilidad Ambiental; Instituto Mexicano de Tecnología del Agua, Natura-Ecosistemas Mexicanos A.C.: Mexico City, Mexico, 2011.
  26. Lot, A.; Novelo, A. El pantano de Tabasco y Campeche: La reserva más importante de plantas acuáticas de Mesoamérica. In Memorias del Simposio Internacional Sobre Ecología y Conservación del Delta de los Ríos Usumacinta y Grijalva; Instituto Nacional de Investigaciones sobre Recursos Bióticos-Gobierno del Estado de Tabasco: Villahermosa, Mexico, 1988; pp. 537–547. [Google Scholar]
  27. Méndez-H, C.A.; Flores, M.C.; Calderón, C.; Hernández, S. Inventario Nacional de los Humedales de Guatemala; UICN Mesoamérica-Consejo Nacional de Áreas Protegidas-Universidad de San Carlos-Corredor Biológico Mesoamericano: San José, Costa Rica, 2001. [Google Scholar]
  28. Novelo, A.; Ramos, L. Vegetación acuática. In Biodiversidad del Estado de Tabasco; Bueno, J., Álvarez, F., Santiago, S., Eds.; Universidad Nacional Autónoma de México-Comisión Nacional para el Conocimiento y Uso de la Biodiversidad: Mexico City, Mexico, 2005; pp. 111–144. [Google Scholar]
  29. Kauffman, J.B.; Hernandez-Trejo, H.; Jesus-García, M.C.; Heider, C.; Contreras, W.M. Carbon stocks of mangroves and losses arising from their conversion to cattle pastures in the Pantanos de Centla, Mexico. Wetl. Ecol. Manag. 2016, 24, 203–216. [Google Scholar] [CrossRef]
  30. Esqueda-Lara, K.; Sánchez, A.J.; Valdés-Lagunes, G.; Salcedo, M.A.; Franco-Torres, A.E.; Florido, R. Fitoplancton en el humedal tropical Chaschoc en la cuenca baja del río Usumacinta. Rev. Mex. Biodivers. 2016, 87, 1177–1188. [Google Scholar] [CrossRef]
  31. West, R.C. The natural vegetation of the Tabascan Lowlands, Mexico. Rev. Geogr. 1966, 64, 108–122. [Google Scholar]
  32. Jost, L. Entropy and diversity. Oikos 2006, 113, 363–375. [Google Scholar] [CrossRef]
  33. Chao, A.; Jost, L. Coverage-based rarefaction and extrapolation: Standardizing samples by completeness rather than size. Ecology 2012, 93, 2533–2547. [Google Scholar] [CrossRef] [PubMed]
  34. Chao, A.; Gotelli, N.J.; Hsieh, T.C.; Sander, E.L.; Ma, K.H.; Colwell, R.K.; Ellison, A.M. Rarefaction and extrapolation with Hill numbers: A framework for sampling and estimation in species diversity studies. Ecol. Monogr. 2014, 84, 45–67. [Google Scholar] [CrossRef] [Green Version]
  35. Hsieh, T.C.; Ma, K.H.; Chao, A. iNEXT: An R package for rarefaction and extrapolation of species diversity (Hill numbers). Methods Ecol. Evol. 2016, 7, 1451–1456. [Google Scholar] [CrossRef]
  36. Salas-Morales, S.H.; González, E.J.; Meave, J.A. Canopy height variation and environmental heterogeneity in the tropical dry forests of coastal Oaxaca, Mexico. Biotropica 2018, 50, 26–38. [Google Scholar] [CrossRef]
  37. R Core Team. R: A Language and Environment for Statistical Computing 2019; R Core Team: Vienna, Austria, 2019. [Google Scholar]
  38. Infante-Mata, D.; Moreno-Casasola, P.; Madero-Vega, C. Pachira aquatica, ¿un indicador del límite del manglar? Rev. Mex. Biodivers. 2014, 85, 143–160. [Google Scholar] [CrossRef]
  39. Castillo-Elías, B.; Gervacio-Jiménez, H.; Bedolla-Solano, R. Estructura forestal de una zona de manglar en la laguna de Coyuca de Benítez, Guerrero. Rev. Mex. Cienc. For. 2018, 9, 66–93. [Google Scholar] [CrossRef] [Green Version]
  40. Duke, N.C. Mangrove floristics and biogeography. In Coastal and Stuarine Studies Series; Robertson, A.I., Alongi, D.M., Eds.; American Geophysical Union: Washington, DC, USA, 1992; pp. 63–100. [Google Scholar]
  41. Torres, J.R.; Barba, E.; Choix, F.J. Mangrove productivity and phenology in relation to hydroperiod and physical–chemistry properties of water and sediment in Biosphere Reserve; Centla Wetland, Mexico. Trop. Conserv. Sci. 2018, 11, 1–14. [Google Scholar] [CrossRef]
  42. Secretaría de Medio Ambiente, Recursos Naturales y Pesca [SEMARNAP]. Programa de Manejo de la Reserva de la Biosfera Pantanos de Centla; Instituto Nacional de Ecología: Mexico City, Mexico, 2000.
  43. Infante-Mata, D.; Moreno-Casasola, P.; Madero-Vega, C.; Castillo-Campos, G.; Warner, B.G. Floristic composition and soil characteristics of tropical freshwater forested wetlands of Veracruz on the coastal plain of the Gulf of Mexico. For. Ecol. Manag. 2011, 262, 1514–1531. [Google Scholar] [CrossRef]
  44. Spalding, M.D.; Blasco, F.; Field, C.D. World Mangrove Atlas; The International Society for Mangrove Ecosystems: Okinawa, Japan, 1997. [Google Scholar]
  45. US Fish and Wildlife Service. South Florida Multi-Species Recovery Plan; U.S. Fish and Wildlife Service: Atlanta, GA, USA, 1999.
  46. Yáñez-Arancibia, A.; Lara-Domínguez, A.L. Ecosistemas de Manglar en América Tropical; Instituto de Ecología A.C.: Xalapa, México, 1999. [Google Scholar]
  47. Burnham, R.J. Relationships between standing vegetation and leaf litter in a paratropical forest: Implications for paleobotany. Rev. Palaeobot. Palynol. 1989, 58, 5–32. [Google Scholar] [CrossRef]
  48. Comisión Nacional para el Conocimiento y Uso de la Biodiversidad [CONABIO]. Manglares de México: Extensión y Distribución; Comisión Nacional para el Conocimiento y Uso de la Biodiversidad: Mexico City, Mexico, 2009.
  49. Estrada-Loreto, F. Indicadores Ecológicos de la Zona Riparia del San Río Pedro, Tabasco, México. Master’s Thesis, El Colegio de La Frontera Sur, Villahermosa, Mexico, 2011. [Google Scholar]
  50. González-Zamorano, P.; Lluch-Cota, S.E.; Nava-Sánchez, E.H. Relation between the structure of mangrove forests and geomorphic types of lagoons of the Baja California Peninsula. J. Coast. Res. 2013, 29, 173–181. [Google Scholar]
  51. Tovilla-Hernández, C.; Romero-Berny, E. Diagnóstico estructural de los manglares de Chiapas y Oaxaca. In Recursos Acuáticos Costeros del Sureste; Sánchez, A.J., Chiappa-Carrara, X., Brito-Pérez, R., Eds.; Universidad Nacional Autónoma de México: Merida, Mexico, 2012; Volume 1, pp. 257–279. [Google Scholar]
  52. Romero-Berny, E.I.; Tovilla-Hernández, C.; Torrescano-Valle, N.; Schmook, B. Heterogeneidad estructural del manglar como respuesta a factores ambientales y antrópicos en el Soconusco, Chiapas, México. Polibotánica 2019, 47, 39–58. [Google Scholar] [CrossRef]
  53. Ramírez-García, P.; Lot, A. La distribución del manglar y de los pastos marinos en el Golfo de California, México. An. Inst. Biol. Univ. Nac. Auton. Mex. Bot. 1994, 65, 63–72. [Google Scholar]
  54. Pacheco-Ruiz, I.; Zertuche-González, J.A.; Meling-López, A.E.; Riosmena-Rodríguez, R.; Orduña-Rojas, J. El límite norte de Rhizophora mangle L. en el golfo de California, México. Cienc. Mar. 2006, 28, 19–22. [Google Scholar]
Figure 1. Study area in the Usumacinta River Basin, Tabasco, Mexico.
Forests 11 01238 g001
Figure 2. Smoothed species accumulation curve for all plots of swamp forest communities in the Usumacinta River Basin, Mexico. The shaded area represents the 95 % confidence envelope.
Forests 11 01238 g002
Figure 3. Species accumulation curve for three tropical swamp forest communities in the Usumacinta River Basin, Mexico. EC = El Cometa Lagoon, CH = Chaschoc Lagoon complex, SP = San Pedro River. The shaded areas represent 95 % confidence envelopes.
Forests 11 01238 g003
Figure 4. Cumulative woody species accumulation curves for three tropical swamp forest communities in the Usumacinta River Basin, Mexico. (a) 0D, species richness; (b) 1D, number of common species (Shannon exponential); (c) 2D, number of dominant species (inverse Simpson’s index). Continuous lines indicate interpolation, discontinuous lines indicate extrapolation. Species richness was rarified to 1200 individuals in order to standardize tree densities among communities. The shaded areas represent 95% confidence envelopes.
Forests 11 01238 g004
Figure 5. Rank abundance curves for three tropical swamp forest communities in the Usumacinta River Basin, Mexico. (a) El Cometa Lagoon; (b) Chaschoc Lagoon complex; (c) San Pedro River.
Forests 11 01238 g005
Figure 6. Comparison of structural attributes in three tropical swamp forest communities in the Usumacinta River Basin, Mexico. (a) Basal area; (b) density of individuals; (c) mean canopy height. Different letters indicate significant differences according to post hoc Tukey pair-wise tests (p < 0.05). EC, El Cometa Lagoon; CH, Chaschoc Lagoon complex; SP, San Pedro River.
Forests 11 01238 g006
Table 1. Checklist of woody species and their abundances in three tropical swamp forest communities in the Usumacinta River Basin, Mexico. EC, El Cometa Lagoon; CH, Chaschoc Lagoon complex; SP, San Pedro River.
FamilySpeciesSite
ECCHSP
AnacardiaceaeMetopium brownei (Jacq.) Urb. 2
Spondias mombin L. 5
AnnonaceaeAnnona reticulata L. 2
ApocynaceaeTabernaemontana longipes Donn.Sm. 1
ArecaceaeAttalea butyracea (Mutis ex L.f.) Wess.Boer 1
Sabal mexicana Mart. 67
BignoniaceaeCrescentia cujete L. 2
Tabebuia rosea (Bertol.) Bertero ex A.DC. 239
BurseraceaeBursera sp. 6
CapparaceaeCrateva tapia L. 1
ChrysobalanaceaeChrysobalanus icaco L.15 14
Couepia polyandra (Kunth) Rose 1
ClusiaceaeCalophyllum brasiliense Cambess. 40
CombretaceaeTerminalia buceras (L.) C.Wright1541144
Laguncularia racemosa (L.) C.F.Gaertn.4
FabaceaeAcacia cornigera (L.) Willd. 2
Albizia lebbeck (L.) Benth. 1
Cynometra retusa Britton & Rose 4
Enterolobium cyclocarpum (Jacq.) Griseb. 4
Haematoxylum campechianum L. 30313
Inga vera Willd. 2
Lonchocarpus guatemalensis Benth. 52
Lonchocarpus hondurensis Benth.80 74
Lonchocarpus sp. 6
Pithecellobium lanceolatum (Willd.) Benth. 17
Swartzia cubensis (Britton & Wilson) Standl. 2
Zygia conzattii (Standl.) Britton & Rose 72
Zygia recordii Britton & Rose 8
FagaceaeQuercus oleoides Schltdl. & Cham. 5
MalpighiaceaeMalpighia sp1. 5
MalvaceaeGuazuma ulmifolia Lam. 6
Pachira aquatica Aubl.110 320
MeliaceaeCedrela odorata L. 5
Trichilia havanensis Jacq. 2
MoraceaeFicus insipida Willd. 21
MyrtaceaeEugenia acapulcensis Steud. 57
Myrtaceae sp1. 2
PolygonaceaeCoccoloba barbadensis Jacq. 511
PrimulaceaeBonellia macrocarpa (Cav.) B.Ståhl & Källersjö 4
RhizophoraceaeRhizophora mangle L.170 71
RubiaceaeAlseis yucatanensis Standl. 28
SalicaceaeSalix humboldtiana Willd. 183
Xylosma sp. 1
SapindaceaeSapindus saponaria L. 5
SapotaceaeManilkara zapota (L.) P.Royen1 41
SolanaceaeCestrum nocturnum L. 1
Not determinedMorphospecies 11
Morphospecies 2 62
Morphospecies 3 10
Morphospecies 4 4
Morphospecies 5 5
Morphospecies 6 5
Morphospecies 7 2
Morphospecies 8 3
Morphospecies 9 1
Morphospecies 10 2
Morphospecies 11 2
Morphospecies 12 2
Morphospecies 13 1
Morphospecies 14 1
Morphospecies 15 1
Table 2. Number of plots, individuals, and species in three tropical swamp forest communities in the Usumacinta River Basin, Mexico.
SitePlotsAbundanceFamiliesSpecies
El Cometa Lagoon2753568
Chaschoc Lagoon complex358351927
San Pedro River219321935
Table 3. Basal area, tree density, and mean height by species in three tropical swamp forest communities in the Usumacinta River Basin, Mexico. For basal area and tree density, the total values by species are shown.
SiteSpeciesBasal Area
(m2 ha−1)
Density
(Ind. ha−1)
Height (m)
El Cometa LagoonRhizophora mangle210.58100.7417.42
Terminalia buceras200.9791.2612.66
Lonchocarpus hondurensis26.0647.418.19
Pachira aquatica21.3965.195.76
Chrysobalanus icaco5.028.895.96
Laguncularia racemosa1.842.3710.32
Morphospecies 10.250.596.47
Manilkara zapota0.140.596.19
Chaschoc Lagoon complexHaematoxylum campechianum420.42138.5111.13
Sabal mexicana122.0730.638.48
Lonchocarpus guatemalensis79.1223.7712.15
Salix humboldtiana56.6883.669.79
Alseis yucatanensis47.6212.8011.36
Enterolobium cyclocarpum40.651.8322.00
Eugenia acapulcensis40.0526.0610.68
Zygia conzattii38.1932.918.69
Cedrela odorata30.752.2925.00
Cynometra retusa10.771.8314.00
Coccoloba barbadensis9.182.2912.60
Quercus oleoides8.672.2916.0
Spondias mombin7.902.2912.60
Pithecellobium lanceolatum7.817.778.59
Guazuma ulmifolia5.212.7411.83
Crescentia cujete4.410.917.50
Crateva tapia2.920.468.00
Couepia polyandra2.800.4615.00
Attalea butyracea2.480.4612.00
Albizia lebbeck2.120.4615.00
Sapindus saponaria1.702.298.20
Bonellia macrocarpa1.621.838.00
Tabebuia rosea1.020.9111.50
Annona reticulata0.890.9110.00
Cestrum nocturnum0.480.468.00
Terminalia buceras0.420.4615.00
Tabernaemontana longipes0.250.4610.00
San Pedro RiverTerminalia buceras219.68109.7112.84
Pachira aquatica188.71243.8110.54
Lonchocarpus hondurensis31.2956.3810.42
Rhizophora mangle24.7754.108.25
Manilkara zapota22.3631.249.39
Morphospecies 219.4347.249.46
Tabebuia rosea17.3829.7110.83
Calophyllum brasiliense14.9030.4812.02
Ficus insipida11.1816.009.71
Haematoxylum campechianum10.939.909.00
Swartzia cubensis9.991.5212.64
Chrysobalanus icaco7.1110.676.41
Morphospecies 34.347.6211.55
Coccoloba barbadensis3.698.389.10
Zygia recordii1.926.107.88
Morphospecies 41.913.0510.31
Morphospecies 51.753.819.89
Malpighia sp.1.703.817.20
Bursera sp.1.514.5710.61
Lonchocarpus sp.1.164.579.49
Metopium brownei1.051.5210.24
Inga vera0.981.527.08
Morphospecies 60.923.819.01
Acacia cornigera0.681.529.16
Morphospecies 70.521.525.38
Morphospecies 80.502.298.40
Trichilia havanensis0.431.527.05
Morphospecies 90.420.7617.88
Morphospecies 100.401.528.25
Morphospecies 110.391.5211.19
Morphospecies 120.331.526.01
Morphospecies 130.230.7610.04
Morphospecies 140.180.7610.42
Xylosma sp.0.150.768.62
Morphospecies 150.130.769.70
Publisher’s Note: MDPI stays neutral with regard to jurisdictional claims in published maps and institutional affiliations.

