Article

Agents Affecting the Productivity of Pine Plantations on the Loess Plateau in China: A Study Based on Structural Equation Modeling

1
College of Landscape Architecture and Art, Northwest A&F University, Yangling 712100, China
2
College of Forestry, Northwest A&F University, Yangling 712100, China
*
Author to whom correspondence should be addressed.
These co-first authors contributed equally to this work.
Forests 2020, 11(12), 1328; https://doi.org/10.3390/f11121328
Submission received: 14 October 2020 / Revised: 11 December 2020 / Accepted: 12 December 2020 / Published: 14 December 2020
(This article belongs to the Special Issue Application of Innovative Silvicultural Treatments in Pine Forests)

Abstract

:
Stability and productivity are important indicators used to measure the state of forest ecosystems. Artificial forests populations with reasonable structures and strong stability are critical for ecosystem productivity. Previous studies have focused on individual factors, while the mechanisms of how multiple factors affect population productivity remain unknown. We used 57 plots in a Chinese pine (Pinus tabuliformis) plantation to investigate 23 stand factors and analyzed the relationships among site factors, population structure, population stability, and population productivity using partial least square-structural equation modeling (PLS-SEM). The results showed that the population productivity of the plantation was directly affected by the population stability latent variable but indirectly affected by the site conditions latent variables (indirect effect path coefficient = 0.249) and forest structure (indirect effect path coefficient = 0.222). However, the site conditions latent variable was the main factor directly affecting the population stability latent variables; the total effect was 0.511 (direct effect path coefficient = 0.307, indirect effect path coefficient = 0.204), and the influence of forest structure on population stability was lower than that of the site conditions latent variable (direct effect path coefficient = 0.454). The factor with the greatest weight among the site conditions latent variable was slope (0.747), indicating that slope contributes the most to latent variables related to forest population stability. Among all variables affecting the forest stability latent variables, forest density had the highest weight value (0.803), and the weight value of forest mortality was lower than that of forest density. The weights of the latent variables associated with population structure from high to low were canopy density, the uniform angle index, and the spatial competition index, indicating that competition for space had the lowest influence on the population stability latent variables. The results provide new insights and ideas for quantifying relationships among different driving factors and a basis for scientific and rational plantation management.

1. Introduction

Artificial forests play an important role in the development of human society and the protection and restoration of the ecological environment. At present, the area of plantation forests in China has reached 80.31 million hectares, with this number ranking first in the world [1]. However, Chinese plantation forests are generally of poor quality, not only because of their low productivity, but also because of a series of associated ecological problems, such as decreased soil fertility [2,3], exacerbation of the effects of pests and diseases, and lowered biodiversity [4]. Chinese pine (Pinus tabuliformis), as the dominant species in China’s northern coniferous forests [5] and the main afforestation tree species on the Loess Plateau, has a wide distribution and strong water and soil conservation capabilities and provides good ecological and economic benefits [6].
Forest productivity is an important indicator of the structure and functional characteristics of forest ecosystems [7] and can be measured on the basis of aboveground tree biomass [8,9]. Many factors affect productivity, but previous studies have mainly focused on one type of factor. Glatthor et al. hold that forest structure diversity has a greater impact on productivity than species diversity, and species diversity indirectly affects productivity through changes in population structure [10]. Grimm et al. reported that a forest canopy with a more complex structure will increase the amount of carbon sequestered by the forest and thus its productivity [11]. The complexity of the canopy structure has a similar effect on the net primary productivity (NPP) of wood as the total leaf area and site quality [12]. Furthermore, the population structure of tree species has a significant impact on population stability [13]. Other researchers have found that heterogeneity in stand structure affects forest productivity [14,15] and stability [16] more than species diversity and that inequality in tree size reduces forest productivity [17]. In medium-productivity forests dominated by mixed coniferous tree species, the stability of the species composition decreases with increasing site productivity [18], and site quality may have an important impact on wood production [19]. Numerous previous studies have indicated that the season and time [20], competition for light among trees [21], differences in management [22], and other factors can affect forest productivity. Bueis et al. selected four site indices and built a model which showed that forest productivity was affected by water availability and soil acidity [23]. Previous research has focused on the impact of certain types of variable on productivity, and it is rare to analyze and discuss different types of variables and productivity simultaneously.
This study uses a structural equation model (SEM) to explore the relationships between different variables and the comprehensive impact of these variables on population productivity. In contrast to the traditional method of correlation analysis, SEM analysis is based on prior knowledge of the existing theory, and the interrelationships between the factors in the system are established in the model prior to the analysis. This method not only can be used to judge the degree of the influence of the different factors but also to analyze the overall model. Fitting and judgement, avoiding the assessment of the direct relationships between individual variables, can effectively reveal the true mechanisms driving the existence and development of natural systems [24]. Some scholars [15,25] have introduced SEM analysis into forestry-related research and obtained relatively effective results.
In this study, we used 57 plots in Chinese pine (Pinus tabuliformis) plantations in the Huanglong Mountain forest area of the Loess Plateau. Based on the biological meaning of each variable, the 23 observed variables were divided into four groups of latent variables. We applied canonical correlation analysis (CCA) and SEM to screen multiple related observed variables. We also employed partial least squares structural equation modeling (PLS-SEM) to quantify the pairwise relationships between site conditions, population structure, population stability, and population productivity factors. The primary objectives of this work were to (1) analyze the direct and indirect influences of site conditions, population structure, population stability, and population productivity factors of Chinese pine plantations; (2) explore the interactions between site conditions, population structure, population stability, and population productivity factors and determine the weights of the specific variables of Chinese pine plantations; and (3) construct a SEM of the population productivity, population structure and stability of Chinese pine plantations to provide a reference for their scientific management.

2. Materials and Methods

2.1. Study Area

The study area is located in the forest area of Huanglong Mountain in Shaanxi Province, with geographic coordinates of 109°38′49″–110°12′47″ E, 35°28′46″–36°02′01″ N, located in the semi-humid and semi-arid temperate zone. The climate transition zone belongs to the hilly and gully area of the Loess Plateau. The annual average temperature is 8.6 °C, the frost-free period is 175 days, and the annual sunshine hours reach 2370 h. The altitude in the study area is between 1100 and 1520 m, and the annual average precipitation is 611.8 mm. The soil is mainly Haplic Luviso, and the zonal vegetation is a warm-temperate deciduous broad-leaved forest belt. The forest communities mainly consist of Chinese pine (Pinus tabulaeformis), Liaodong oak (Quercus wutaishanica), and white birch (Betula platyphylla), and the main admixture species is Amur maple (Acer ginnala).

2.2. Data Collection and Analysis

The data used in this study were collected from 57 plots of 20 × 30 m in the Huanglong Mountain Forest District from July to August 2017 and July to August 2018. Stratified random sampling was conduct in this study to determine the number and distribution of sample plots and to yield more precise model estimates within certain sampling intensity. Based on the prior knowledge from national forest inventory (NFI), age group(middle-aged stand and mature stand), canopy closure (over 60% and 40–60%), dominant species (Chinese pine in this study), and origin of stand (plantations in this study), which provide direct and indirect impact on the forest productivity [26,27], were used to stratify all of the forest locations into four strata as middle-aged Chinese pine forest with moderate density (MAPM), middle-aged Chinese pine forest with high density (MAPH), middle-aged Chinese pine forest with high crown closure (MPM), and mature Chinese pine forest with high density (MPH). Thereafter, random sampling was conducted within each stratum. The number of sampled plots for each stratum was calculated as following formula (1) [28]. The results are shown in Table 1.
n = t 2 ( h = 1 J W h C h 2 ) E 2
where n is total sample size, t is t-value of the 95% confidence, J is the total number of stratum, i stands for the ith stratum, Wh is area weight of each strata; Ch is coefficient of variation of volume per hectare of each strata; E is allowable standard error in units of survey plots, in this study, E was set to 10%.
The surveyed variables included diameter at breast height (DBH), tree height, crown width, X and Y relative coordinates, canopy closure, plot altitude, slope aspect, slope, and litter thickness. We labeled all trees which DBH larger than 3 cm and recorded them. The DBH was measured using diameter tape with 0.1 cm precision. The average slope and altitude were recorded using a portable GPS-G138BD (made by Unitstrong, Beijing, China). Litter thickness was measured at points 1/4, 1/2, and 3/4 of the length of the diagonals. Canopy length was measured from north to south and east to west using a tape measure with an accuracy of 0.1 m, and calculated based on the projection area of all canopies in a plot and the total area of the plot, and this calculation was performed in ArcGIS 10.2 (Esri, Redlands, CA, USA). Use the Blume-Leiss height indicator to measure the height of trees with an accuracy of 0.5 m. We used an increment borer to measure five different trees in each plot to determine the average age of the trees in the plot, because our selected plots occurred in an even-aged plantation forest. The relative coordinates of the trees in each plot were measured using a tape measure. Each plot was divided into a 5 × 5 m grid, and then each tree’s position within the grid was carefully determined. We also counted the number of seeding of Chinese pine which DBH less than 3 cm in a 5 × 5 m grid. The analysis of survey data is shown in Table 2.
Soil samples were collected from the 57 plots from 10 to 12 August 2017 and 14 to 16 August 2018. Thirteen points were established in each plot to form an S shape, and horizons of 0 to 30 cm were collected using a 5 cm diameter soil driller after the litter was removed. Soil samples collected at a single site were mixed into one sample. After the removal of fine roots and green vegetation parts, the soil samples were passed through a 2 mm sieve and stored at −4 °C for subsequent chemical and physical analyses. Samples for soil bulk density analysis were collected with a 100 mm2 cylindrical metal sampler.
The soil organic matter (SOM) was assayed by the dichromate oxidation method [29]. The soil water content (SWC) was measured by oven drying the soil at 105 °C until a constant weight was reached. The total nitrogen content (TN) was measured with a FOSS Kjeltec 8400 Analyzer Unit (FOSS, Hillerød, Denmark) using the Kjeldahl method [30], the total phosphorus (TP) was determined by digestion with H2SO4-HClO4 followed by measurement with a spectrophotometer (HITACHI, Japan) [31], and the total carbon (TC) in 1 mm of sieved soil was measured with a Liaui TOC II Analyzer (ELMENTAR, Langenselbold, Germany).

2.3. Selection of Variables

The SEM analysis method is a comprehensive technique based on the use of a variable covariance matrix to analyze the relationships in multivariate data and identify the relationships and causality between variables. The model contains observed and latent variables. Variables that can be directly measured are called observed variables, and those that cannot and need to be expressed on the basis of the observed variables are called latent variables. In this study, we used latent variables and observed variables to explain the relationships between various influencing factors related to productivity and selected three independent latent independent variables (site conditions, population structure, and population stability) and one independent potential dependent variable (population productivity) to construct the SEM.
Among the latent variables related to site conditions, we used the following eight independent observed variables: altitude (ALT), slope (SLO), soil organic matter content (SOM), soil total carbon content (TC), soil total phosphorus content (TP), soil total nitrogen content (TN), soil water content (SWC), and litter thickness (LT). We also selected eight observed variables related to forest structure, including those not related to the spatial structure of the forest stand: mean diameter at breast height (MDBH), average tree height (AH), and stand canopy density (CD); and those related to the spatial structure: the uniform angle index (W) [32], dominance (U) [33,34], crowding (C) [35], distance-related competition index (Hegyi) [36], and space-based competition index (SCI) [37], the spatial structure of forest can be quantified by describing the spatial relationships between the reference tree and its four immediate neighboring trees [38]. Among the latent variables related to population stability, we selected those that characterize population dynamics: population density (D), population mortality (FM), forest regeneration ability is expressed by regeneration of undergrowth seedlings (RUS) and population age (AGE). We also selected the total productivity (PP) of the plot, to explore the influence of other latent variables on the average productivity of the Chinese pine population [39], average individual plant productivity (IP) and average annual productivity (APP) were also used to explain population productivity. The explanation or formula of each variable is shown in Table 3 and the variables results are shown in Table S1. The calculation of the index is carried out in R software ver-3.5.3.
In summary, 23 variables were used in this study to describe the four latent variables of site conditions, population structure, population stability, and population productivity associated with Chinese pine plantations. Through the implementation of PLS-SEM, the influencing mechanisms of the observed variables and the relationships between these variables and their effects on population productivity were analyzed.

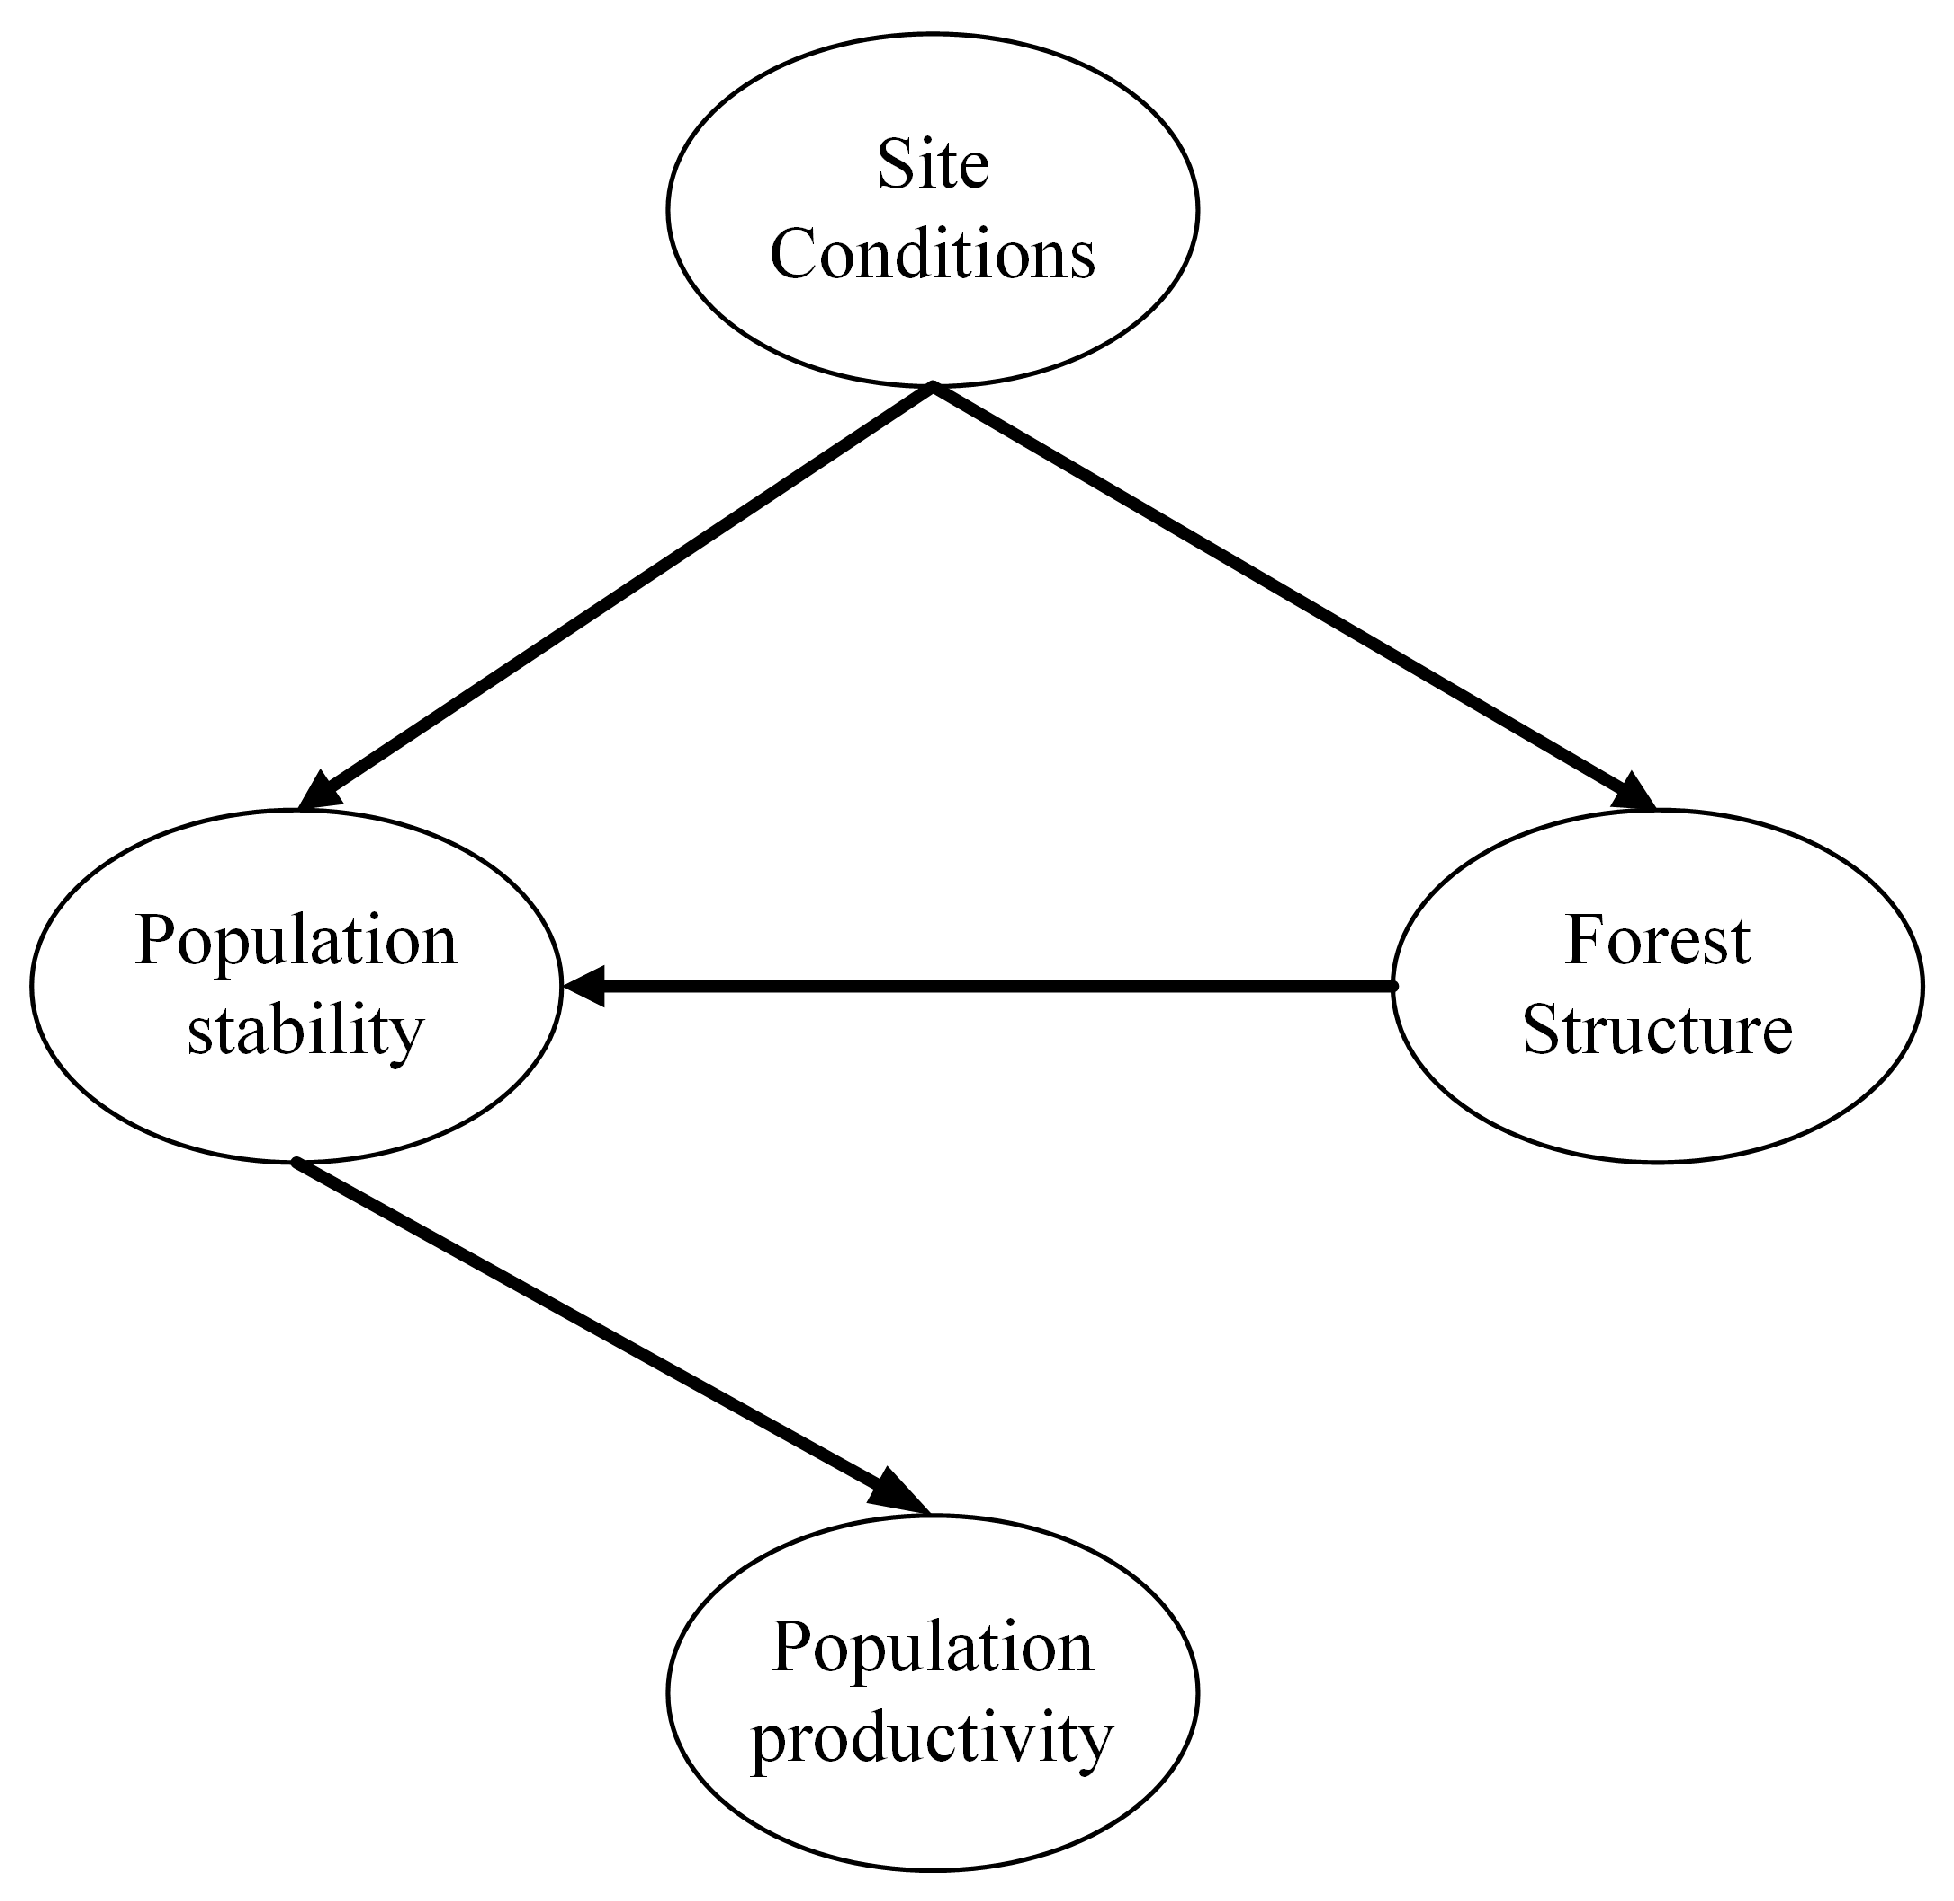
2.4. Construction of the Initial Model

In exploratory research, if the relationship between variables is not understood, the use of PLS-SEM should be considered [40]. In addition, some researchers have also emphasized that when the sample size is limited and the data are not normally distributed, PLS-SEM has greater tolerance than covariance-based structural equation modeling (CB-SEM) [41,42]. The PLS-SEM method has been applied to some multivariate coupling studies in the natural sciences, and its application in forest ecosystems has proven the scientificity and reliability of the model [15,25,43]. Therefore, PLS-SEM was used in this study. A preliminary model was established based on the following causal assumptions:
(1) Site conditions, population structure and population stability latent variables have direct effects on population productivity latent variable;
(2) The latent variable of site conditions has an indirect effect on the latent variable of population productivity through the latent variables of population structure and population stability.
(3) The latent variable of population structure has an indirect impact on the latent variable of population productivity through the latent variable of population stability.
When the initial model is constructed, the direction of the arrow between the latent variables indicates the causality of the impact. The environment of the population is closely related to the basic state of the population and has an objective and long-lasting impact at all stages of population growth [44]. Populations growing under good environmental conditions are more likely to succeed in forest communities with good structure, strong stability, and high productivity. Therefore, in the initial model, site conditions affect the structural latent variables, stability latent variables, and productivity latent variables. Structure is a comprehensive reflection of population development and succession processes such as renewal methods, competition, self-sparseness, and interference activities [45]. It is an objectively existing distribution state, and structure determines function. Therefore, in the initial model, structural factors affect stability factors and productivity factors. In addition, stability is a manifestation of the state of a population indicating its ability to return to its original state after being slightly disturbed. If the renewal and recovery ability is strong in a stable forest, then the productivity is high, so we set the stability latent variable to affect the productivity latent variable in the initial model. The original model is shown in Figure 1.

2.5. Canonical Correlation Analysis

The implementation of CCA involves the understanding of the covariance matrix. CCA is a multivariate analysis method that uses the correlation between comprehensive variable pairs to reflect the overall correlation between two sets of indicators [44]. In contrast to other statistical methods, CCA takes each group of variables as a whole. The size of the canonical correlation coefficient can indicate the influence of different factors on the dependent variable or the contribution of a variable to the explained variable. Since the relationships among the neutral site conditions, structural factors, stability factors, and productivity factors in this study were artificially established based on the existing results of forestry research and recognized forestry knowledge, the true reliability of the relationship was assessed with CCA. The CCA was performed using IBM SPSS Statistics 25(IBM SPSS Statistics, IBM, Chicago, IL, USA).

2.6. Model Suitability Test

After the model is constructed, its suitability needs to be tested to verify its reliability. The reliability test refers to the test of the degree of consistency and stability shown by the measurement data results and is also an evaluation standard for the result consistency and stability. Cronbach’s alpha is a popular indicator used to test the internal consistency of measurement indicators [46]. This consistency is acceptable when the value is greater than 0.6. The variance inflation factor (VIF) characterizes the collinearity between different observed variables, and the VIF should be less than 5 [47]. In the final PLS-SEM analysis, the combined reliability (CR) and average variance extracted (AVE) were used to evaluate the structural reliability and validity of the internal model, with CR > 0.7 indicating good internal consistency and reliability [48], and AVE > 0.5 indicating good fit and convergence validity [49]. The standardized root means square residual (SRMR) is the average of the standardized residuals between the observed covariance matrix and the assumed covariance matrix [50,51]. The SRMR is acceptable when it produces a value less than 0.1 [52]. When the p-value of the path coefficient is less than 0.05 (or a T statistic > 1.96), the impact is significant [40], and the hypothesis is accepted. The maximum number of PLS algorithm iterations is set to 5000. In this study, we set the number of bootstrapping iterations to 10,000 and the bootstrapping significance level to 0.05 to ensure the reliability of the results. All PLS-SEM analyses were performed using Smart PLS 3 (ver-3.2.8, SmartPLS GmbH, Boenningstedt, Germany).

3. Results

3.1. Canonical Correlation Analysis

The results show that the CCA results of site conditions and population productivity, forest structure, and population productivity are not statistically significant, which indicates that there is no direct relationship between these variables. The results of site conditions and forest structure, site conditions, and population stability showed strong significance; the results of forest structure and population stability, population stability, and population productivity showed extremely strong significance. The results are shown in Table 4.

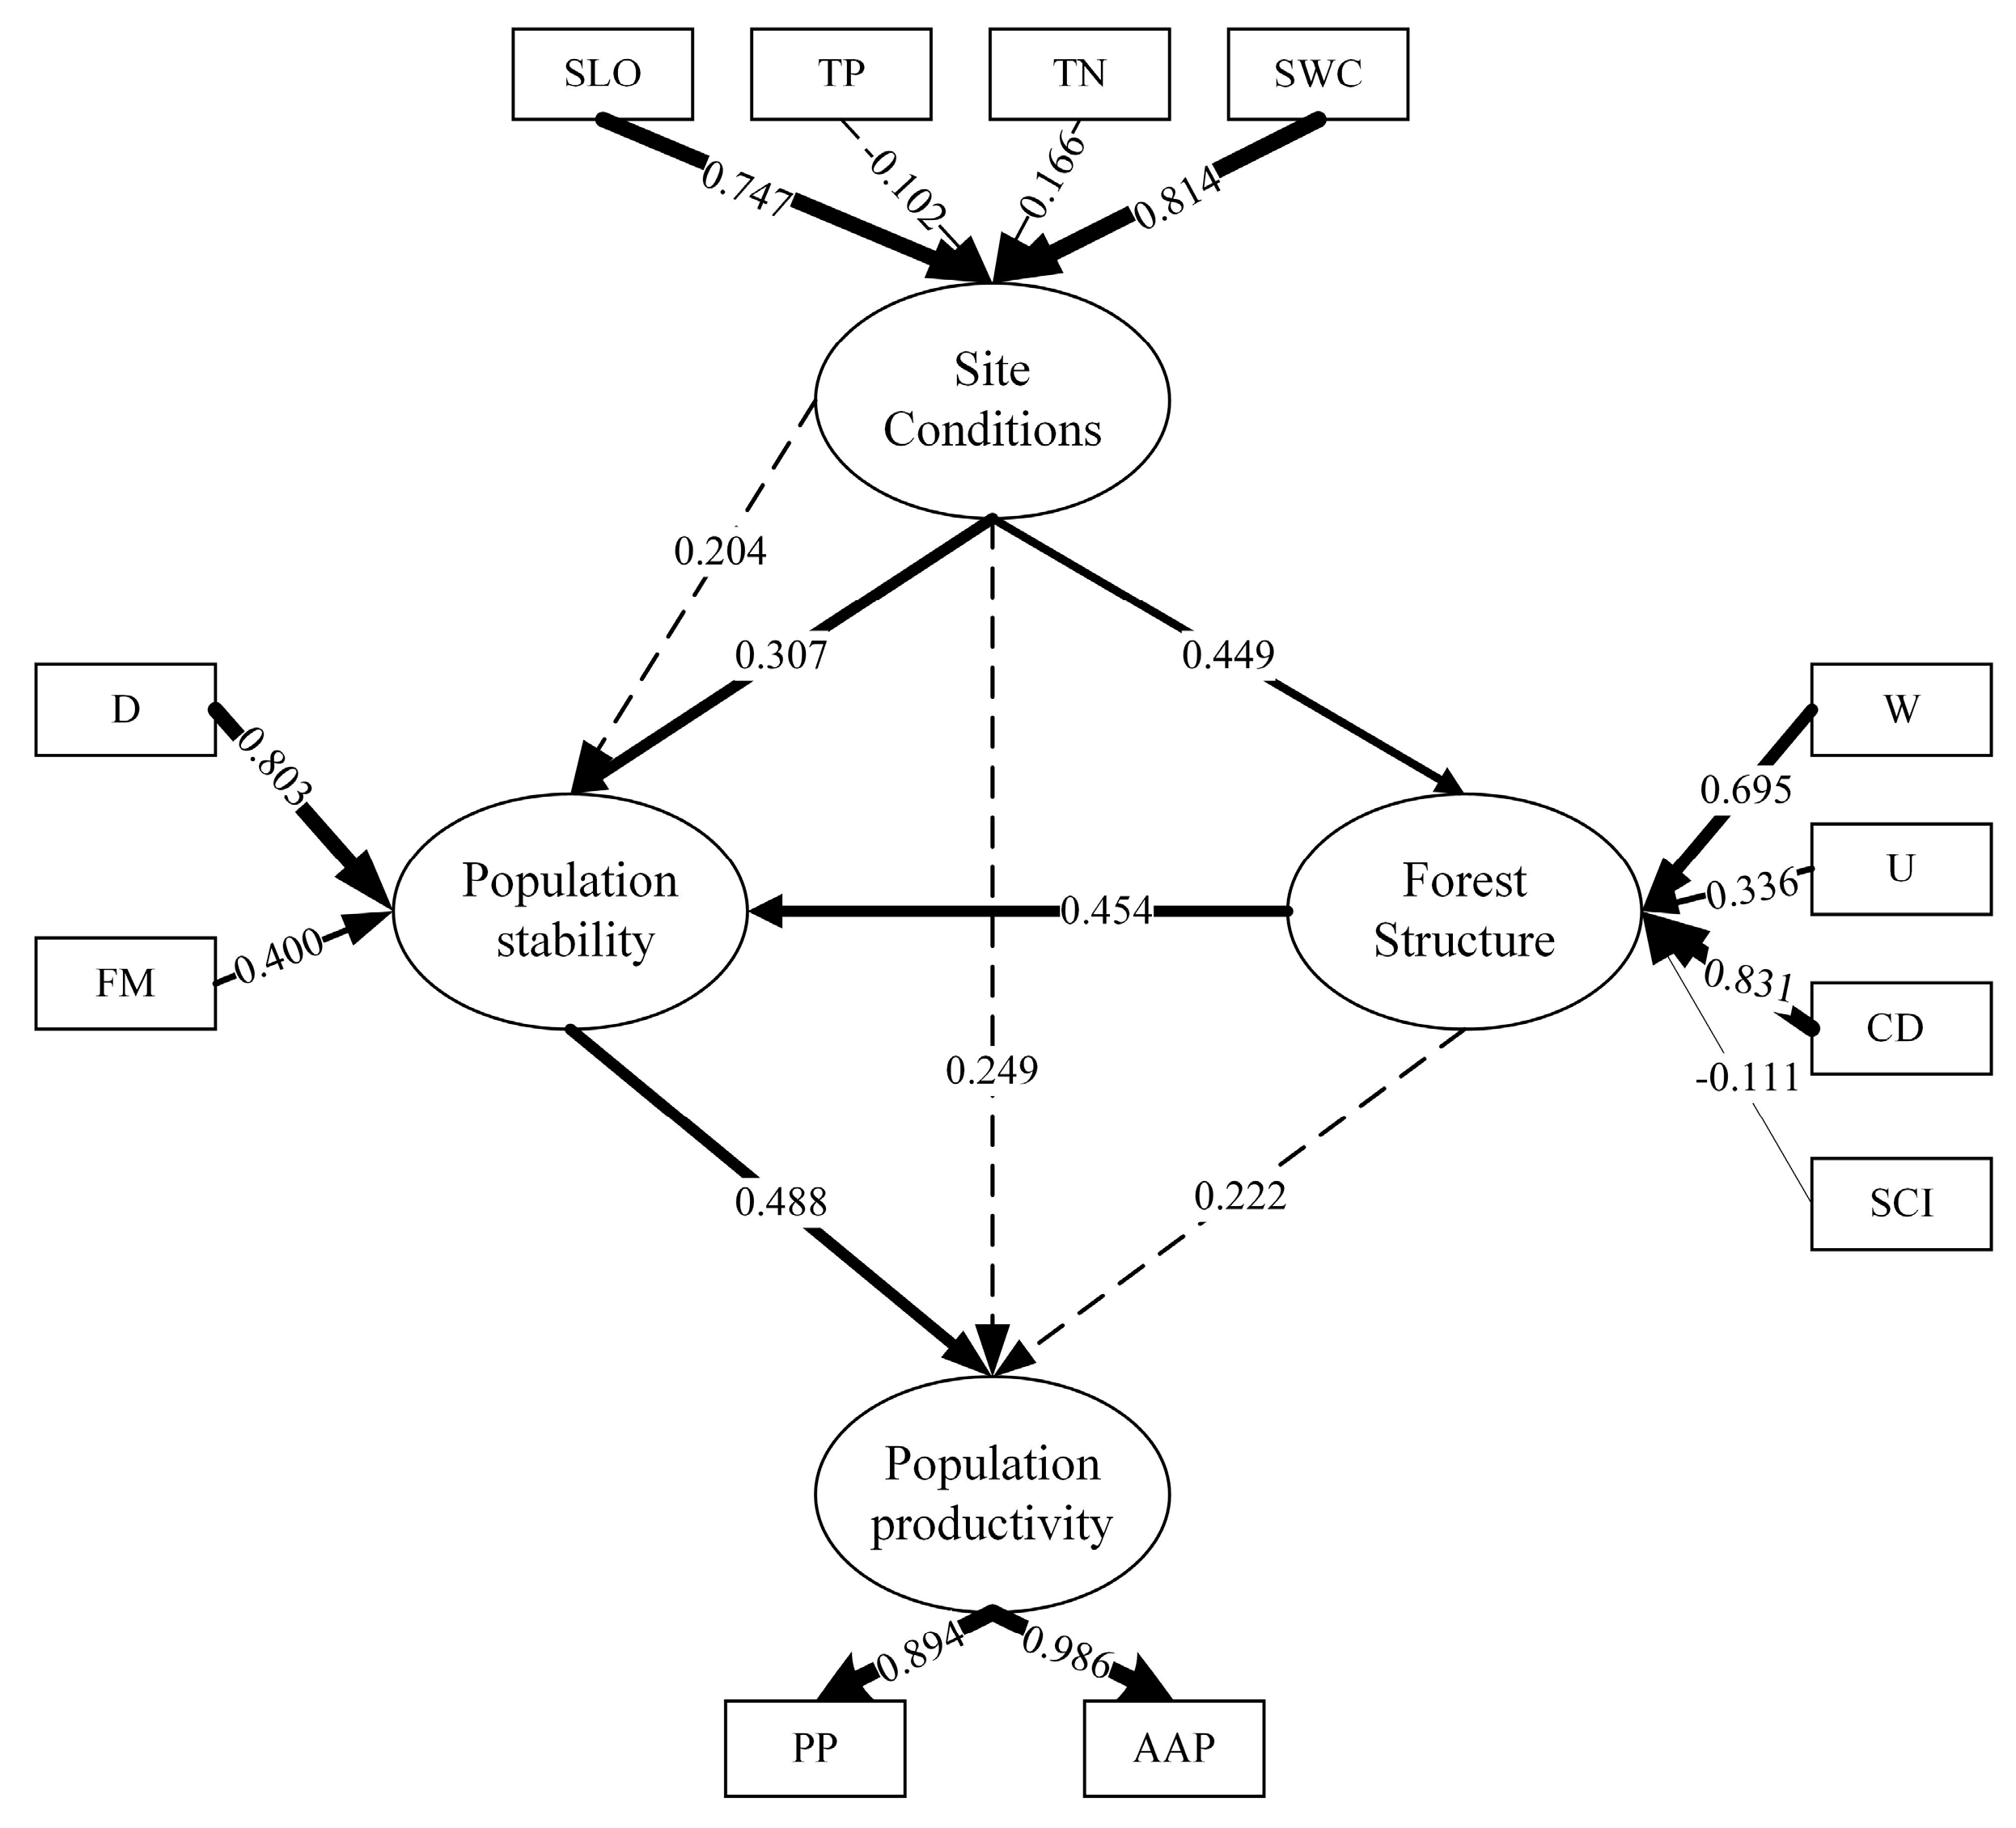
3.2. Modification and Interpretation of the Model

According to the results of the CCA, the connections between the latent variables are corrected in the PLS-SEM, remove paths that are not significant (Figure 2). The contribution coefficients of each observed variable under each group of latent variables are compared to evaluate the importance of the observed variables. On the basis of the comparison and selection of the model matching results, the observed variables with strong collinearity and small contributions to the whole are deleted. Through continuous adjustments, the final model becomes more reasonable, and the complexity and explanatory power of the model also improve.

3.3. Model Fit Test

The best-fitting structural model is shown in Figure 3. In the validity test of the productivity of the Chinese pine plantation, Cronbach’s alpha = 0.893, and the CR value was 0.839, which indicates that the model has good internal consistency and reliability. The AVE value of 0.885 indicates that the convergence of our final model is very good. To avoid multicollinearity between the observed variables, VIF analysis was carried out on the target variables; the results showed that the VIF of all variables was less than 3.0, and the observed variables did not have collinearity. The results pertaining to model fit are SRMR = 0.099. All path coefficient hypothesis test results were found to be significant. Model fit test results are shown in Table 5.

3.4. Relationships between Latent Variables

The relationships between the observed and latent variables are shown in Figure 3. Among the observed variables related to the site environment, the soil water content (SWC) and slope (SLO) showed the greatest contribution, with weights of 0.814 and 0.747, respectively, and the TP and TN weights were smaller. Among the latent variables related to structure, the non-spatial structure index of the population contributed the most to the canopy density, with a weight of 0.831. For the spatial structure index of the population, the uniform angle index (W) contributed the most, with a weight of 0.695, while the spatial competition index (SCI) had a smaller effect, with a weight of −0.111. Among the latent variables related to the stability factor, density (D) and forest mortality (FM) had the greatest contributions, with weights of 0.803 and 0.400, respectively. Among the latent variables pertaining to productivity, both total plot productivity (PP) and average annual productivity (AAP) reflected population productivity to the greatest extent, with coefficients of 0.894 and 0.986, respectively, indicating that their contributions reached 80% and 90%, respectively.
The final model results shown in Table 6 and Figure 3. Indicate that the latent variable of site conditions have a positive effect on the latent variable of stability, the total effect is 0.511 (T-statistic = 5.683, p < 0.001), the direct effect path coefficient is 0.307, and the indirect effect is 0.204. Site conditions have a positive direct impact on forest structure, and the impact coefficient is 0.449 (T-statistic = 3.801, p < 0.001); site conditions also have a positive and indirect impact on productivity factors, with an impact coefficient of 0.249 (T-statistics = 3.921, p < 0.001). Overall, site conditions have the greatest impact on population structure and stability. In addition, structure has a positive direct impact on stability, with an impact coefficient of 0.454 (T-statistic = 4.046, p < 0.001), and an indirect positive impact on population productivity, with an impact coefficient of 0.222 (T-statistic = 3.209, p < 0.01). The coefficient is 0.488 (T-statistics = 6.657, p < 0.001), and the impact is moderate.

4. Discussion

4.1. Direct Effect of Population Stability on Population Productivity

Forest productivity is an important indicator used in the study and evaluation of population status. In previous studies, researchers explain the correlation or causal relationships between a class of impact factors of stand productivity and stand productivity itself. For example, an appropriate increase in CO2 concentration can enhance forest productivity [53], and forest productivity will improve with an increase in species richness [54]. Our study showed that productivity is mainly directly affected by the stability of the population and indirectly affected by site conditions and population structure. Among the observed variables related to population productivity, the annual average productivity had the largest influence coefficient, which indicates that the annual average productivity in pure plantations can best explain the population productivity. Density was found to be the main factor affecting stability, which is similar to the conclusions of Watt et al., before a plantation is established, the initial stand density should be reasonably set, which can improve climate resilience by reducing tree competition, thereby improving overall productivity [26]. The density of Chinese pine plantations in the study area is moderate, the distribution of resources among trees is relatively even, the mortality and regeneration rates of the trees do not substantially differ, and the population is in a stable growth state overall, resulting in a positive impact on productivity.

4.2. Indirect Effect of Site Conditions on Population Productivity

Site conditions have an important impact on the growth and development of populations, affecting population stability and productivity on the basis of their respective influencing mechanisms. Different site environments may cause individual differences in forests [55]. Our results showed that the latent variables related to site conditions directly influence the latent variables associated with population stability and structure and indirectly impact the latent variables related to population productivity. This indicates that the site environment and productivity of the Chinese pine plantation population in our study showed no direct relationship.
Among the latent variables related to site conditions, soil water content (SWC) contributes the most, followed by the slope (SLO). This result may have occurred because the study area is located in the semi-humid and semi-arid temperate zone, SWC is regarded as a key impactor of stand productivity [43,56,57]. In addition, the difference of SWC may stem from the slope aspect [58,59], which is proved in many studies that slope aspect is significant for forest productivity [60,61,62]. On the other hand, SLO is related closely to the distribution pattern of forest trees [57], which have an impact on the uniform angle index (W) and the spatial competition index (SCI), and thus site conditions have a direct impact on the population structure and population stability of Chinese pines and indirectly affect population productivity.
Common soil parameters cannot be considered individually to explain population productivity [63]. Our results show that soil organic phosphorus (TP) and soil organic nitrogen (TN) contribute less. Although P and N are important elements for plant growth, the nutrient content in the soil is not equal to the amount of active nutrients that can be absorbed. S. Braun et al. performed a comparative experiment by increasing the N content in the soil, and the results showed that this increase did not cause significant plant growth changes, which is related to whether the soil is saturated with N and other nutrients [64].
Species diversity directly influences the productivity of forest stands [65], and soil properties (site conditions) represent direct factors affecting species diversity. We speculate that soil nutrients improve the diversity of shrubs in the lower layer of the Chinese pine plantation population, which has a potential positive impact on population productivity [40]. In practice, the stability of the population can be enhanced by improving the site conditions, thereby increasing the overall population productivity. When performing artificial afforestation, it is crucial to identify the ideal location and trees species and artificially improve the target environment.

4.3. Population Productivity and Stability are Differently Affected by Forest Structure

Our results showed that the forest stand canopy density contributes the most to the population structure, reflects the forest stand density, and is a manifestation of the density. Studies have found that heterogeneity in tree size greatly affects forest structure, thereby affecting forest productivity [66], which is inconsistent with our results. Because the Chinese pine plantations we studied are of the same age, the difference in DBH is small, and the tree size heterogeneity is low, and thus the results do not show the effect of DBH on forest structure.
The spatial structure of forests also affects population stability and productivity, and our result showed that the observed variable W had the largest contribution in the spatial structure (Figure 3), which indicates that the spatial distribution pattern of forests directly or indirectly affects population stability and productivity. Particularly, the results we obtained by calculating W (Table S1) showed that the 57 plots in the study area are in a transitional state from a uniform distribution to a random distribution, which has a great impact on population stability and productivity. This result agreed with previous reported by Hui et al. [67]. The random distribution of forest trees is regarded as the most beneficial to their growth and development [37]. Therefore, the weight of U is lower than that of W, which indicates that the contribution of random distribution of forest trees (W) is greater than differences in breast diameter size (U). This is because the studied plantations are of the same age within a certain plot, the DBH of the trees does not differ much in a single plot, and the distribution of the trees is relatively random, thus showing that the contribution of random distribution of forest trees (W) is greater than differences in breast diameter size (U).
We found that the weight of the spatial competition index (SCI) in the study area is low, indicating that competition for space occurs in the study area. Since the study area is covered by pure plantation forest, there are few other tree species, essentially resulting in intraspecific competition. Many factors affect competition among forest trees, such as stand density and stand age [27], the forest environment, and the leaf area index [68]. Competition between trees could affect the biomass of forests [69] and ultimately affect the overall productivity. Competition is one of the important factors leading to trees death, thereby impacting population stability and productivity [70,71]. Considering that the study area is covered by pure forest of the same age, the differences in DBH are small, and the use of environmental resources among individual trees is relatively even. However, due to site conditions such as slope, the spatial structure of the forest will vary, showing that competition for space has little effect on population stability and productivity.
From the perspective of latent variables, population stability is directly affected by forest structure, while population productivity is indirectly affected by this variable, which may be caused by the unreasonable structure of the plantation in the study area. Previous studies have shown that both stability and productivity are directly affected by population structure. For example, the optimization of population structure can significantly improve the stability of forest populations [72], and a reasonable population structure can improve the overall productivity of populations by promoting the complementary use of resources among species [73]. Heterogeneity in population structure also has a positive impact on productivity, improving the tree diversity–structure–productivity relationship [74,75]. The forest structure has a direct and strong influence on population stability, and it is reasonable and necessary to adjust structural factors to improve plantation management and regulation. In production practice, especially during the tending process of the study area, forestry workers should optimize the stand spatial structure according to the principle of structure determining function, pay attention to improving the stand spatial structure, enhance the stability of the population, and increase the productive. Productivity can also affect the composition and stability of species within a population [13]. Since this study regards population productivity as the final result, how productivity can regulate stability requires further attention in the future.

5. Conclusions

In this study, we used PLS-SEM to quantify the impacts of the selected influencing factors on variables potentially affecting population productivity in Chinese pine plantations.
Site conditions affect population stability and indirectly affect population productivity. Crown density, a non-spatial-structure-related variable, is the most important factor affecting population productivity in Chinese pine plantations. The uniform angle index and dominance, which are variables associated with spatial structure, also affect population productivity, but the contribution of competition for space is small. We speculate that the mechanisms of the impacts of site condition-related latent variables on population productivity-related latent variables are expressed as a latent variable that affects population productivity by affecting species diversity in forest communities. These influencing mechanisms can help researchers understand the internal relationships affecting the productivity of Chinese pine populations and develop corresponding strategies for the future management of Chinese pine plantations.

Supplementary Materials

The following are available online at https://www.mdpi.com/1999-4907/11/12/1328/s1, Table S1: The original results of the 23 variables.

Author Contributions

Conceptualization, X.Z. and Y.L.; Methodology, Y.L.; Software, Y.L.; Validation, X.Z., Y.L.; Formal analysis, Y.L.; Investigation, Y.L., H.S., Y.J.; Resources, Y.L., H.S., Y.J.; Data curation, Y.L. and X.Z.; Writing—original draft preparation, X.Z. and Y.L.; Writing—review and editing, X.Z., J.L.; Visualization, Y.L., X.Z.; Supervision, J.L.; Project administration, J.L.; Funding acquisition, J.L. All authors have read and agreed to the published version of the manuscript.

Funding

This work was supported by the National Key Research and Development Program of China, (grant no.2016YFD060020305) and Research on Vegetation Restoration Techniques on Steep Loess Slope in Qianyang, Shaanxi, (grant no. K303021613).

Acknowledgments

We acknowledge the Department of Huanglongshan Forestry Service for permission to conduct research in local forest. We wish to acknowledge the Center for Ecological Forecasting and Global Change, Northwest A&F University, for providing laboratories for the soil experiment.

Conflicts of Interest

The authors declare no conflict of interest.

References

  1. National Forestry and Grassland Administration. 2014–2018 China Forest Resources Report; China Forestry Publishing House: Beijing, China, 2019; pp. 2–3. [Google Scholar]
  2. Wang, Q.; Wang, S.; Yu, X. Decline of soil fertility during forest conversion of secondary forest to Chinese fir plantations in Subtropical China. Land Degrad. Dev. 2011, 22, 444–452. [Google Scholar] [CrossRef]
  3. Liu, S.; Li, X.; Niu, L. The degradation of soil fertility in pure larch plantations in the northeastern part of China. Ecol. Eng. 1998, 10, 75–86. [Google Scholar] [CrossRef]
  4. Changshun, Z. Advance in Research on Soil Degradation and Soil Improvement of Timber Plantations. World For. Res. 2005, 18, 17–21. [Google Scholar]
  5. Chen, K.; Abbott, R.; Milne, R.; Tian, X.-M.; Liu, J. Phylogeography of Pinus tabulaeformis Carr. (Pinaceae), a dominant species of coniferous forest in northern China. Mol. Ecol. 2008, 17, 4276–4288. [Google Scholar] [CrossRef]
  6. Tao, W.U.; Hui, Z.W.; Chang, L.Y.; Hui, F.S. Effects of Different Forest Practices on Pinus tabulaeformis Population Numbers and Species Diversity in the Forest Region of Huanglongshan Mountain. Acta Bot. Boreali-Occident. Sin. 2006, 26, 1007–1013. [Google Scholar]
  7. Steffen, W.; Noble, I.; Canadell, J.; Apps, M.; Schulze, E.D.; Jarvis, P.; Baldocchi, D.; Ciais, P.; Cramer, W.; Ehleringer, J.; et al. The Terrestrial Carbon Cycle: Implications for the Kyoto Protocol. Science 1998, 280, 1393–1394. [Google Scholar]
  8. Norris, M.; Blair, J.; Johnson, L.; McKane, R. Assessing changes in biomass, productivity, and C and N stores following Juniperus virginiana forest expansion into tallgrass prairie. Can. J. For. Res. 2001, 31, 1940–1946. [Google Scholar] [CrossRef] [Green Version]
  9. Cousens, J.; Newbould, P. Methods of Estimating the Primary Production of Forests. J. Appl. Ecol. 1968, 5, 745. [Google Scholar] [CrossRef] [Green Version]
  10. Glatthorn, J.; Feldmann, E.; Pichler, V.; Hauck, M.; Leuschner, C. Biomass Stock and Productivity of Primeval and Production Beech Forests: Greater Canopy Structural Diversity Promotes Productivity. Ecosystems 2017. [Google Scholar] [CrossRef]
  11. Grimm, V.; Schmidt, E.; Wissel, C. On the application of stability concepts in ecology. Ecol. Model. 1992, 63, 143–161. [Google Scholar] [CrossRef]
  12. Hardiman, B.; Bohrer, G.; Gough, C.; Vogel, C.; Curtisi, P. The role of canopy structural complexity in wood net primary production of a maturing northern deciduous forest. Ecology 2011, 92, 1818–1827. [Google Scholar] [CrossRef] [PubMed] [Green Version]
  13. O’Connor, C.; Falk, D.; Lynch, A.; Swetnam, T.; Wilcox, C. Disturbance and productivity interactions mediate stability of forest composition and structure. Ecol. Appl. 2016, 27. [Google Scholar] [CrossRef]
  14. Bohn, F.; Huth, A. The importance of forest structure to biodiversity–productivity relationships. R. Soc. Open Sci. 2017, 4. [Google Scholar] [CrossRef] [PubMed] [Green Version]
  15. Dănescu, A.; Albrecht, A.; Bauhus, J. Structural diversity promotes productivity of mixed, uneven-aged forests in southwestern Germany. Oecologia 2016, 182, 319–333. [Google Scholar] [CrossRef]
  16. Díaz-Yáñez, O.; Mola-Yudego, B.; Olabarria, J.; Pukkala, T. How does forest composition and structure affect the stability against wind and snow? For. Ecol. Manag. 2017, 401, 215–222. [Google Scholar] [CrossRef]
  17. Bourdier, T.; Cordonnier, T.; Kunstler, G.; Piedallu, C.; Lagarrigues, G.; Courbaud, B. Tree Size Inequality Reduces Forest Productivity: An Analysis Combining Inventory Data for Ten European Species and a Light Competition Model. PLoS ONE 2016, 11, e0151852. [Google Scholar] [CrossRef]
  18. Carnaval, A.; Hickerson, M.; Haddad, C.; Rodrigues, M.; Moritz, C. Stability Predicts Genetic Diversity in the Brazilian Atlantic Forest Hotspot. Science 2009, 323, 785–789. [Google Scholar] [CrossRef] [Green Version]
  19. Herrera-Fernández, B.; Campos Arce, J.; Finegan, B.; Alvarado-Hernandez, A. Factors affecting site productivity of a Costa Rican secondary rain forest in relation to Vochysia ferruginea, a commercially valuable canopy tree species. For. Ecol. Manag. 1999, 118, 73–81. [Google Scholar] [CrossRef]
  20. Yadav, V.; Mueller, K.L.; Dragoni, D.; Michalak, A. A geostatistical synthesis study of factors affecting gross primary productivity in various ecosystems of North America. Biogeosci. Discuss. 2010, 7. [Google Scholar] [CrossRef]
  21. Morin, X.; Fahse, L.; Scherer-Lorenzen, M.; Bugmann, H. Tree species richness promotes productivity in temperate forests through strong complementarity between species. Ecol. Lett. 2011, 14, 1211–1219. [Google Scholar] [CrossRef]
  22. Bouriaud, O.; Marin, G.; Bouriaud, L.; Hessenmöller, D.; Ernst Detlef, S. Romanian legal management rules limit wood production in Norway spruce and beech forests. For. Ecosyst. 2016, 3, 1–11. [Google Scholar] [CrossRef] [Green Version]
  23. Bueis, T.; Bravo, F.; Pando, V.; Turrión, M.B. Relationship between environmental parameters and Pinus sylvestris L. site index in forest plantations in northern Spain acidic plateau. IForest Biogeosci. For. 2016, 9, e1–e8. [Google Scholar] [CrossRef] [Green Version]
  24. Doncaster, C. Structural Equation Modeling and Natural Systems. Fish Fish. 2007, 8, 368–369. [Google Scholar] [CrossRef]
  25. Laughlin, D.; Abella, S.; Covington, W.; Grace, J. Species richness and soil properties in Pinus ponderosa forests: A structural equation modeling analysis. J. Veg. Sci. 2007, 18. [Google Scholar] [CrossRef]
  26. Watt, M.; Kimberley, M.; Dash, J.; Harrison, D. Spatial prediction of optimal final stand density for even age plantation forests using productivity indices. Can. J. For. Res. 2016, 47. [Google Scholar] [CrossRef]
  27. Aakala, T.; Fraver, S.; D’Amato, A.; Palik, B. Influence of competition and age on tree growth in structurally complex old-growth forests in northern Minnesota, USA. For. Ecol. Manag. 2013, 308, 128–135. [Google Scholar] [CrossRef]
  28. Kershaw, J.A., Jr.; Ducey, M.J.; Beers, T.W.; Husch, B. Forest Mensuration; John Wiley & Sons: Hoboken, NJ, USA, 2016. [Google Scholar]
  29. Aj, W.; Black, I. An Examination of the Degtjareff Method for Determining Soil Organic Matter, and A Proposed Modification of the Chromic Acid Titration Method. Soil Sci. 1934, 37, 29–38. [Google Scholar] [CrossRef]
  30. Bremner, J.M. Nitrogen-total. In Methods of Soil Analysis, Part 3; American Society of Agronomy-Soil Science Society of America: Madison, WI, USA, 1996; pp. 1085–1121. [Google Scholar]
  31. Parkinson, J.; Allen, S. A Wet Oxidation Procedure for Determination of Nitrogen and Mineral Nutrients in Biological Material. Communications in Soil Science and Plant Analysis. Commun. Soil Sci. Plant Anal. 1975, 6, 1–11. [Google Scholar] [CrossRef]
  32. Hui, G.; Gadow, K.; Hu, Y.B. The optimum standard angle of the uniform angle index. For. Res. 2004, 17, 687–692. [Google Scholar]
  33. Hui, G.; Gadow, K.; Albert, M. A new parameter for stand spatial structure—Neighbourhood comparison. Forest Research. 1999, 12, 1–6. [Google Scholar]
  34. Hui, G.; Albert, M.; Gadow, K. The measure of neighbourhood dimensions as a parameter to reproduce stand structures. Forstwissensch. Cent. 1998, 117, 258–266. [Google Scholar] [CrossRef]
  35. Hu, Y.B.; Hui, G.Y. How to describe the crowding degree of trees based on the relationship of neighboring trees. J. Beijing For. Univ. 2015, 37, 1–8. [Google Scholar] [CrossRef]
  36. Hegyi, F. A simulation model for managing jack-pine standssimulation. R. Res. Notes 1974, 30, 74–90. [Google Scholar]
  37. Hui, G.; Wang, Y.; Zhang, G.; Zhao, Z.; Bai, C.; Liu, W. A novel approach for assessing the neighborhood competition in two different aged forests. For. Ecol. Manag. 2018, 422, 49–58. [Google Scholar] [CrossRef]
  38. Gadow, K. Characterizing Forest Spatial Structure and Diversity; University of Lund: Lund, Sweden, 2002; pp. 20–30. [Google Scholar]
  39. Putz, F.E.; Chan, H.T. Tree growth, dynamics, and productivity in a mature mangrove forest in Malaysia. For. Ecol. Manag. 1986, 17, 211–230. [Google Scholar] [CrossRef]
  40. Wong, K.K. Partial Least Squares Structural Equation Modeling (PLS-SEM) Techniques Using SmartPLS. Mark. Bull. 2013, 24, 1–32. [Google Scholar]
  41. Wong, K. Handling small survey sample size and skewed dataset with partial least square path modelling. Vue Mag. Mark. Res. Intell. Assoc. 2010, 20, 20–23. [Google Scholar]
  42. Bacon, L.D. Using LISREL and PLS to measure customer satisfaction. In Proceedings of the Sawtooth Software Conference Proceedings, La Jolla, CA, USA, 2–5 February 1999; pp. 305–306. [Google Scholar]
  43. Wang, B.; Yuankun, B.; Li, Y.; Li, W.; Zhao, P.; Yang, Y.; Qi, N.; Gou, R. Quantifying the Relationship among Impact Factors of Shrub Layer Diversity in Chinese Pine Plantation Forest Ecosystems. Forests 2019, 10, 781. [Google Scholar] [CrossRef] [Green Version]
  44. Hotelling, H. Relations between Two Sets of Variates. Biometrika 1935, 28, 321–377. [Google Scholar] [CrossRef]
  45. Xiangdong, L. Indicators on Structural Diversity Within-Stand: A Review. Sci. Silv. Sin. 2002, 38, 140–146. [Google Scholar]
  46. Anderson, J.; Gerbing, D. Structural Equation Modeling in Practice: A Review of Recommended Two-Step Approach. Psychological Bulletin Psychol. Bull. 1988, 103, 411–423. [Google Scholar] [CrossRef]
  47. Hair, J.F.; Ringle, C.; Sarstedt, M. PLS-SEM: Indeed a silver bullet. J. Mark. Theory Pract. 2011, 19, 139–151. [Google Scholar] [CrossRef]
  48. Hair, J.; Anderson, R.; Tatham, R.; Black, W. Multivariate Data Analysis, 5th ed.; Prentice Hall: Upper Saddle River, NJ, USA, 1998. [Google Scholar]
  49. Fornell, C.; Larcker, D. Evaluating Structural Equation Models with Unobservable Variables and Measurement Error. J. Mark. Res. 1981, 24, 337–346. [Google Scholar] [CrossRef]
  50. Fonseca, M. Principles and Practice of Structural Equation Modeling, Third Edition by Rex B. Kline. Int. Stat. Rev. 2013, 81. [Google Scholar] [CrossRef]
  51. Chen, F. Sensitivity of Goodness of Fit Indexes to Lack of Measurement Invariance. Struct. Equ. Model. 2007, 14, 464–504. [Google Scholar] [CrossRef]
  52. Hu, L.T.; Bentler, P.M. Cutoff criteria for fit indexes in covariance structure analysis: Conventional criteria versus new alternatives. Struct. Equ. Model. 1998, 3, 55–61. [Google Scholar] [CrossRef]
  53. Gutsch, M.; Lasch, P.; Suckow, F.; Reyer, C. Evaluating the productivity of four main tree species in Germany under climate change with static reduced models. Ann. For. Sci. 2016, 73, 401–410. [Google Scholar] [CrossRef] [Green Version]
  54. Xian, W.; Wang, X.; Tang, Z.; Shen, Z.; Zheng, C.; Xia, X.; Fang, J. The relationship between species richness and biomass changes from boreal to subtropical forests in China. Ecography 2014, 38. [Google Scholar] [CrossRef]
  55. Jiao-jun, Z.; Zhi-ping, F.; De-hui, Z.; Feng-qi, J.; Takeshi, M. Comparison of stand structure and growth between artificial and natural forests ofPinus sylvestiris var.mongolica on sandy land. J. For. Res. 2003, 14, 103–111. [Google Scholar] [CrossRef]
  56. Peng, H.; Tague, C.; Jia, Y. Evaluating the eco-hydrologic impacts of reforestation in the Loess Plateau, China, using an eco-hydrologic model. Ecohydrology 2015, 9. [Google Scholar] [CrossRef]
  57. Chen, W.; Jia, X.; Zha, T.-S.; Wu, B.; Zhang, Y.-Q.; Li, C.; Wang, X.; He, G.; Yu, H.; Guopeng, C. Soil respiration in a mixed urban forest in China in relation to soil temperature and water content. Eur. J. Soil Biol. 2013, 54, 63–68. [Google Scholar] [CrossRef]
  58. Sharma, C.M.; Baduni, N.; Gairola, S.; Ghildiyal, S.K.; Suyal, S. Effects of slope aspects on forest compositions, community structures and soil properties in natural temperate forests of Garhwal Himalaya. J. For. Res. 2010, 21, 331–337. [Google Scholar] [CrossRef]
  59. Måren, I.; Karki, S.; Prajapati, C.; Yadav, R.K.; Shrestha, B. Facing north or south: Does slope aspect impact forest stand characteristics and soil properties in a semiarid trans-Himalayan valley? J. Arid Environ. 2015, 121, 112–123. [Google Scholar] [CrossRef] [Green Version]
  60. Stage, A.; Salas-Eljatib, C. Interactions of Elevation, Aspect, and Slope in Models of Forest Species Composition and Productivity. For. Sci. 2007, 53, 486–492. [Google Scholar]
  61. Cantlon, J. Vegetation and Microclimates on North and South Slopes of Cushetunk Mountain, New Jersey. Ecol. Monogr. 1953, 23, 241. [Google Scholar] [CrossRef]
  62. Socha, J. Effect of topography and geology on the site index of Picea abies in the West Carpathian, Poland. Scand. J. For. Res. 2008, 23, 203–213. [Google Scholar] [CrossRef]
  63. Hansson, K.; Laclau, J.-P.; Saint-Andre, L.; Mareschal, L.; Van der Heijden, G.; Nys, C.; Nicolas, M.; Ranger, J.; Legout, A. Chemical fertility of forest ecosystems. Part 1: Common soil chemical analyses were poor predictors of stand productivity across a wide range of acidic forest soils. For. Ecol. Manag. 2020, 461, 117843. [Google Scholar] [CrossRef]
  64. Braun, S.; Thomas, V.; Quiring, R.; Flückiger, W. Does nitrogen deposition increase forest production? The role of phosphorus. Environ. Pollut. 2009, 158, 2043–2052. [Google Scholar] [CrossRef]
  65. Belote, T.; Prisley, S.; Jones, R.; Fitzpatrick, M.; de Beurs, K. Forest productivity and tree diversity relationships depend on ecological context within mid-Atlantic and Appalachian forests (USA). For. Ecol. Manag. 2011, 261, 1315–1324. [Google Scholar] [CrossRef]
  66. Zeller, L.; Liang, J.; Pretzsch, H. Tree species richness enhances stand productivity while stand structure can have opposite effects, based on forest inventory data from Germany and the United States of America. For. Ecosyst. 2018, 5. [Google Scholar] [CrossRef] [Green Version]
  67. Pommerening, A. Evaluating structural indices by reversing forest structural analysis. For. Ecol. Manag. 2006, 224, 266–277. [Google Scholar] [CrossRef]
  68. Newton, P.; Jolliffe, P. Aboveground modular component responses to intraspecific competition within density-stressed black spruce stands. Can. J. For. Res. 2011, 28, 1587–1610. [Google Scholar] [CrossRef]
  69. Zhou, W.; Cheng, X.; Wu, R.; Han, H.; Kang, F.; Zhu, J.; Tian, P. Effect of intraspecific competition on biomass partitioning of Larix principis-rupprechtii. J. Plant Interact. 2018, 13, 1–8. [Google Scholar] [CrossRef] [Green Version]
  70. Yaussy, D.; Iverson, L.; Matthews, S. Competition and Climate Affects US Hardwood-Forest Tree Mortality. For. Sci. Wash. 2012, 59. [Google Scholar] [CrossRef] [Green Version]
  71. Hülsmann, L.; Bugmann, H.; Brang, P. How to predict tree death from inventory data—Lessons from a systematic assessment of European tree mortality models. Can. J. For. Res. 2017, 47. [Google Scholar] [CrossRef] [Green Version]
  72. Yücesan, Z.; Özçelik, S.; Oktan, E. Effects of thinning on stand structure and tree stability in an afforested oriental beech (Fagus orientalis Lipsky) stand in northeast Turkey. J. For. Res. 2015, 26. [Google Scholar] [CrossRef]
  73. Ishii, H.; Tanabe, S.-I.; Hiura, T. Exploring the Relationships among Canopy Structure, Stand Productivity, and Biodiversity of Temperate Forest Ecosystems. For. Sci. 2004, 50, 342–355. [Google Scholar]
  74. Zeller, L.; Pretzsch, H. Effect of forest structure on stand productivity in Central European forests depends on developmental stage and tree species diversity. For. Ecol. Manag. 2019, 434, 193–204. [Google Scholar] [CrossRef]
  75. Park, J.; Kim, H.S.; Jo, H.K.; Jung, I.I. The Influence of Tree Structural and Species Diversity on Temperate Forest Productivity and Stability in Korea. Forests 2019, 10, 1113. [Google Scholar] [CrossRef] [Green Version]
Figure 1. The original partial least squares structural equation model showing the relationship between latent variables. The arrow indicates the effect between latent variables or weight of observed variables to latent variables. The ovals indicate the latent variables; the rectangles indicate the observed variables. LT: Litter thickness; SOM: Soil organic matter; SWC: Soil water content; TC: Soil total carbon; TN: Soil total nitrogen; TP: Soil total phosphorus; ALT: altitude; SLO: Slope; Hegyi: Hegyi competition index; U: Dominance; W: Uniform angle index; C: Crowding; SCI: Structure-based competition index; CD: Crown density; AH: Average height; MDBH: Mean diameter at breast height; D: Stand density; RUS: Regeneration of undergrowth seedlings; FM: Forest mortality; AGE: Average age of trees in the plot; IP: Individual productivity; AAP: Average annual productivity; PP: Plot productivity.
Forests 11 01328 g001
Figure 2. Latent variable path based on CCA results.
Forests 11 01328 g002
Figure 3. Final structural equation model. SLO: Slope of plots; TN: Soil total nitrogen; TP: Soil total phosphorus; SWC: Soil water content; W: Uniform angle index; U: Dominance; SCI: Structure-based competition index; CD: Crown density; D: Stand density; FM: Forest mortality; AAP: Average annual productivity; PP: Plot productivity. A solid line between observed variables indicates direct effect, and a dotted line indicates an indirect effect. A solid line between observed variables indicates a direct effect, and a dotted line indicates an indirect effect. The arrow between the latent variables indicates the path coefficient, the arrow between the latent variable and the observed variable indicates the weight.
Forests 11 01328 g003
Table 1. Total number of sample plots and number of samples in each stratum
StrataArea (ha)WhChCh2WhCh2nh = nWh
MAPM984.100.10630.39530.15630.01666
MAPH5868.250.63380.38210.14600.092536
MPH2344.840.25320.38820.15070.038215
MPM62.290.00670.30360.09220.00060
SUM9259.481--0.305357
Note: nh is the number of plots that should be selected for each strata; n is total number of plots; MPM: Middle-aged Chinese pine forest with moderate crown closure; MPH: Middle-aged Chinese pine forest with high crown closure; MAPH: Mature Chinese pine forest with high crown closure, Middle-aged Chinese pine forest with high crown closure.
Table 2. Analysis of survey data
VariableMinMaxMeanSD
Age (year)2960398.41
Average DBH (cm)8.2932.0215.345.32
Average height (m)8.0518.8713.122.27
Elevation (m)111415191370.08113.82
Slope (°)34018.678.55
Litter thickness (cm)3.4116.17.322.82
Number of stems (ha)500453323461131.19
Canopy density0.60.980.870.06
Basal area (m2/ha)15.6458.2634.698.49
Table 3. Description of variables used in the research
Latent VariableObserved VariableAbbreviationDescription
Site
Conditions
Litter thicknessLTMean thickness of litter in a stand
Total carbon contentTCContent of total carbon in soil
Total nitrogen contentTNContent of total nitrogen in soil
Total phosphorus contentTPContent of total phosphorus in soil
Soil water contentSWCContent of water in soil
Soil organic matterSOMContent of organic matter in soil
AltitudeALTAltitude of Chinese pine population stand
SlopeSLOSlope where Chinese pine population occurs
Forest
Structure
DominanceU U i = 1 n j = 1 n v i j       v i j = { 1 , D j < D i 0 , otherwise
Proportion of the n nearest neighbors of a given reference tree that are smaller than the reference tree
[33,34]
Uniform angle indexW W i = 1 n j = 1 n y i j       y i j = { 1 , α i j < α 0 0 , otherwise
Characterization of the spatial distribution of a forest community or of individual tree species within that community by gradually comparing the four included angles with the standard angle
[32]
CrowdingC C i = 1 n j = 1 n z i j       z i j = { 1 , 0 , d i j < ( c w i + c w j ) / 2 otherwise
Crowding degree of a neighborhood unit according to the overlapping of the crown in the spatial microenvironment, which clearly defines the crowding degree for a reference tree and its four nearest neighbors
[35]
Forest
Structure
Hegyi indexHegyi H e g y i = j = 1 n ( D j D i · 1 d i j ) [36]
SCI competition indexSCIThe distance-dependent competition index
S C I = U i · C i · λ W i · λ M i
The structure-based competition index
[37]
Mean diameter at breast heightMDBHAverage diameter of the Chinese pine population
Average height
Crown density
AH
CD
Average height of the Chinese pine population
Aggregate of all vertically projected tree crowns onto the ground surface
Population
stability
DensityDChinese pine population density
Regeneration of undergrowth seedlingsRUSThe ratio of Chinese pine seedlings (DBH less than 3 cm) to the total number of plants in each plot
Forest mortalityFMProportion of dead wood in the forest plot
Average ageAGEAverage age of the Chinese pine population
Population
productivity
Plot productivityPP W p p = i = 1 n 0.02112 ( D i 2 H i ) 1.13674
Total productivity of trees in plot
Average annual productivityAAP W A A P = W p p N a g e
Average annual productivity of the plot
Individual productivityIP W I P = W p p N
Average productivity of individual trees in the plot
Meaning of the variables in these equations are as follows: In the formula of forest structure, n represents the number of neighbors, and in this study, n = 4; Di is the DBH of the ith reference tree; Dj is the DBH (cm) of the jth neighboring tree; dij is the distance between the ith reference tree and the jth neighboring tree; αij is the horizontal angle between reference tree and four neighboring trees; a standard angle α0 = 72°; cwi the crown width of the ith reference tree, and cwj the crown width of the jth reference tree. Ui is the dominance, Ci is the crowding index, λWi represents the weighting factors for the spatial distribution of neighboring trees, λMi represents the weighting factors for species identity, Wpp is the plot productivity, Nage is the average age of forest trees in the plot, N is the number of trees in the plot.
Table 4. Canonical correlation analysis results
Latent Variable GroupCanonical Correlations 1p-ValueWilk’s StatisticChi-SquareDF
Site conditions and forest structure0.749 **0.0010.850115.7972
Site conditions and population stability0.676 **0.0040.25167.71740
Site conditions and population productivity0.6330.0580.47037.72224
Forest structure and population stability0.875 ***0.0000.111106.69145
Forest structure and population productivity0.7420.0640.15692.95924
Population stability and population productivity0.738 ***0.0000.15094.73424
Note: ** p < 0.01; *** p < 0.001.
Table 5. Model fit test results
IndicatorsCronbach’s AlphaCRAVESRME
Value0.8930.8390.8850.099
Reliability test standards>0.6>0.7>0.5<0.1
Table 6. Path coefficient between latent variables
Latent Variable GroupDirect EffectT-ValueIndirect EffectT-ValueTotal EffectT-Value
Site conditions -> Forest structure0.449 ***3.801__0.449 ***3.801
Site conditions -> Population stability0.307 *2.5480.204 **2.7160.511 ***5.683
Site conditions -> Population productivity__0.249 ***3.9210.249 ***3.921
Forest structure -> Population stability0.454 ***4.046__0.454 ***4.046
Forest structure -> Population productivity__0.222 **3.2090.222 **3.209
Population stability -> Population productivity0.488 ***6.657__0.488 ***6.657
Note: * p < 0.05; ** p < 0.01; *** p < 0.001.
Publisher’s Note: MDPI stays neutral with regard to jurisdictional claims in published maps and institutional affiliations.

