1. Introduction
Street greenery plays a significant role in improving the urban street environment and public health. The trees with large crowns, leaves and branches or the combination of trees and shrubs [
1] can make a “green wall” to reduce the noise by blocking the transmission of sound waves [
2]. Moreover, the street vegetation can decrease the heat island effect through shading and evapotranspiration [
3,
4] and remove air pollutants through the dry deposition process [
5] and stomatal absorption [
2], especially with broadleaf species [
5]. In addition, street greenery can also improve the odds of residents participating in physical activity [
6,
7,
8], decrease the obesity rate [
8] and enhance mental wellbeing [
9,
10]. Some researchers found that street greenery has a positive relationship with housing prices [
10], personal income [
11] and is negatively associated with the crime rate [
12]. Therefore, a quantitative measurement of street greenery is beneficial for establishing environmentally friendly streets.
Available data sources used to evaluate street greenery include on-site photographs, street view images, remote sensing images and three-dimensional point cloud data. The on-site photos are taken by the camera, and the green vegetation is outlined by image processing software to evaluate the green view index (GVI) [
13], an index initially proposed by Aoki [
14] that measures the greenery from the perspective of pedestrians (eye-level greenery). However, the collecting and processing of the photos are time-consuming and labor-intensive [
15]. In comparison, remote-sensing images are collected by satellites and are easy to download or purchase online, and vegetation evaluation indices based on remote-sensing images is widely used, such as the Normalized Difference Vegetation Index (NDVI) [
16]. However, remote-sensing images can only be used to evaluate overhead greenery, which is different from the eye-level greenery that pedestrians perceive on the ground [
17,
18].
On the contrary, street view images can be used to evaluate eye-level greenery. Compared with field photos, the street view images have broader coverage and lower costs to obtain [
19]. The shooting height of the street view image is close to the height of the human line of sight [
20], and the street view image will not omit the information of undergrowth vegetation, such as shrubs and grasslands [
18,
20], which can better reflect the human visual feeling of street greening. At present, street view images have been widely used in the evaluation of urban street environments, such as urban landscape evaluations [
21,
22], human visual perception evaluations [
9,
23] and walkability evaluations [
24,
25]. Besides, point cloud data can also be used in greenery assessments [
26], but the cost of data acquisition is high.
Plenty of automatic methods have been proposed to extract vegetation based on street view images, such as band operation [
20], color space conversion [
15,
27], support vector machine [
28] and image semantic segmentation [
7,
29]. Compared with the first three methods based on color space, which may confuse vegetation and other manmade green features [
20], the image semantic segmentation method can achieve a satisfactory accuracy level and separate vegetation from other green objects. Furthermore, the influence of season variations on its accuracy level is mild, because its recognition mechanism does not rely on color but, instead, relies on object features.
Many previous studies assessed street greenery in one perspective: overhead greenery by satellite images or eye-level greenery by street view images. However, few studies have assessed greenery comprehensively in two perspectives. Ye et al. [
29] and Lu et al. [
17] compared eye-level greenery and urban green cover using remote sensing at the regional level; thus, street-level differences between eye-level greenery and overhead greenery are still unexplored.
The present studies on evaluating street greenery with street view images have only measured the amount of greenery, without distinguishing upper and lower greenery. As a part of the urban forest, street greening has a vertical structure similar to the forest community. The vertical structure of the forest community is divided into four essential layers based on their growth habits: tree layer, shrub layer, herb layer and ground cover layer. The shrub, herb and ground cover layers are collectively called understory vegetation [
30]. The understory vegetation has the highest biodiversity among plants and provides habitat for many animals [
31]. Additionally, understory vegetation contributes to nutrient cycling and tree growth [
30] and plays a positive role in maintaining the soil surface’s stability [
32]. For pedestrians, a wide variety of understory species can make the street landscape more attractive and promote social activities [
32]. Thus, it is misleading for planners to only aim to increase street tree coverage but neglect shrubs and herbs [
33]. Compared to single-layer structures, residents prefer denser and more complex urban vegetation structures [
34], such as trees planted over shrubs, which have aesthetic benefits, and trees planted over turf grass, which improve the air quality as well as mental wellbeing [
35]. A combination of trees and understory vegetation can better support biodiversity and ecosystem services than trees or shrubs alone [
31,
35]. Therefore, it is necessary to measure the complexity of street-side vegetation structures to improve the biodiversity and beauty of urban green spaces.
The main objective of this study was to evaluate the street greenery using multiple indicators by street-level imagery and satellite images. A new indicator, street vegetation structural diversity (VSD), was proposed to measure the diversity of trees, shrubs and herbs. To achieve this, we used Nanjing City to explore the detailed distribution patterns of street greenery and their associations with urban functional zones (UFZs) and road levels. Furthermore, a multi-perspective analysis of the street greenery was presented to explore the relationship between the GVI and NDVI. The assessment results can provide reference for further studies and can be used to develop planning practices for urban street greenery designs.
2. Materials and Methods
2.1. Study Area
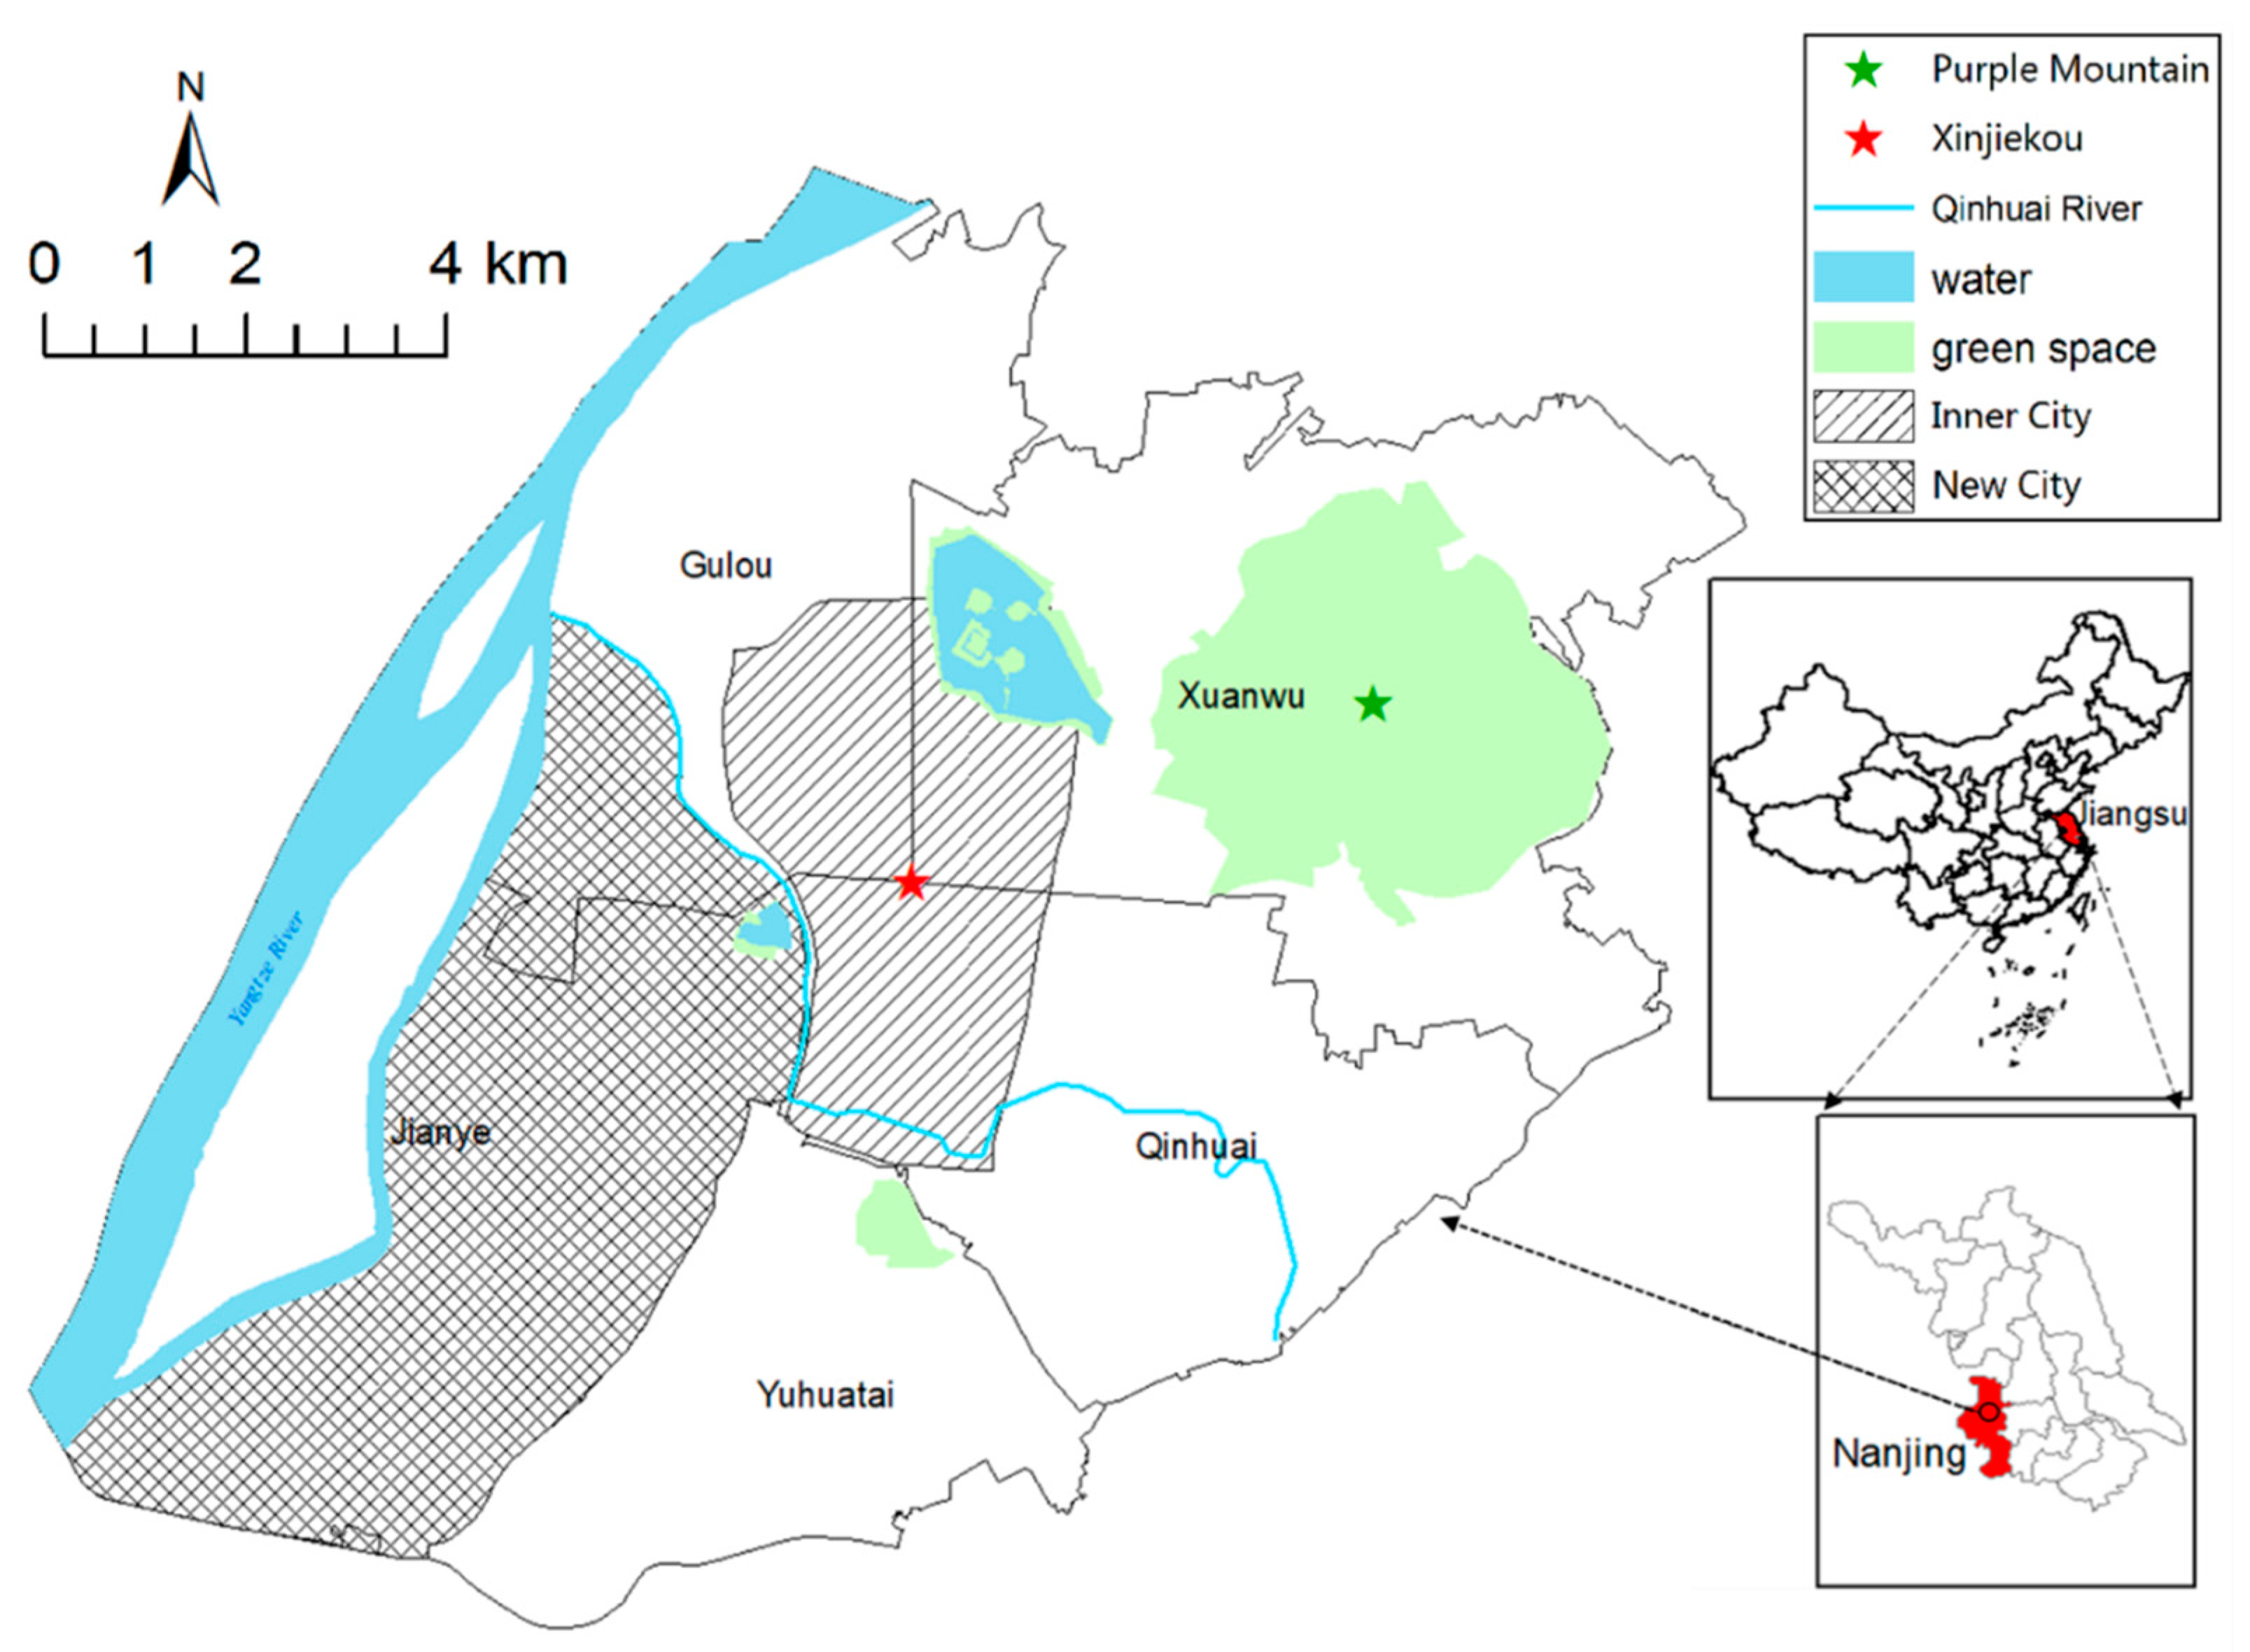
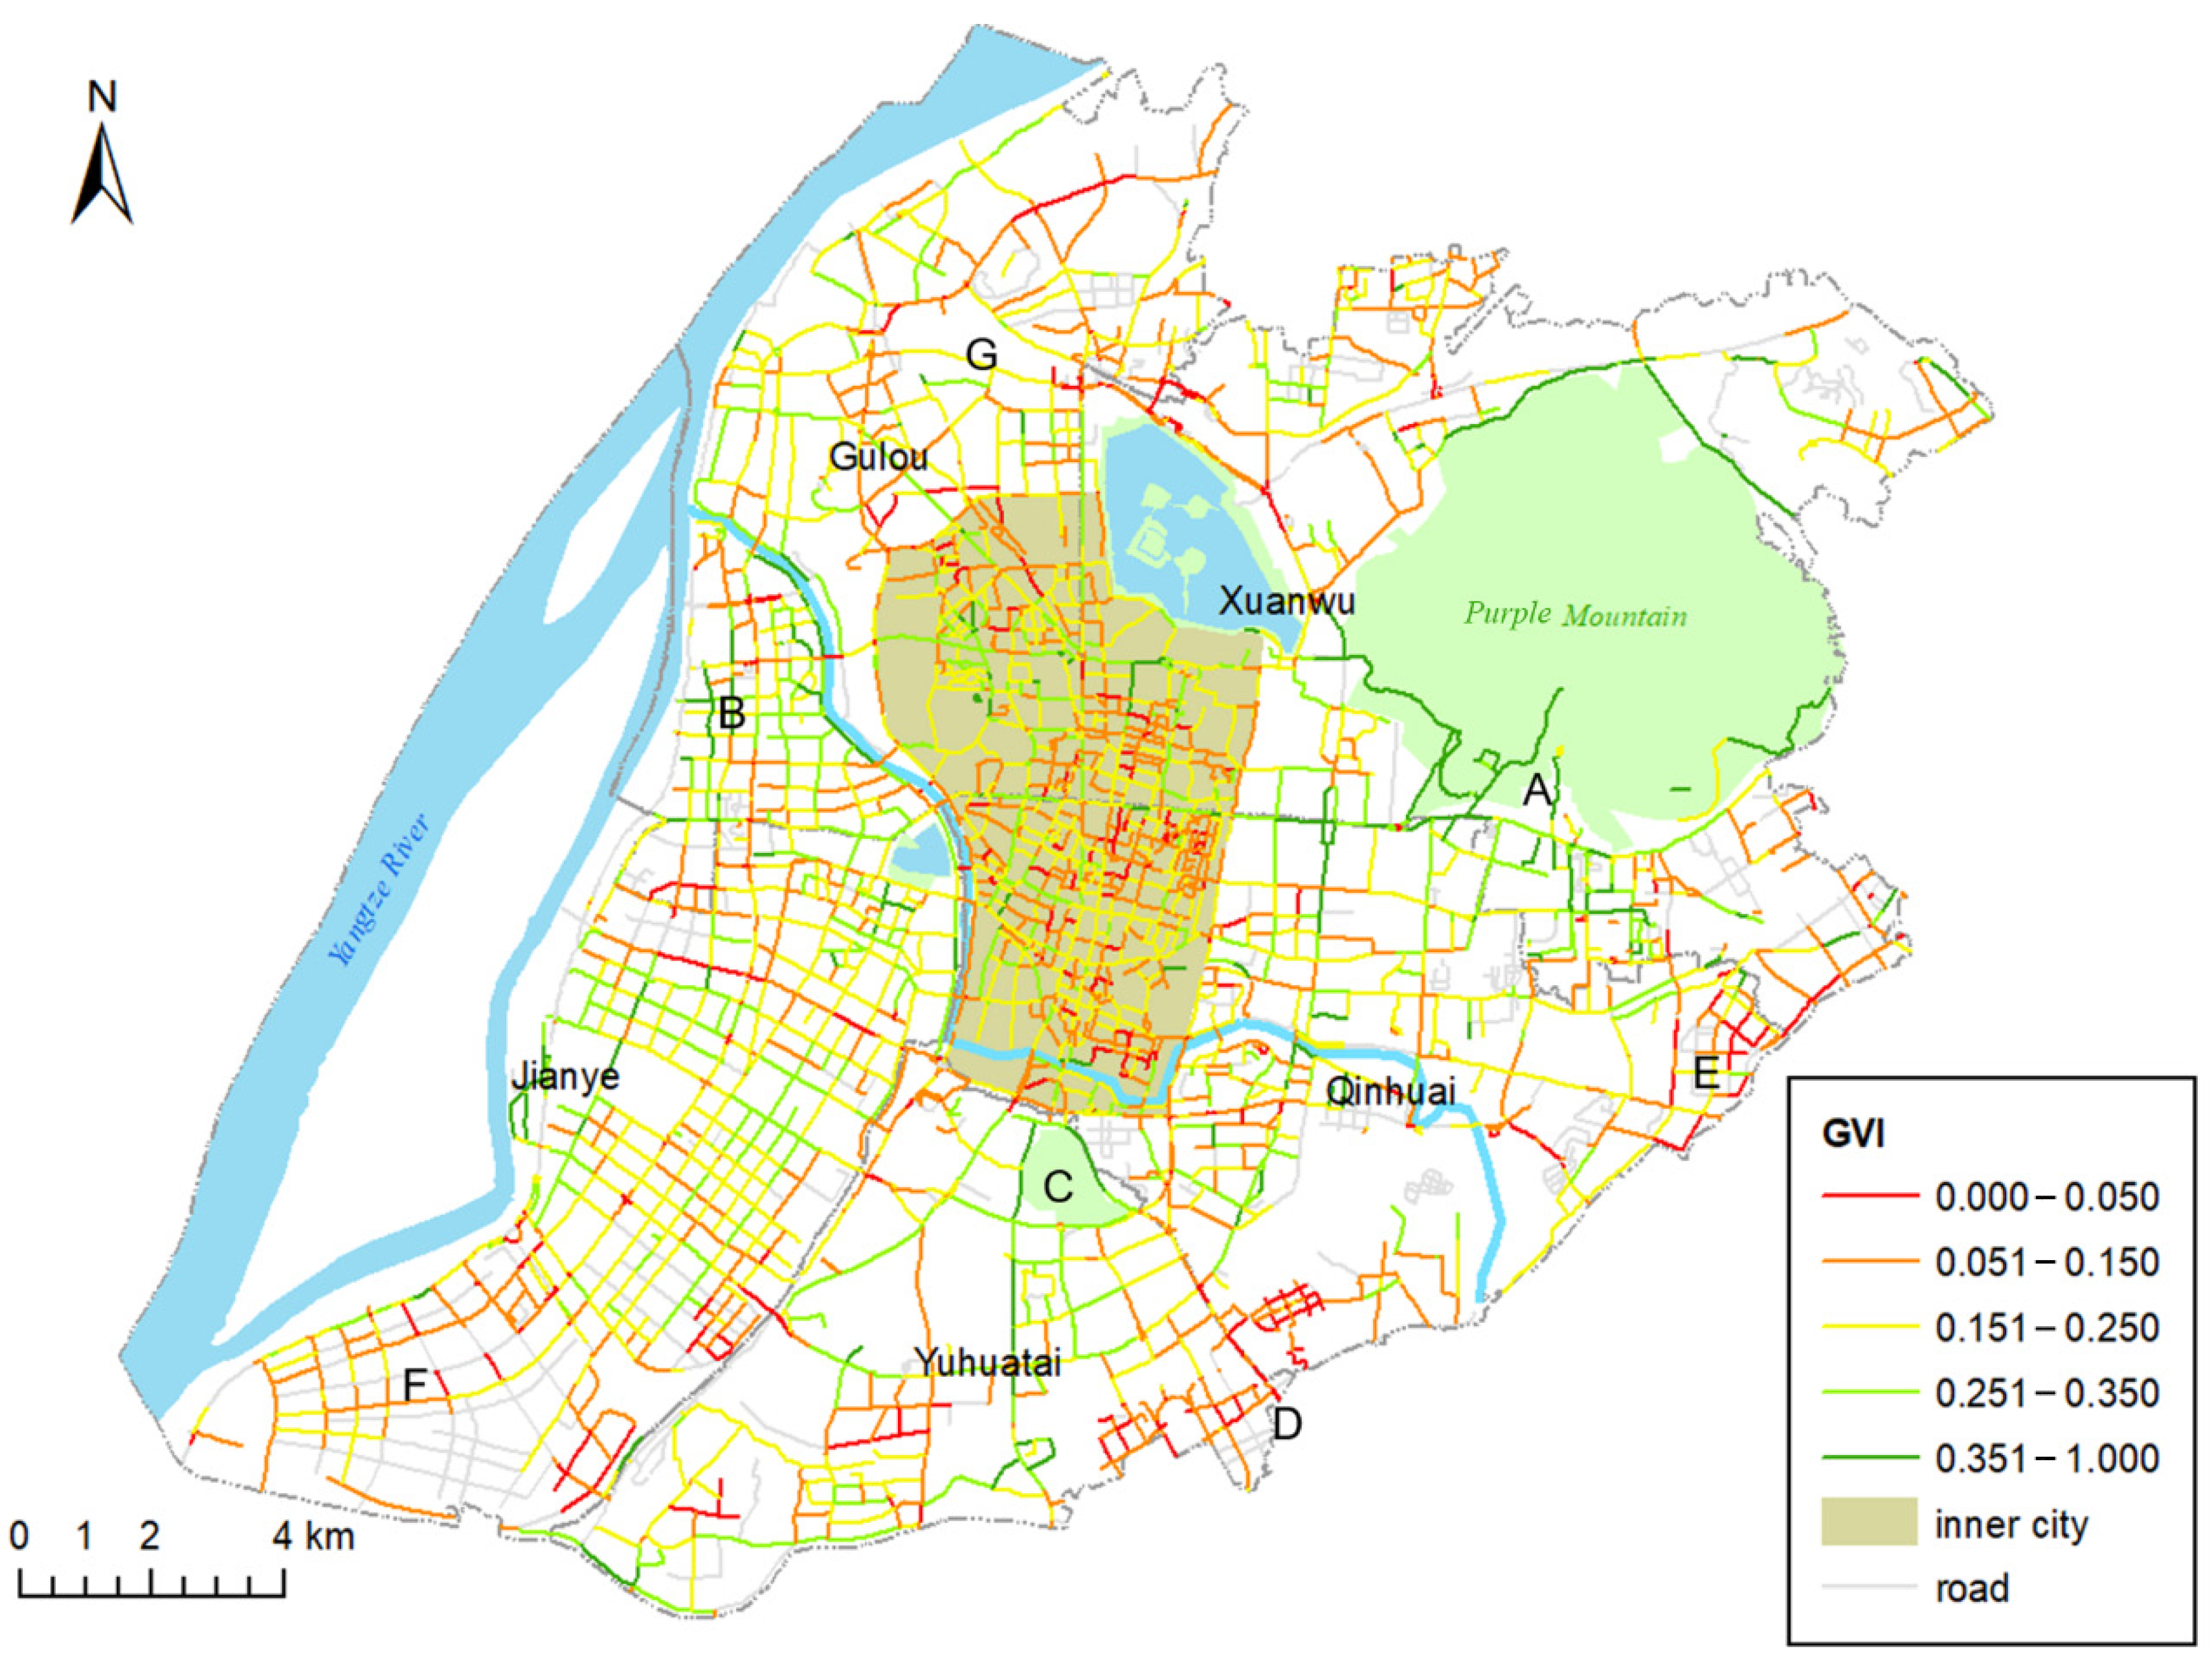
The research was conducted in Nanjing, a city located in the Yangtze River Delta region of Eastern China, which consists of 9 urban districts and two suburban districts. The city has a northern subtropical humid climate and has abundant rainfall in the summer. The population of Nanjing is nearly 8.5 million, and its administrative area is about 6600 km
2. Unlike many megacities in China like Beijing and Shanghai, Nanjing urban areas are situated within the natural landscape and include Purple Mountain, Xuanwu Lake, Yangtze River, and Qinhuai River (
Figure 1). The present studies related to the street greenery assessment in China have mainly focused on Beijing and Shanghai [
27,
36,
37] or one administrative district of Nanjing [
38], whereas the entire urban area of Nanjing is still unexplored.
Therefore, we selected the urban area of Nanjing as the study area, which includes five administrative districts: Gulou, Xuanwu, Jianye, Qinhuai and the northern part of Yuhuatai.
2.2. Data Preprocessing
The road network in the research area was downloaded from OpenStreetMap (OSM), a map platform that can be edited by every user and provides free geodata, including road networks, building footprints and points of interest. Street view images were downloaded from the Tencent Street View (TSV) service, and the satellite images used were Landsat 8 images taken in October 2013 with a 30-m resolution, downloaded from the Geospatial Data Cloud (
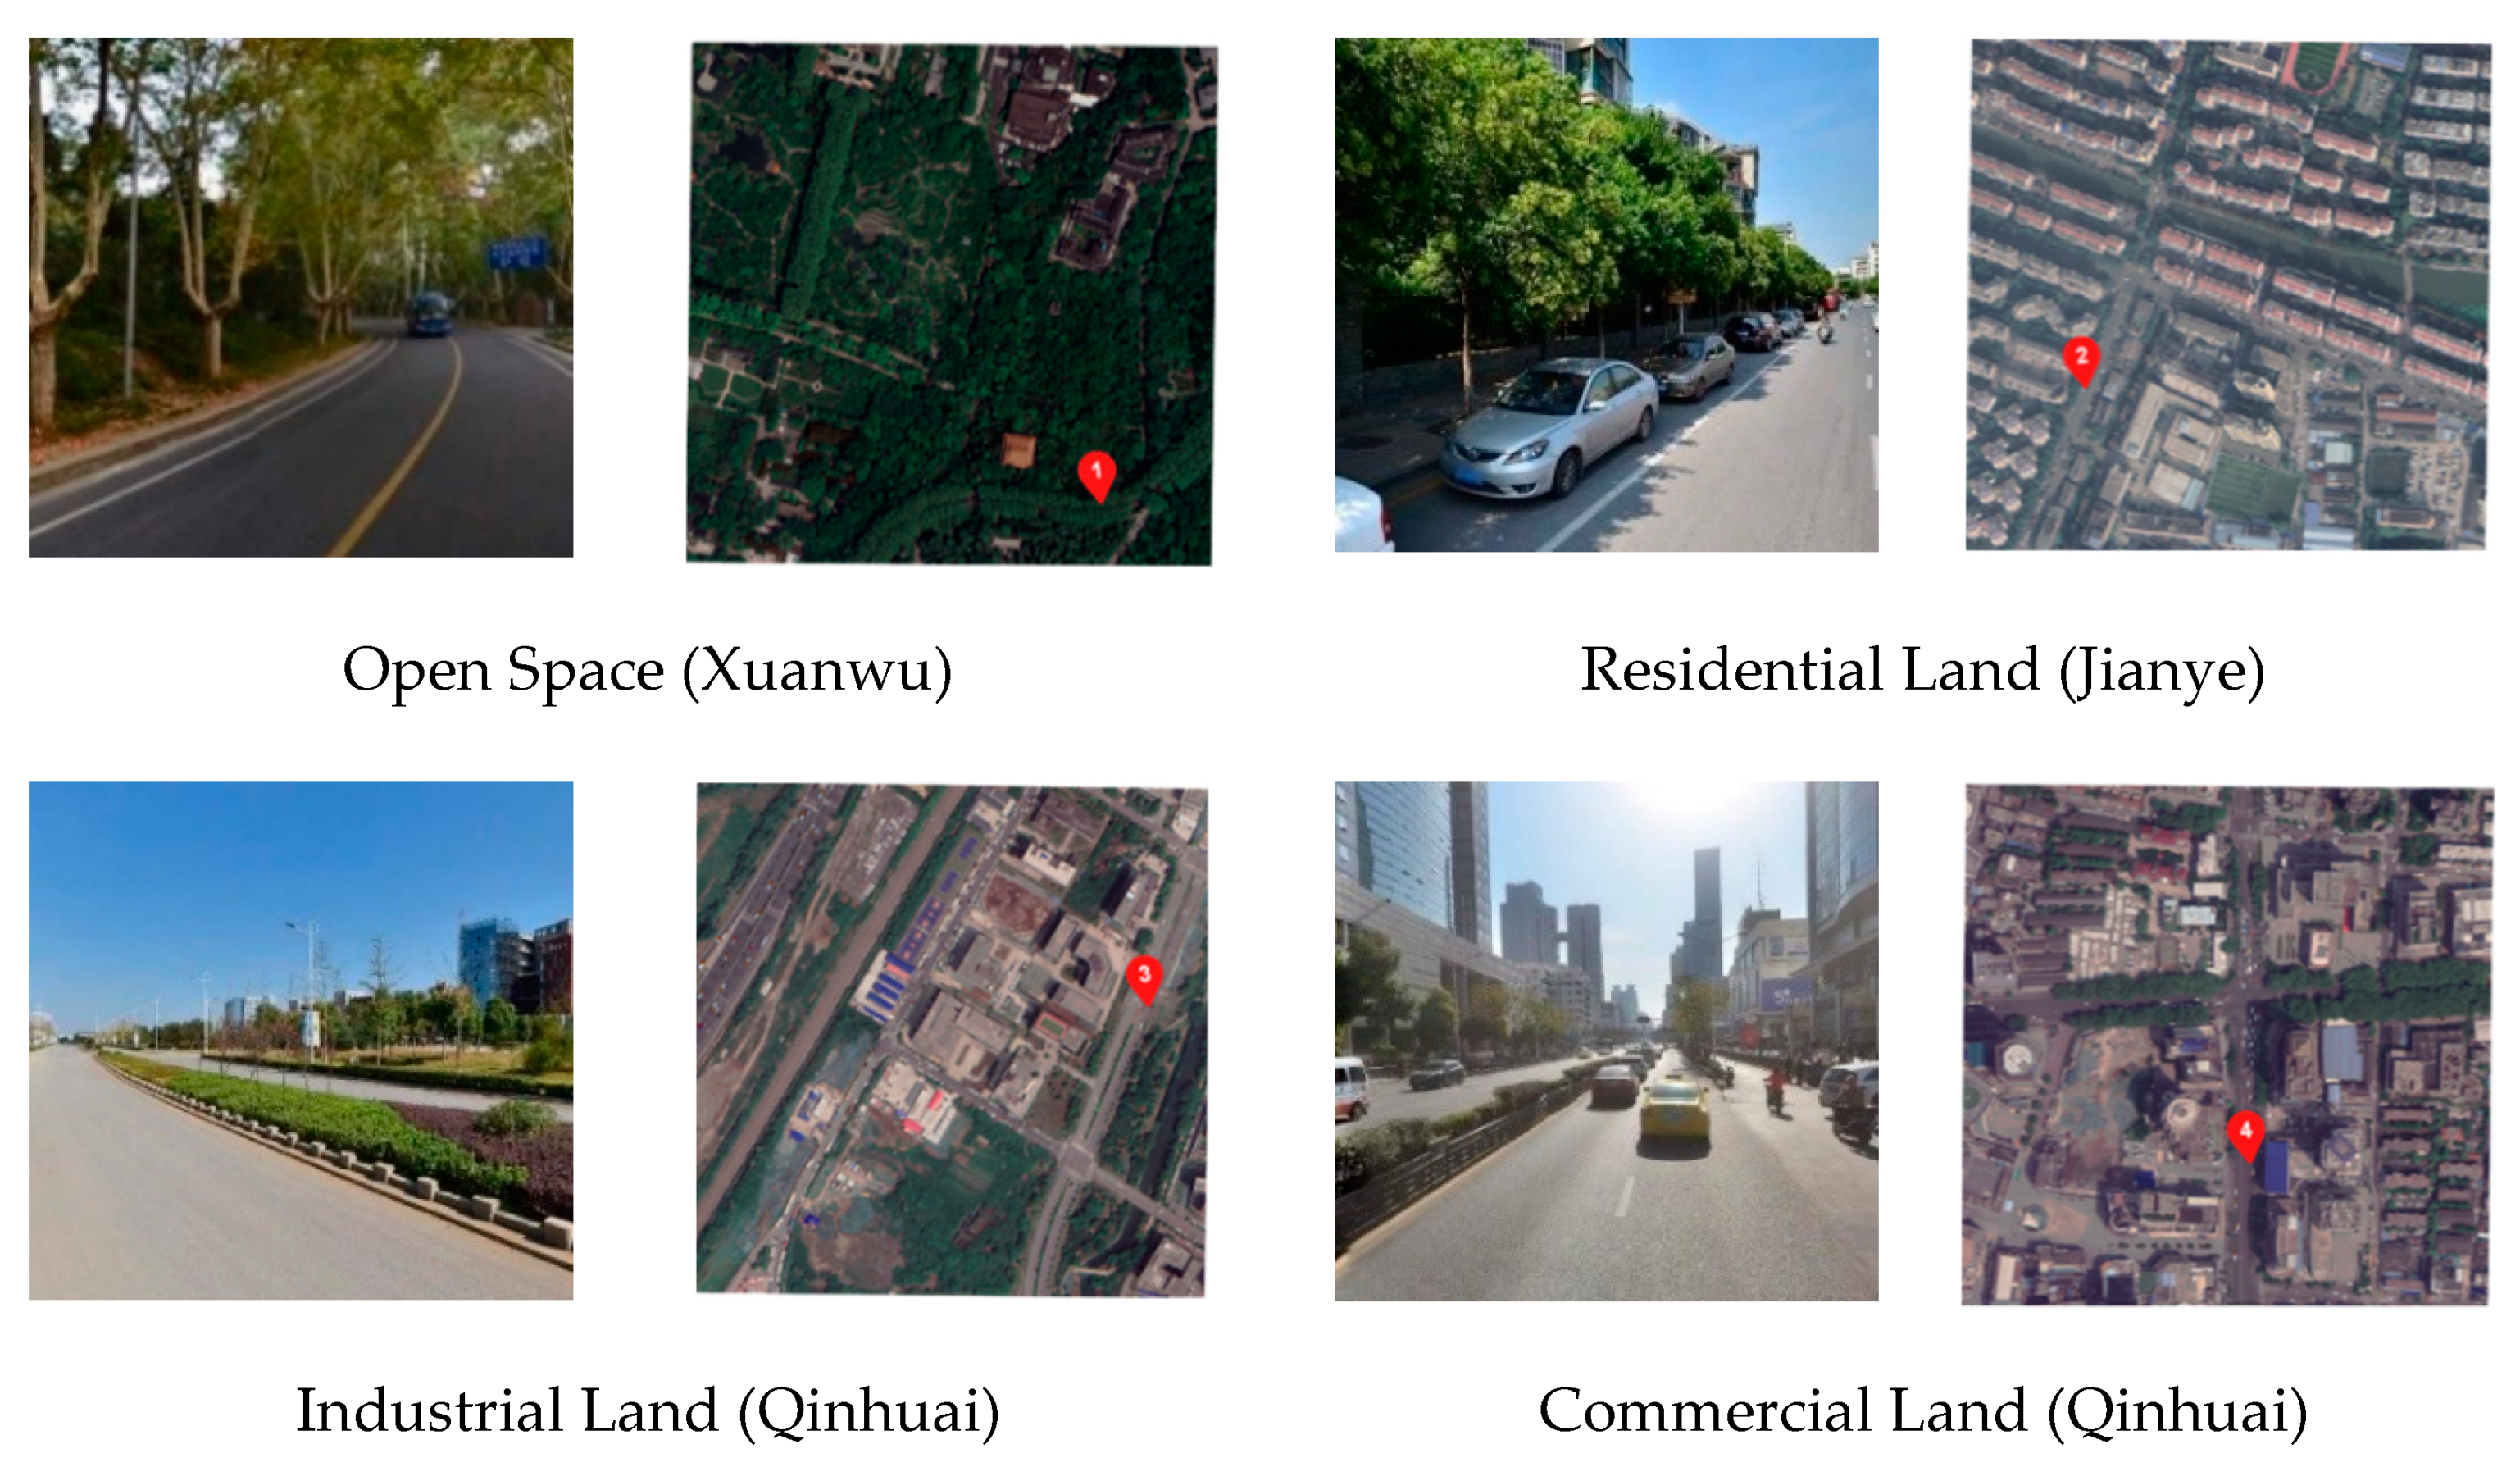
http://www.gscloud.cn). The UFZ data were collected from [
39], which divides the urban area into several grids of 500 m × 500 m, and each grid corresponds to an urban functional type. The urban functional type and grid number of each type are shown in
Table 1, of which open space contains parks, scenic spots and other large open areas.
Since the OSM road data contained some topological and geometrical errors, several steps were needed for road network refinement, and the workflow was as follows:
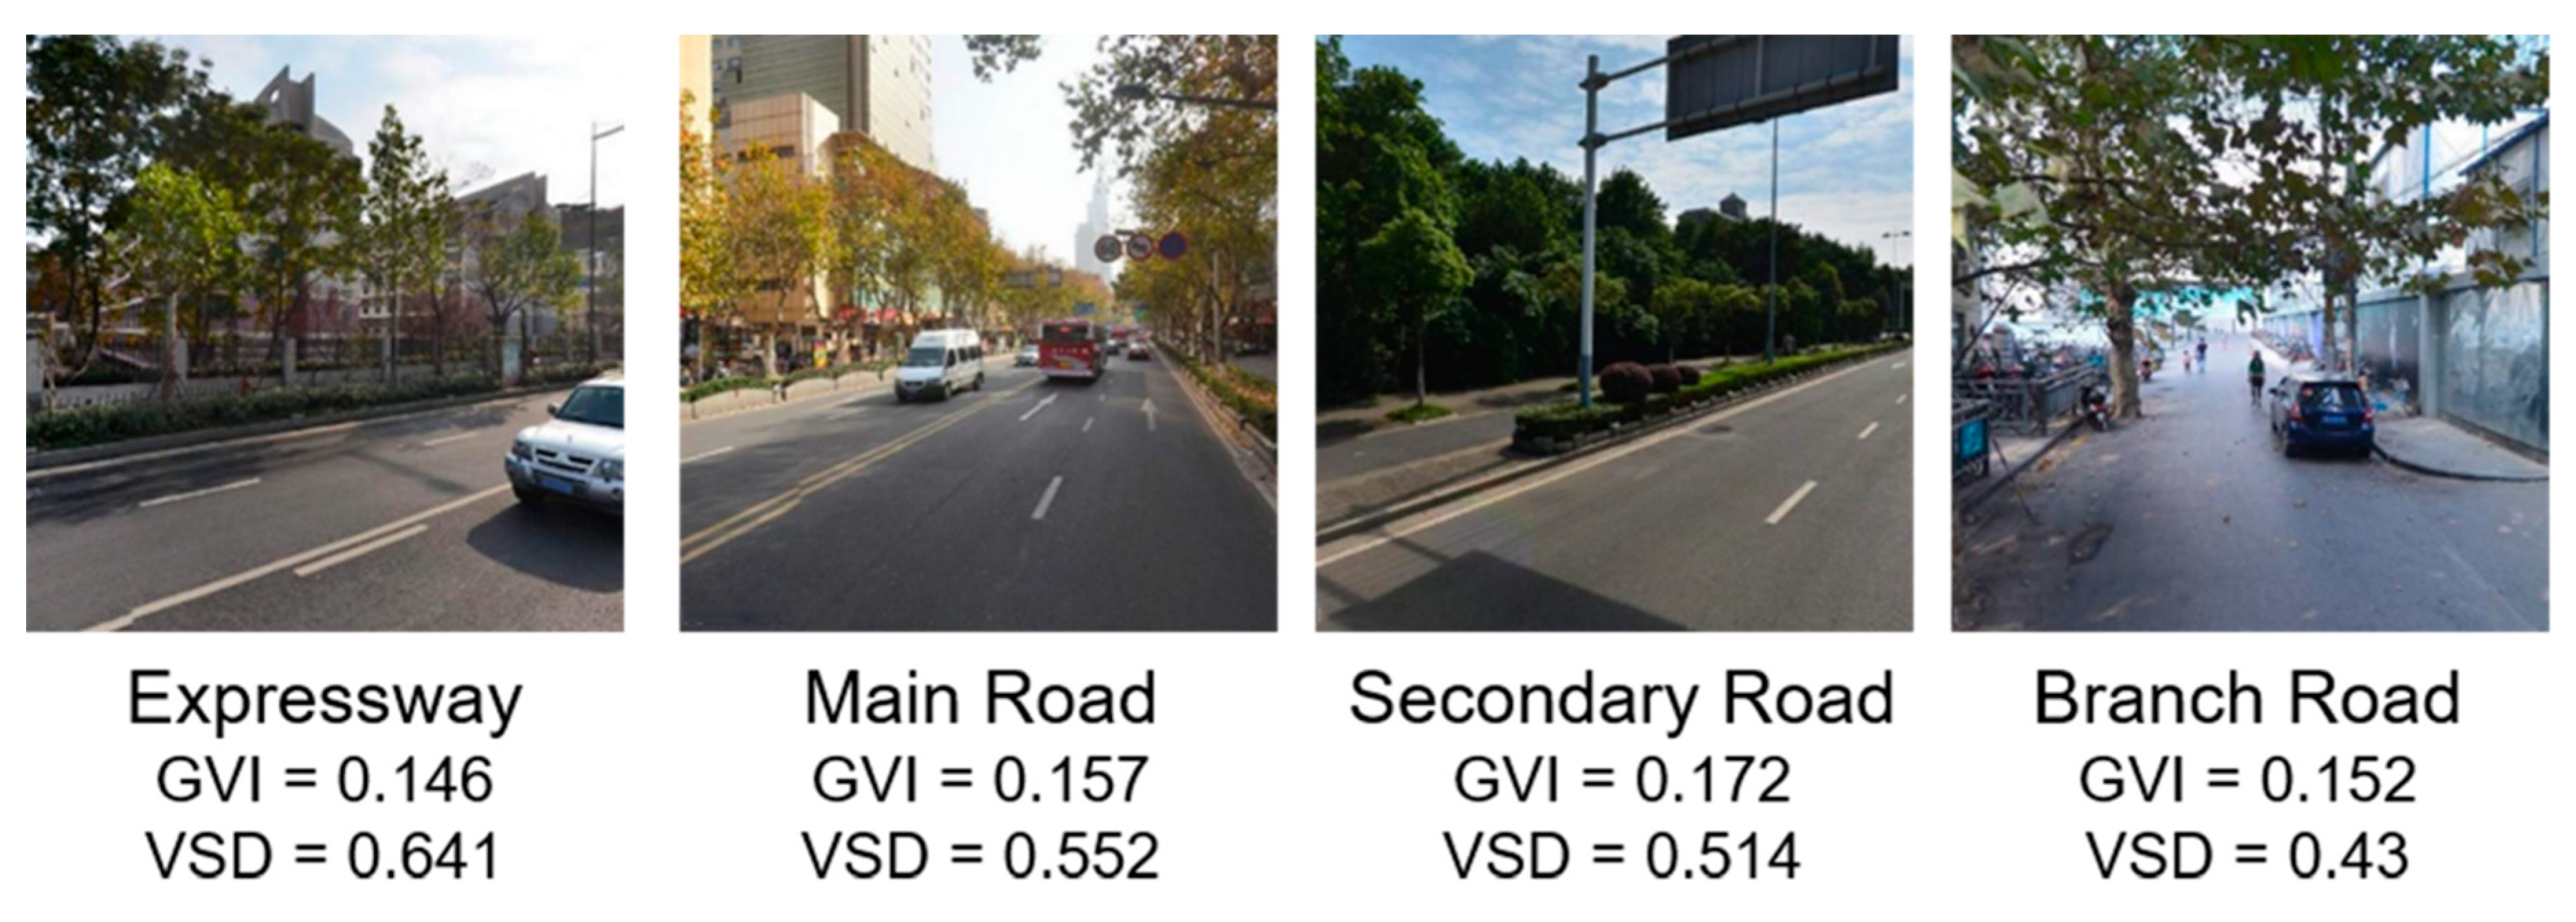
Determination of the road level: Six levels of the road were selected from the OSM data according to the “highway” attribute, including the trunk, primary, secondary, tertiary, residential and living streets. Since the road level classification criterion was not consistent with that used in China, which classifies roads into four categories: expressway, main road, secondary road and branch road, the authors made a corresponding relationship between two classification criteria (
Table 2) and made the road level comply with the Chinese criterion.
Modification of the road geometry: In the road network data, there is a gap between the position of some road segments and the actual positions of the road, which needs to be adjusted manually. The Tencent map was used as a reference for road geometry adjustments, and some large inconsistencies were modified.
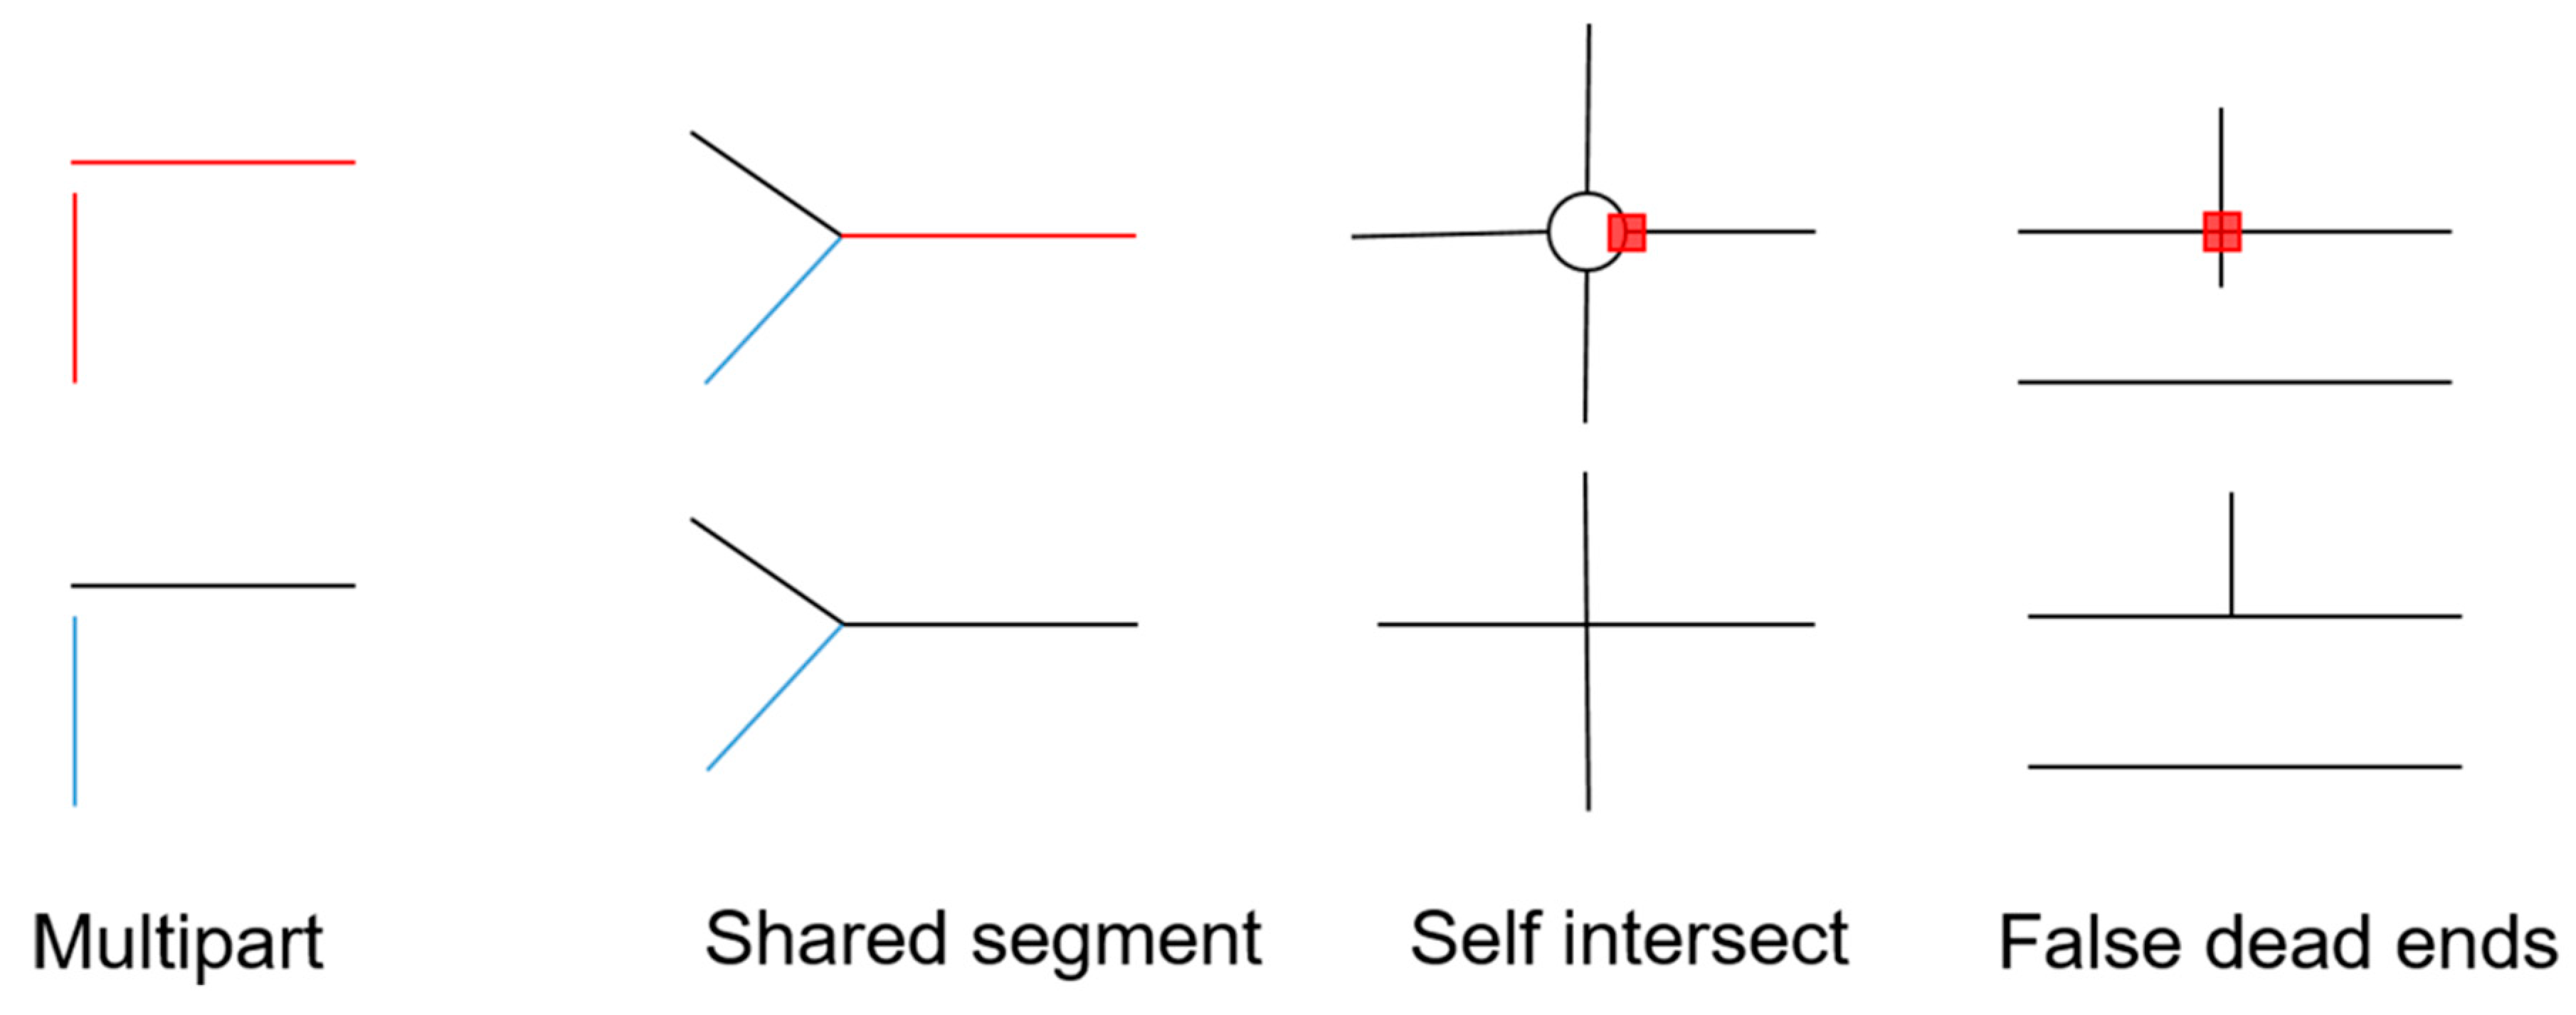
Editing of the topology: Some topology errors, including false dead ends, multipart geometries, self-intersects and shared geometries in the road network, might affect the results of the road merging process. Multipart geometries were separated by the “multipart to single part” tool in ArcGIS, and other errors were fixed manually (
Figure 2).
The merging of multilane roads: Some roads have multiple lanes and complex structures such as viaducts and tunnels, which, in some cases, caused the locations of street view images to be inconsistent with the corresponding lane. Therefore, the “merge divided roads” tool was used to merge the road lanes into a single line.
Generation of sample sites: In order to get street view images by coordinates, sample sites were generated, along with the road network, in 50-m intervals, following previous studies [
26], and then, coordinates of the points were calculated in the WGS-84 coordinate system.
2.3. Extracting Vegetation from TSV Images
Several companies provide online street-view downloading services, and the TSV was chosen for its high image quality and wide coverage of images. The service provides an Application Program Interface (API) for users to download images by passing on a series of parameters, including the location, panoramic ID (panoid), image width, image height, heading, pitch and key. The meanings of the parameters are explained in
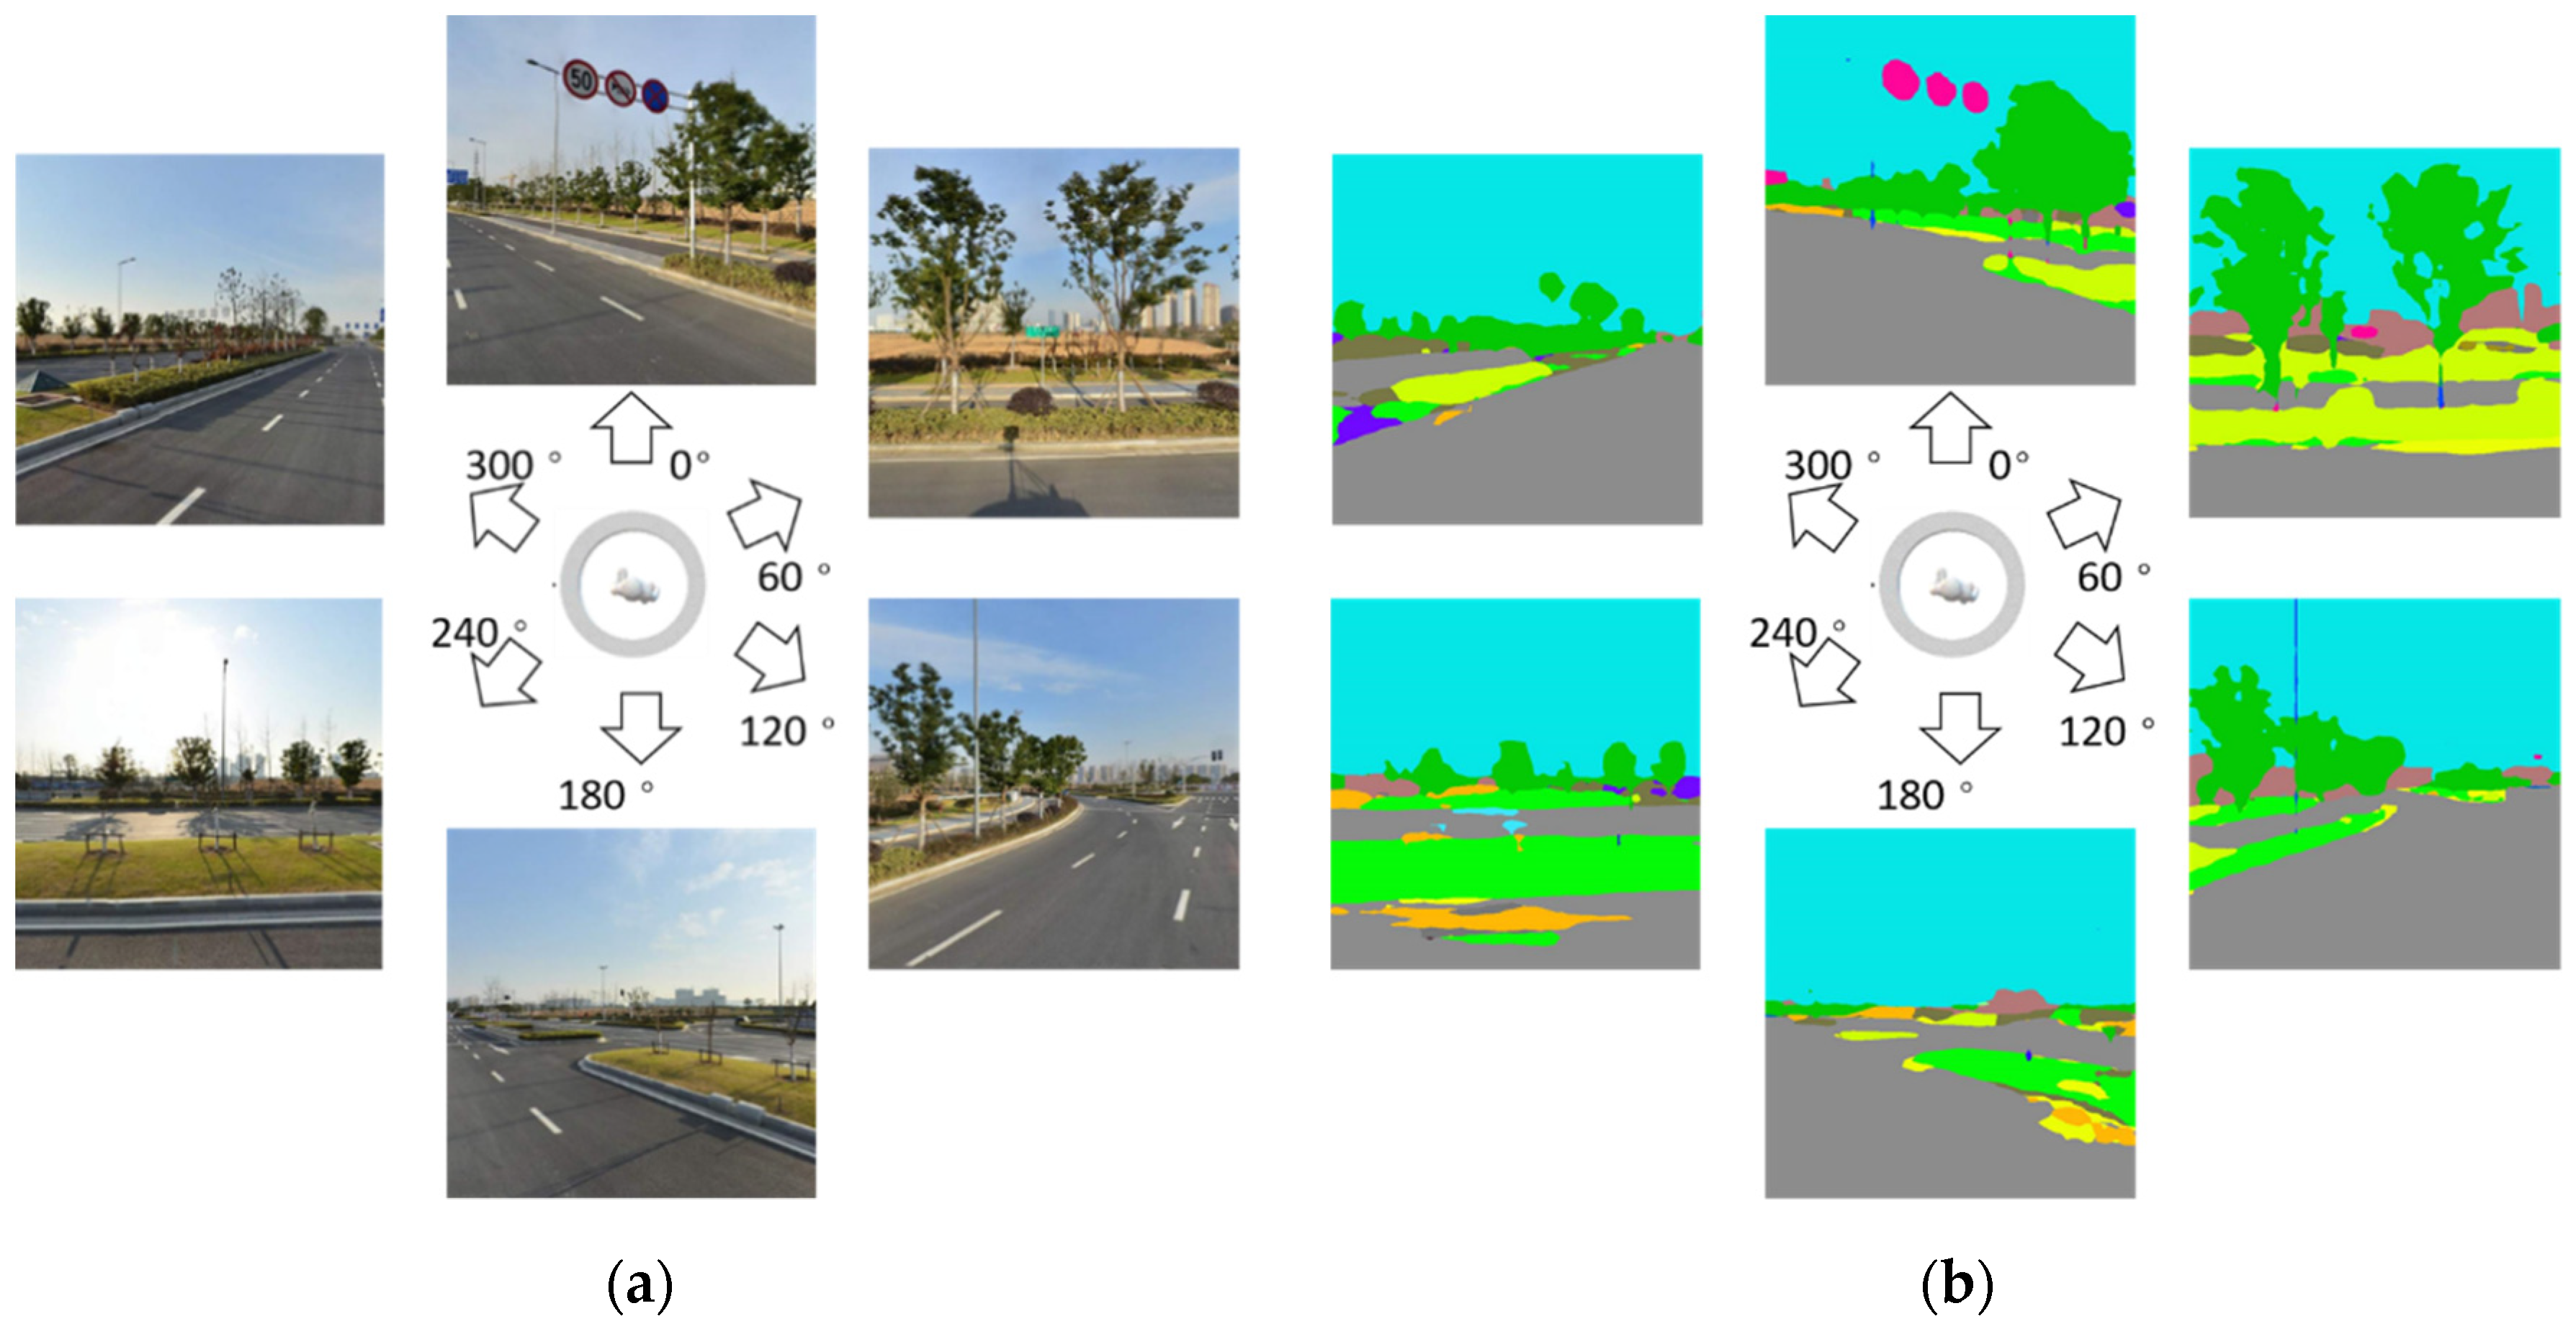
Table 3. The workflow used to obtain the images included the following steps. Firstly, the coordinates of the sample sites were transformed into the coordinates of the Tencent Map. Secondly, panoids were obtained by requesting the “scene information query” API through coordinates. Thirdly, the “street view static image query” API was requested in 6 directions to get 6 street view images of the point (
Figure 3a). The example Uniform Resource Locator (URL) is as follows (The key value should be replaced with the key applied by registered developers):
For each site, the size was set as 600 × 600 (px), the pitch was set to 0 (degree) and the headings were set as 0, 60, 120, 180, 240 and 300 (degrees), respectively.
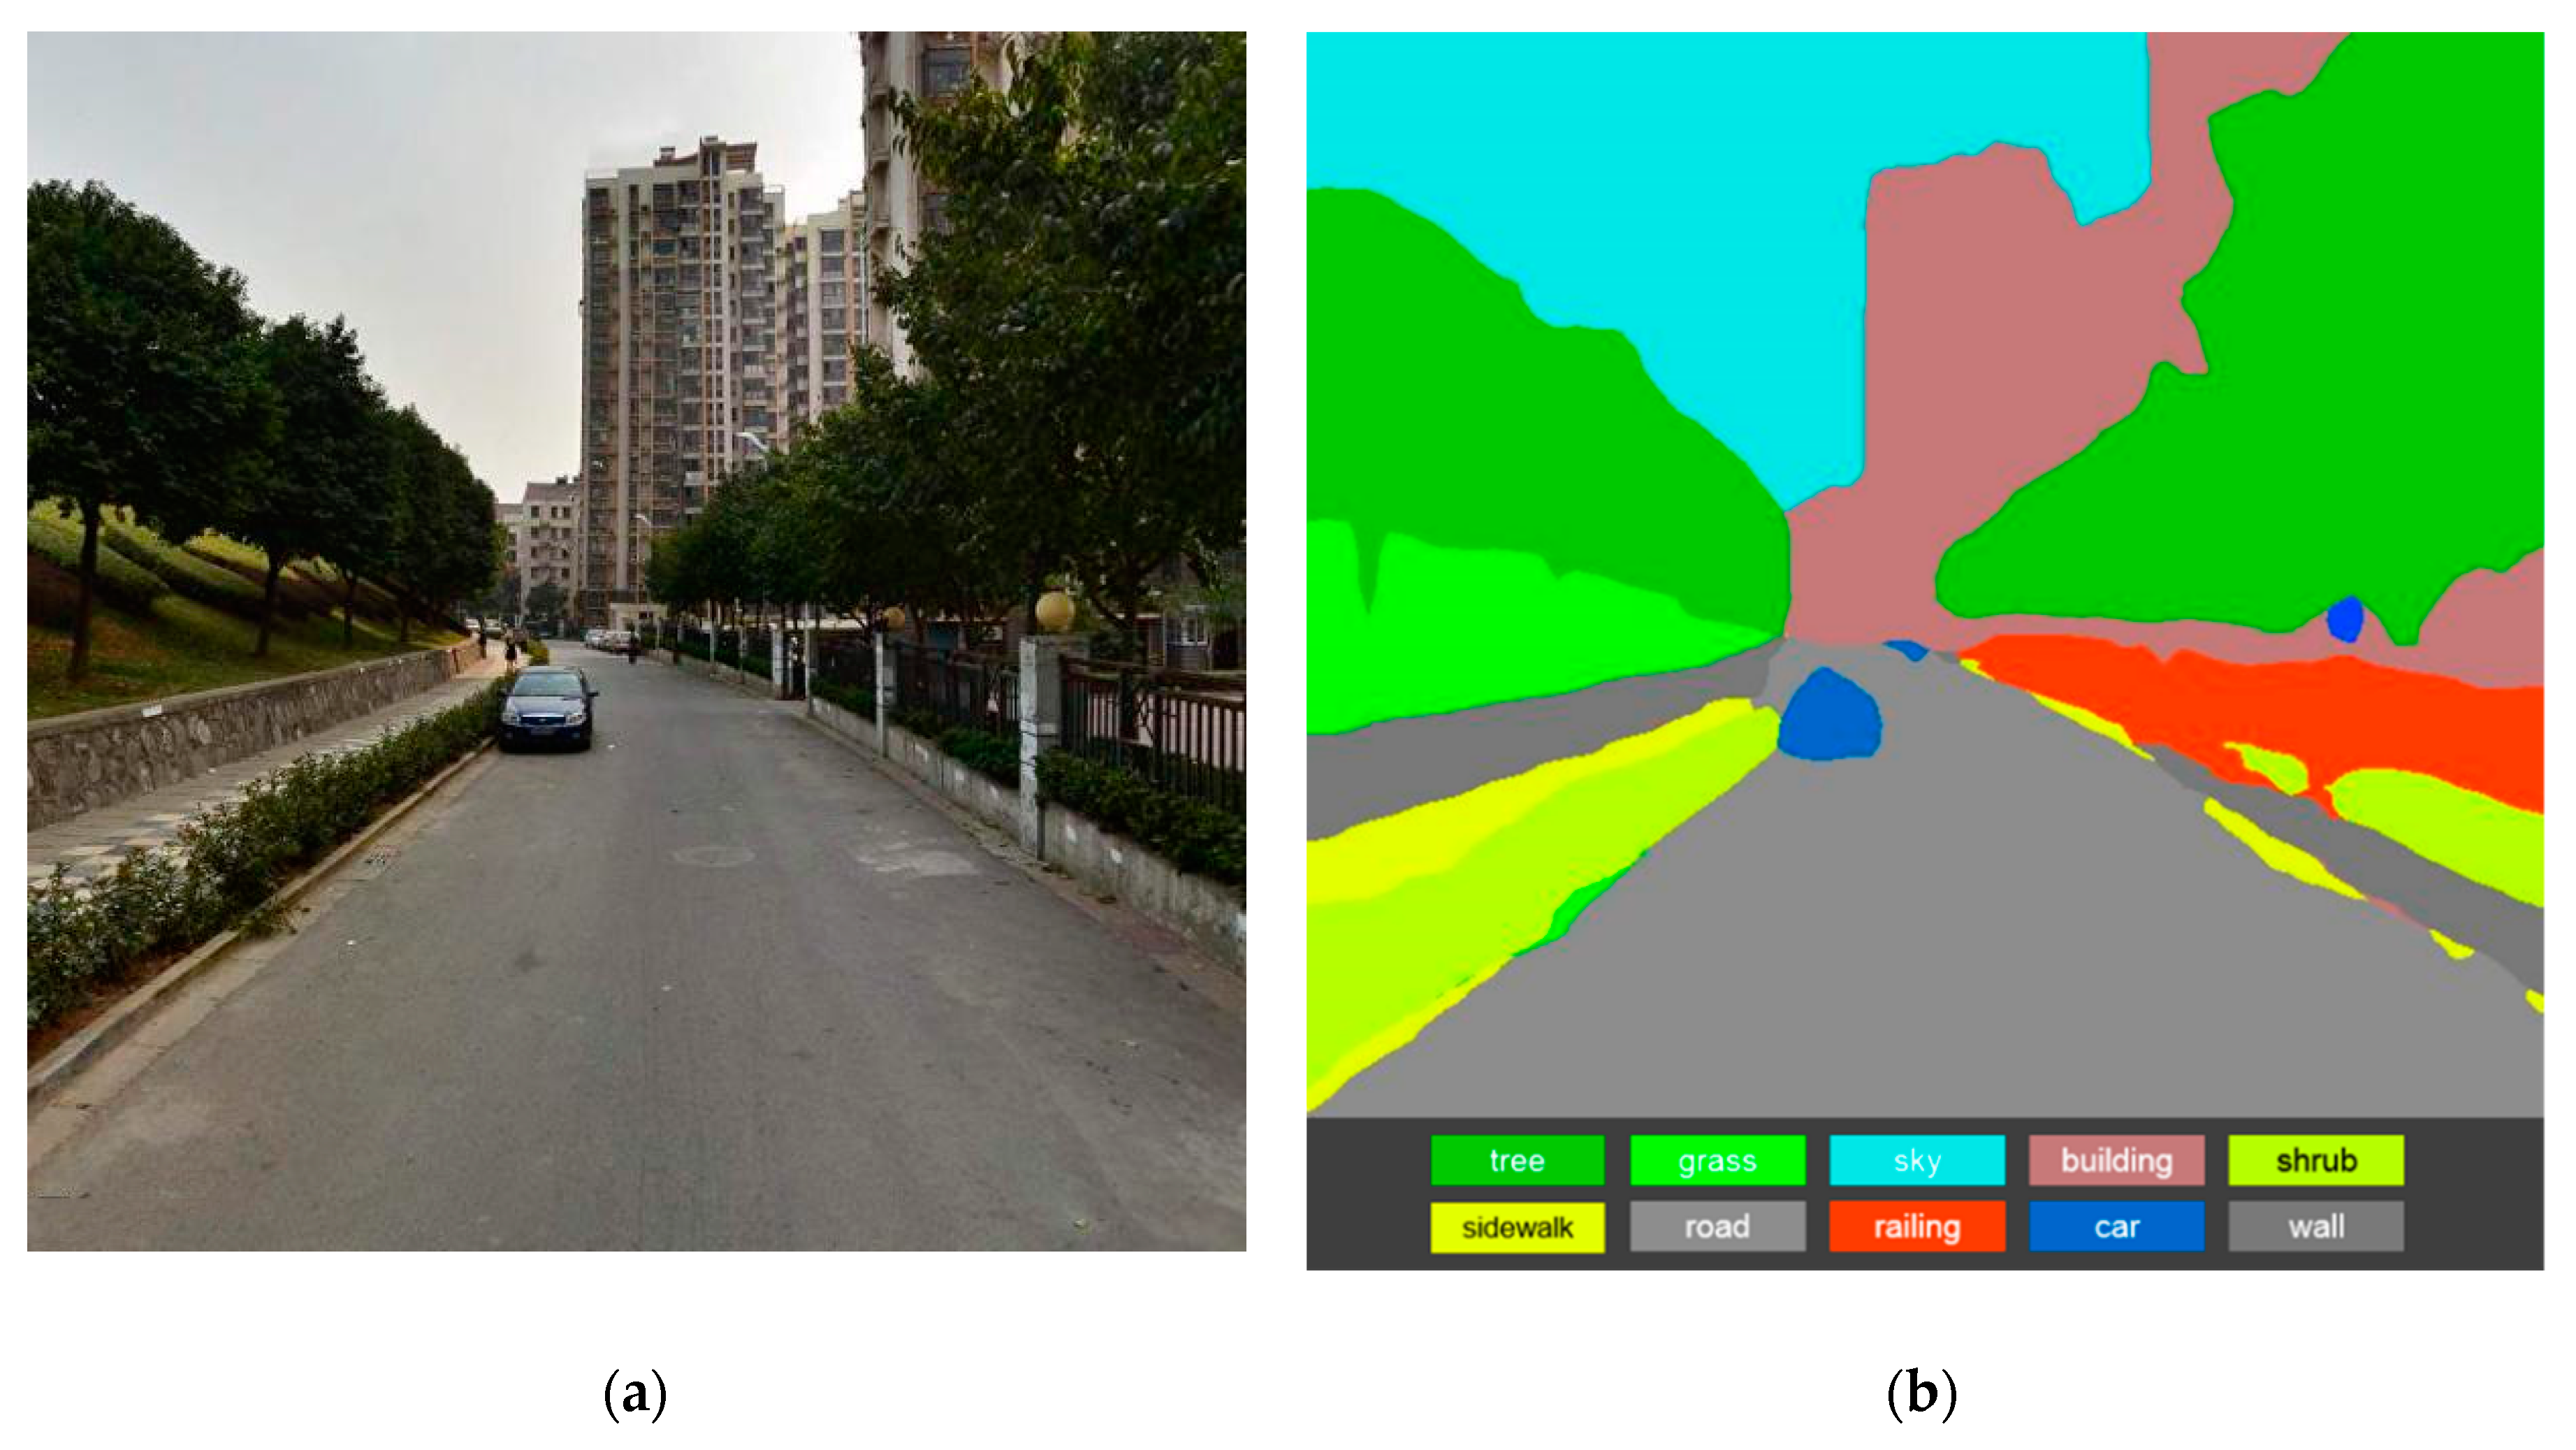
In order to calculate the GVI of each site, the pixels of vegetation needed to be identified from the street view images (
Figure 3b). A semantic segmentation framework, Pyramid Scene Parsing Network (PSPNet), was used to extract vegetation from images. This framework can accomplish pixel-level prediction tasks and achieve state-of-the-art performances on various datasets [
40]. It uses a Convolutional Neural Network (CNN) to extract the features of the image and a pyramid pooling module to obtain different scales of feature representations. After the process of upsampling and concatenation, the final prediction is output from the last convolutional layer. With the picture fed into, the network predicts each image pixel category, such as tree, sky or building. Here, we used a pretrained model on the labeled dataset ADE20K [
41] and made predictions on all images. An example of a segmentation result by PSPNet is shown in
Figure 4. In this picture, different vegetation types are distinguished, making it possible to analyze the vegetation composition and diversity.
2.4. Assessing Street Greenery through Multiple Indicators
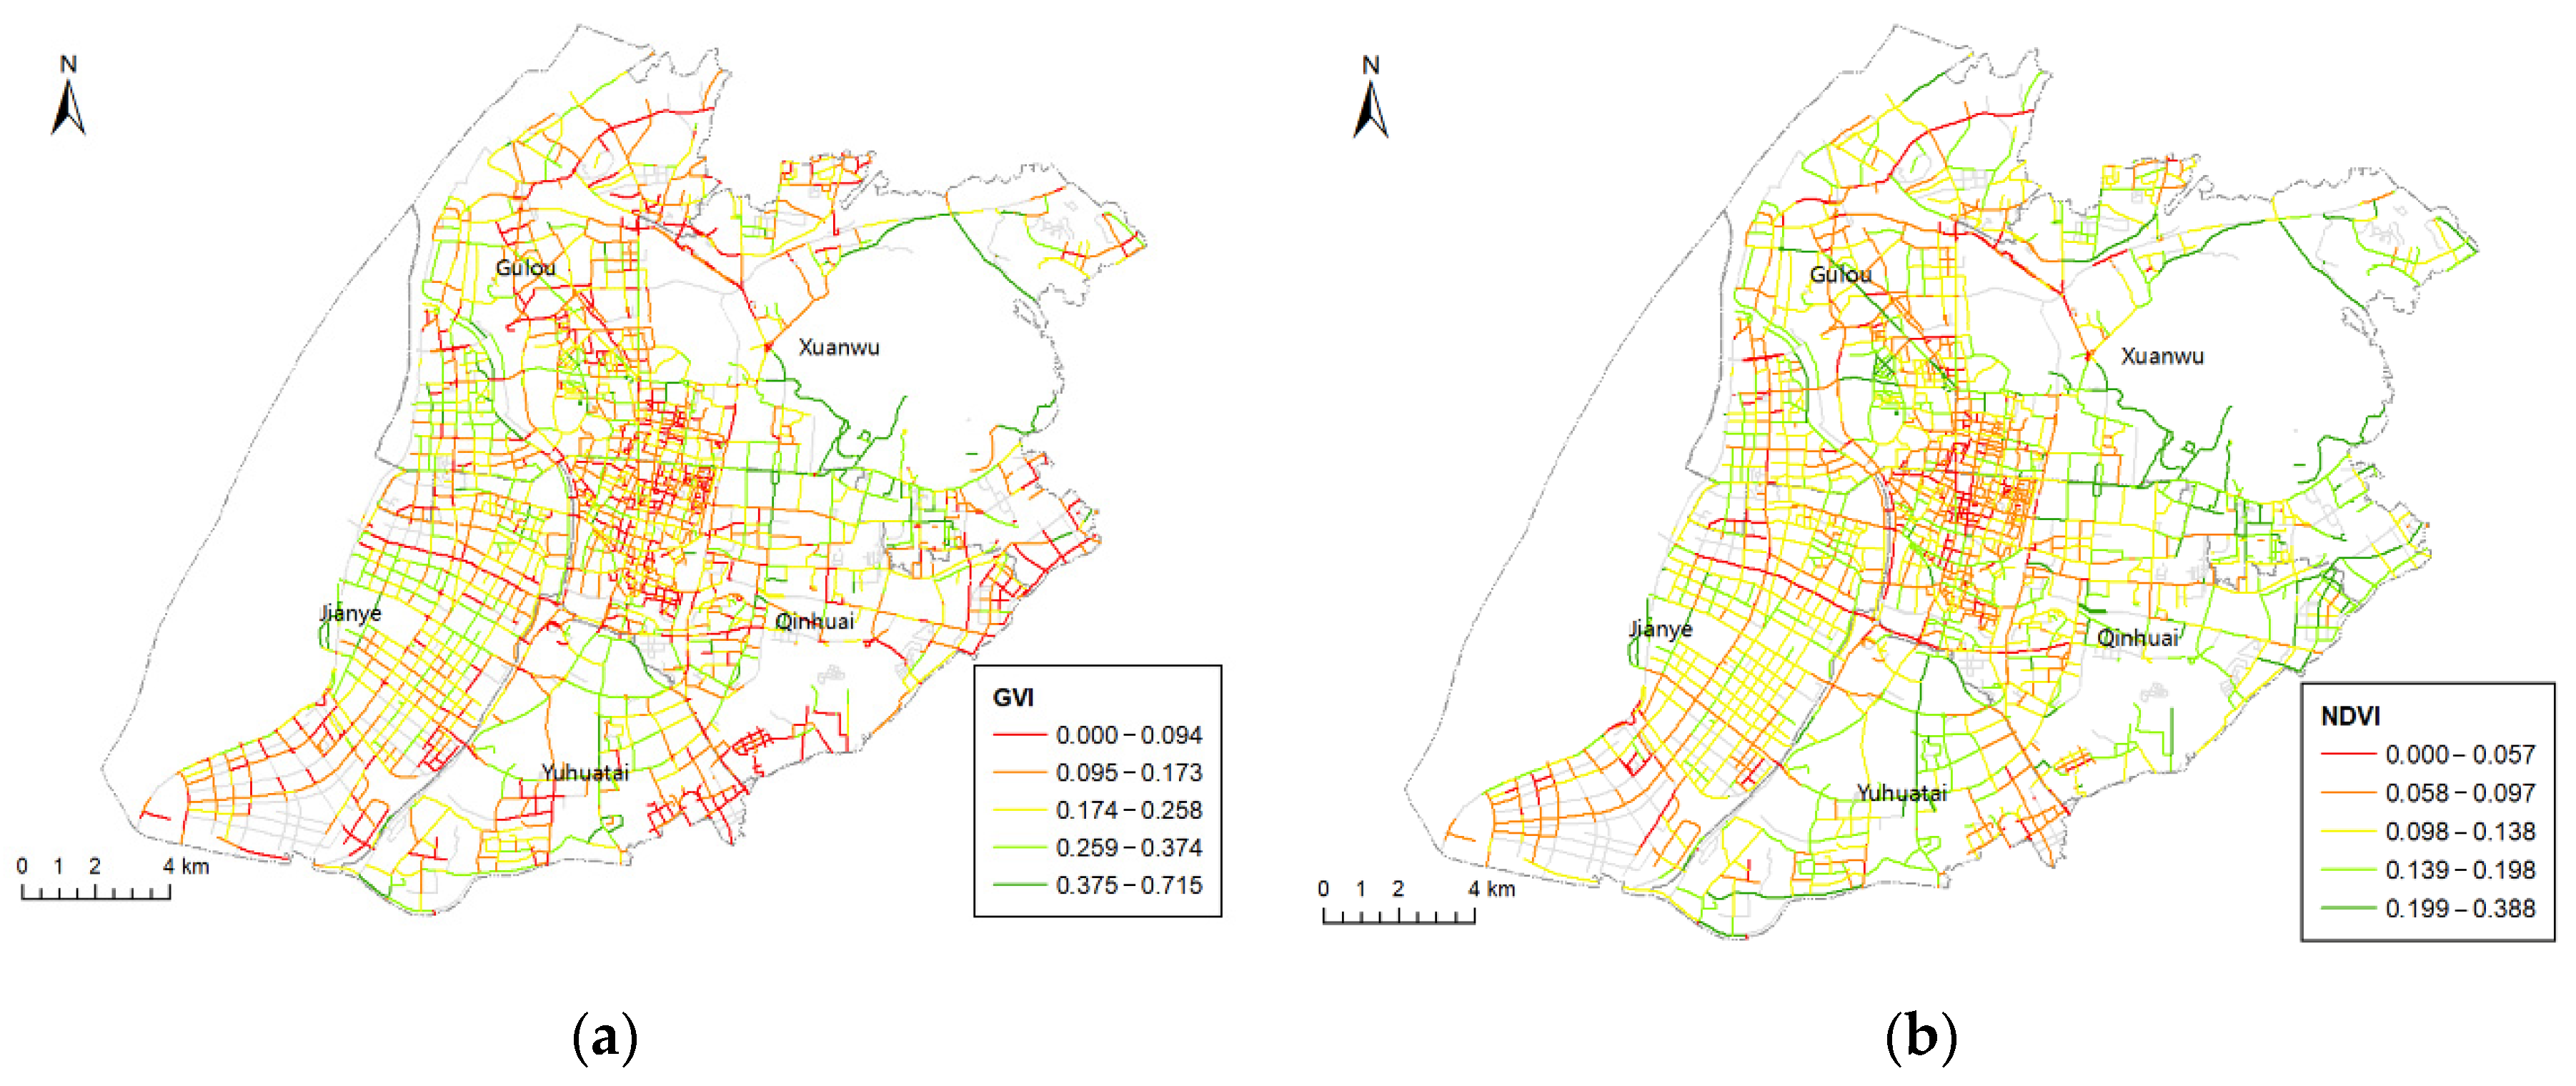
To assess street greenery in multiple aspects, three different indicators were used: the GVI, NDVI and VSD.
The GVI is an indicator that measures the relative quantity of vegetation in the human visual field. The GVI of each point on the street can be calculated by dividing the vegetation pixel count by the total pixel count of the image and then averaging the results from all pictures taken at the site [
13] (Equation (1)).
indicates the green view index (), and N is the number of images on the site ( some sites have less than six pictures). are counts of pixels representing trees, shrubs and lawns, respectively, and is the pixel count of the whole image.
The NDVI is used to measure greenery from an overhead perspective based on the different wavelengths of the light absorbed by green plant canopies [
37]. It can be calculated by Equation (2), where
R indicates the red band, and
NIR indicates the near-infrared band.
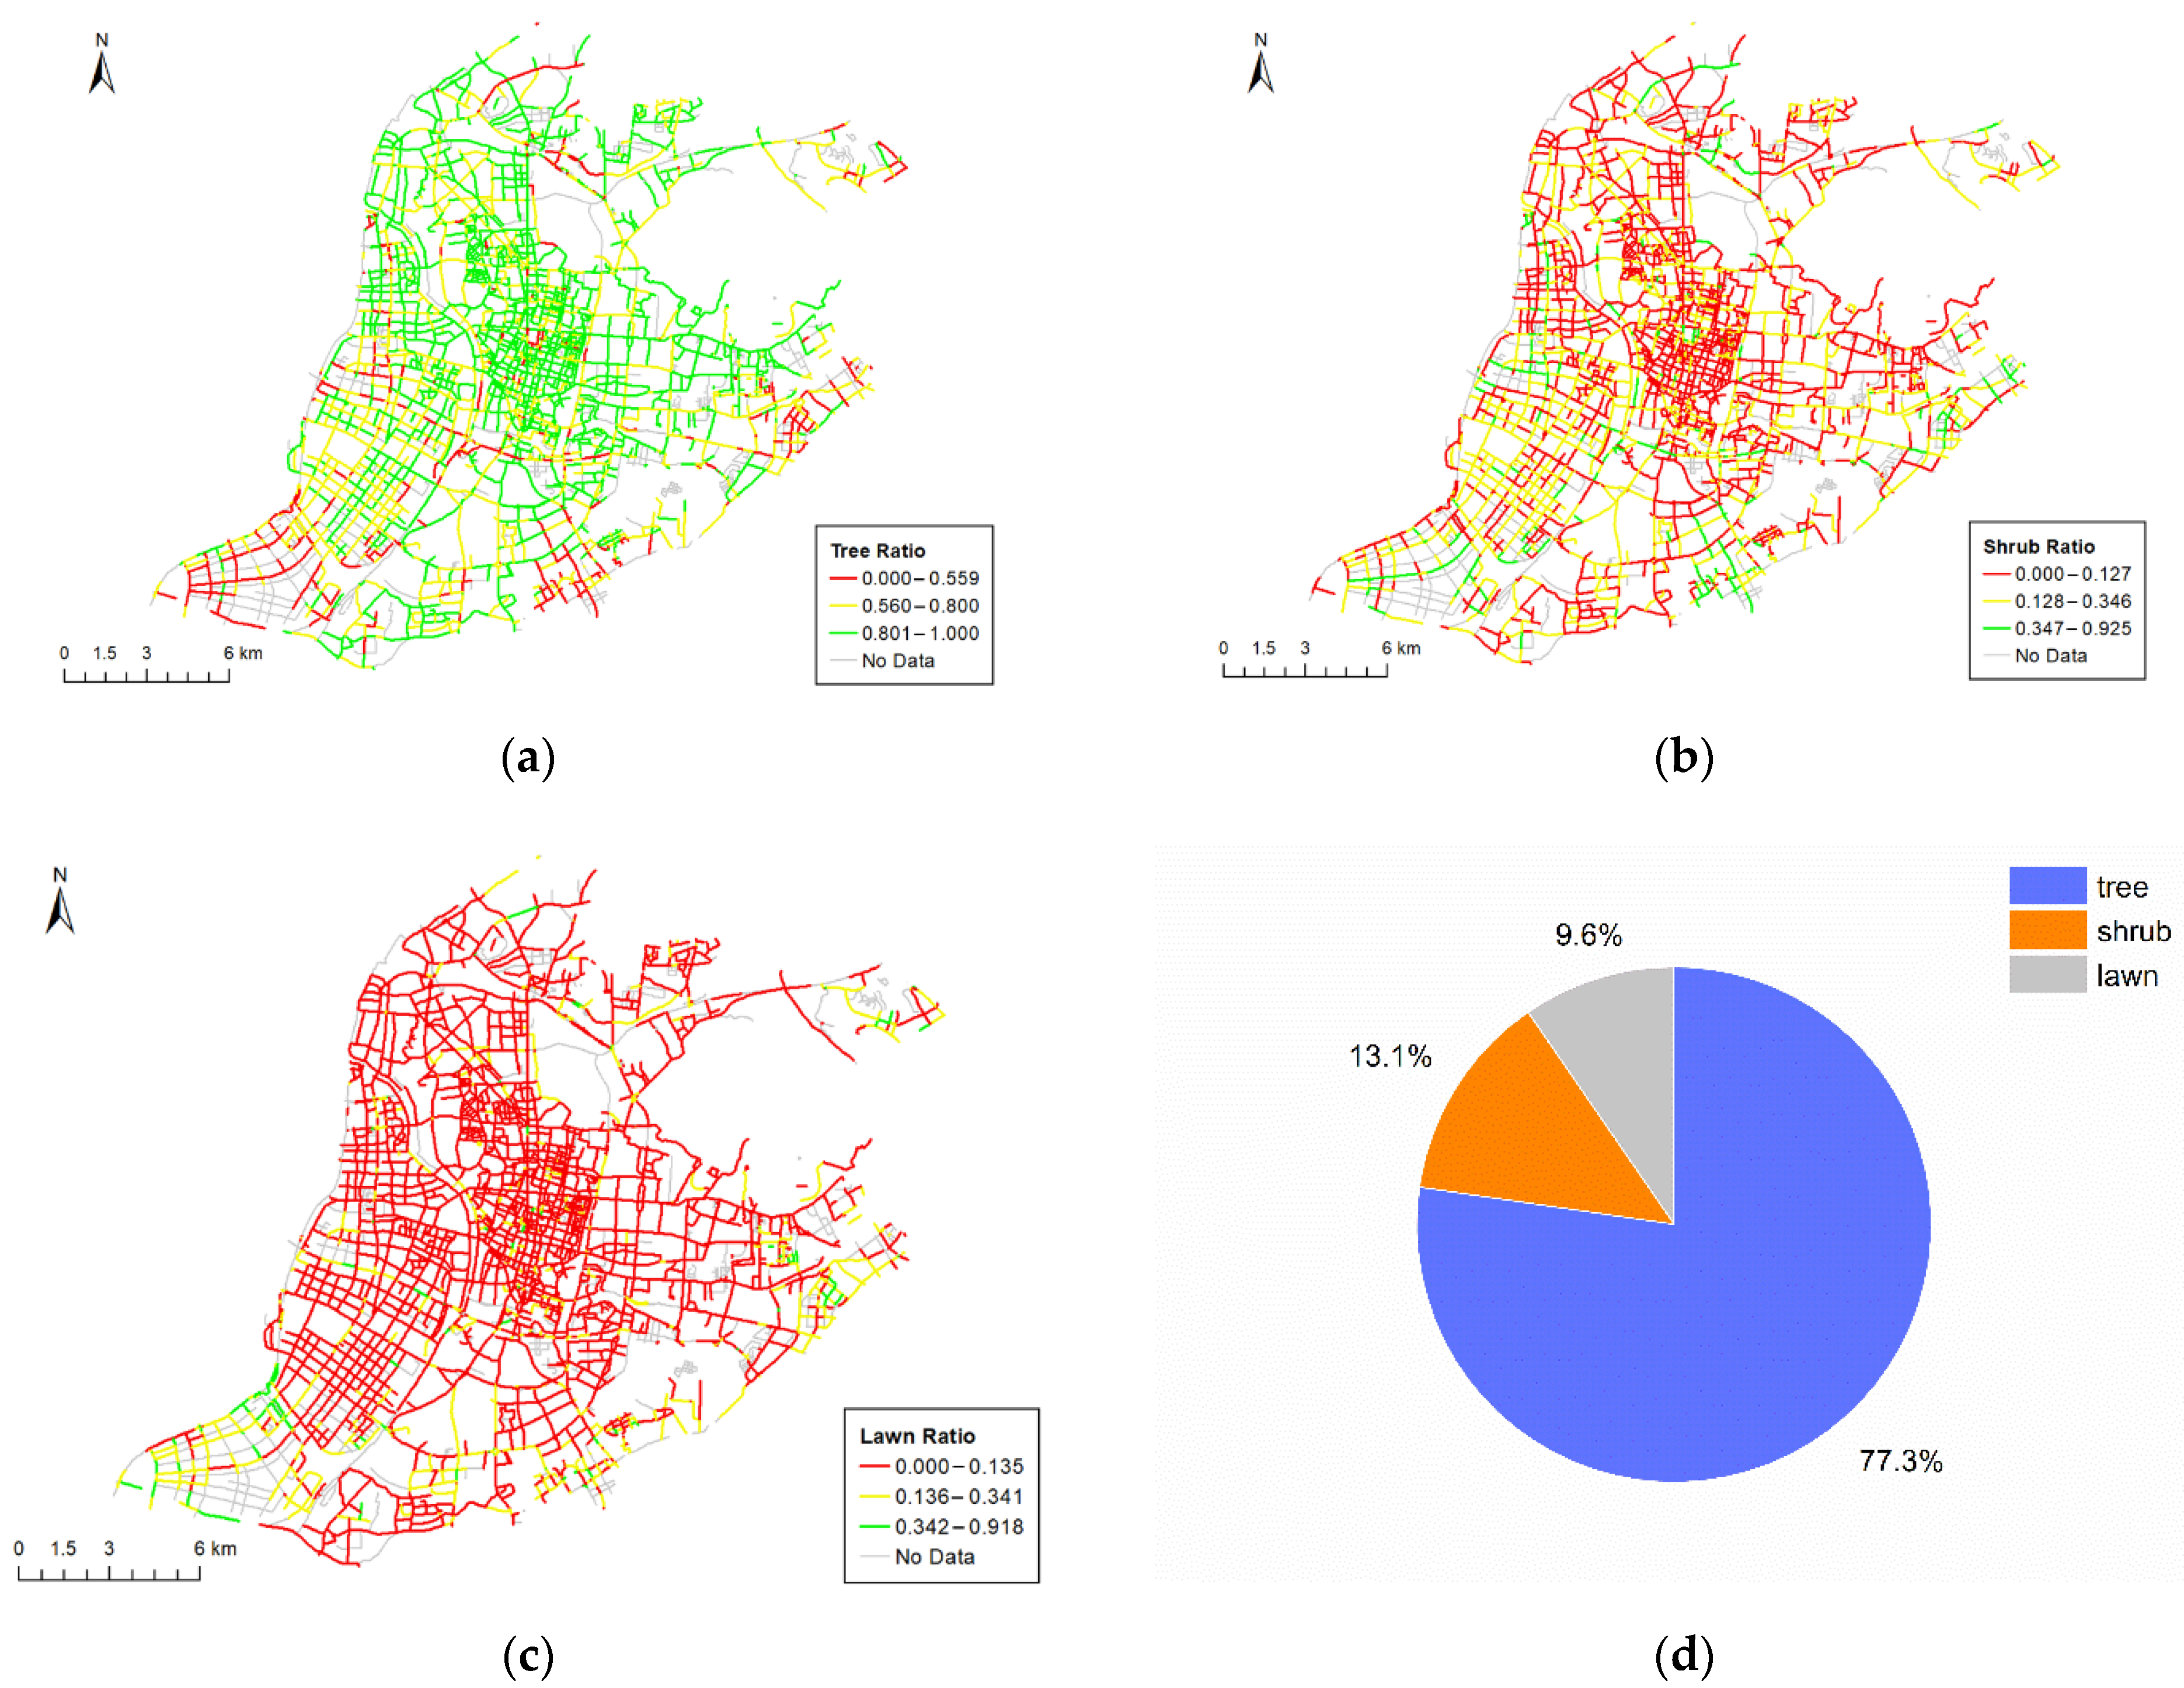
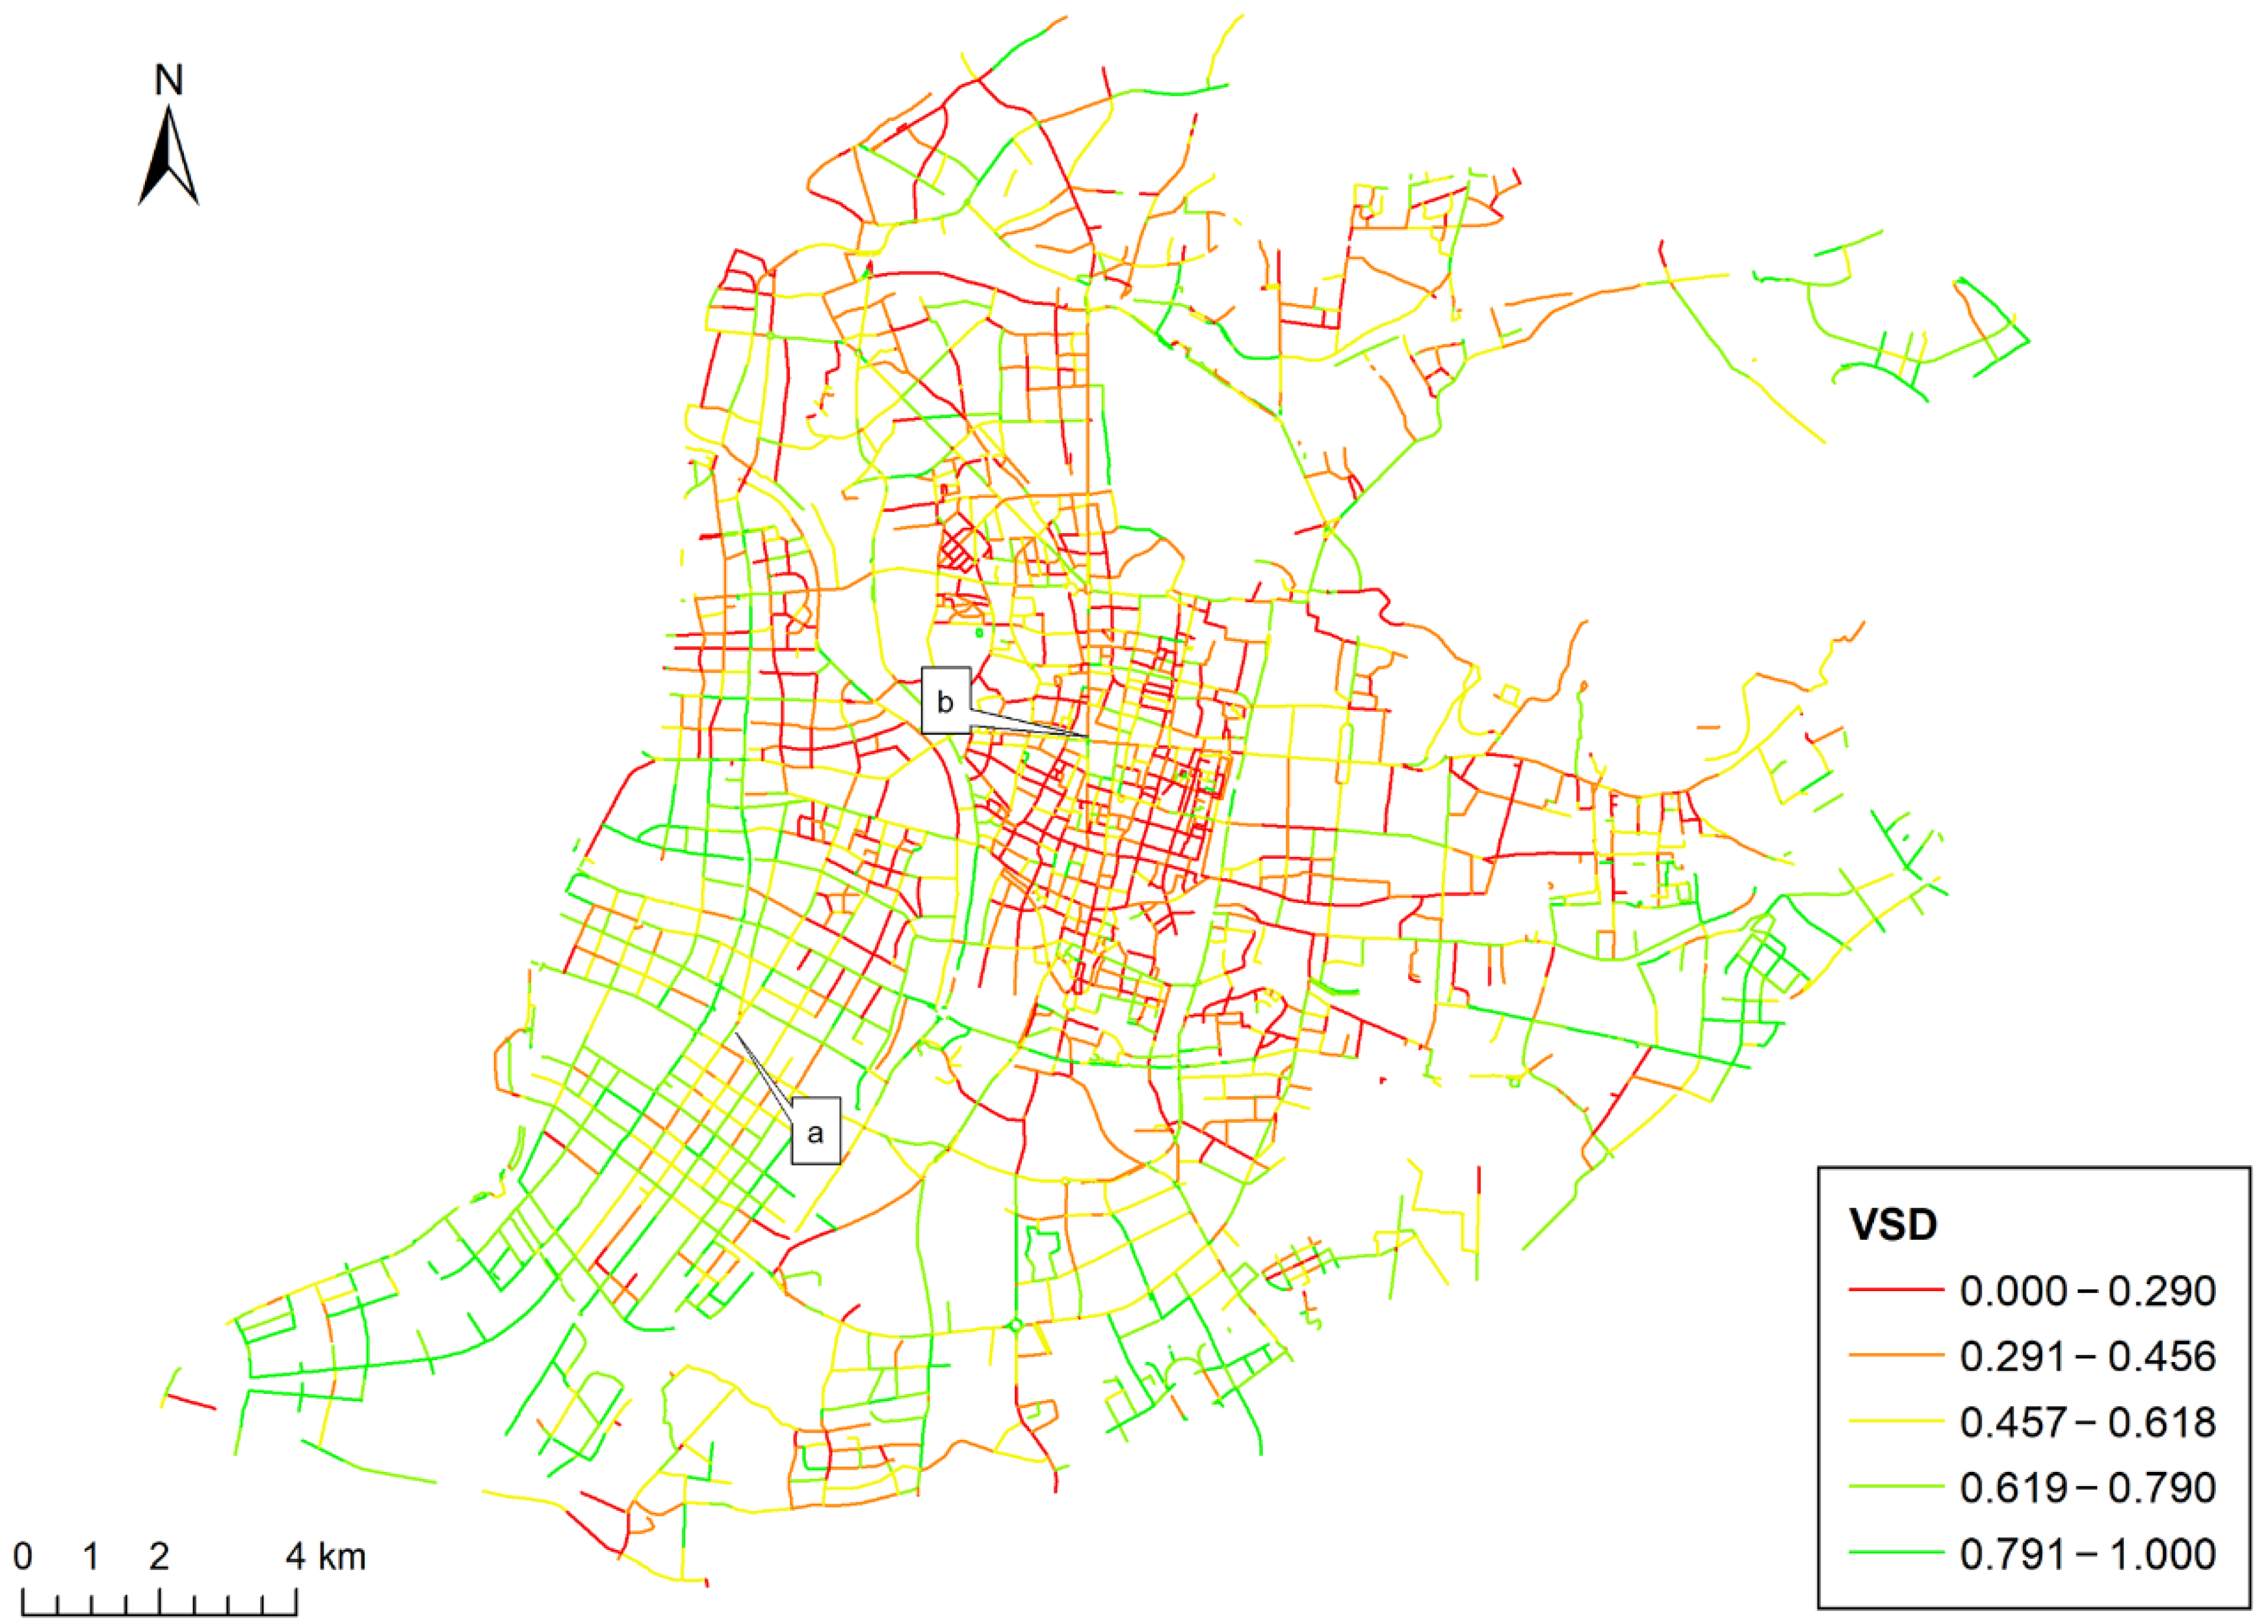
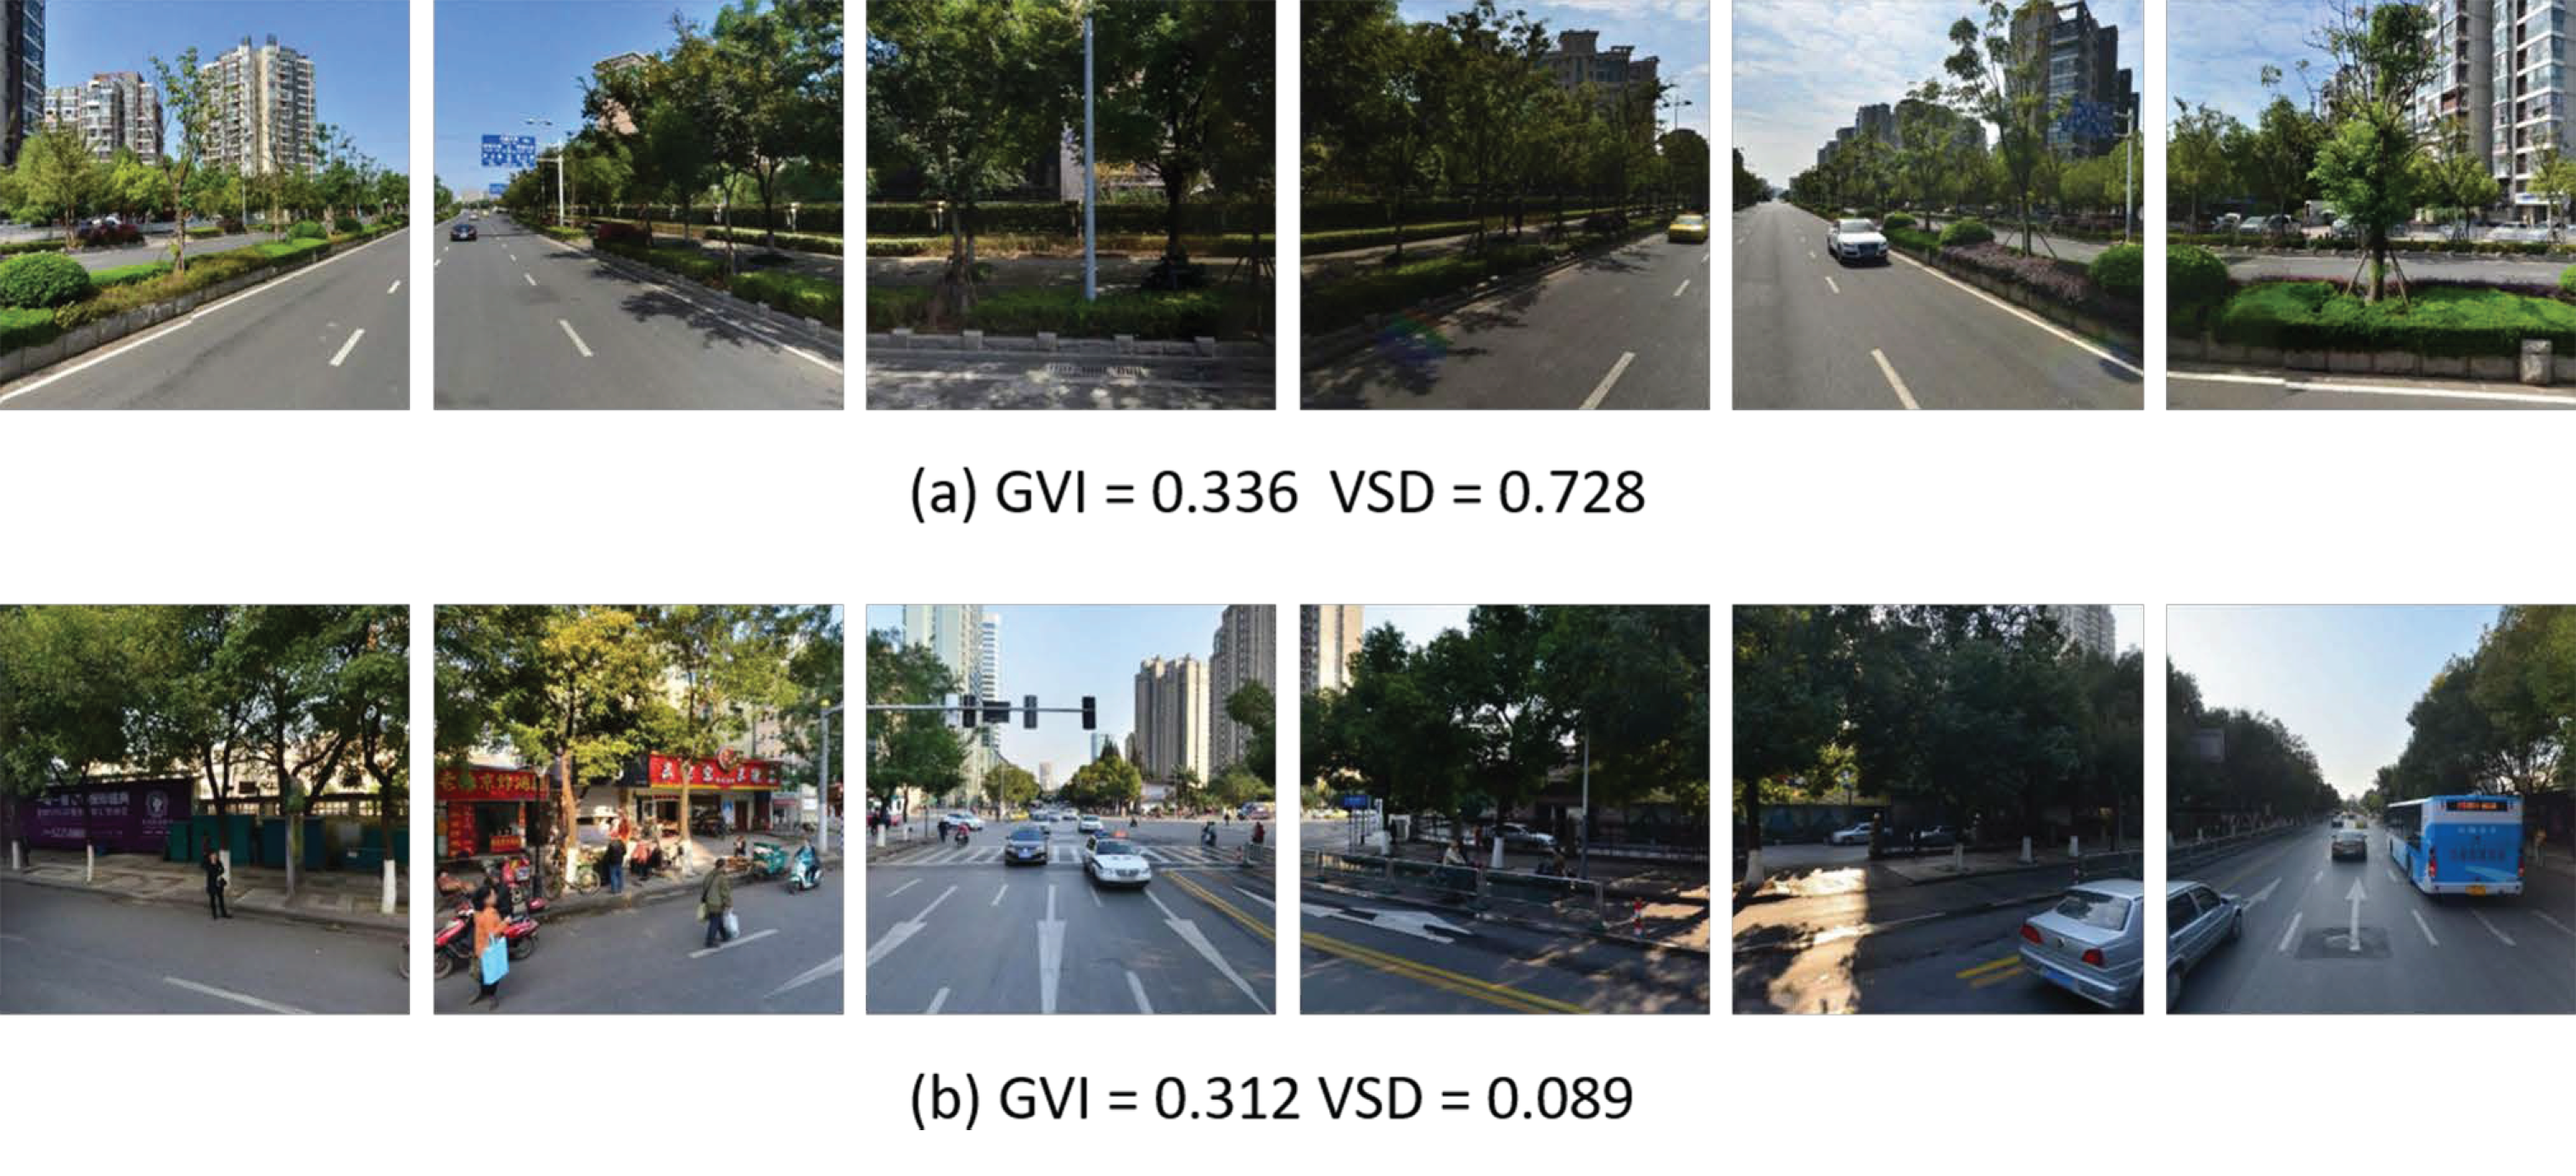
The VSD is an indicator newly proposed in this study based on the Shannon-Wiener index [
42]. The Shannon-Wiener index is used initially to evaluate species diversity. In this study, the authors applied the Shannon-Wiener Index to measure the vegetation structure diversity. The equation of VSD can be defined as:
In Equation (3), the range of VSD is (0–1). N could be set at 0, 1, 2 and 3, according to existing vegetation types: trees, shrubs or lawns, and is the proportion of the ith type of vegetation from all vegetation types. A higher VSD indicates greater vegetation structural diversity. In Equation (4), indicates the pixel count of the ith type of vegetation and indicates the pixel counts of all vegetation types.
The street-level GVI result can be obtained by calculating the average GVI of points on each street segment. Considering some street segments have insufficient sample points, the average GVI of these points cannot represent the street-level GVI. Therefore, only street segments satisfying Formula (5) were brought into the greenery assessment, and
was set at 80, according to the experiment.
L is the road segment’s length, and
N is the sample points’ count on the road segment.
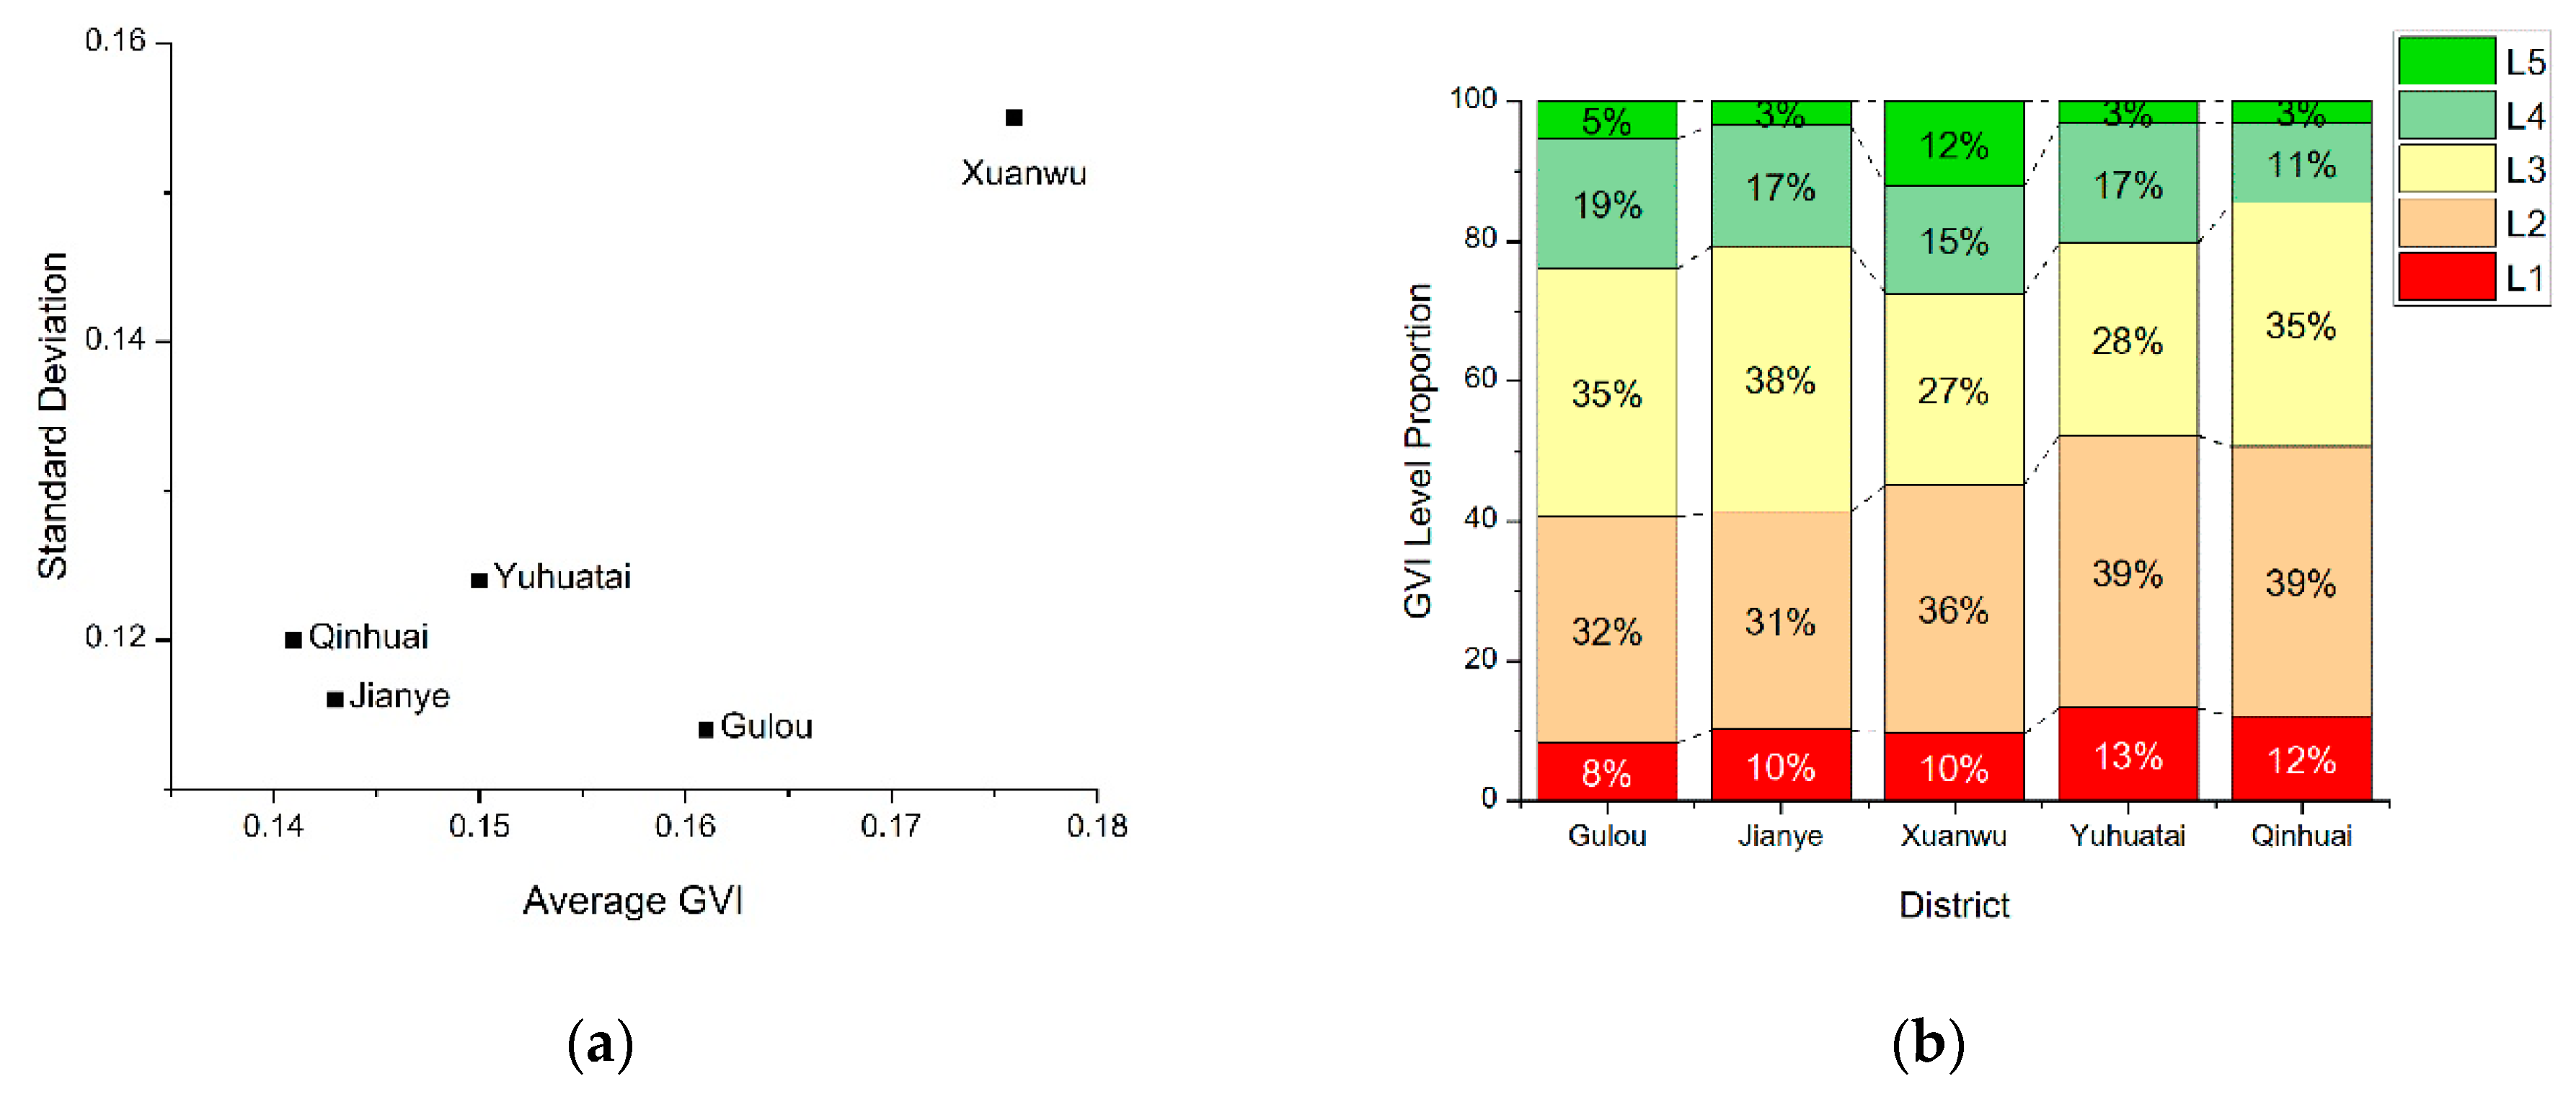
In accordance with Orihara [
43], the GVI was classified into 5 levels: L1 (0–0.05), L2 (0.05–0.15), L3 (0.15–0.25), L4 (0.25–0.35) and L5 (0.35–1). Furthermore, the average proportion of vegetation was calculated in this process so the street-level VSD could also be obtained.
To measure the overhead street greenery, the authors used satellite images to calculate the NDVI in the research area and then used the Zonal Statistic tool from ArcGIS software to calculate the street-level NDVI. The Zonal Statistic tool converts road vector data to raster internally, and each road segment is defined as a “zone”. The mean value of NDVI in each zone is calculated, and the result is the street-level NDVI.
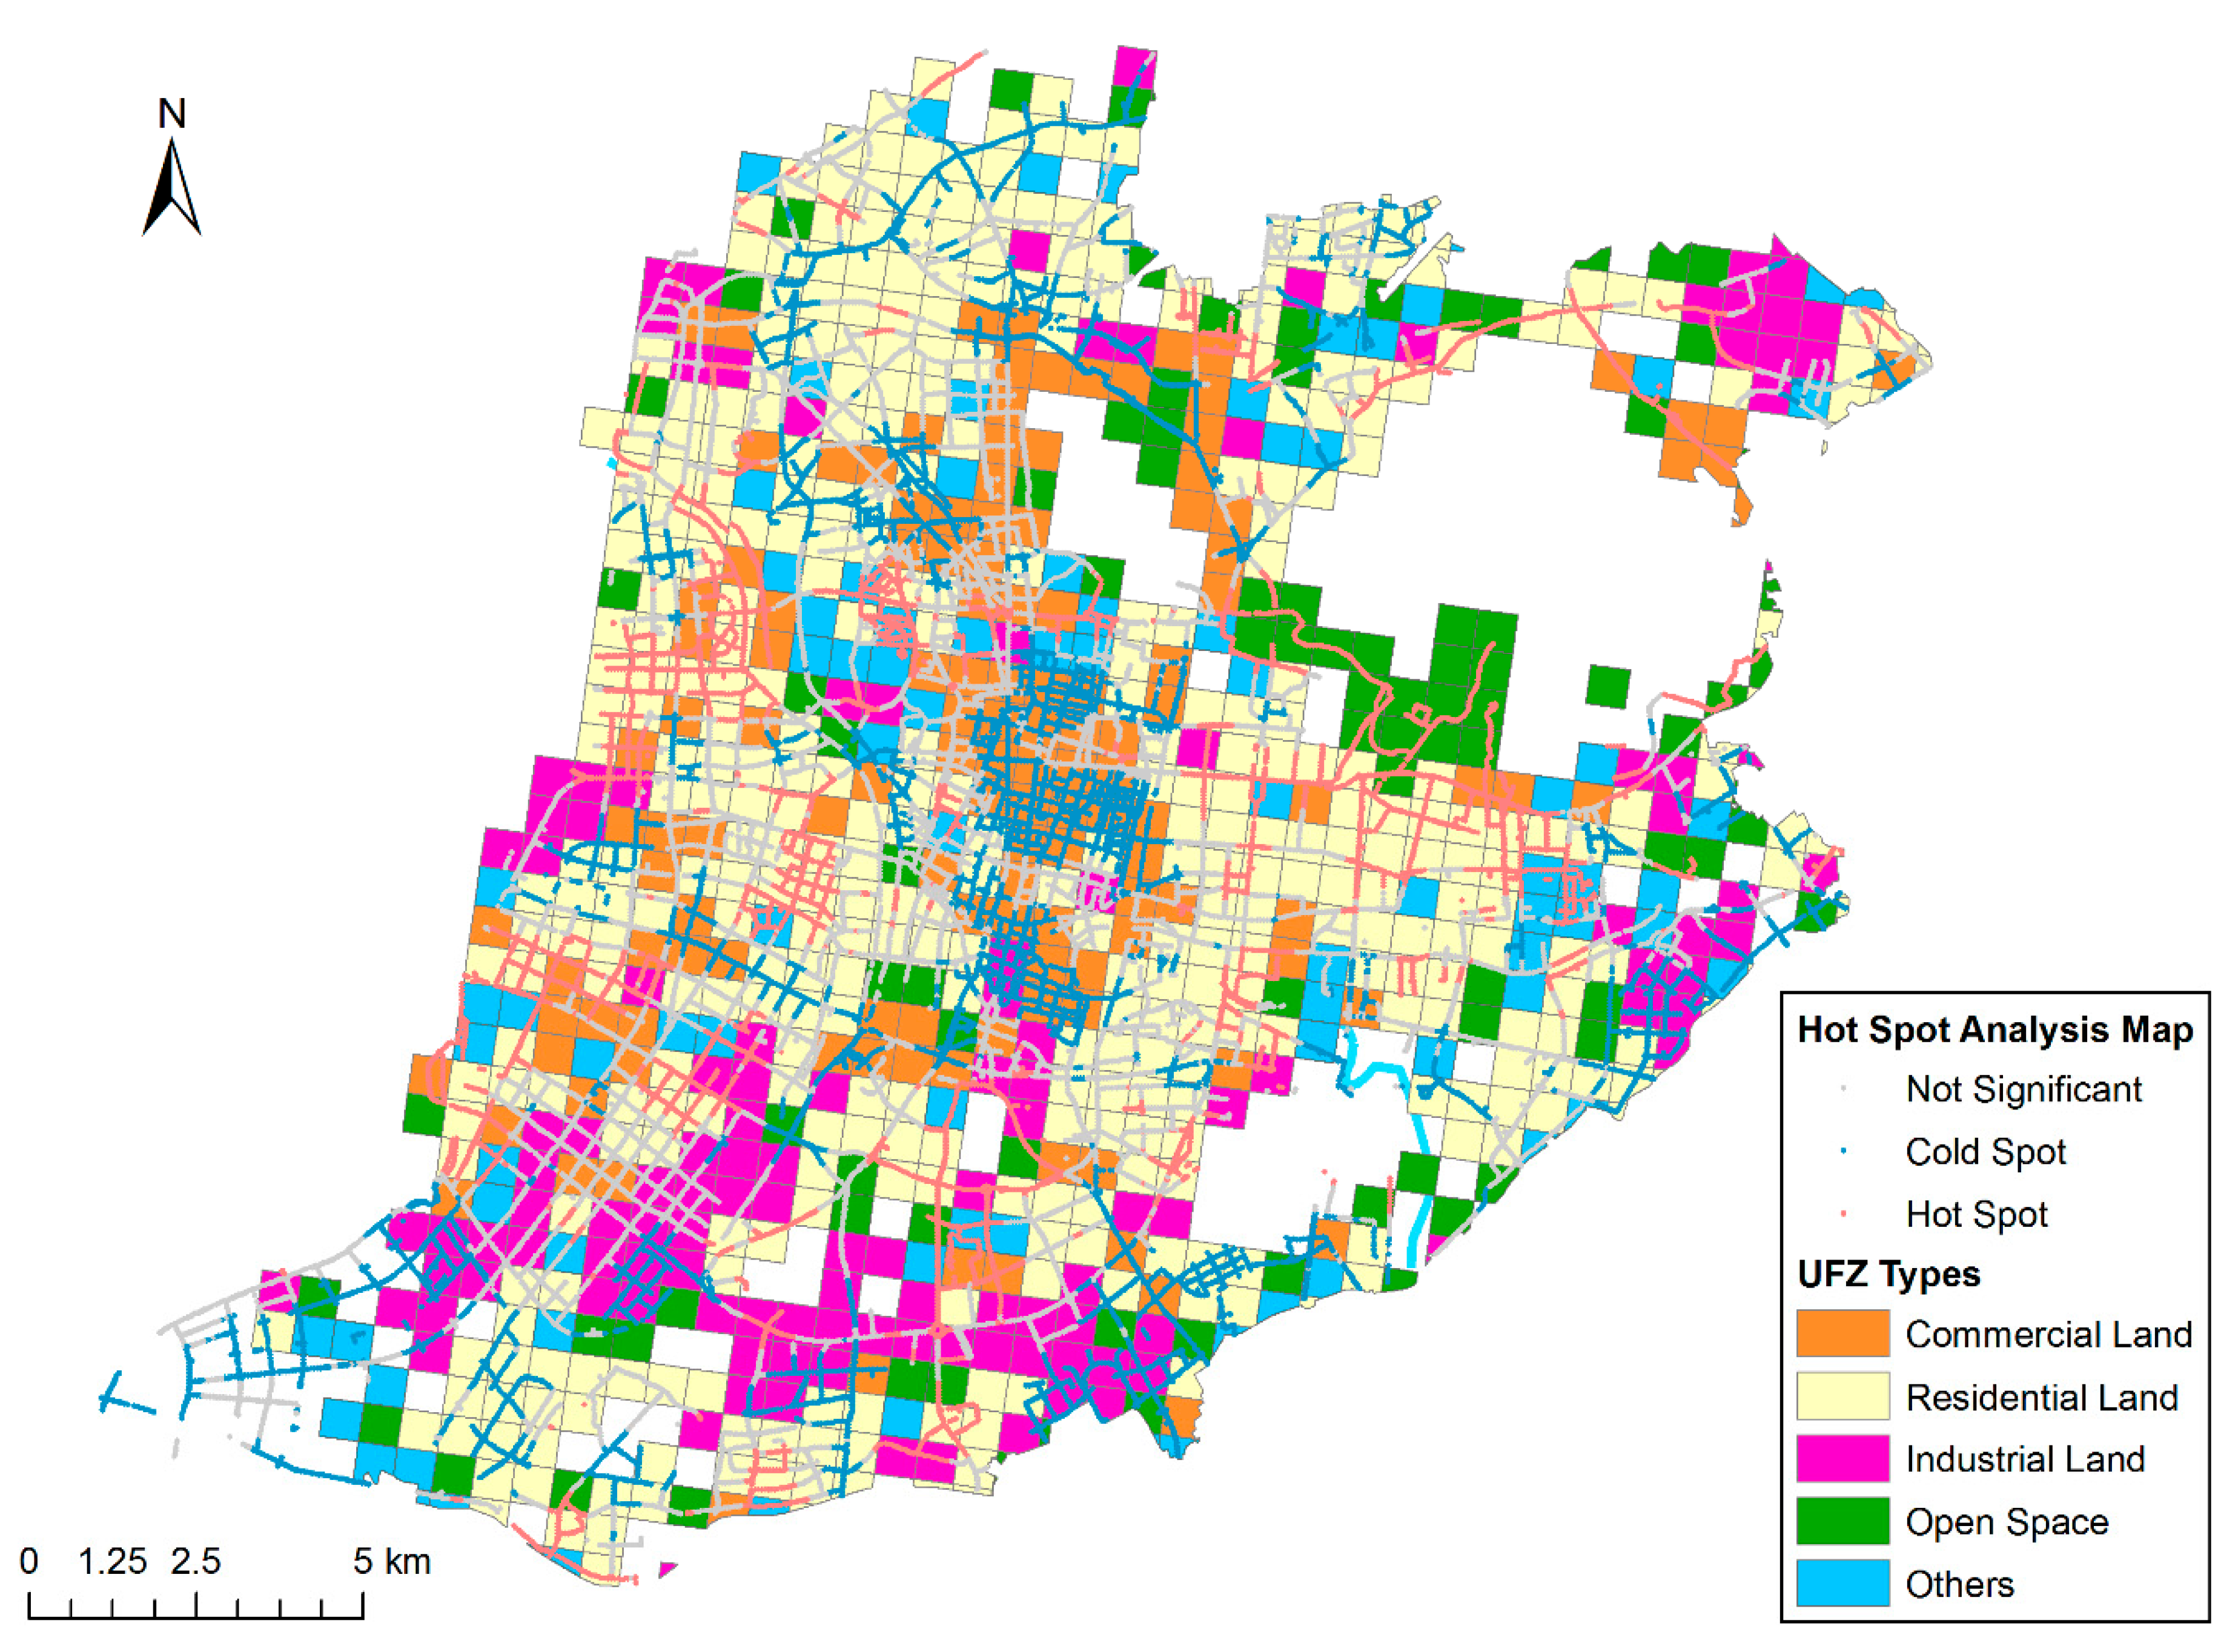
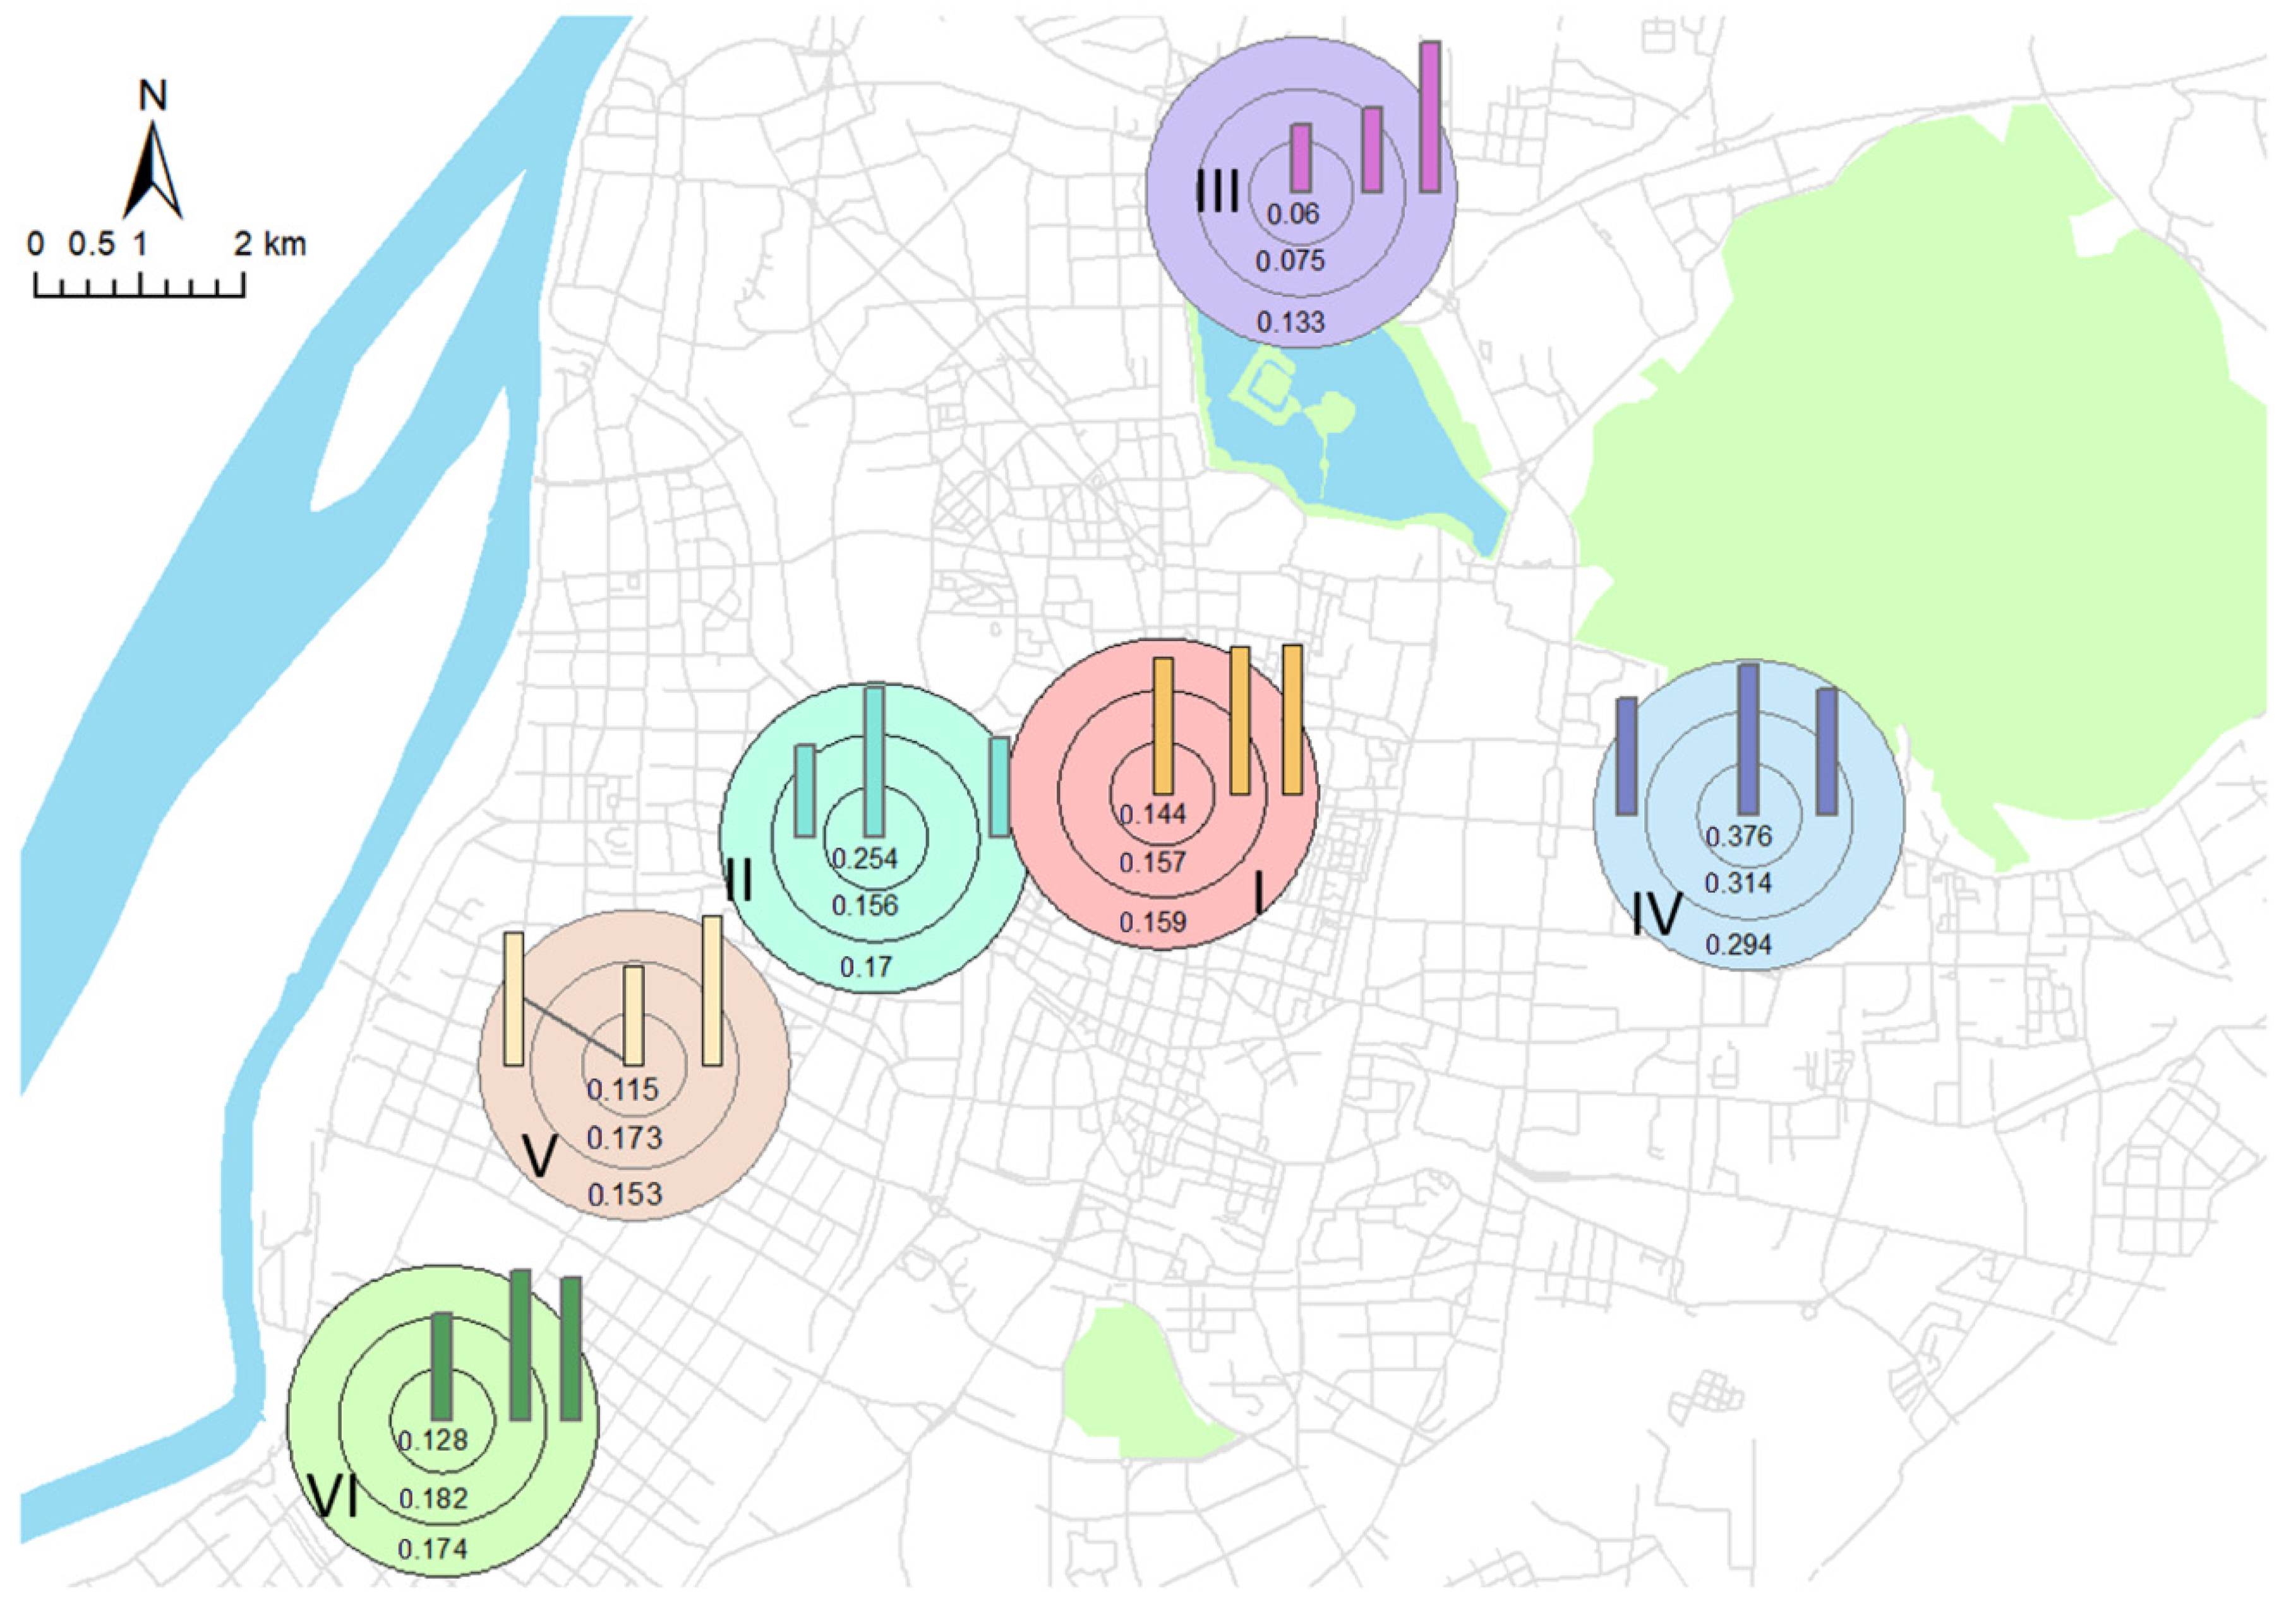
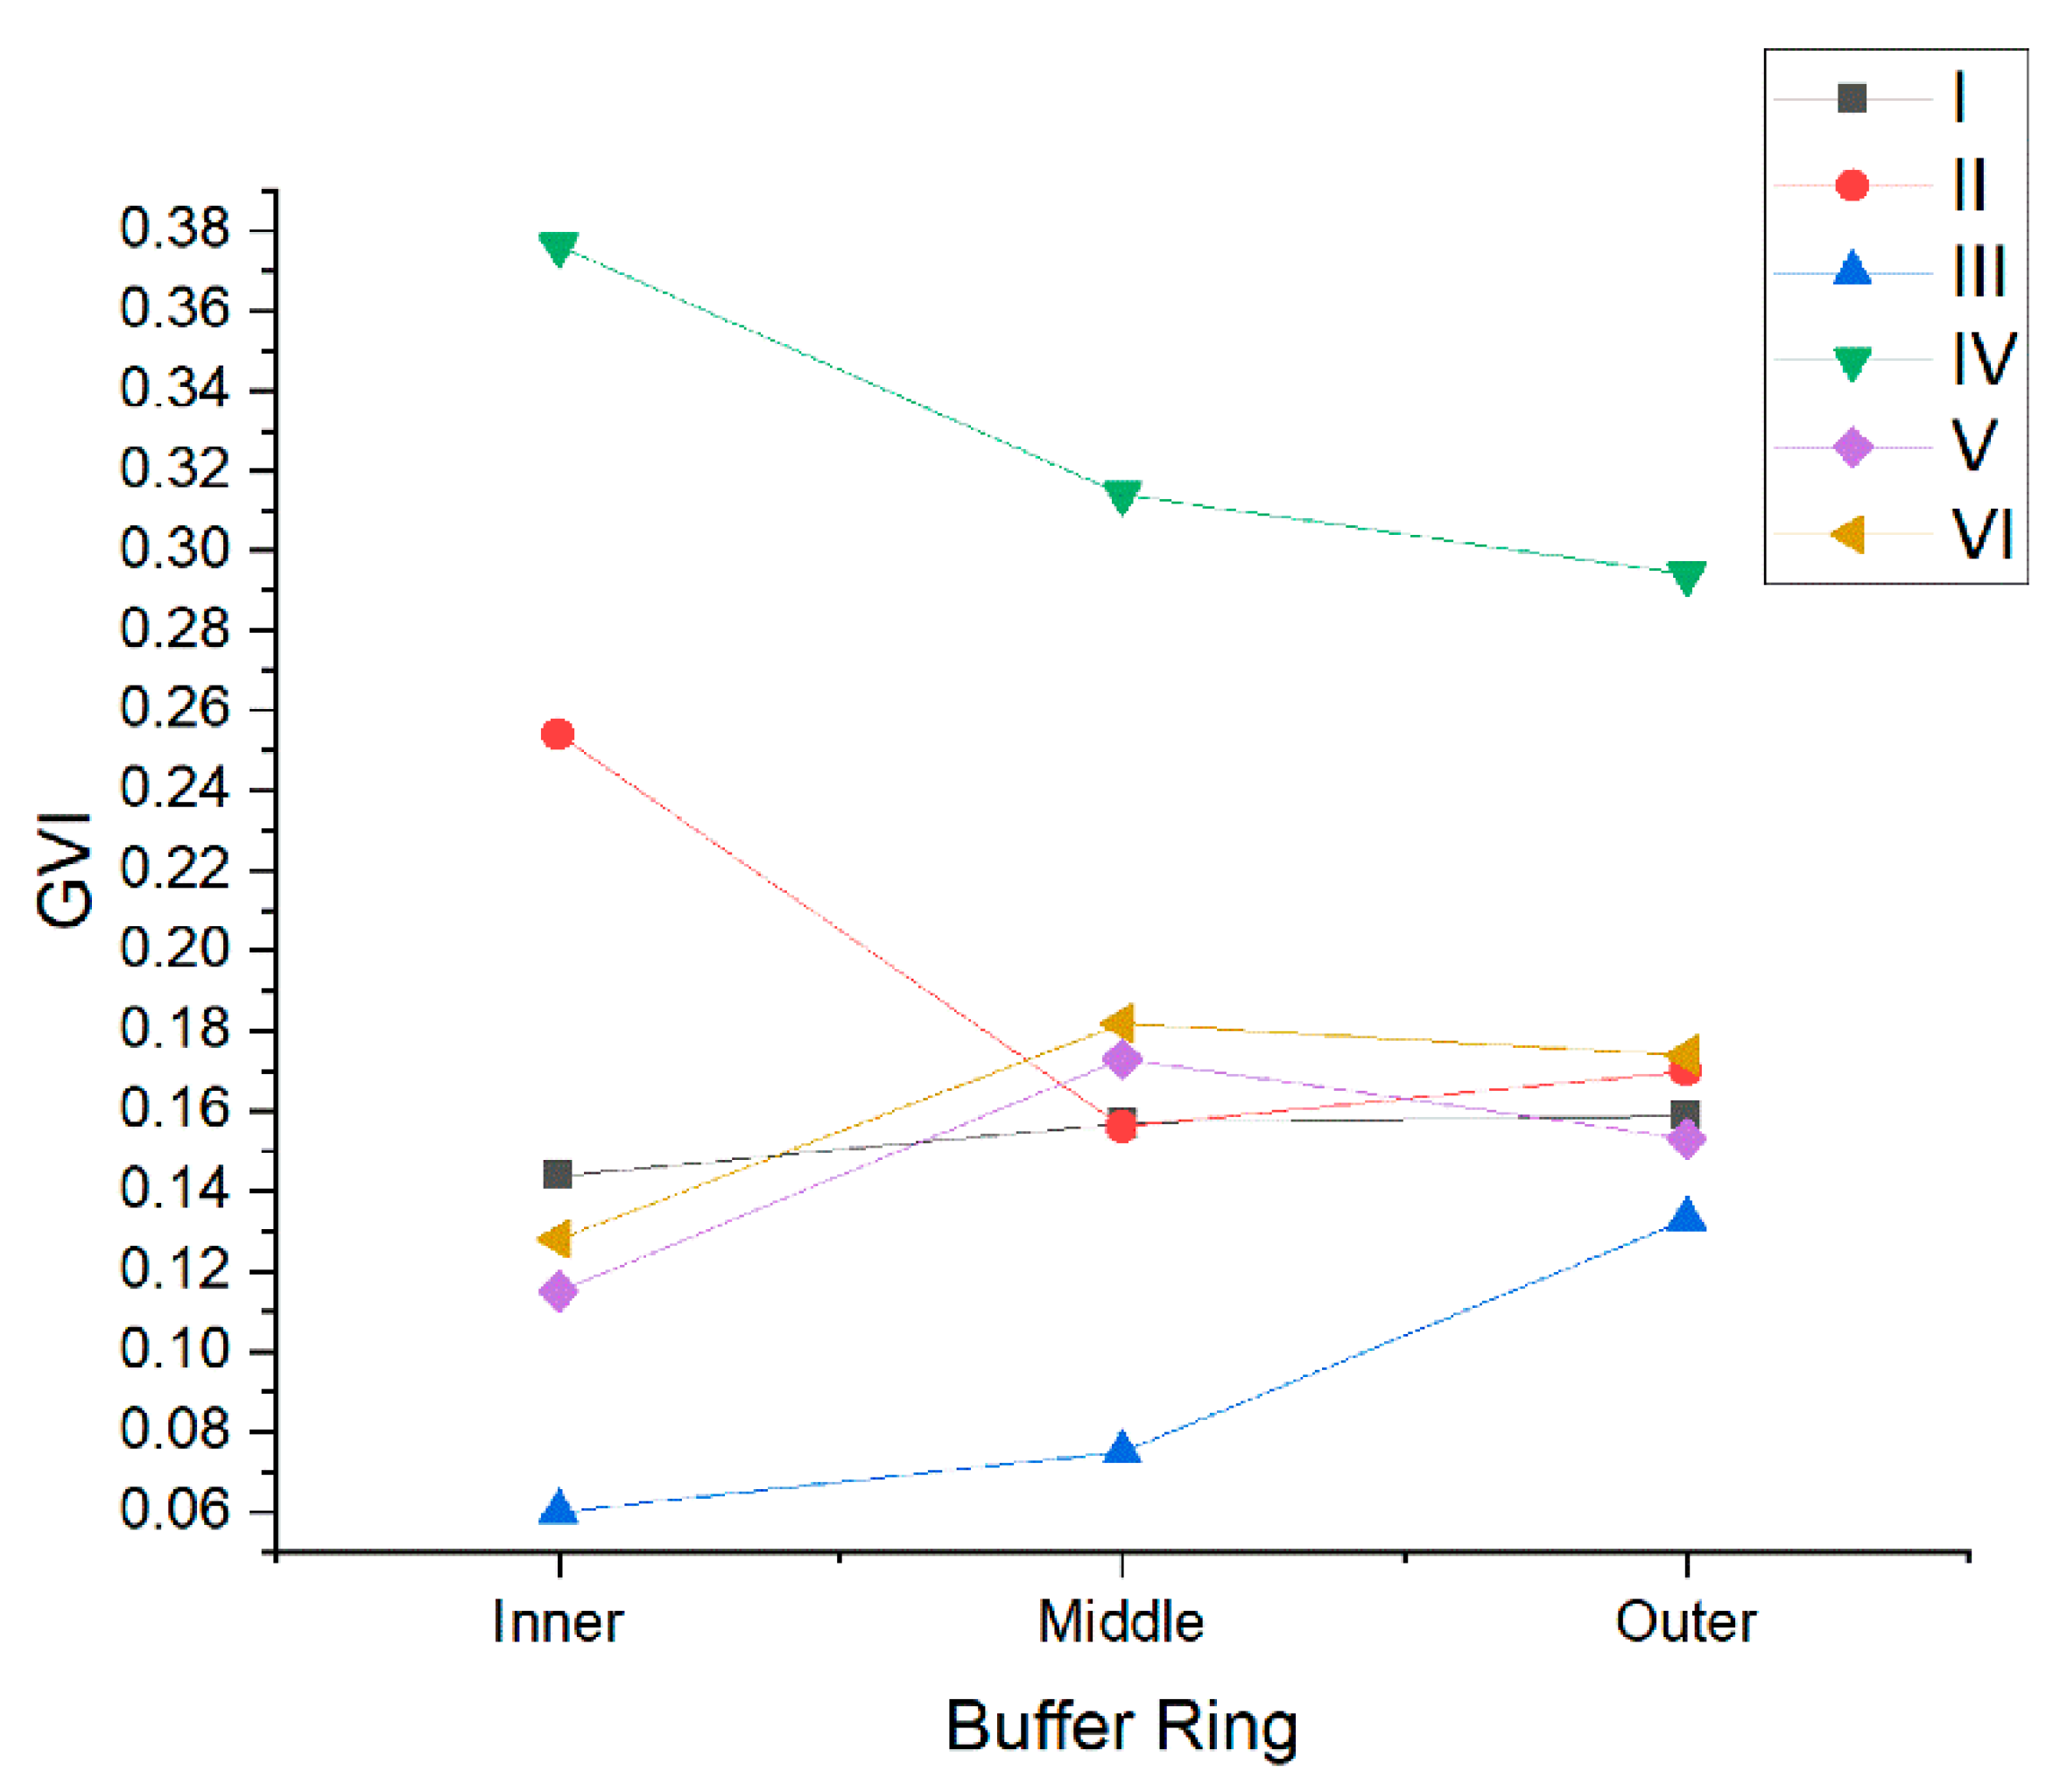
2.5. Hot Spot Analysis and Buffer Analysis on the GVI Results
A hot spot analysis is based on Getis-Ord Gi* statistics [
44], which identify statistically significant hot spots and cold spots, i.e., spatial clusters of high values and low values. The statistic returns the z-scores and
p-scores for the input features. A high z-score and small
p-value indicate a hot spot, and a low negative z-score and small
p-value indicate cold spots. The calculation is based on Euclidean distance. To analyze the variation trends of the GVI around hot or cold spots, a multi-ring buffer with a 500-m radius was constructed for sample spots, and three rings, named the inner ring, middle ring and outer ring, were created using the “multiple ring buffer” tool in ArcGIS.


 ,
, 


