Article

The Chloroplast Genome of Carya illinoinensis: Genome Structure, Adaptive Evolution, and Phylogenetic Analysis

Institute of Botany, Jiangsu Province and Chinese Academy of Sciences, Nanjing 210014, China
*
Author to whom correspondence should be addressed.
Forests 2020, 11(2), 207; https://doi.org/10.3390/f11020207
Submission received: 22 January 2020 / Revised: 7 February 2020 / Accepted: 8 February 2020 / Published: 12 February 2020
(This article belongs to the Special Issue Forest Genetics and Tree Improvement)

Abstract

:
Research Highlights: For the first time, the complete chloroplast (cp) genome of Carya illinoinensis cv. ‘Pawnee’ was de novo assembled. Comprehensive analysis the cp genome of C. illinoinensis revealed potential cpDNA markers for intraspecies identification, genes involved in adaptation, and its phylogenetic position. Background and Objectives: C. illinoinensis is an economically important nut tree in the family Juglandaceae. Cp-derived markers are helpful for genetic research, but they still need to be developed in C. illinoinensis. Additionally, the adaptation and phylogenetic relationships of C. illinoinensis have not been revealed based on the complete cp genome. Materials and Methods: Chloroplast genomic DNA of C. illinoinensis cv. ‘Pawnee’ was extracted and subjected to Illumina sequencing. Results: The cp genome is 160,819 bp in size, exhibiting a typical quadripartite structure with a large single copy (LSC) of 90,022 bp, a small single copy (SSC) of 18,791 bp, and a pair of inverted repeats (IRA and IRB) regions of 26,003 bp each. The genome was predicted to encode 112 unique genes, including 79 protein-coding genes, 29 tRNAs, and four rRNAs, with 19 duplicates in the IR regions. In total, 213 SSRs and 44 long repeats were identified in the cp genome. A comparison of two different C. illinoinensis genotypes, ‘Pawnee’ and 87MX3-2.11, obtained 143 SNPs and 74 indels. The highly variable regions such as atpF, clpP, and ndhA genes, and matK-rps16, trnS-trnG, and trnT-psbD intergenic spacers might be helpful for future intraspecific identification. Positive selection was acting on the ccsA and rps12 cp genes based on the Ka/Ks ratios. Phylogenetic analysis indicated that C. illinoinensis forms a sister clade to Asian Carya species, represented by C. kweichowensis and Annamocarya sinensis. Conclusions: The genome information in our study will have significance for further research on the intraspecies identification and genetic improvement of C. illinoinensis.

1. Introduction

The chloroplast (cp) is a multifunctional organelle in green plants with critical roles in carbon fixation and conversion of light into chemical energy [1]. It possesses an independent circular genome that is featured by maternal inheritance and a relatively stable structure [2]. Cp genomes of angiosperms typically consist of two copies of inverted repeats (IRs), which are divided by a large single-copy (LSC) region and a small single-copy (SSC) region. Generally, cp genomes of land plants have sizes of 120–160 kb and encode 110–130 unique genes [3]. Because of the small genome size, maternal transmission, slow evolutionary rate of change and less recombination for most angiosperms, the cp genome is suitable for species identification, phylogenetic analysis, and exploring the genetic basis of climatic adaptation [1,4,5]. The rapid development of sequencing technology has made it easy to gain the cp sequence of a plant. Within the Juglandaceae family, the complete cp genomes of several species have already been released in GenBank.
C. illinoinensis, commonly known as pecan, is a famous nut tree, the fruits of which are abundant in healthy unsaturated fatty acids and have a delicious taste. C. illinoinensis belongs to the Juglandaceae family, which is native to North America [6]. It was introduced to China at the end of 19th century. After years of observation and assessment, C. illinoinensis is proved to be suitable for planting in the southern area of the Yangtze River valley, including Jiangsu, Anhui, Zhejiang, and Jiangxi provinces. C. cathayensis, a native nut tree in China, is narrowly distributed in eastern China in the hilly areas between Zhejiang and Anhui provinces [7], which shows a very limited adaptive range relative to C. illinoinensis. Cultivation of C. illinoinensis would enrich the diversity of nut trees in China.
Historically, C. illinoinensis was mainly used for street planting in China. Nowadays, as the breakthrough in grafting [8,9] and a high interest in its fruits, C. illinoinensis was mainly planted as a fruit tree. There are quite a lot of C. illinoinensis genotypes in China. Selection of suitable cultivars of C. illinoinensis is critical for orchard construction, however, it is very difficult to distinguish different cultivars simply based on the morphological observation. Therefore, there is a need to develop genetic markers for intraspecific identification of C. illinoinensis genotypes.
Based on the geographical distribution and the morphology of flowers, the genus Carya could be divided into three sections: sect. Apocarya, sect. Carya, and sect. Sinocarya [10]. Plants of sect. Apocarya and sect. Carya, which have bud scales, are distributed in North America. Sect. Sinocarya plants have naked buds, and are located in Asian regions [11]. C. illinoinensis is a typical plant of the sect. Apocarya. Some researchers have revealed the phylogenetic position of C. illinoinensis according to several cp-derived markers [10,12]. However, using a limited number of cp-derived markers is still not sufficient for fully revealing the phylogenetic relationship within Juglandaceae. The complete cp sequence can offer a great number of molecular loci, which is of importance for enhancing phylogenetic accuracy. In this study, we sequenced and de novo assembled the cp genome of C. illinoinensis. cv. ‘Pawnee’. Besides the structure analysis, highly variable cp genome regions were identified between the genotypes of ‘Pawnee’ and 87MX3-2.11 (prior cp genome in GenBank). Additionally, a comparative analysis of the cp genome of C. illinoinensis with related species was conducted to understand its adaptation and phylogenetic relationships.

2. Materials and Methods

2.1. Plant Material and Chloroplast Genome Sequencing

Fresh leaves of C. illinoinensis cv. ‘Pawnee’ were collected from the experimental farm of Nanjing botanical garden, Jiangsu Province, China. Chloroplast genomic DNA was extracted according to an improved isolation approach [13]. The DNA integrity, purity, and concentration were analyzed by 1% agarose-gel electrophoresis, a NanoDrop spectrophotometer (Thermo Scientific, Waltham, MA, USA), and a Qubit fluorometer (Life Technologies, Darmstadt, Germany), respectively. For Illumina sequencing, 1 μg of purified DNA was fragmented into 300 bp (base pair) pieces, and the fragmented DNA was used to construct pair-end libraries with 300 bp insert size following the manufacturer’s instructions (Illumina, USA). The sequencing of chloroplast genome of C. illinoinensis was performed on the Illumina Hiseq 4000 platform (Biozeron, Shanghai, China). After the completion of sequencing, raw data were processed to obtain clean reads through filtering out as follows: the adapter sequences and non-ATCG nucleotides at the 5’ end of reads, sequences with quality value less than Q20 at the 3’ ends of reads, reads containing uncalled bases, and reads less than 50 bp after mass trimming.

2.2. Chloroplast Genome Assembly and Annotation

The initial assembly of contigs was conducted using SOAPdenovo software (v 2.04) [14]. Then, contigs were blasted to the reference cp genome of C. illinoinensis (genotype, 87MX3-2.11), and the aligned contigs with high similarity (≥80%) were ordered based on the reference genome. The gaps and incorrect bases of the resulting draft cp genome of C. illinoinensis were repaired using GapCloser software (v1.12). Finally, we obtained a circular cp genome of C. illinoinensis with unambiguous bases.
An online DOGMA tool [15] was used to annotate the C. illinoinensis cp genes, including predict protein-coding genes, transfer RNA (tRNA) genes, and ribosome RNA (rRNA) genes. The start and stop codons together with exon/intron boundaries of annotated genes were determined through comparison with the corresponding homologous genes of other closely related cp genomes. Additionally, tRNA genes were further confirmed by tRNAscan-SE [16]. A circular map of C. illinoinensis cp genome map was generated with OrganellarGenomeDRAW program [17]. The complete cp genomic sequence of C. illinoinensis was deposited in GenBank with accession number MN977124.

2.3. Repeat Sequence Analysis and Codon Usage Analysis

Simple sequence repeats (SSRs) were identified by MISA software with the following parameters: at least 8 repeat units for mono-nucleotides, 5 repeat units for di-nucleotides, 4 repeat units for tri- nucleotides, and 3 repeat units for tetra-, penta-, and hexa-nucleotides. Repeat sequences, which included forward, reverse, complement, and palindromic repeats were analyzed by an online REPuter software with minimal repeat size of 30 bp and hamming distance of 3.
Relative Synonymous Codon Usage (RSCU) was a critical parameter to perform synonymous codon usage analysis. In our study, the protein-coding genes were used to analyze the RSCU with CodonW1.4.2 program.

2.4. SNP and Indel Detection

To develop intraspecific markers for distinguishing the genotypes of C. illinoinensis, the prior cp genome (genotype, 87MX3-2.11) in GenBank (MH909600) was selected for SNP and indel markers detection with our newly assembly cp genome as a reference. MUMmer4 software [18] was applied to perform a global alignment. Any sites that showed a difference between each chloroplast genome and the reference genome were identified to be potential SNPs. Then, the reference sequences with 100 bp in length on each side of the potential SNP site were extracted. The extracted sequences were aligned to the assembly results so as to verify the SNP loci. If the size of the alignment was not larger than 100 bp, the sequence was considered to be unreliable SNP and would be removed; if the alignment was repeated several times, the SNP was regarded as a duplicate and also discarded. After those filtering, reliable SNPs were obtained.
For indel detection, LASTZ software was first adopted to align the sample and reference sequences. Following a series treatment with axt_correction, axtSort, and axtBest programs, the best alignment results were selected and the preliminary indels were identified. Then, 150 bp upstream and downstream of the indel locus in the reference sequence were retrieved and aligned with the sequence reads by BWA [19] and SAMtools to obtain reliable indels.

2.5. Chloroplast Genome Comparison

The complete cp genome of C. illinoinensis was compared with the cp genomes of Annamocarya sinensis (KX703001), Platycarya strobilacea (KX868670), J. regia (MF167463), and C. kweichowensis (NC_040864) in Juglandaceae by using the mVISTA tool with the Shuffle-LAGAN mode [20]. These species were also used to compare the LSC/IRB/SSC/IRA region borders with C. illinoinensis as a reference.

2.6. Molecular Evolution and Phylogenetic Analysis

To compute non-synonymous (Ka) and synonymous (Ks) substitution rates, the functional protein-coding genes in the cp genome of C. illinoinensis were compared with its close relative: A. sinensis, P. strobilacea, J. regia, and C. kweichowensis. The Ka/Ks values for each gene were estimated by the KaKs_Calculator [21] with default setting. For phylogenetic analysis, the cp genomes of 18 species were downloaded from the National Center for Biotechnology Information. Setting Populus trichocarpa as outgroup, a phylogenetic tree was constructed based on the population SNP matrix of the studied species. Maximum likelihood (ML) model with 1000 bootstrap replicates was conducted to construct phylogenetic trees by PhyML software (v3.0) [22].

3. Results and Discussion

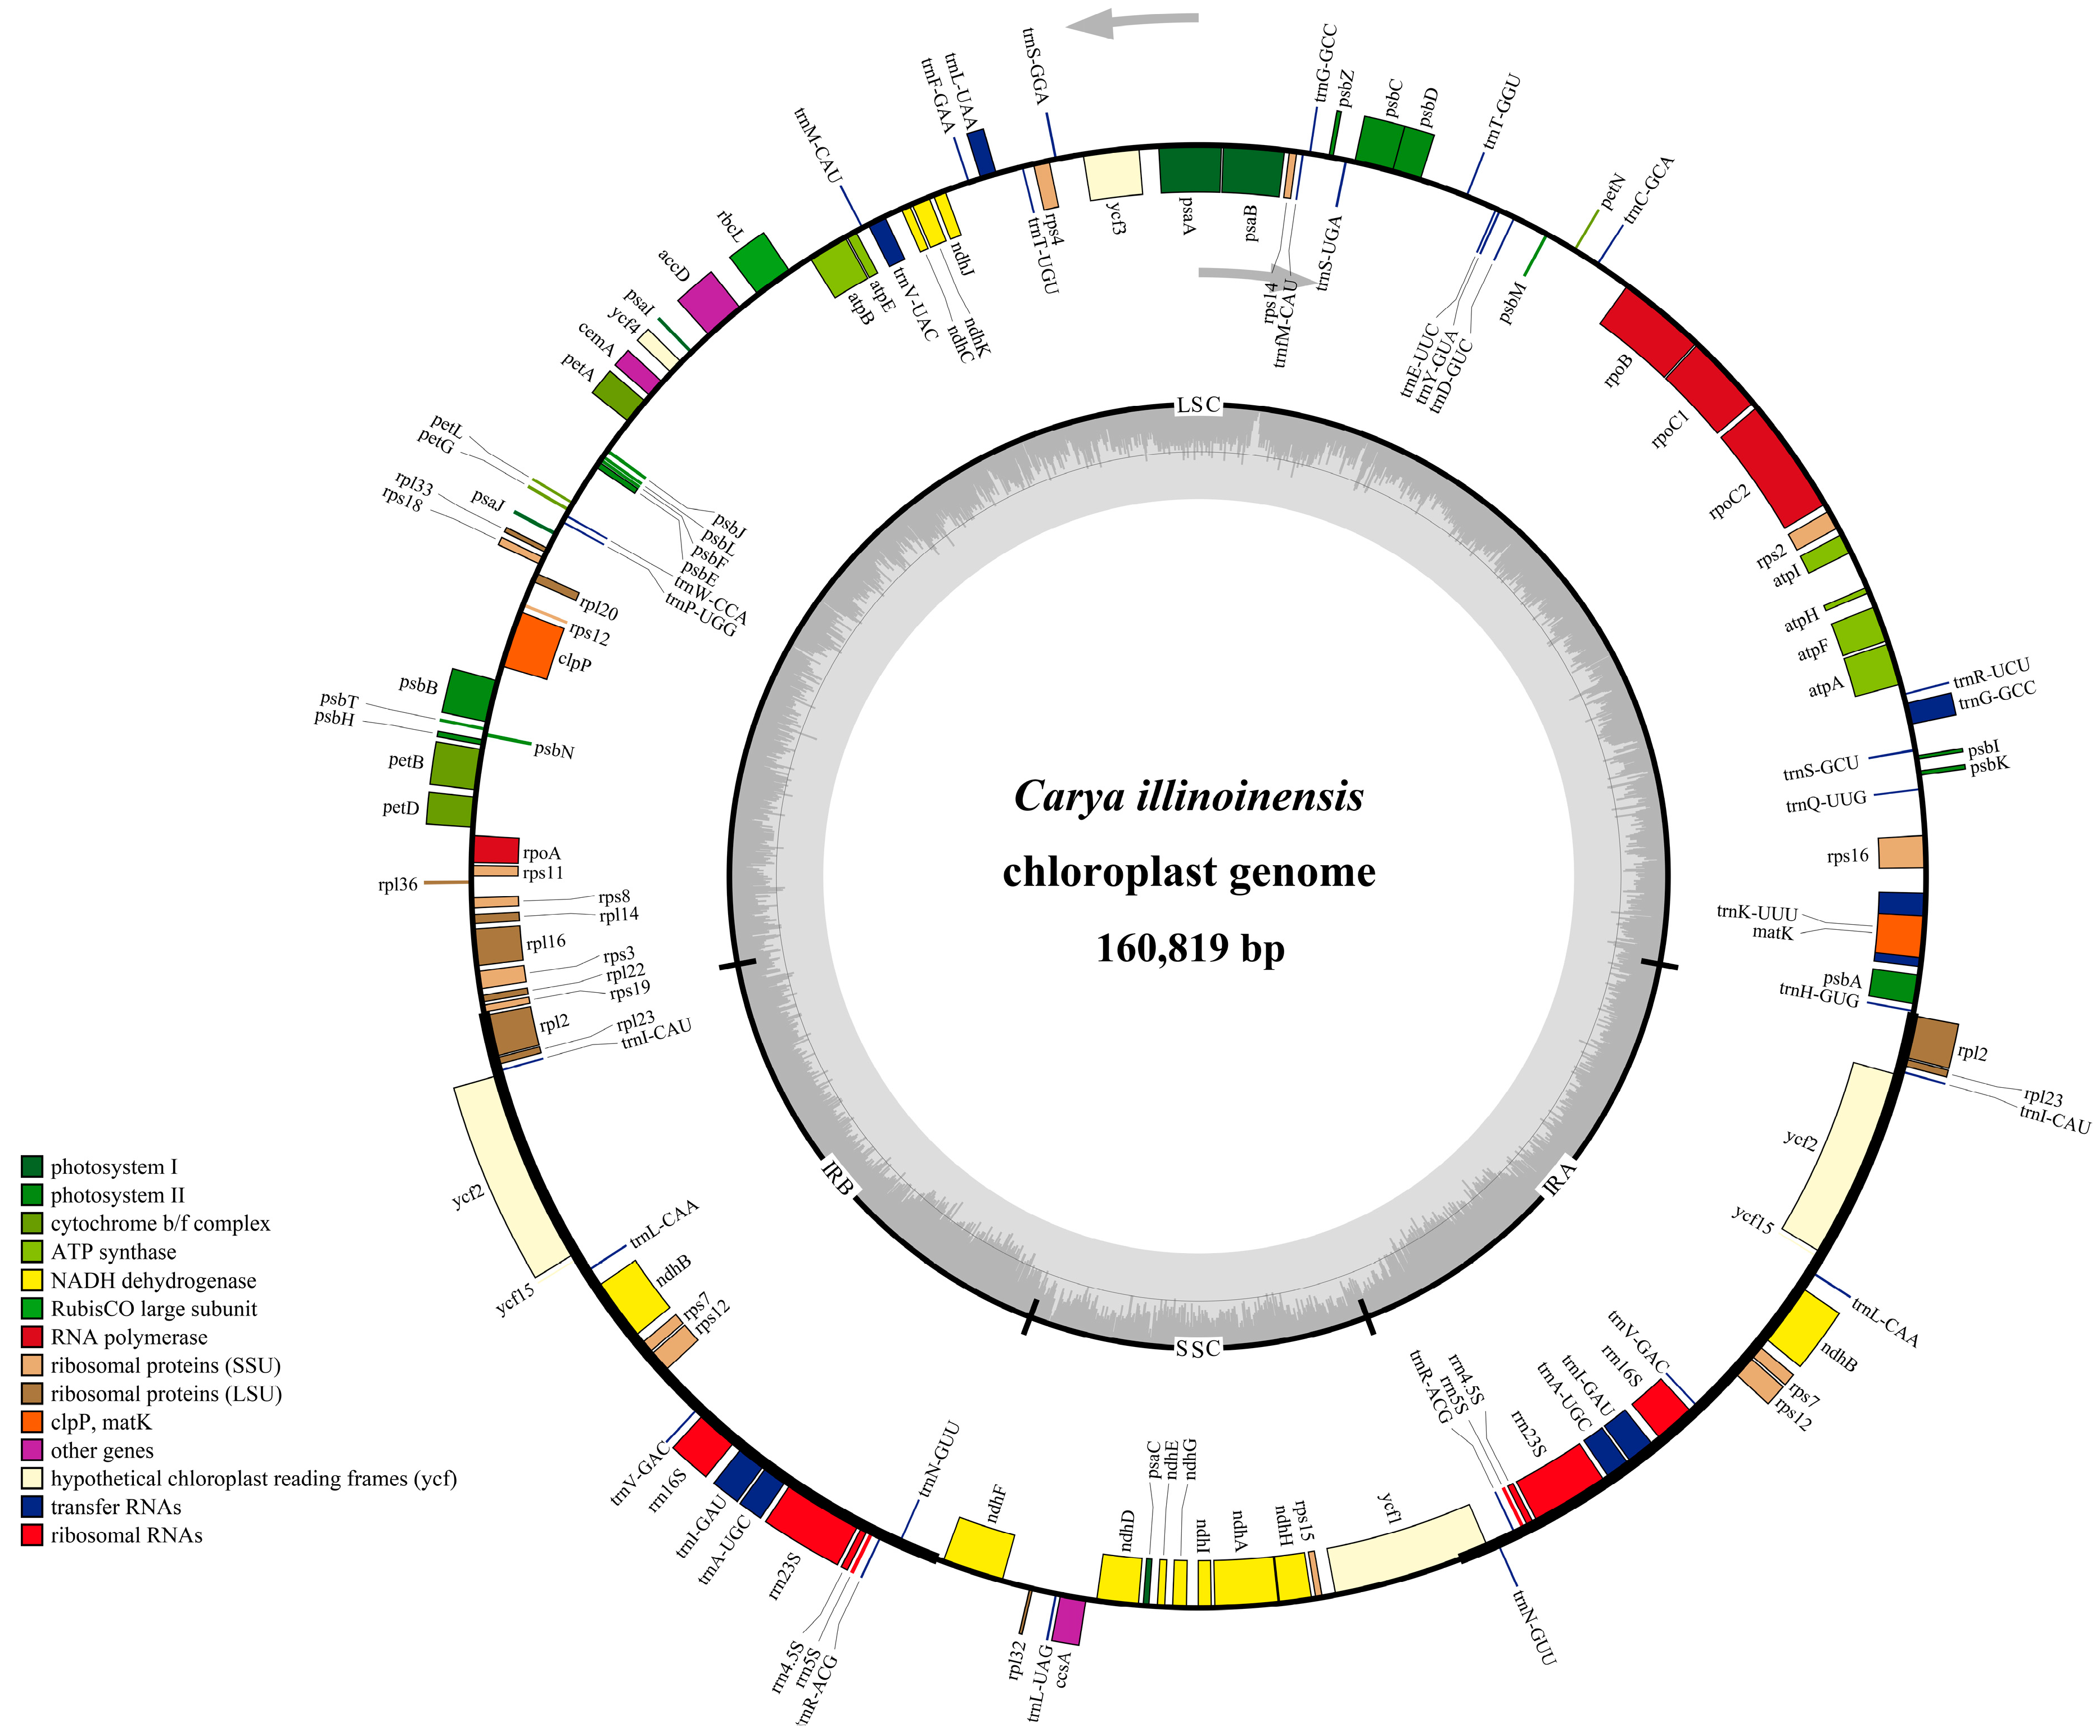
3.1. Chloroplast Genome Features of C. illinoinensis

The complete chloroplast genome of C. illinoinensis cv. ‘Pawnee’ was a circular double-stranded DNA molecule with 160,819 bp in length. Just like other angiosperms, the circular cp genome of C. illinoinensis presented a typical quadripartite structure with an LSC (90,022 bp), an SSC (18,791 bp) and a pair of IR regions (IRA and IRB, each 26,003 bp) (Figure 1 and Table 1). Overall, the C. illinoinensis cp genome exhibited a low GC content (36.15%), which was similar to that of other cp genomes from the Juglandaceae family [23,24,25]. Assessing the GC contents of LSC, SSC and IR regions showed that the IR regions contained a higher GC content (42.58%) than those of the LSC (33.74%) and SSC (29.89%), which seemed to be a common phenomenon [26,27,28]. This might be attributed to the genes of rRNA and tRNA having a relative high GC-content [29], and they occupied a greater area than the protein-coding genes in the IR regions.
The chloroplast genome of C. illinoinensis was predicted to encode 131 genes, with 112 unique/different ones (including 79 protein coding genes, 29 tRNAs, and four rRNAs) and 19 ones duplicated in the IR regions (Table 1 and Table 2). Among the 19 duplicated genes, seven were protein-coding genes, eight and four were tRNAs, rRNAs, respectively (Table 2). As generally seen in other land plants [4,27,30], there were 18 intron-containing genes in C. illinoinensis cp genome, including 6 tRNA genes and 12 protein-coding genes, of which 16 genes comprised a single intron and 2 genes (ycf3 and clpP) had two introns (Table 2). The intron of trnK-UUU gene, which included the matK gene, was the longest, reaching 2559 bp. As previously described [28,31,32], rps12 was a trans-spliced gene with one exon located in the LSC region (5′end) and the other two exons (separated by an intron) located in both of the IR regions. ycf15 was identified as pseudogene, in which several internal stop codons were detected. Similar mutations were also observed in the chloroplast genome of other tree species, such as J. regia [30], Phoenix dactylifera [33], and Pteroceltis tatarinowii [34].
Gene gain or loss could be found in cp genomes during evolution [28]. Compared to the cp genome of other C. illinoinensis genotype (87MX3-2.11) in GenBank, we identified no gene gain or loss events happened, indicating that the cp genome was highly conserved within species. A comparison of our assembly to that of other species (A. sinensis, P. strobilacea, J. regia, and C. kweichowensis) in Juglandaceae revealed that the kinds of genes in the cp genomes were generally the same among species, except that infA gene was specifically included in the cp genome of J. regia. The infA gene, which encodes the translation initiation factor, is invloved in protein synthesis [35]. It has been reported to be a highly mobile cp gene [36]. The loss of infA in C. illinoinensis may be caused by its transfer to nuclear genome. We also compared our cp genome with the model plant of Nicotiana sylvestris (NC_007500) [37], and the result showed that sprA has been lost in C. illinoinensis during evolution. The sprA gene encodes a small RNA of 218 bp, which was reported to facilitate 16S rRNA maturation [38]. Despite its involvement in the maturation of 16S rRNA, sprA was proved to be not essential for the normal growth of plants [39], which might be the reason that some vascular plants have abandoned this gene [40].

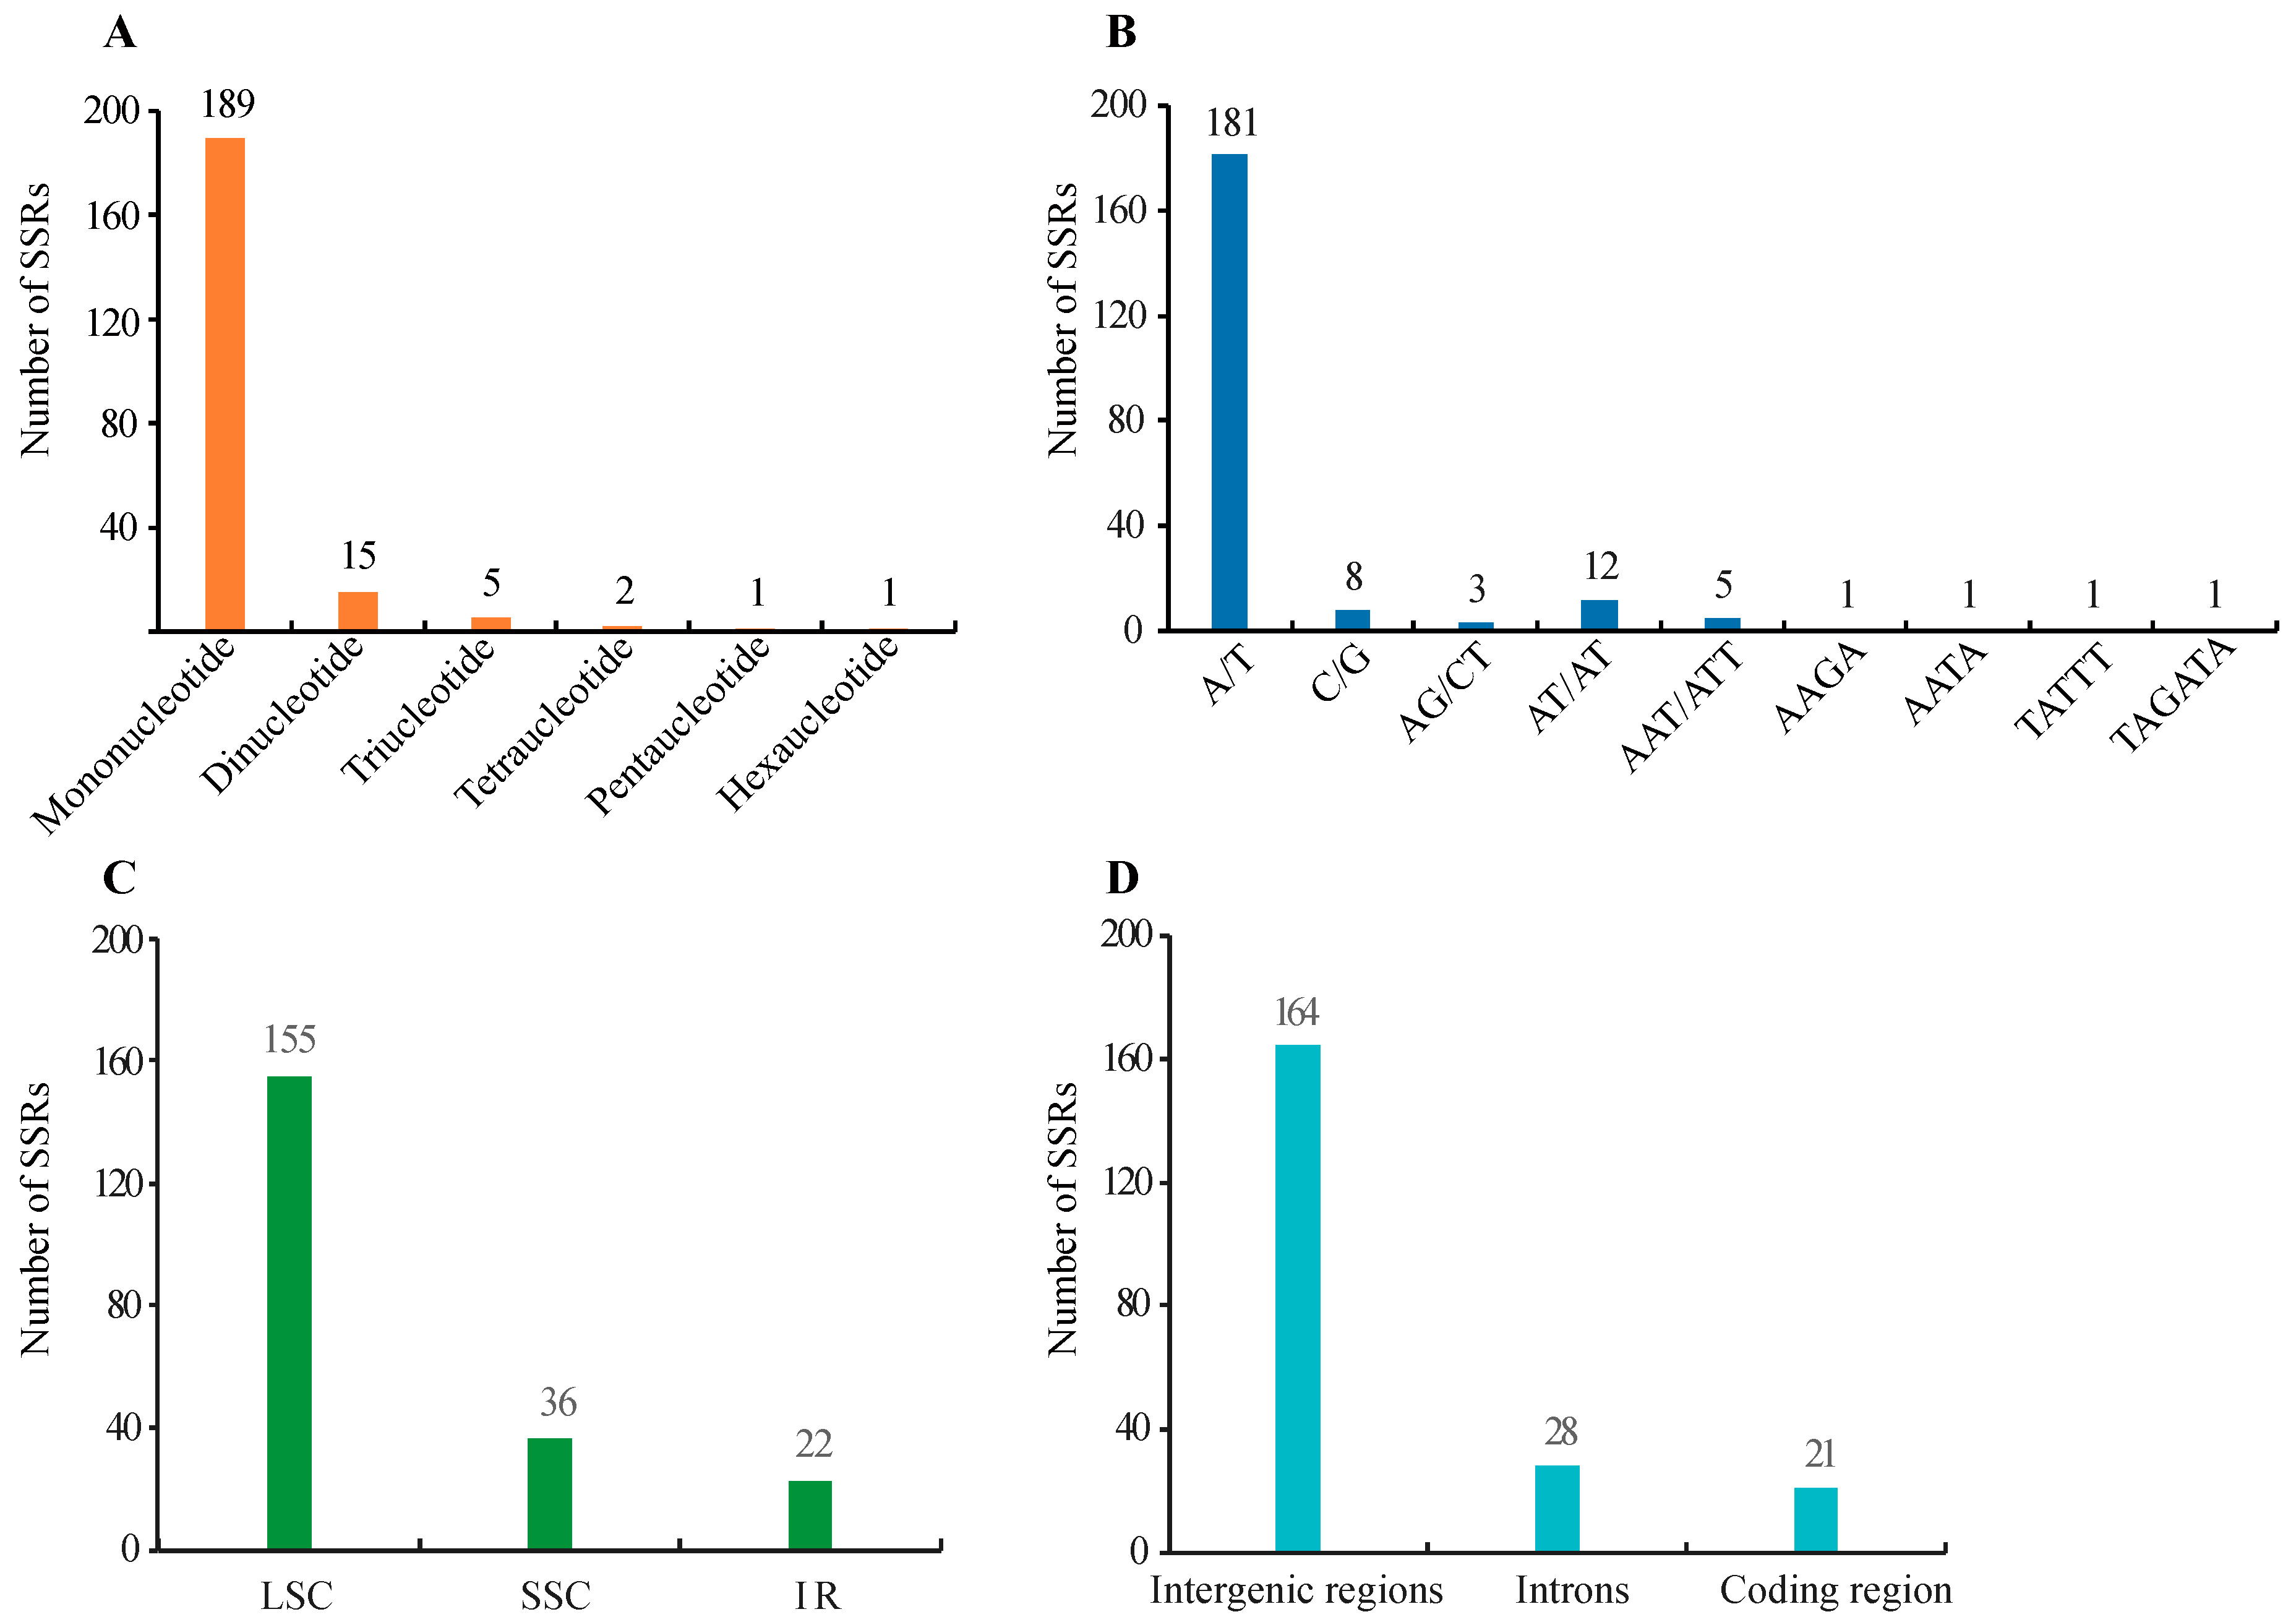
3.2. SSR and Long Repeats Identification

There are short repeats (the length of the repeat unit often contains one to six nucleotides) and long repeats (the size of the repeat unit generally has 10–100 nucleotides) [41]. SSRs or microsatellites are short tandem repeats. In C. illinoinensis cp genome, a total of 213 SSRs were identified by MISA, of which, there were 189 mononucleotides, 15 dinucleotides, five trinucleotides, two tetranucleotides, one pentanucleotide, and one hexanucleotide with a size of at least 8 bp (Figure 2A and Table S1). This result was accordant with an earlier report that tri-, tetra-, penta-, and hexa-nucleotide type SSRs were detected at low rates in cp genomes, while most were mono- and di-nucleotide type SSRs [42]. Compound SSRs consisted of two or more combinations of SSRs with maximum interruption distances of 100 bp [27]. In our study, 111 individual SSRs could form 45 compound SSRs (Table S1). The A/T type mononucleotides were the most abundant SSRs, accounting 84.98% (181/213) (Figure 2B). This was similar to the finding that the main types of SSRs in cp genomes were short polyadenine (polyA) or polythymine (polyT) repeats [43]. Apart from the mononucleotide SSR, the repeat units of other types of SSR were mainly constituted of A or T bases, which might lead to A/T enrichment in the C. illinoinensis cp genome. As shown in Figure 2C, we detected that LSC, SSC, and IR regions possessed 155, 36, and 22 SSRs, respectively. There were 164, 28, and 21 SSRs separately located in the intergenic regions, introns, and coding sequences (Figure 2D). Consistent with previous report [44], SSRs identified in C. illinoinensis cp genome were mainly located in the LSC regions, and were rich in the noncoding region. The primers provided for the C. illinoinensis cp genome SSRs in Table S1, as reported, would be helpful for future population genetic studies, polymorphism investigations, and evolution analysis [45,46,47].
Long repeats are considered to be uncommon in cp genomes for most of land plants [4]. Altogether, 44 long repeats were identified in C. illinoinensis cp genome, including 25 forward repeats, 18 palindromic repeats, and one complementary repeat (Table S2). Most of the repeats had two copy numbers, only two repeats contained three copy numbers (Table S2). For the detected long repeats, 30 repeats were 30–39 bp in size, eight repeats were 40–49 bp, and six repeats were more than 50 bp (the longest was 86 bp) (Table S2). In total, there were 18 repeats that were concentrated in the coding regions of trnS-UGA, trnS-GCU, trnS-GGA, psaB, psaA, rrn4.5S, and ycf2, while the rest of the repeats were located in noncoding regions (Table S2). ycf2 owned the greatest number of coding regions-located repeats (Table S2), which might be attributed to a relatively long size of ycf2 sequence (6846 bp). This result was in line with the finding in Nasturtium officinale [26], Citrus sinensis [48], and Ananas comosus [27].

3.3. Codon Preference Analysis

Generally, an amino acid is encoded by more than one codon (synonymous codon) in an organism, and this phenomenon is referred to as codon degeneracy. The degeneracy of codon is of biological importance for plants, as it could reduce the effects of deleterious mutation. In the absence of selective pressure, there is no bias in codon usage, and the usage probability of synonymous codon is equal [49]. However, the use of synonymous codon generally exhibited preference during plant evolution [50]. The relative synonymous codon usage (RSCU), as an effective index to detect codon preference, is the ratio between the observed and the expected frequency of a specific codon [51]. In C. illinoinensis cp genome, there were 26,250 codons, and 64 kinds of codons encoding 20 amino acids (Table 3). As reported, when RSCU ≤ 1.0, it signifies no preference, 1.0 < RSCU < 1.2 indicates low preference, 1.2 ≤ RSCU ≤ 1.3 means moderate preference, and RSCU > 1.3 represents high preference [49]. Totally, 30 kinds of codons had RSCU values > 1 in our study, of which, 3 exhibited small preference with RSCU values in a range of one to 1.2, 6 were median preference with RSCU values between 1.2 and 1.3, and 21 showed strong preference with RSCU values varied from 1.3 to 1.91 (Table 3). Codons displaying preference may be one of the reasons for the relative conservation of the cp gene. Interestingly, except TTG was G-ending, all the codons that showed preference were A/T ending, which is probably a common phenomenon in cp genomes [26,27].

3.4. SNP and Indel Detection

Evaluation of SNPs and indels in the cp genome of ‘Pawnee’ relative to that of 87MX3-2.11 genotype indicates 143 SNPs and 74 indels existed between these two genomes (Table S3). The intergenic regions, introns, and coding sequences embraced 129 (71 SNPs and 58 indels), 28 (14 SNPs and 14 indels), and 60 (58 SNPs and 2 indels) variations, respectively (Table S2). The coding regions included 31 non-synonymous SNPs, 27 synonymous SNPs, one frame-shifted indel, and one damaged-stop-codon indel (Table S3). Interestingly, we found that there were more SNPs in coding regions than in introns. Native C. illinoinensis has a strong adaptability, which could be found north into Iowa, America and south to Oaxaca, Mexico. For the two genotypes, ‘Pawnee’ is a representative of northern cultivar, and 87MX3-2.11 could survive in the southernmost area. A relatively more SNPs in extrons might be associated with the great variation in adaptation for the two genotypes. Altogether, the comparative result demonstrated that the coding sequences were more conserved than the noncoding sequences (including intergenic regions and intron sequences).
The DNA barcode provides an important marker to facilitate species identification [52]. The commonly used DNA barcodes from cp genomes includes four protein-coding genes (rbcL, matK, rpoC1, and rpoB) and three intergenic regions (trnH-psbA, psbK-psbI and atpF-atpH) [5]. In our study, these markers did present variations between the different genotypes of C. illinoinensis except for the trnH-psbA intergenic region. Despite that, these markers seemed not to be the best candidate DNA barcodes for intraspecific identification of C. illinoinensis. In the present study, the coding region of ycf1 showed the largest number of variations (Table S3), which might be due to its long sequence length (5658 bp). In contrast, although atpF did not exhibit the highest variations (Table S3), it’s polymorphisms were within a length of 768 bp. An optimal DNA barcode should be easy to sequence [53], and sequence larger than 1 kb might need two sequencing runs. Considering the discriminatory power and sequence size of candidate markers, genes (taking intron sequences into account) such as atpF, clpP, and ndhA genes, and intergenic spacers including matK-rps16, trnS-trnG, and trnT-psbD were probably appropriate candidate markers for intraspecific differentiation of C. illinoinensis.

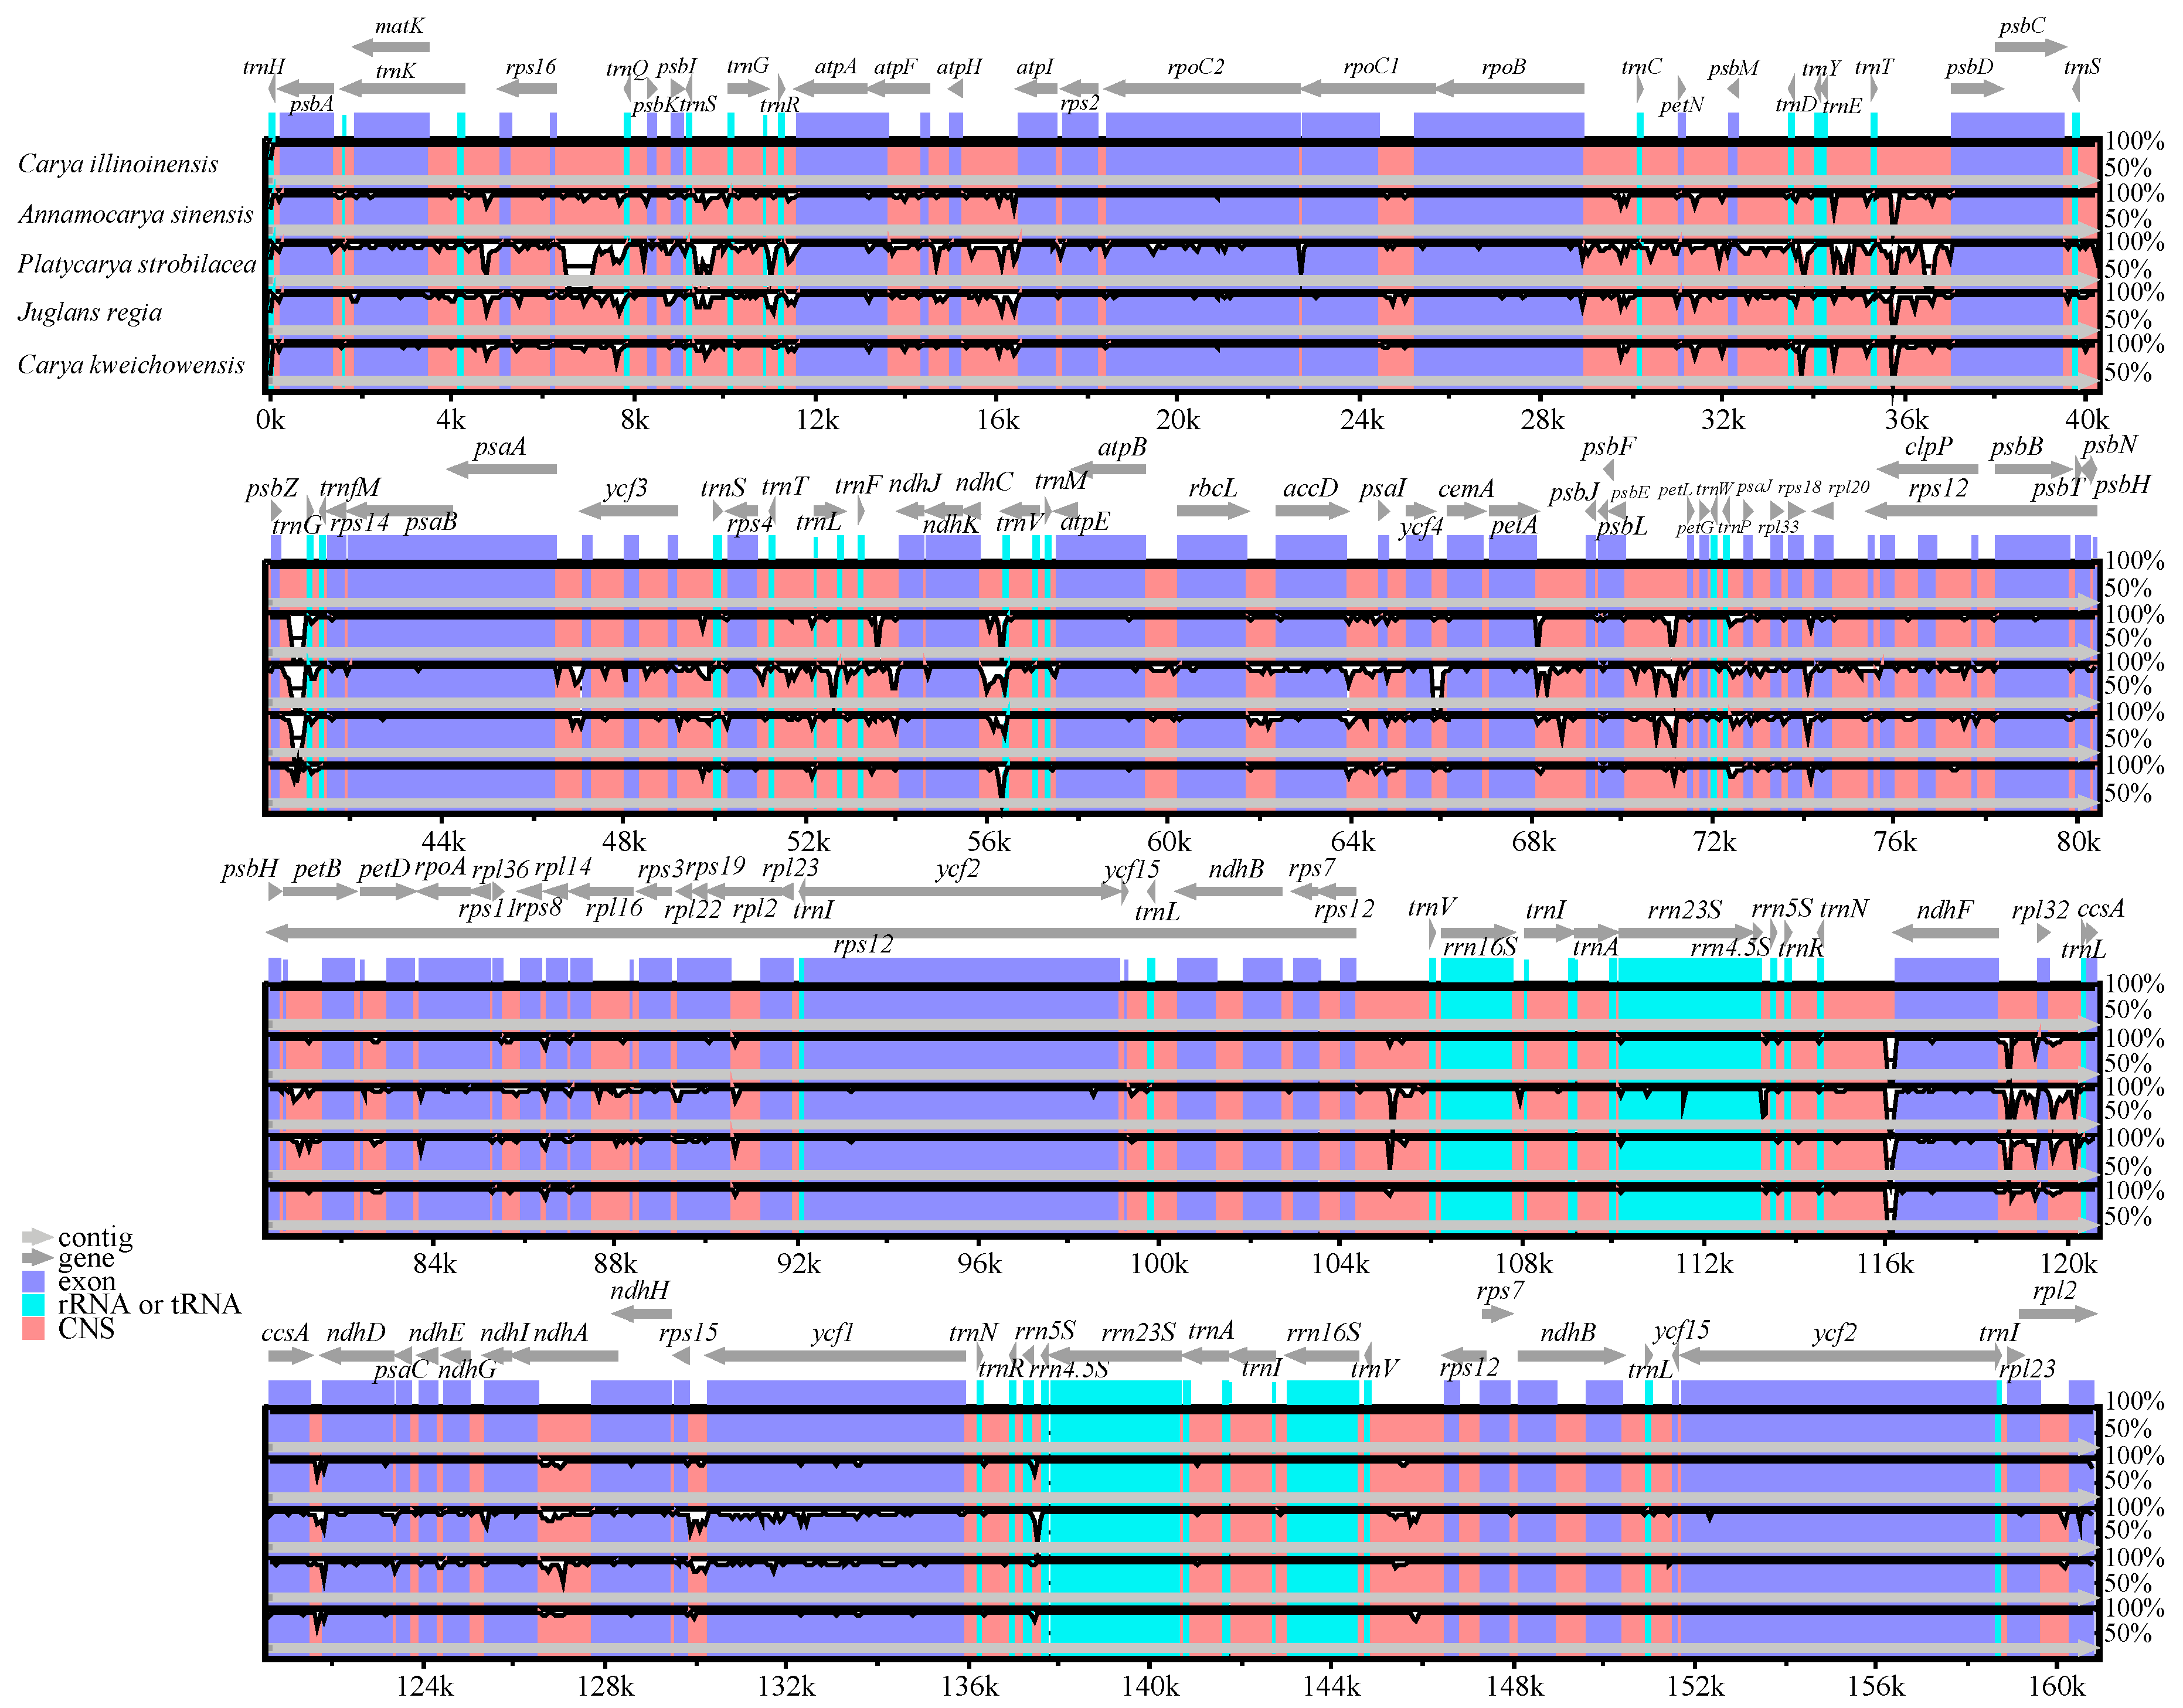
3.5. Comparative Chloroplast Genome Analysis

Multiple alignments of five Juglandaceae cp genomes were compared by mVISTA with C. illinoinensis as a reference. The results revealed a high degree of sequence similarity among these species (Figure 3), suggesting a greatly conserved evolution model for these cp genomes. In general, the coding regions showed less divergence than the non-coding sequences. The main divergences for the coding regions were matK, rpoC2, ndhD, ndhF, and ycf1. In other reports, these genes were also to be highly divergent among the same family species [26,54]. For the noncoding regions, the strongly divergent sequences were trnS-trnG, trnT-psbD, psbZ-trnG, ndhC-trnV, psbE-petL, trnN-ndhF, and ndhF-rpl32, which might be good candidates for Juglandaceae species identification.

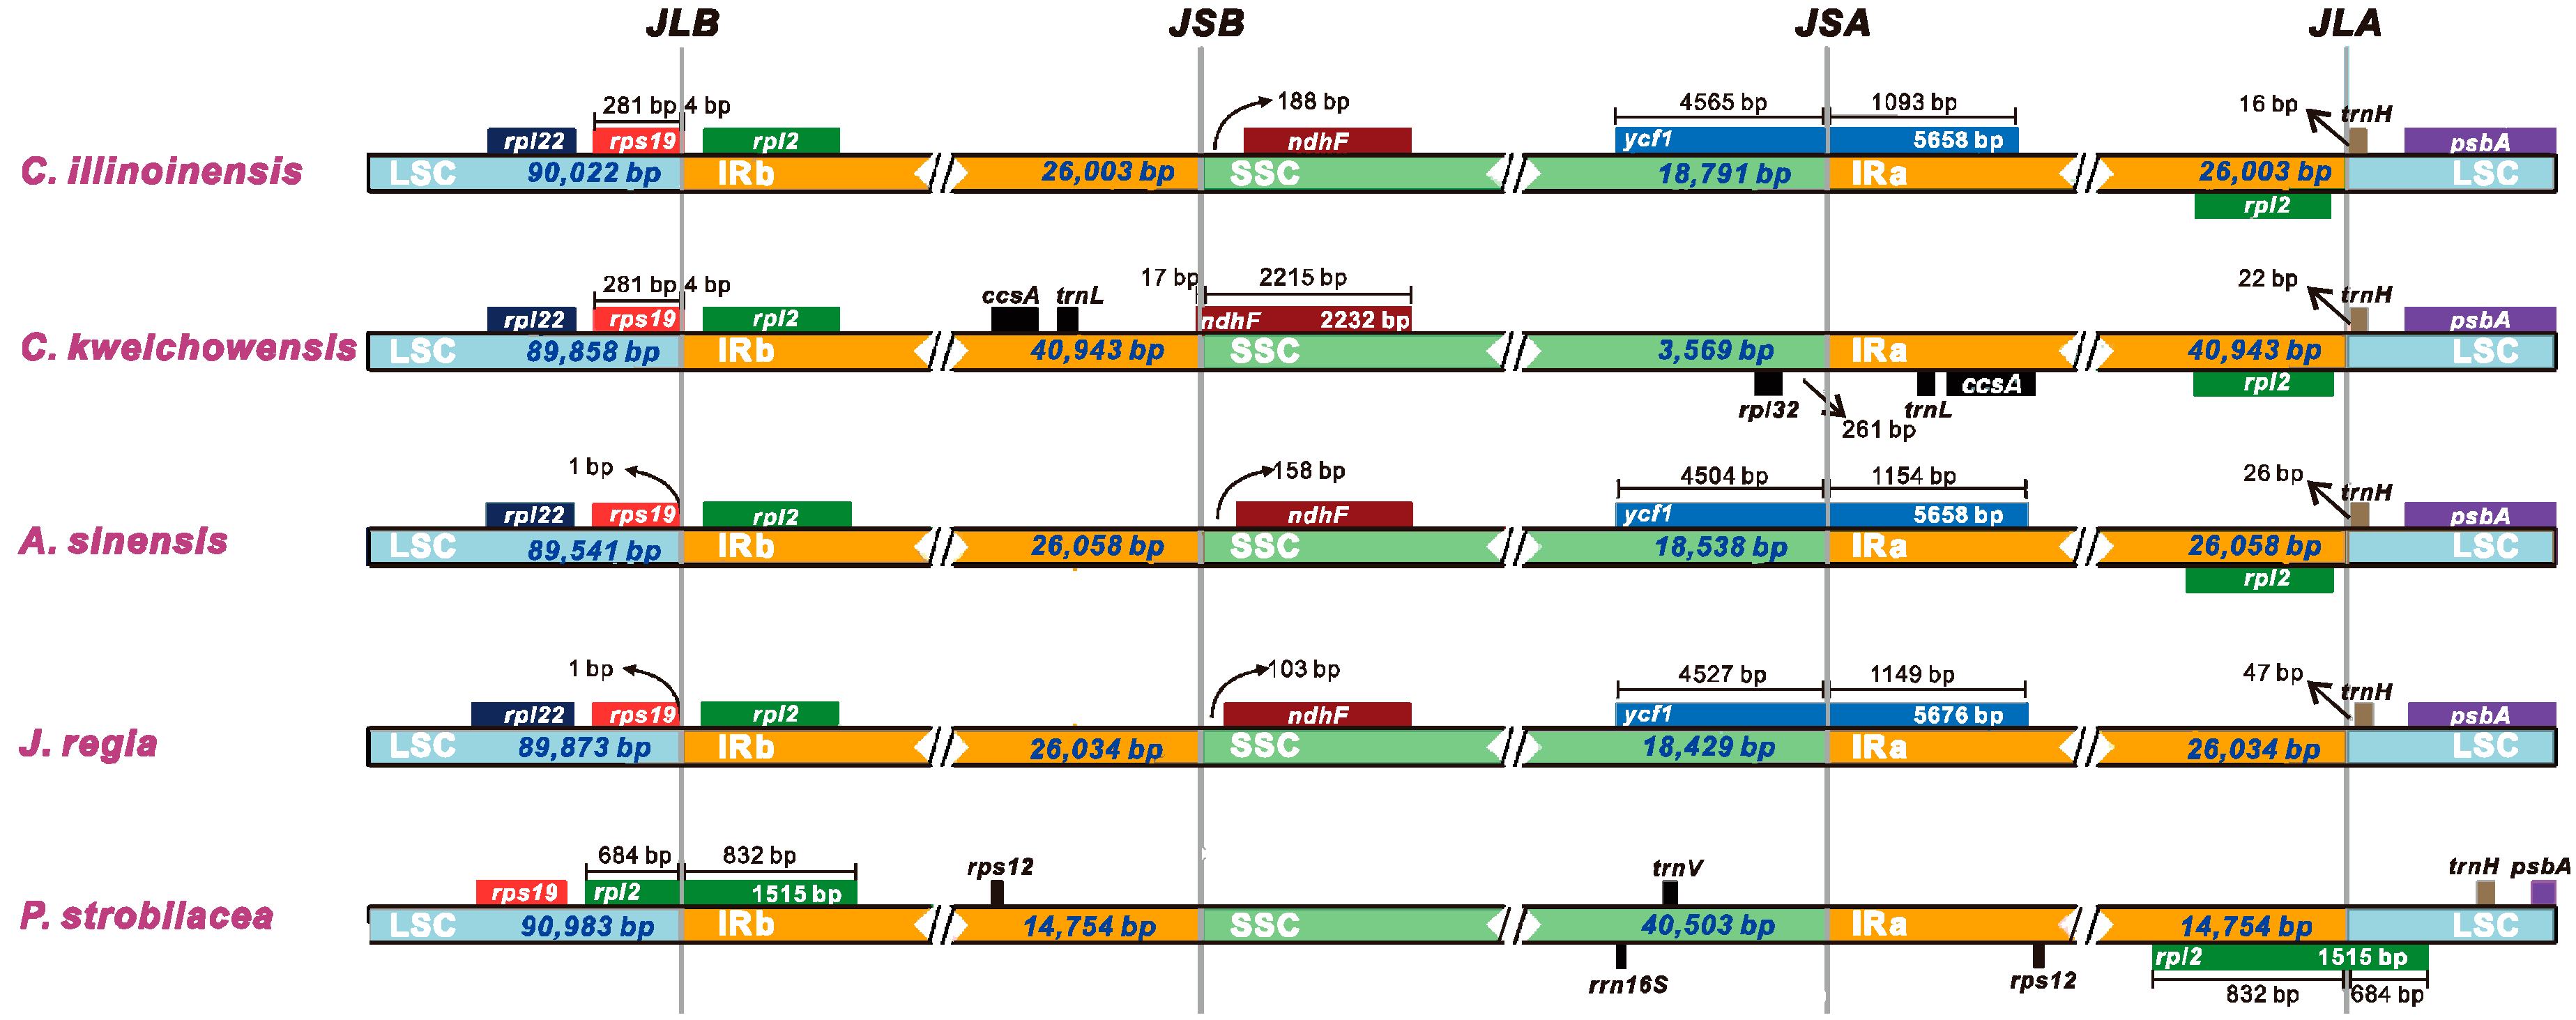
3.6. IR Contraction and Expansion

Despite the IR regions of cp genome were recognized as highly conserved, structural variation in the IR/SC boundary regions was very common. The contraction and expansion of the IR regions could give rise to size difference among cp genomes [55,56]. Comparisons of the IR/SC junctions among five Juglandaceae cp genomes (C. illinoinensis, C. kweichowensis, A. sinensis, J. regia, and P. strobilacea) were presented in Figure 4. We found that the IR regions of C. illinoinensis, A. sinensis, and J. regia did not exhibited major variations, and their IRa boundaries all extended into ycf1 gene, with extension varied from 1093 bp (C. illinoinensis) to 1154 bp (A. sinensis) (Figure 4). Correspondingly, for these three species, a relative longer IR sequence (26,058 bp) was found in A. sinensis, and a shorter IR region (26,003 bp) was included in C. illinoinensis (Figure 4). Among the five species in Juglandaceae, the sequences of rpl2 were completely included in the IR regions except for the P. strobilacea, and a significant shorter IR region (14,754 bp) could be detected in this species (Figure 4). We inferred the IR region of P. strobilacea experienced contraction during evolution, which might lead to the partial sequence of rpl2 being transferred to the LSC region. In comparison to C. illinoinensis, C. kweichowensis embraced a longer IR region, with a size of 40,943 bp (Figure 4), suggesting the IR region of this species might undergo expansion. Consequently, ccsA and trnL were moved to the IR regions of C. kweichowensis, while they were located in the SSC region of C. illinoinensis (Figure 1).

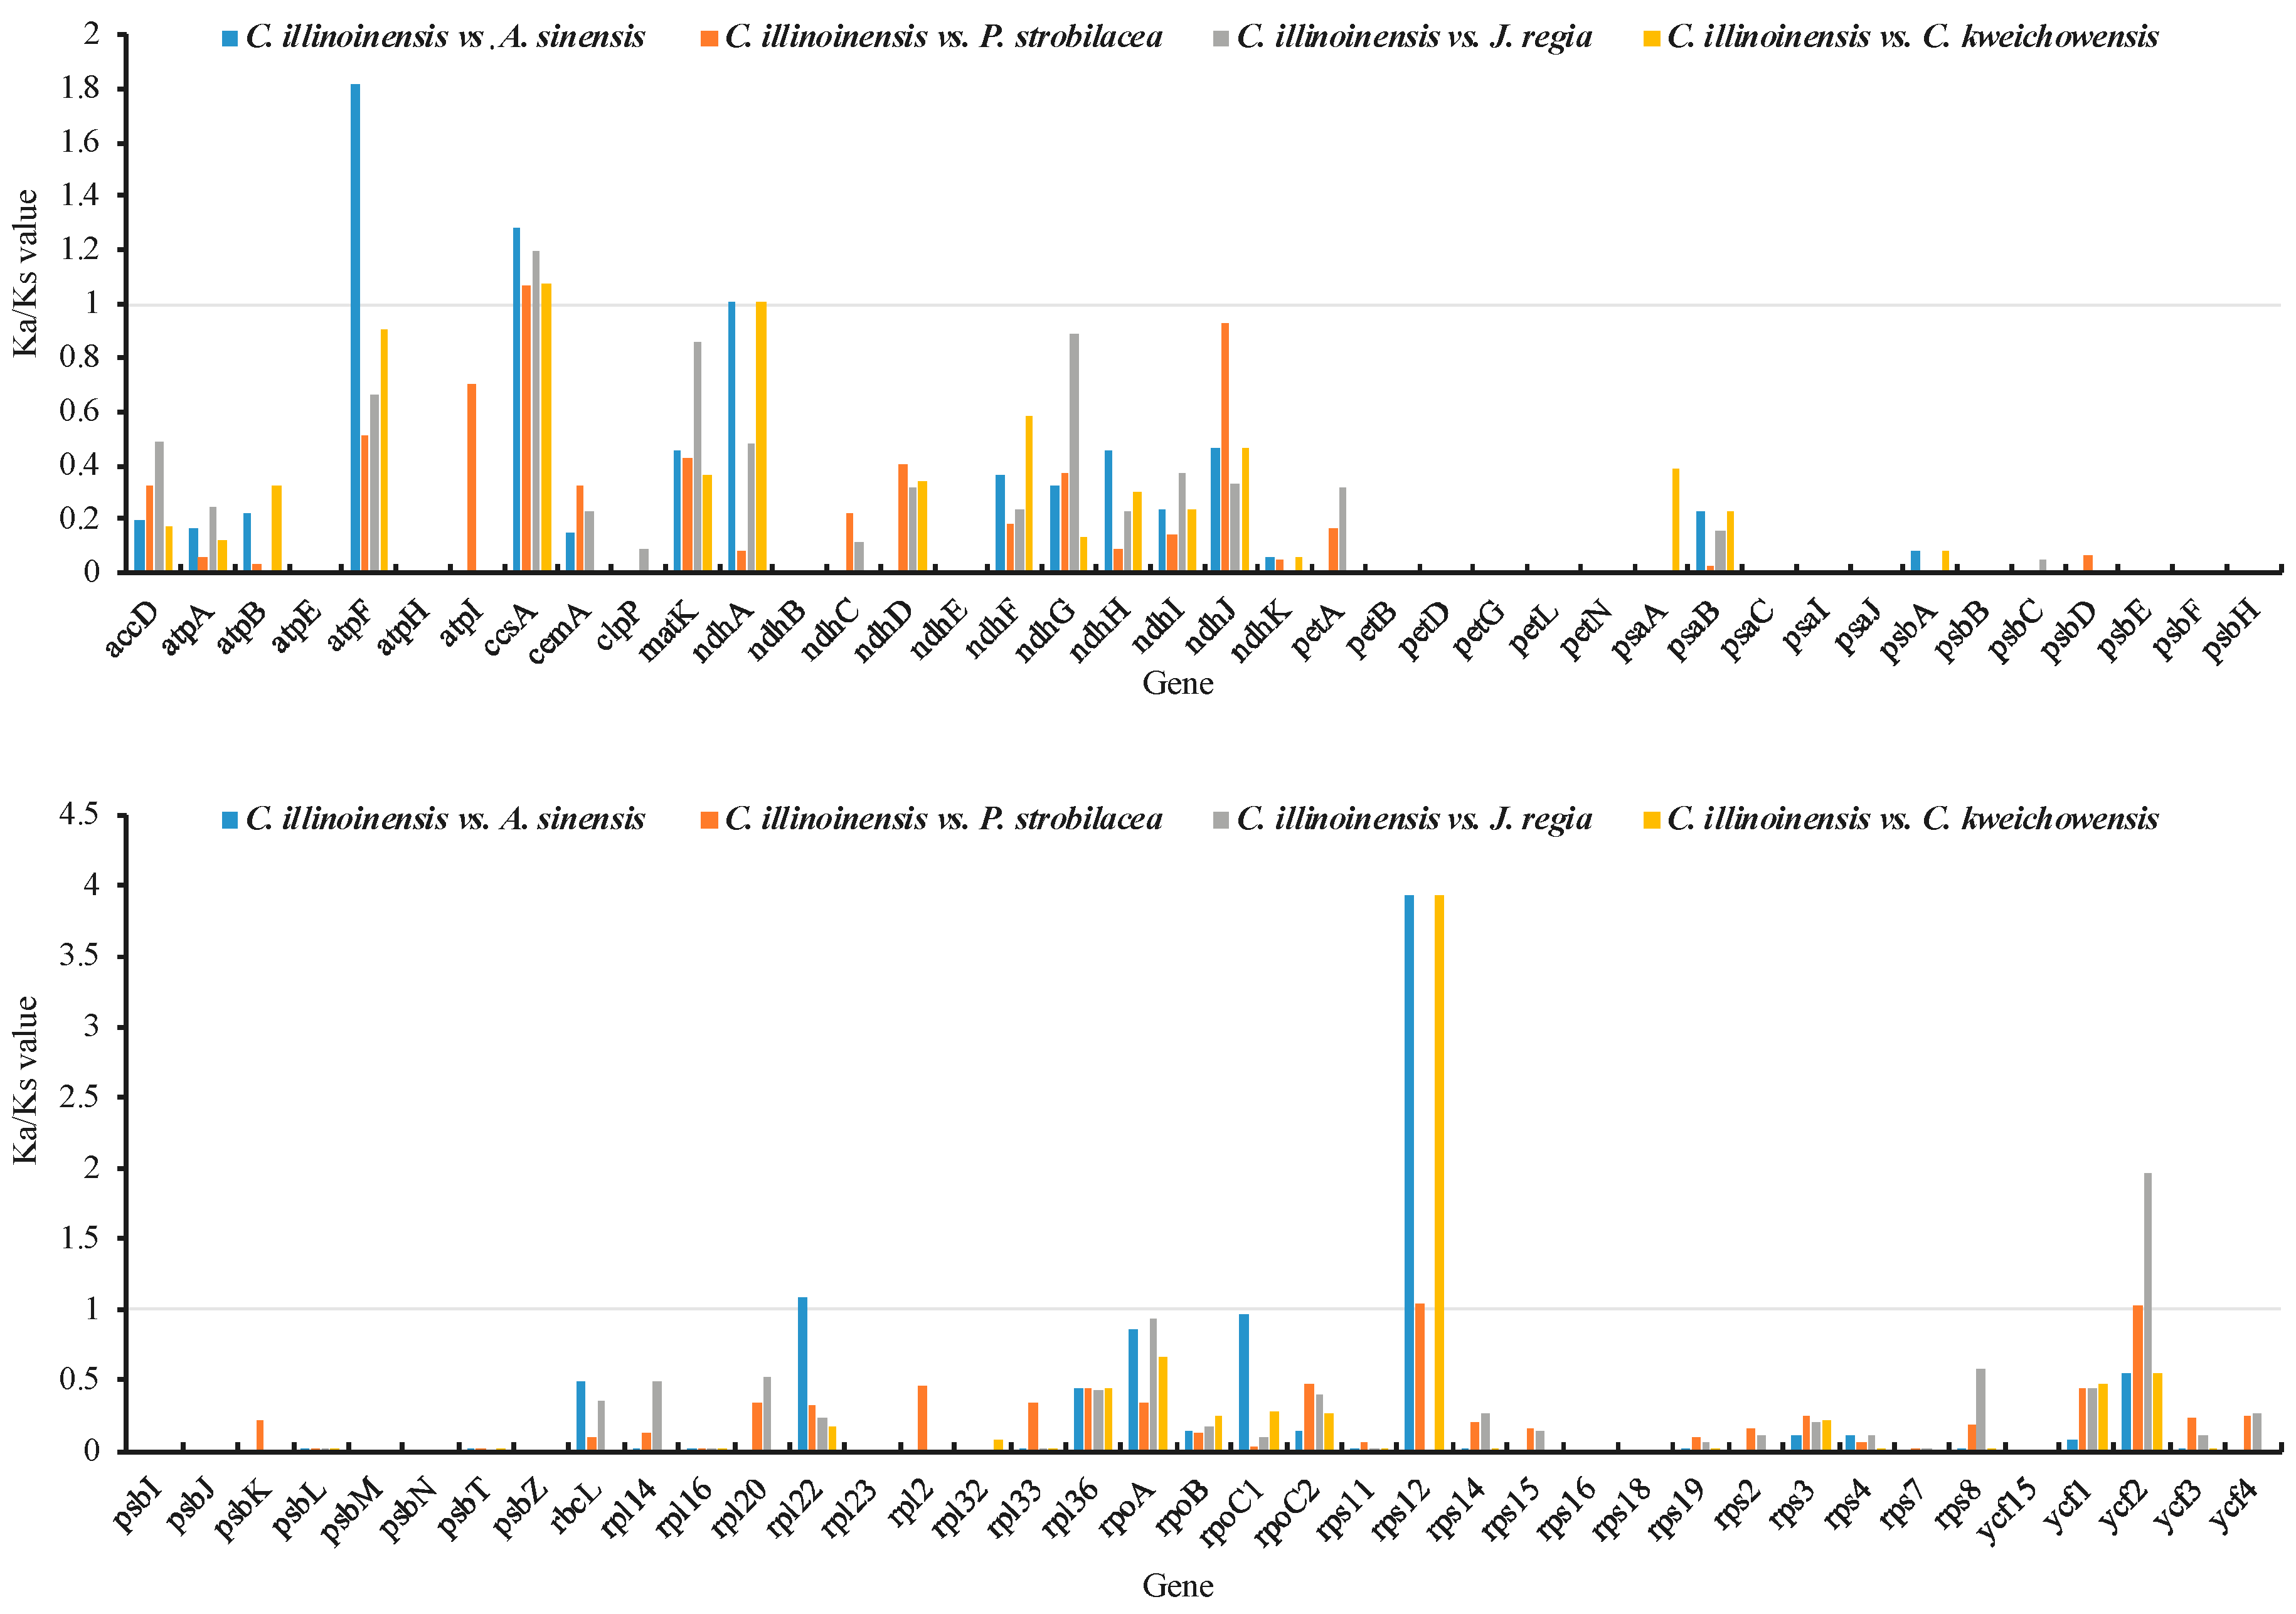
3.7. Selective Pressure in the Evolution of C. illinoinensis

The non-synonymous substitution (Ka) to synonymous substitution (Ks) ratios were applied to detect the rate of difference between gene sequence. The Ka/Ks ratio can determine whether there is selective pressure exerting on a specific gene [55]. In most cases, synonymous changes are more likely to happen than the non-synonymous substitutions, marking that the ratios of Ka/Ks are commonly less than 1. A value of Ka/Ks < 1 is an indicative of purifying selection; when Ka/Ks = 1, it signifies a neutral selection; and if Ka/Ks > 1, it means that there is a positive selection on the studied gene [57,58].
A total of 79 common protein-coding genes across all five Juglandaceae cp genomes were subjected to compute Ka/Ks ratios. In our analysis, the Ka/Ks values of several genes were NA or 50. This happens when the Ks values were extremely low or no substitution existed between the aligned sequence (100% match). In these cases, we replaced NA or 50 with 0. Overall, the Ka/Ks ratios for the majority (74 of 79) genes were below 1 for the four comparisons (Figure 5), indicating that purifying selection were acting on these genes in C. illinoinensis cp. The Ka/Ks ratios for ccsA and rps12 were generally more than 1 (Figure 5), indicating positive selection exerted on ccsA and rps12 in the cp genome of C. illinoinensis. ccsA was involved in cytochrome biosynthesis, and rps12 was related to chloroplast ribosome, both of them have also been reported to play roles in the adaptation of other species [42,59].

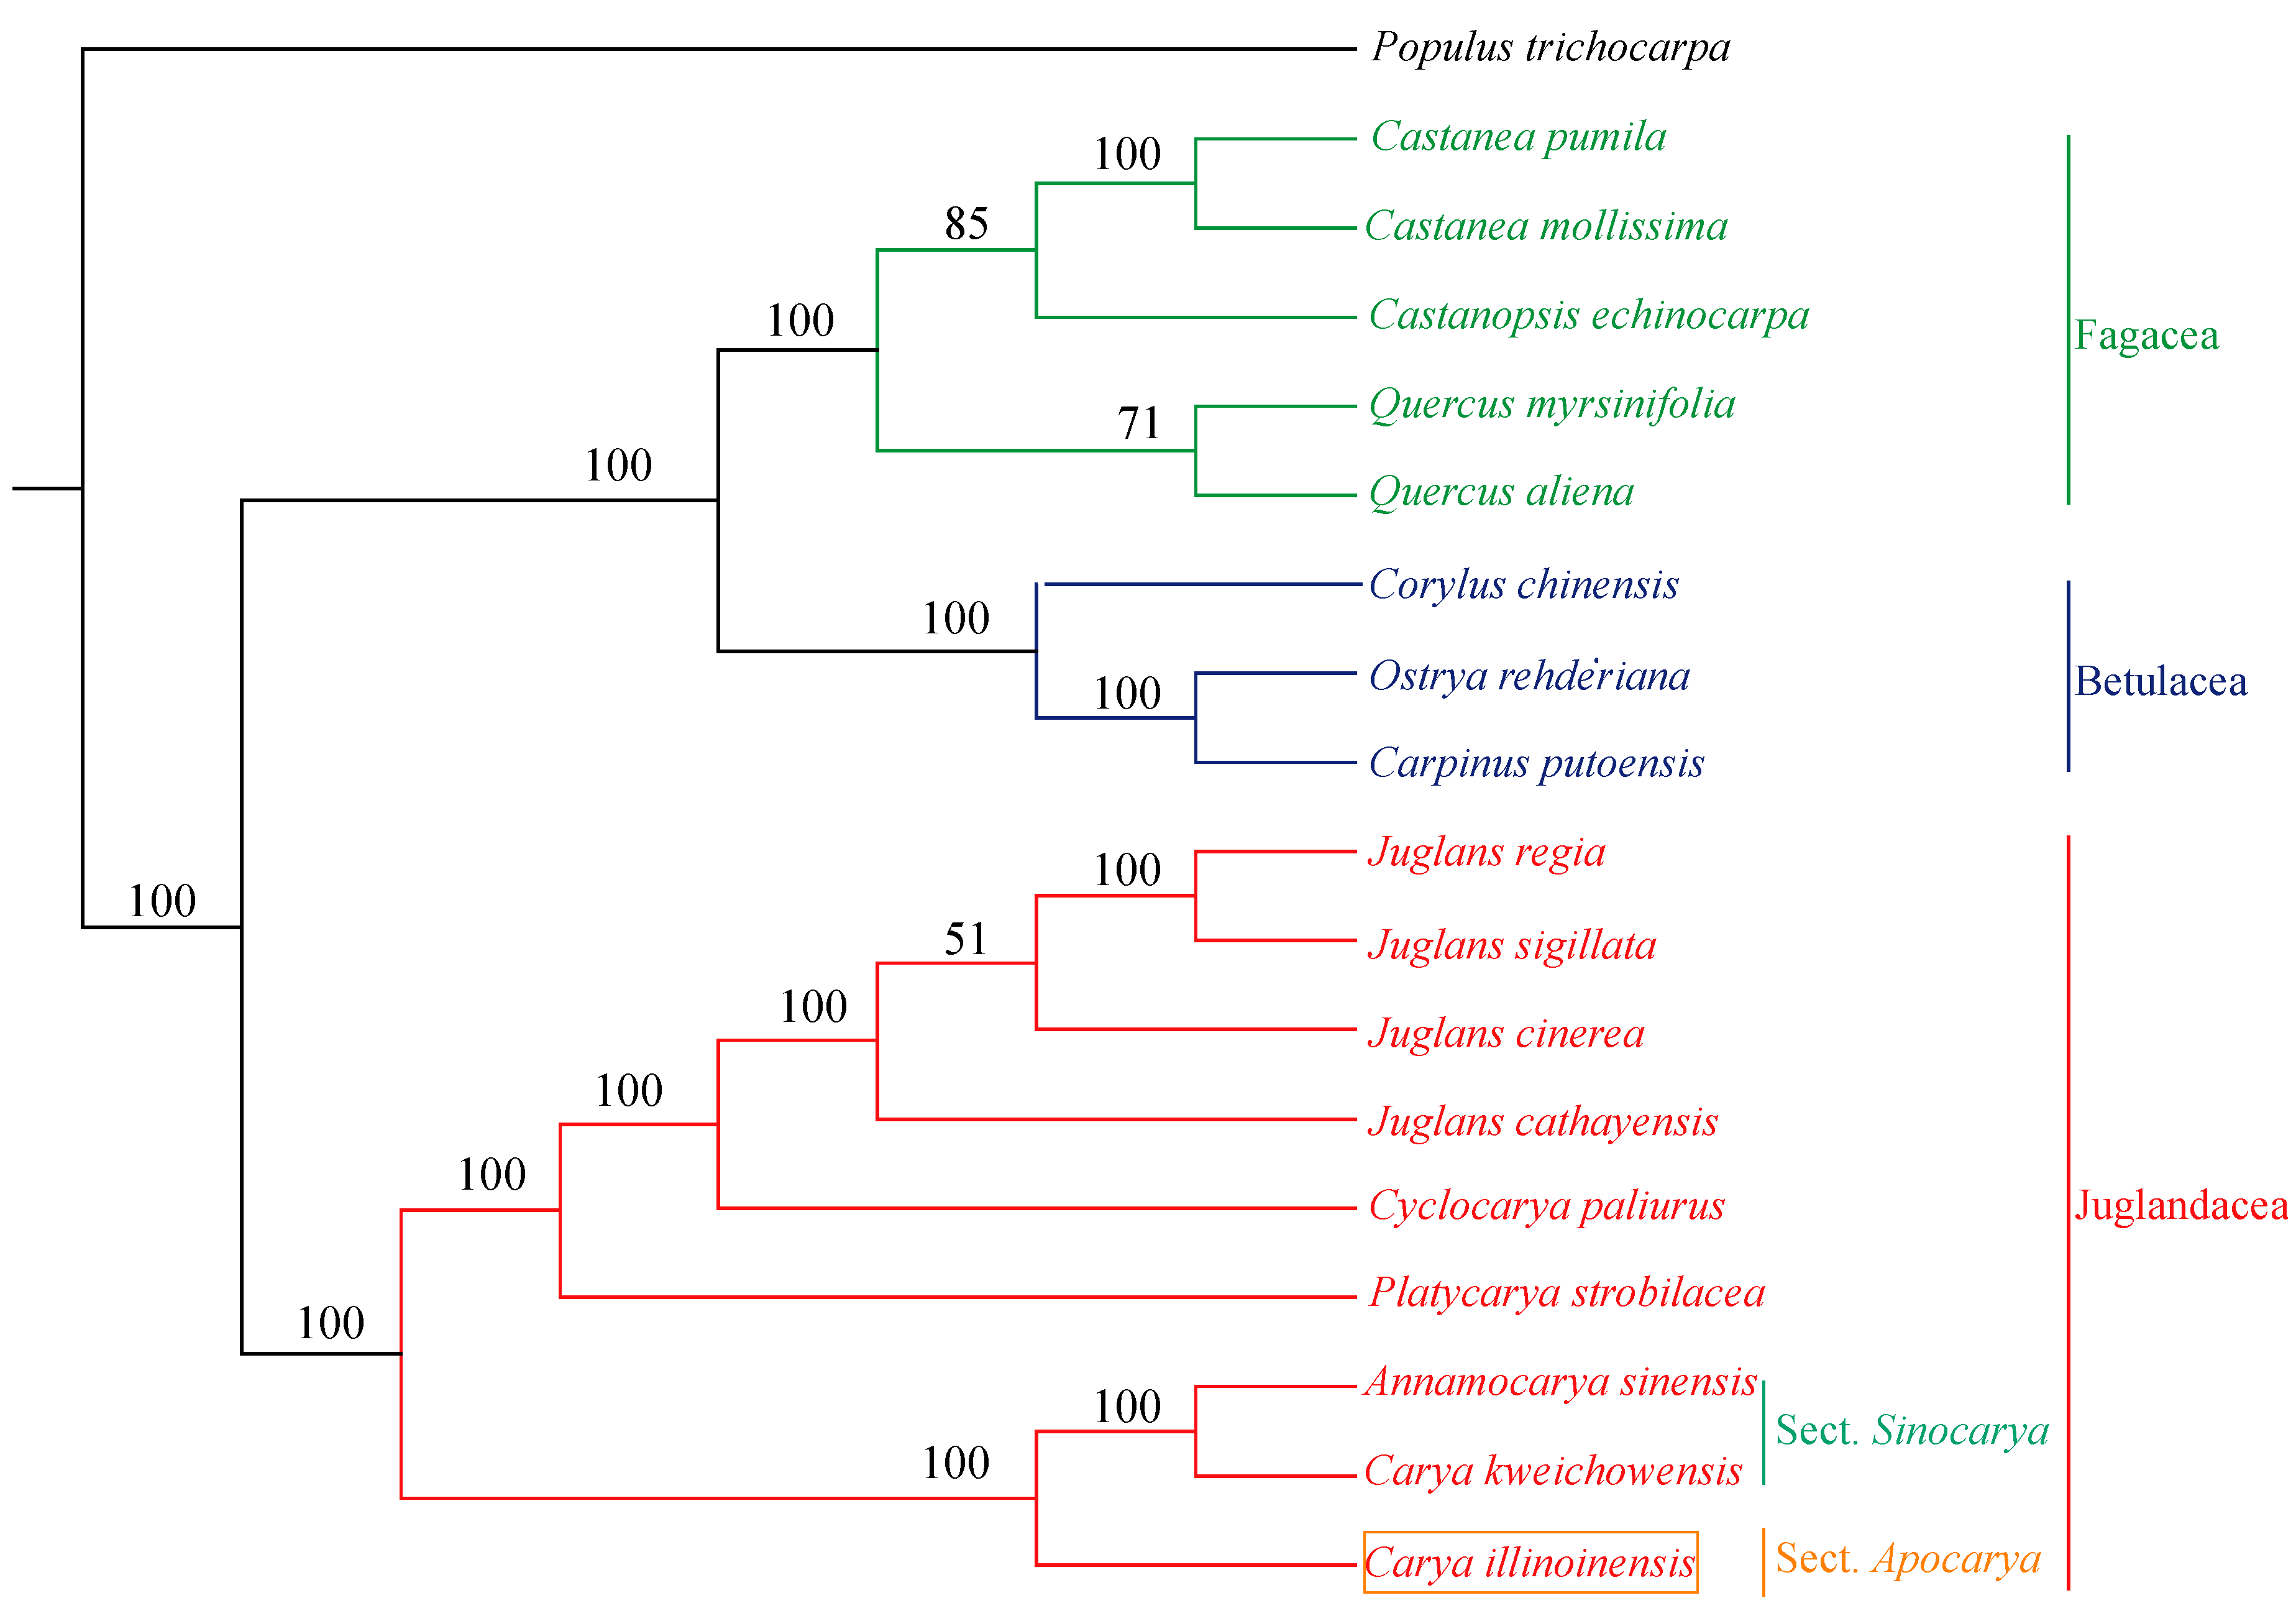
3.8. Phylogenetic Analysis

In the present study, phylogenetic tree was constructed with SNPs from 18 species using ML method with P. trichocarpa as outgroup. As shown in Figure 6, C. illinoinensis formed a single clade and was placed as sister to A. sinensis and C. kweichowensis with a bootstrap value of 100%. Interestingly, C. kweichowensis grouped with A. sinensis rather than C. illinoinensis. Previously, A. sinensis was considered as the monotypic genus Annamocarya, however, it was a plant of the Carya genus based on molecular analysis [12]. Additionally, A. sinensis and C. kweichowensis were both reported to be the representative species of Asian sect. Sinocarya, while C. illinoinensis was a typical plant of the North American sect. Apocarya [60]. This might be the reason that C. illinoinensis and C. kweichowensis fell into two clades.

4. Conclusions

In this study, we analyzed the complete cp genome of C. illinoinensis cv. ‘Pawnee’. It is predicted to encode 112 unique genes, including 79 protein coding genes, 29 tRNAs, and four rRNAs. A total of 213 SSRs and 44 long repeats were identified, which could be used as potential molecular markers. Based on the protein-coding genes in C. illinoinensis genome, codon usage showed a biased toward A/T-ending. Comparative cpDNA analysis of the two C. illinoinensis genotypes, ‘Pawnee’ and 87MX3-2.11, detected 143 SNPs and 74 indels. The highly variable regions such as atpF, clpP, and ndhA genes, and matK-rps16, trnS-trnG, and trnT-psbD intergenic spacers might be useful for future intraspecific identification of C. illinoinensis. Selection pressure analysis of genes in the cp genomes of Juglandaceae indicated ccsA and rps12 genes in C. illinoinensis were under positive selection. Phylogenetic construction results strongly supported that C. illinoinensis forms a sister clade to C. kweichowensis and Annamocarya sinensis.

Supplementary Materials

The following are available online at https://www.mdpi.com/1999-4907/11/2/207/s1, Figure S1: Gene map of C. illinoinensis chloroplast genome, Table S1: SSRs identified in C. illinoinensis chloroplast genome, Table S2: Repeat sequences in the C. illinoinensis cp genome., Table S3: SNPs and indels identified in the C. illinoinensis genotypes of ‘Pawnee ’and 87MX3-2.11.

Author Contributions

J.X. conceived and designed the study. Z.M. performed the data analysis and wrote the manuscript. W.L. and Y.C. carried out DNA extraction. X.J. and Z.G. reviewed the manuscript. M.Z. was involved in sample collection. All authors have read and agreed to the published version of the manuscript.

Funding

This research was funded by National Natural Science Foundation of China, grant number 31901347; Scientific Research Staring Foundation for the Doctor of Institute of Botany, Jiangsu Province and Chinese Academy of Science, and the Jiangsu Provincial Platform for Conservation and Utilization of Agricultural Germplasm.

Conflicts of Interest

The authors declare no conflict of interest.

References

  1. Daniell, H.; Lin, C.S.; Yu, M.; Chang, W.J. Chloroplast genomes: Diversity, evolution, and applications in genetic engineering. Genome Biol. 2016, 17, 134. [Google Scholar] [CrossRef] [PubMed] [Green Version]
  2. Drouin, G.; Daoud, H.; Xia, J. Relative rates of synonymous substitutions in the mitochondrial, chloroplast and nuclear genomes of seed plants. Mol. Phylogenetics Evol. 2008, 49, 827–831. [Google Scholar] [CrossRef] [PubMed]
  3. Fan, W.B.; Wu, Y.; Yang, J.; Shahzad, K.; Li, Z.H. Comparative chloroplast genomics of Dipsacales species: Insights into sequence variation, adaptive evolution, and phylogenetic relationships. Front. Plant Sci. 2018, 9, 689. [Google Scholar] [CrossRef] [PubMed] [Green Version]
  4. Huang, H.; Shi, C.; Liu, Y.; Mao, S.Y.; Gao, L.Z. Thirteen Camellia chloroplast genome sequences determined by high-throughput sequencing: Genome structure and phylogenetic relationships. BMC Evol. Biol. 2014, 14, 151. [Google Scholar] [CrossRef] [PubMed] [Green Version]
  5. Liu, Y.C.; Lin, B.Y.; Lin, J.Y.; Wu, W.L.; Chang, C.C. Evaluation of chloroplast DNA markers for intraspecific identification of Phalaenopsis equestris cultivars. Sci. Hortic. 2016, 203, 86–94. [Google Scholar] [CrossRef]
  6. Mo, Z.; Feng, G.; Su, W.; Liu, Z.; Peng, F. Transcriptomic analysis provides insights into grafting union development in pecan (Carya illinoinensis). Genes 2018, 9, 71. [Google Scholar] [CrossRef] [Green Version]
  7. Wu, J.; Lin, H.; Meng, C.; Jiang, P.; Fu, W. Effects of intercropping grasses on soil organic carbon and microbial community functional diversity under Chinese hickory (Carya cathayensis Sarg.) stands. Soil Res. 2014, 52, 575–583. [Google Scholar] [CrossRef]
  8. Mo, Z.; He, H.; Su, W.; Peng, F. Analysis of differentially accumulated proteins associated with graft union formation in pecan (Carya illinoensis). Sci. Hortic. 2017, 224, 126–134. [Google Scholar] [CrossRef]
  9. Mo, Z.; Feng, G.; Su, W.; Liu, Z.; Peng, F. Identification of miRNAs Associated with Graft Union Development in Pecan [Carya illinoinensis (Wangenh.) K. Koch]. Forests 2018, 9, 472. [Google Scholar] [CrossRef] [Green Version]
  10. Manos, P.S.; Stone, D.E. Evolution, phylogeny, and systematics of the Juglandaceae. Ann. Mo. Bot. Gard. 2001, 88, 231–269. [Google Scholar] [CrossRef]
  11. Lu, A.M.; Zhang, Z.Y. The Differentiation, Evolution and Systematic Relationship of Juglandales. J. Syst. Evol. 1990, 28, 96–102. [Google Scholar]
  12. Zhang, J.B.; Li, R.Q.; Xiang, X.G.; Manchester, S.R.; Lin, L.; Wang, W.; Wen, J.; Chen, Z.D. Integrated fossil and molecular data reveal the biogeographic diversification of the eastern Asian-eastern North American disjunct hickory genus (Carya Nutt.). PLoS ONE 2013, 8, e70449. [Google Scholar] [CrossRef] [PubMed] [Green Version]
  13. Mcpherson, H.; Merwe, M.V.D.; Delaney, S.K.; Edwards, M.A.; Henry, R.J.; Mcintosh, E.; Rymer, P.D.; Milner, M.L.; Siow, J.; Rossetto, M. Capturing chloroplast variation for molecular ecology studies: A simple next generation sequencing approach applied to a rainforest tree. BMC Ecol. 2013, 13, 8. [Google Scholar] [CrossRef] [PubMed] [Green Version]
  14. Luo, R.; Liu, B.; Xie, Y.; Li, Z.; Huang, W.; Yuan, J.; He, G.; Chen, Y.; Pan, Q.; Liu, Y. SOAPdenovo2: An empirically improved memory-efficient short-read de novo assembler. Gigascience 2012, 1, 2047. [Google Scholar] [CrossRef]
  15. Wyman, S.K.; Jansen, R.K.; Boore, J.L. Automatic annotation of organellar genomes with DOGMA. Bioinformatics 2004, 20, 3252–3255. [Google Scholar] [CrossRef] [Green Version]
  16. Peter, S.; Brooks, A.N.; Lowe, T.M. The tRNAscan-SE, snoscan and snoGPS web servers for the detection of tRNAs and snoRNAs. Nucleic Acids Res. 2005, 33, W686–W689. [Google Scholar]
  17. Lohse, M.; Drechsel, O.; Bock, R. OrganellarGenomeDRAW (OGDRAW): A tool for the easy generation of high-quality custom graphical maps of plastid and mitochondrial genomes. Curr. Genet. 2007, 52, 267–274. [Google Scholar] [CrossRef]
  18. Marçais, G.; Delcher, A.L.; Phillippy, A.M.; Coston, R.; Zimin, A. MUMmer4: A fast and versatile genome alignment system. PLoS Comput. Biol. 2018, 14, e1005944. [Google Scholar] [CrossRef] [Green Version]
  19. Li, H.; Durbin, R. Fast and accurate short read alignment with Burrows-Wheeler transform. Bioinformatics 2009, 25, 1754–1760. [Google Scholar] [CrossRef] [Green Version]
  20. Frazer, K.A.; Lior, P.; Alexander, P.; Rubin, E.M.; Inna, D. VISTA: Computational tools for comparative genomics. Nucleic Acids Res. 2004, 32, W273–W279. [Google Scholar] [CrossRef]
  21. Wang, D.; Zhang, Y.; Zhang, Z.; Zhu, J.; Yu, J. KaKs Calculator 2.0: A toolkit incorporating gamma-series methods and sliding window strategies. Genom. Proteom. Bioinform. 2010, 8, 77–80. [Google Scholar] [CrossRef] [Green Version]
  22. Guindon, S.; Dufayard, J.F.; Lefort, V.; Anisimova, M.; Hordijk, W.; Gascuel, O. New algorithms and methods to estimate maximum-likelihood phylogenies: Assessing the performance of PhyML 3.0. Syst. Biol. 2010, 59, 307–321. [Google Scholar] [CrossRef] [PubMed] [Green Version]
  23. Hu, Y.; Woeste, K.E.; Dang, M.; Zhou, T.; Feng, X.; Zhao, G.; Liu, Z.; Li, Z.; Zhao, P. The complete chloroplast genome of common walnut (Juglans regia). Mitochondrial DNA 2016, 1, 189–190. [Google Scholar] [CrossRef]
  24. Hu, Y.; Chen, X.; Feng, X.; Woeste, K.E.; Zhao, P. Characterization of the complete chloroplast genome of the endangered species Carya sinensis (Juglandaceae). Conserv. Genet. Resour. 2016, 8, 467–470. [Google Scholar] [CrossRef]
  25. Zhai, D.C.; Yao, Q.; Cao, X.F.; Hao, Q.Q.; Ma, M.T.; Pan, J.; Bai, X.H. Complete chloroplast genome of the wild-type Hickory Carya cathayensis. Mitochondrial DNA 2019, 4, 1457–1458. [Google Scholar] [CrossRef]
  26. Yan, C.; Du, J.; Gao, L.; Li, Y.; Hou, X. The complete chloroplast genome sequence of watercress (Nasturtium officinale R. Br.): Genome organization, adaptive evolution and phylogenetic relationships in Cardamineae. Gene 2019, 699, 24–36. [Google Scholar] [CrossRef]
  27. Redwan, R.; Saidin, A.; Kumar, S. Complete chloroplast genome sequence of MD-2 pineapple and its comparative analysis among nine other plants from the subclass Commelinidae. BMC Plant Biol. 2015, 15, 196. [Google Scholar] [CrossRef] [Green Version]
  28. Liu, X.F.; Zhu, G.F.; Li, D.M.; Wang, X.J. Complete chloroplast genome sequence and phylogenetic analysis of Spathiphyllum’Parrish’. PLoS ONE 2019, 14, e0224038. [Google Scholar] [CrossRef]
  29. He, Y.; Xiao, H.; Deng, C.; Xiong, L.; Yang, J.; Peng, C. The complete chloroplast genome sequences of the medicinal plant Pogostemon cablin. Int. J. Mol. Sci. 2016, 17, 820. [Google Scholar] [CrossRef] [PubMed] [Green Version]
  30. Hu, Y.; Woeste, K.E.; Zhao, P. Completion of the chloroplast genomes of five Chinese Juglans and their contribution to chloroplast phylogeny. Front. Plant Sci. 2017, 7, 1955. [Google Scholar] [CrossRef] [Green Version]
  31. Yang, J.B.; Tang, M.; Li, H.T.; Zhang, Z.R.; Li, D.Z. Complete chloroplast genome of the genus Cymbidium: Lights into the species identification, phylogenetic implications and population genetic analyses. BMC Evol. Biol. 2013, 13, 84. [Google Scholar] [CrossRef] [Green Version]
  32. Wang, W.; Yu, H.; Wang, J.; Lei, W.; Gao, J.; Qiu, X.; Wang, J. The complete chloroplast genome sequences of the medicinal plant Forsythia suspensa (Oleaceae). Int. J. Mol. Sci. 2017, 18, 2288. [Google Scholar] [CrossRef] [Green Version]
  33. Yang, M.; Zhang, X.; Liu, G.; Yin, Y.; Chen, K.; Yun, Q.; Zhao, D.; Al-Mssallem, I.S.; Yu, J. The complete chloroplast genome sequence of date palm (Phoenix dactylifera L.). PLoS ONE 2010, 5, e12762. [Google Scholar] [CrossRef] [PubMed] [Green Version]
  34. Zhang, Y.; Wang, G.; Zhou, J.; Zhou, X.; Li, P.; Wang, Z. The first complete chloroplast genome sequence of Pteroceltis tatarinowii (Ulmaceae), an endangered tertiary relict tree endemic to China. Mitochondrial DNA 2019, 4, 487–488. [Google Scholar] [CrossRef] [Green Version]
  35. Ko, J.H.; Lee, S.J.; Cho, B.; Lee, Y. Differential promoter usage of infA in response to cold shock in Escherichia coli. FEBS Lett. 2006, 580, 539–544. [Google Scholar] [CrossRef] [PubMed] [Green Version]
  36. Millen, R.S.; Olmstead, R.G.; Adams, K.L.; Palmer, J.D.; Lao, N.T.; Heggie, L.; Kavanagh, T.A.; Hibberd, J.M.; Gray, J.C.; Morden, C.W. Many parallel losses of infA from chloroplast DNA during angiosperm evolution with multiple independent transfers to the nucleus. Plant Cell 2001, 13, 645–658. [Google Scholar] [CrossRef] [PubMed] [Green Version]
  37. Asaf, S.; Khan, A.L.; Khan, A.R.; Waqas, M.; Kang, S.; Khan, M.A.; Lee, S.; Lee, I. Complete Chloroplast Genome of Nicotiana otophora and its Comparison with Related Species. Front. Plant Sci. 2016, 7, 843. [Google Scholar] [CrossRef] [Green Version]
  38. Vera, A.; Sugiura, M. A novel RNA gene in the tobacco plastid genome: Its possible role in the maturation of 16S rRNA. EMBO J. 1994, 13, 2211–2217. [Google Scholar] [CrossRef]
  39. Sugita, M.; Svab, Z.; Maliga, P.; Sugiura, M. Targeted deletion of sprA from the tobacco plastid genome indicates that the encoded small RNA is not essential for pre-16S rRNA maturation in plastids. Mol. Gen. Genet. MGG 1997, 257, 23–27. [Google Scholar] [CrossRef]
  40. Ibrahim, R.I.H.; Azuma, J.-I.; Sakamoto, M. Complete nucleotide sequence of the cotton (Gossypium barbadense L.) chloroplast genome with a comparative analysis of sequences among 9 dicot plants. Genes Genet. Syst. 2006, 81, 311–321. [Google Scholar] [CrossRef] [Green Version]
  41. Vu, H.T.; Tran, N.; Nguyen, T.D.; Vu, Q.L.; Bui, M.H.; Le, M.T.; Le, L. Complete chloroplast genome of Paphiopedilum delenatii and phylogenetic relationships among Orchidaceae. Plants 2020, 9, 61. [Google Scholar] [CrossRef] [PubMed] [Green Version]
  42. Dong, W.L.; Wang, R.N.; Zhang, N.Y.; Fan, W.B.; Fang, M.F.; Li, Z.H. Molecular evolution of chloroplast genomes of orchid species: Insights into phylogenetic relationship and adaptive evolution. Int. J. Mol. Sci. 2018, 19, 716. [Google Scholar] [CrossRef] [PubMed] [Green Version]
  43. Kuang, D.Y.; Wu, H.; Wang, Y.L.; Gao, L.M.; Zhang, S.Z.; Lu, L. Complete chloroplast genome sequence of Magnolia kwangsiensis (Magnoliaceae): Implication for DNA barcoding and population genetics. Genome 2011, 54, 663–673. [Google Scholar] [CrossRef] [PubMed] [Green Version]
  44. Li, D.M.; Zhao, C.Y.; Liu, X.F. Complete Chloroplast Genome Sequences of Kaempferia galanga and Kaempferia elegans: Molecular Structures and Comparative Analysis. Molecules 2019, 24, 474. [Google Scholar] [CrossRef] [PubMed] [Green Version]
  45. Provan, J.; Powell, W.; Hollingsworth, P.M. Chloroplast microsatellites: New tools for studies in plant ecology and evolution. Trends Ecol. Evol. 2001, 16, 142–147. [Google Scholar] [CrossRef]
  46. Mengoni, A.; Barabesi, C.; Gonnelli, C.; Galardi, F.; Gabbrielli, R.; Bazzicalupo, M. Genetic diversity of heavy metal-tolerant populations in Silene paradoxa L.(Caryophyllaceae): A chloroplast microsatellite analysis. Mol. Ecol. 2001, 10, 1909–1916. [Google Scholar] [CrossRef]
  47. Provan, J.; Russell, J.; Booth, A.; Powell, W. Polymorphic chloroplast simple sequence repeat primers for systematic and population studies in the genus Hordeum. Mol. Ecol. 1999, 8, 505–511. [Google Scholar] [CrossRef] [Green Version]
  48. Bausher, M.G.; Singh, N.D.; Lee, S.-B.; Jansen, R.K.; Daniell, H. The complete chloroplast genome sequence of Citrus sinensis (L.) Osbeck var’Ridge Pineapple’: Organization and phylogenetic relationships to other angiosperms. BMC Plant Biol. 2006, 6, 21. [Google Scholar] [CrossRef] [Green Version]
  49. Zuo, L.H.; Shang, A.Q.; Zhang, S.; Yu, X.Y.; Ren, Y.C.; Yang, M.S.; Wang, J.M. The first complete chloroplast genome sequences of Ulmus species by de novo sequencing: Genome comparative and taxonomic position analysis. PLoS ONE 2017, 12, e0171264. [Google Scholar] [CrossRef] [Green Version]
  50. Liu, Q.; Xue, Q. Comparative studies on codon usage pattern of chloroplasts and their host nuclear genes in four plant species. J. Genet. 2005, 84, 55–62. [Google Scholar] [CrossRef]
  51. Sharp, P.M.; Li, W.H. The codon adaptation index-a measure of directional synonymous codon usage bias, and its potential applications. Nucleic Acids Res. 1987, 15, 1281–1295. [Google Scholar] [CrossRef] [PubMed] [Green Version]
  52. Dasmahapatra, K.; Mallet, J. DNA barcodes: Recent successes and future prospects. Heredity 2006, 97, 254–255. [Google Scholar] [CrossRef]
  53. Hollingsworth, P.M.; Graham, S.W.; Little, D.P. Choosing and using a plant DNA barcode. PLoS ONE 2011, 6, e19254. [Google Scholar] [CrossRef] [PubMed]
  54. Ivanova, Z.; Sablok, G.; Daskalova, E.; Zahmanova, G.; Apostolova, E.; Yahubyan, G.; Baev, V. Chloroplast genome analysis of resurrection tertiary relict Haberlea rhodopensis highlights genes important for desiccation stress response. Front. Plant Sci. 2017, 8, 204. [Google Scholar] [CrossRef] [Green Version]
  55. Yu, X.; Zuo, L.; Lu, D.; Lu, B.; Yang, M.; Wang, J. Comparative analysis of chloroplast genomes of five Robinia species: Genome comparative and evolution analysis. Gene 2019, 689, 141–151. [Google Scholar] [CrossRef]
  56. Kim, K.J.; Lee, H.L. Complete chloroplast genome sequences from Korean ginseng (Panax schinseng Nees) and comparative analysis of sequence evolution among 17 vascular plants. DNA Res. 2004, 11, 247–261. [Google Scholar] [CrossRef] [PubMed]
  57. Brunet, F.D.R.G.; Crollius, H.R.; Paris, M.; Aury, J.-M.; Gibert, P.; Jaillon, O.; Laudet, V.; Robinson-Rechavi, M. Gene loss and evolutionary rates following whole-genome duplication in teleost fishes. Mol. Biol. Evol. 2006, 23, 1808–1816. [Google Scholar] [CrossRef]
  58. Yang, Z.; Nielsen, R. Estimating synonymous and nonsynonymous substitution rates under realistic evolutionary models. Mol. Biol. Evol. 2000, 17, 32–43. [Google Scholar] [CrossRef] [Green Version]
  59. Hu, S.; Sablok, G.; Wang, B.; Qu, D.; Barbaro, E.; Viola, R.; Li, M.; Varotto, C. Plastome organization and evolution of chloroplast genes in Cardamine species adapted to contrasting habitats. BMC Genom. 2015, 16, 306. [Google Scholar] [CrossRef] [Green Version]
  60. Grauke, L.; Mendoza-Herrera, M.; Binzel, M. Plastid microsatellite markers in Carya. In Proceedings of the International Symposium on Molecular Markers in Horticulture 859, Mexico; 2009; pp. 237–246. [Google Scholar]
Figure 1. Gene map of C. illinoinensis chloroplast genome. Genes drawn inside and outside of the circle are transcribed in the clockwise and counterclockwise directions, respectively. Genes belonging to different functional groups are color coded. The darker and lighter gray in the inner circle corresponds to GC and AT content, respectively. LSC, large single copy region; SSC, small single copy region; IR, inverted repeat.
Forests 11 00207 g001
Figure 2. Distribution of SSRs in the chloroplast genomes of C. illinoinensis. (A) Number of different SSR types detected in cp genome; (B) Number of SSRs in different repeat class types; (C) Number of SSRs in different genomic regions; (D) Number of SSRs in intergenic regions, introns, and coding sequences.
Forests 11 00207 g002
Figure 3. A comparison of the cp genomes among five Juglandaceae species. Gray arrows above the alignment indicate gene orientation. Genome regions are color-coded as exons, rRNA or tRNA, and non-coding sequences (CNS). Vertical scale indicates the percentage of identity ranging from 50 to 100%.
Forests 11 00207 g003
Figure 4. Comparison of the borders of LSC, SSC, and IR regions among five Juglandaceae cp genomes.
Forests 11 00207 g004
Figure 5. The Ka/Ks ratios of 79 protein-coding genes of the C. illinoinensis cp genome vs. four Juglandaceae species.
Forests 11 00207 g005
Figure 6. Phylogenetic tree constructed with SNPs from 18 species using maximum likelihood method. P. trichocarpa was set as an outgroup. Bootstrap values are shown at the nodes.
Forests 11 00207 g006
Table 1. Summary of the C. illinoinensis chloroplast genome features.
Genome FeaturesC. illinoinensis
Genome size (bp)/GC content (%)160,819/36.15
LSC size (bp)/GC content (%)90,022/33.74
SSC size (bp)/GC content (%)18,791/29.89
IR size (bp)/GC content (%)26,003/42.58
Total gene number131
Unique gene number112
Protein-coding gene79
tRNAs29
rRNAs4
Genes duplicated in IR19
LSC, large single copy region; SSC, small single copy region; IR, inverted repeat.
Table 2. List of genes in the chloroplast genome of C. illinoinensis.
Groups of GenesName of Genes
Transfer RNAstrnA-UGCab, trnC-GCA, trnD-GUC, trnE-UUC, trnF-GAA, trnfM-CAU, trnG-GCCab, trnH-GUG, trnI-CAUa, trnI-GAUab, trnK-UUUb, trnL-CAAa, trnL-UAG, trnL-UAAb, trnM-CAU, trnN-GUUa, trnP-UGG, trnQ-UUG, trnR-ACGa, trnR-UCU, trnS-GCU, trnS-UGA, trnS-GGA, trnT-GGU, trnT-UGU, trnV-GACa, trnV-UACb, trnW-CCA, trnY-GUA
ribosomal RNAsrrn4.5Sa, rrn5Sa, rrn16Sa, rrn23Sa
Ribosomal protein small subunitrps2, rps3, rps4, rps7a, rps8, rps11, rps12abc, rps14, rps15, rps16b, rps18, rps19
Ribosomal protein large subunitrpl2ab, rpl14, rpl16b, rpl20, rpl22, rpl23a, rpl32, rpl33, rpl36
Subunits of RNA polymeraserpoB, rpoA, rpoC1b, rpoC2
Photosystem IpsaA, psaB, psaC, psaI, psaJ, ycf3b, ycf4
Photosystem IIpsbA, psbB, psbC, psbD, psbE, psbF, psbH, psbI, psbJ, psbK, psbL, psbM, psbN, psbT, psbZ
Cythochrome b/f complexpetA, petBb, petDb, petG, petL, petN
ATP synthaseatpA, atpB, atpE, atpFb, atpH, atpI
NADH-dehydrogenasendhAb, ndhBab, ndhC, ndhD, ndhE, ndhF, ndhG, ndhH, ndhI, ndhJ, ndhK
Large subunit RubiscorbcL
Acetyl-CoA carboxylaseaccD
MaturasematK
Inner membrane proteincemA
ATP-dependent proteaseclpPb
Cytochrome c biogenesisccsA
Conserved open reading framesycf1, ycf2a, ycf15ad
a Two gene copies in IRs; b Genes containing introns; c Genes divided into two independent transcription units; d Pseudogene.
Table 3. Codon usage in C. illinoinensis.
Amino AcidsCodonNO.RSCUAmino AcidsCodonNO.RSCU
AlaGCA3931.1293ProCCA3031.1211
AlaGCC2010.5775ProCCC2090.7733
AlaGCG1570.4511ProCCG1540.5698
AlaGCT6411.8419ProCCT4151.5356
CysTGC780.5182GlnCAA7341.5633
CysTGT2231.4817GlnCAG2050.4366
AspGAC2120.3962ArgAGA4881.8614
AspGAT8581.6037ArgAGG1670.6369
GluGAA10201.4988ArgCGA3601.3731
GluGAG3410.5011ArgCGC1030.3928
ProTTC5170.6991ArgCGG1150.4386
ProTTT9621.3008ArgCGT3401.2968
GlyGGA7251.6467SerAGC1270.381
GlyGGC1800.4088SerAGT4031.209
GlyGGG2700.6132SerTCA4071.221
GlyGGT5861.331SerTCC3210.963
HisCAC1310.4192SerTCG1820.546
HisCAT4941.5808SerTCT5601.68
IleATA7590.9734STOPTAA431.4999
IleATC4430.5681STOPTAG230.8023
IleATT11371.4583STOPTGA200.6976
LysAAA10471.483ThrACA3911.2095
LysAAG3650.5169ThrACC2300.7115
LeuCTA3740.8054ThrACG1430.4423
LeuCTC1870.4027ThrACT5291.6365
LeuCTG1770.3811ValGTA5461.5611
LeuCTT6021.2964ValGTC1690.4832
LeuTTA8871.9102ValGTG1800.5146
LeuTTG5591.2038ValGTT5041.441
MetATG6071TrpTGG4631
AsnAAC2970.4608TyrTAC2020.4064
AsnAAT9921.5391TyrTAT7921.5935

