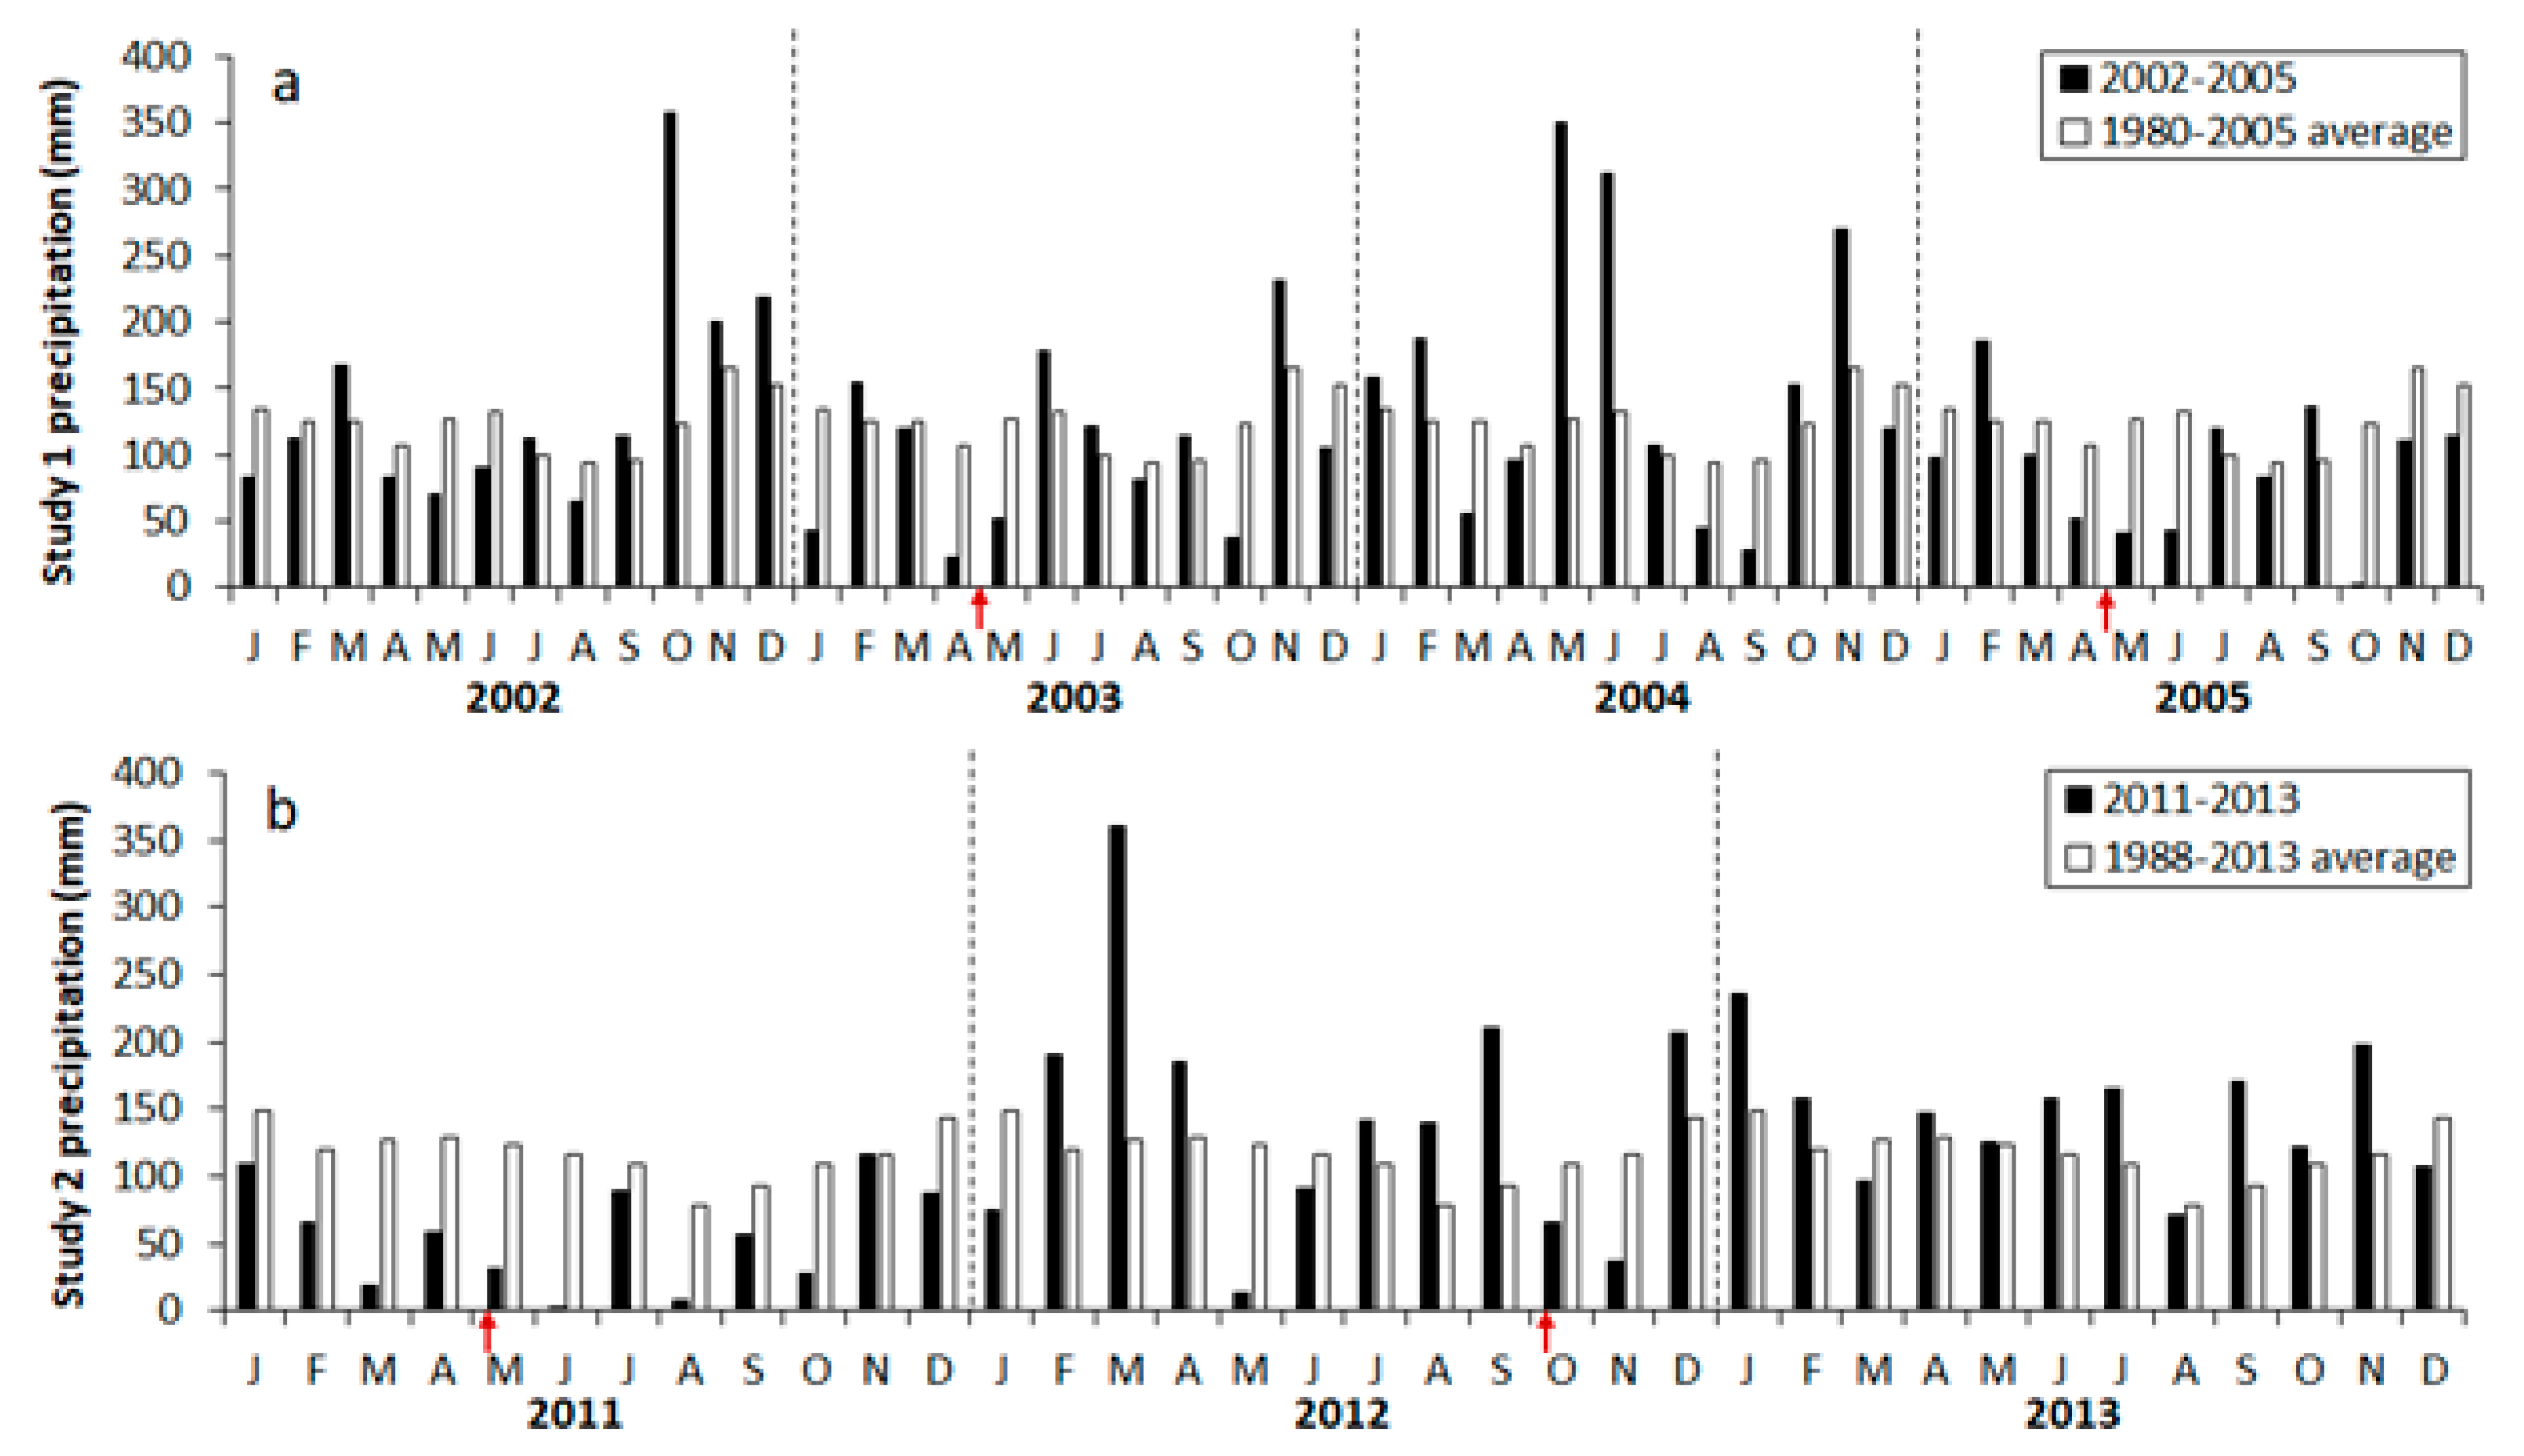
Figure 1.
(a) Precipitation at study 1 in 2002 through 2005 and averaged between 1980 and 2005, and (b) at study 2 in 2011 through 2013 and averaged between 1988 and 2013. Arrows indicate prescribed fire application.
Figure 1.
(a) Precipitation at study 1 in 2002 through 2005 and averaged between 1980 and 2005, and (b) at study 2 in 2011 through 2013 and averaged between 1988 and 2013. Arrows indicate prescribed fire application.
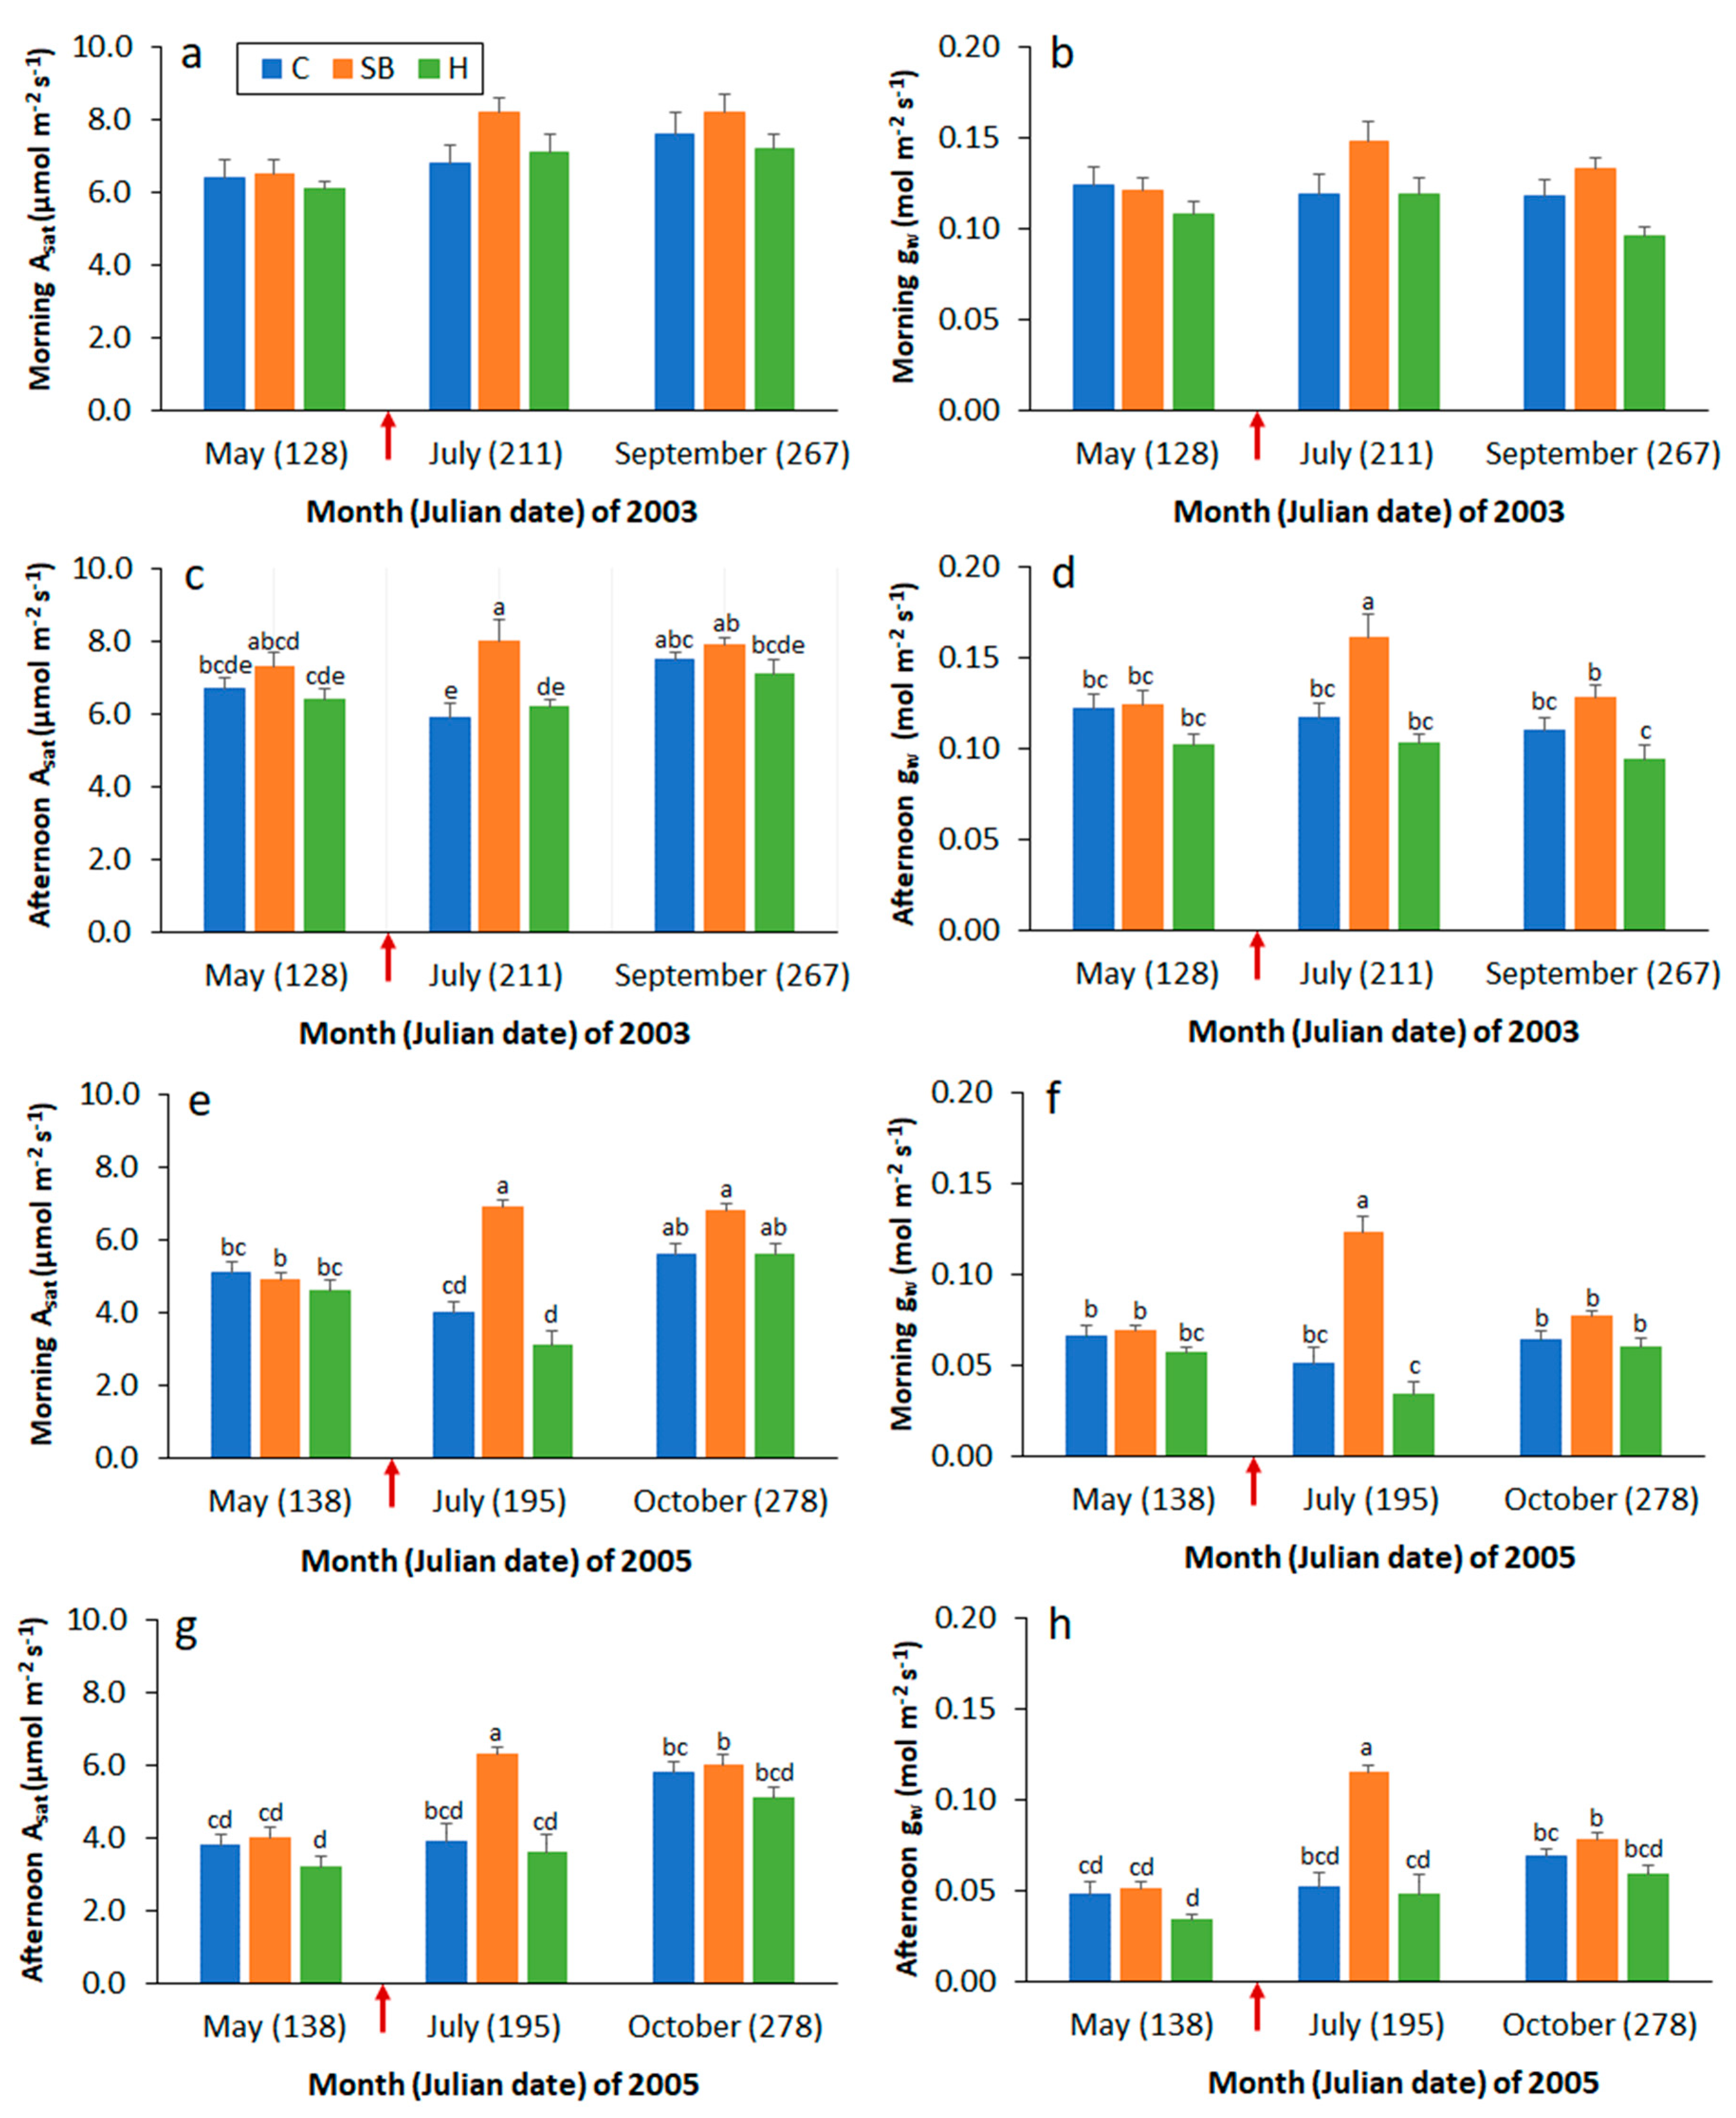
Figure 2.
Mean fascicle-level net photosynthesis (Asat) and stomatal conductance (gw) among longleaf pine saplings in the (a,b) morning and (c,d) afternoon of 2003, and in the (e,f) morning and (g,h) afternoon of 2005 at study 1 in response to three vegetation management treatments (VMT) (C: no vegetation management activity after planting, SB: prescribed fire in June 2000, and May 2003 and 2005, H: herbicide control of herbaceous and woody vegetative competition). Arrows indicate prescribed fire application. Error bars represent the standard error of the mean. By year and diurnal period, Asat and gw means associated with a different lower-case letter are significantly different at the 0.05 level.
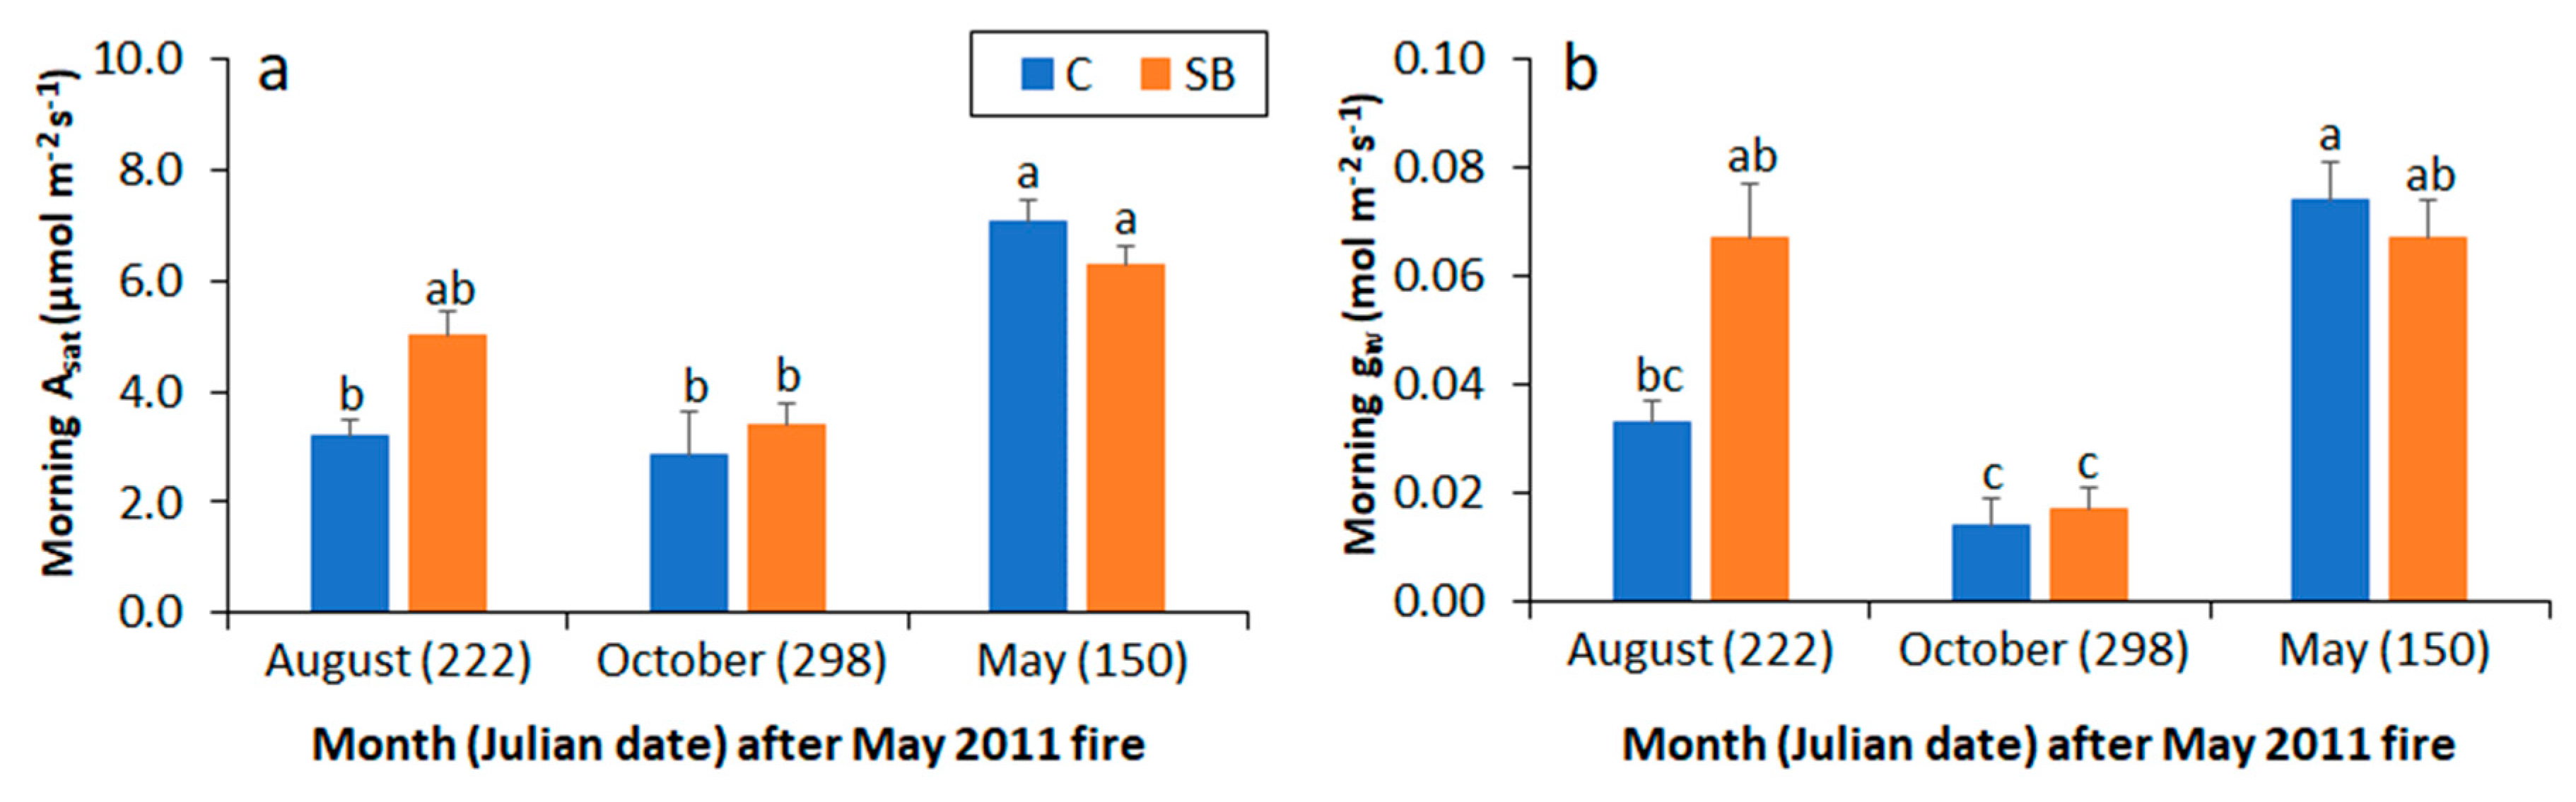
Figure 3.
Mean fascicle-level (a) net photosynthesis (Asat) and (b) stomatal conductance (gw) in the morning at study 2 among longleaf pine saplings in response to no prescribed fire (C) or prescribed fire in May 2011 (SB). Error bars represent the standard error of the mean. Means associated with a different lower-case letter are significantly different at the 0.05 level.
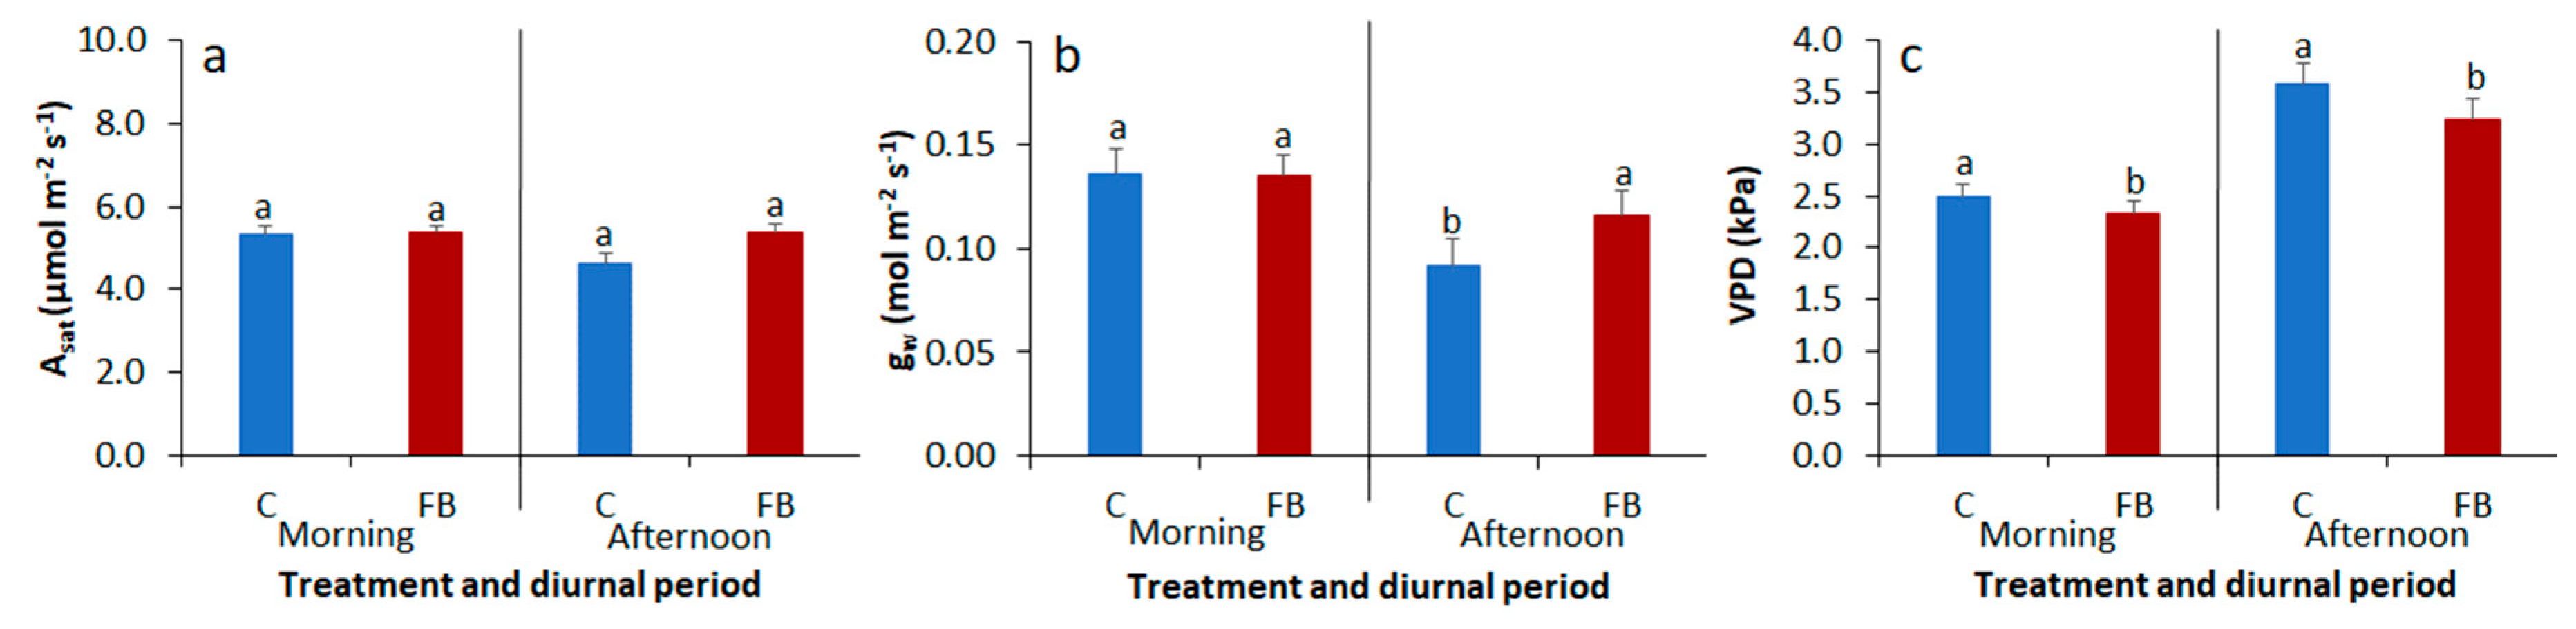
Figure 4.
Mean longleaf pine sapling fascicle-level (a) net photosynthesis (Asat), (b) stomatal conductance (gw), and (c) vapor pressure deficit (VPD) in the morning and afternoon at study 2 averaged among three measurement intervals in response to no prescribed fire (C) or prescribed fire in October 2012 (FB). Error bars represent the standard error of the mean. Means associated with a different lower-case letter are significantly different at the 0.05 level.
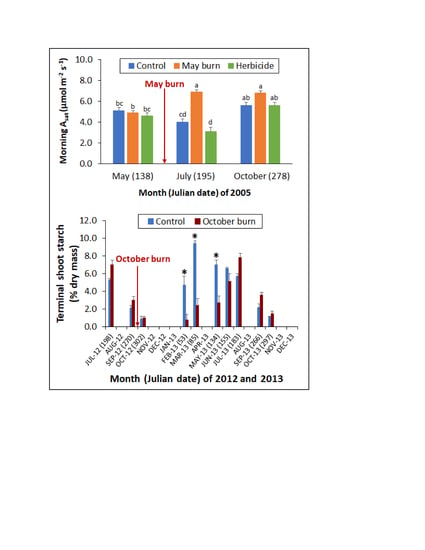
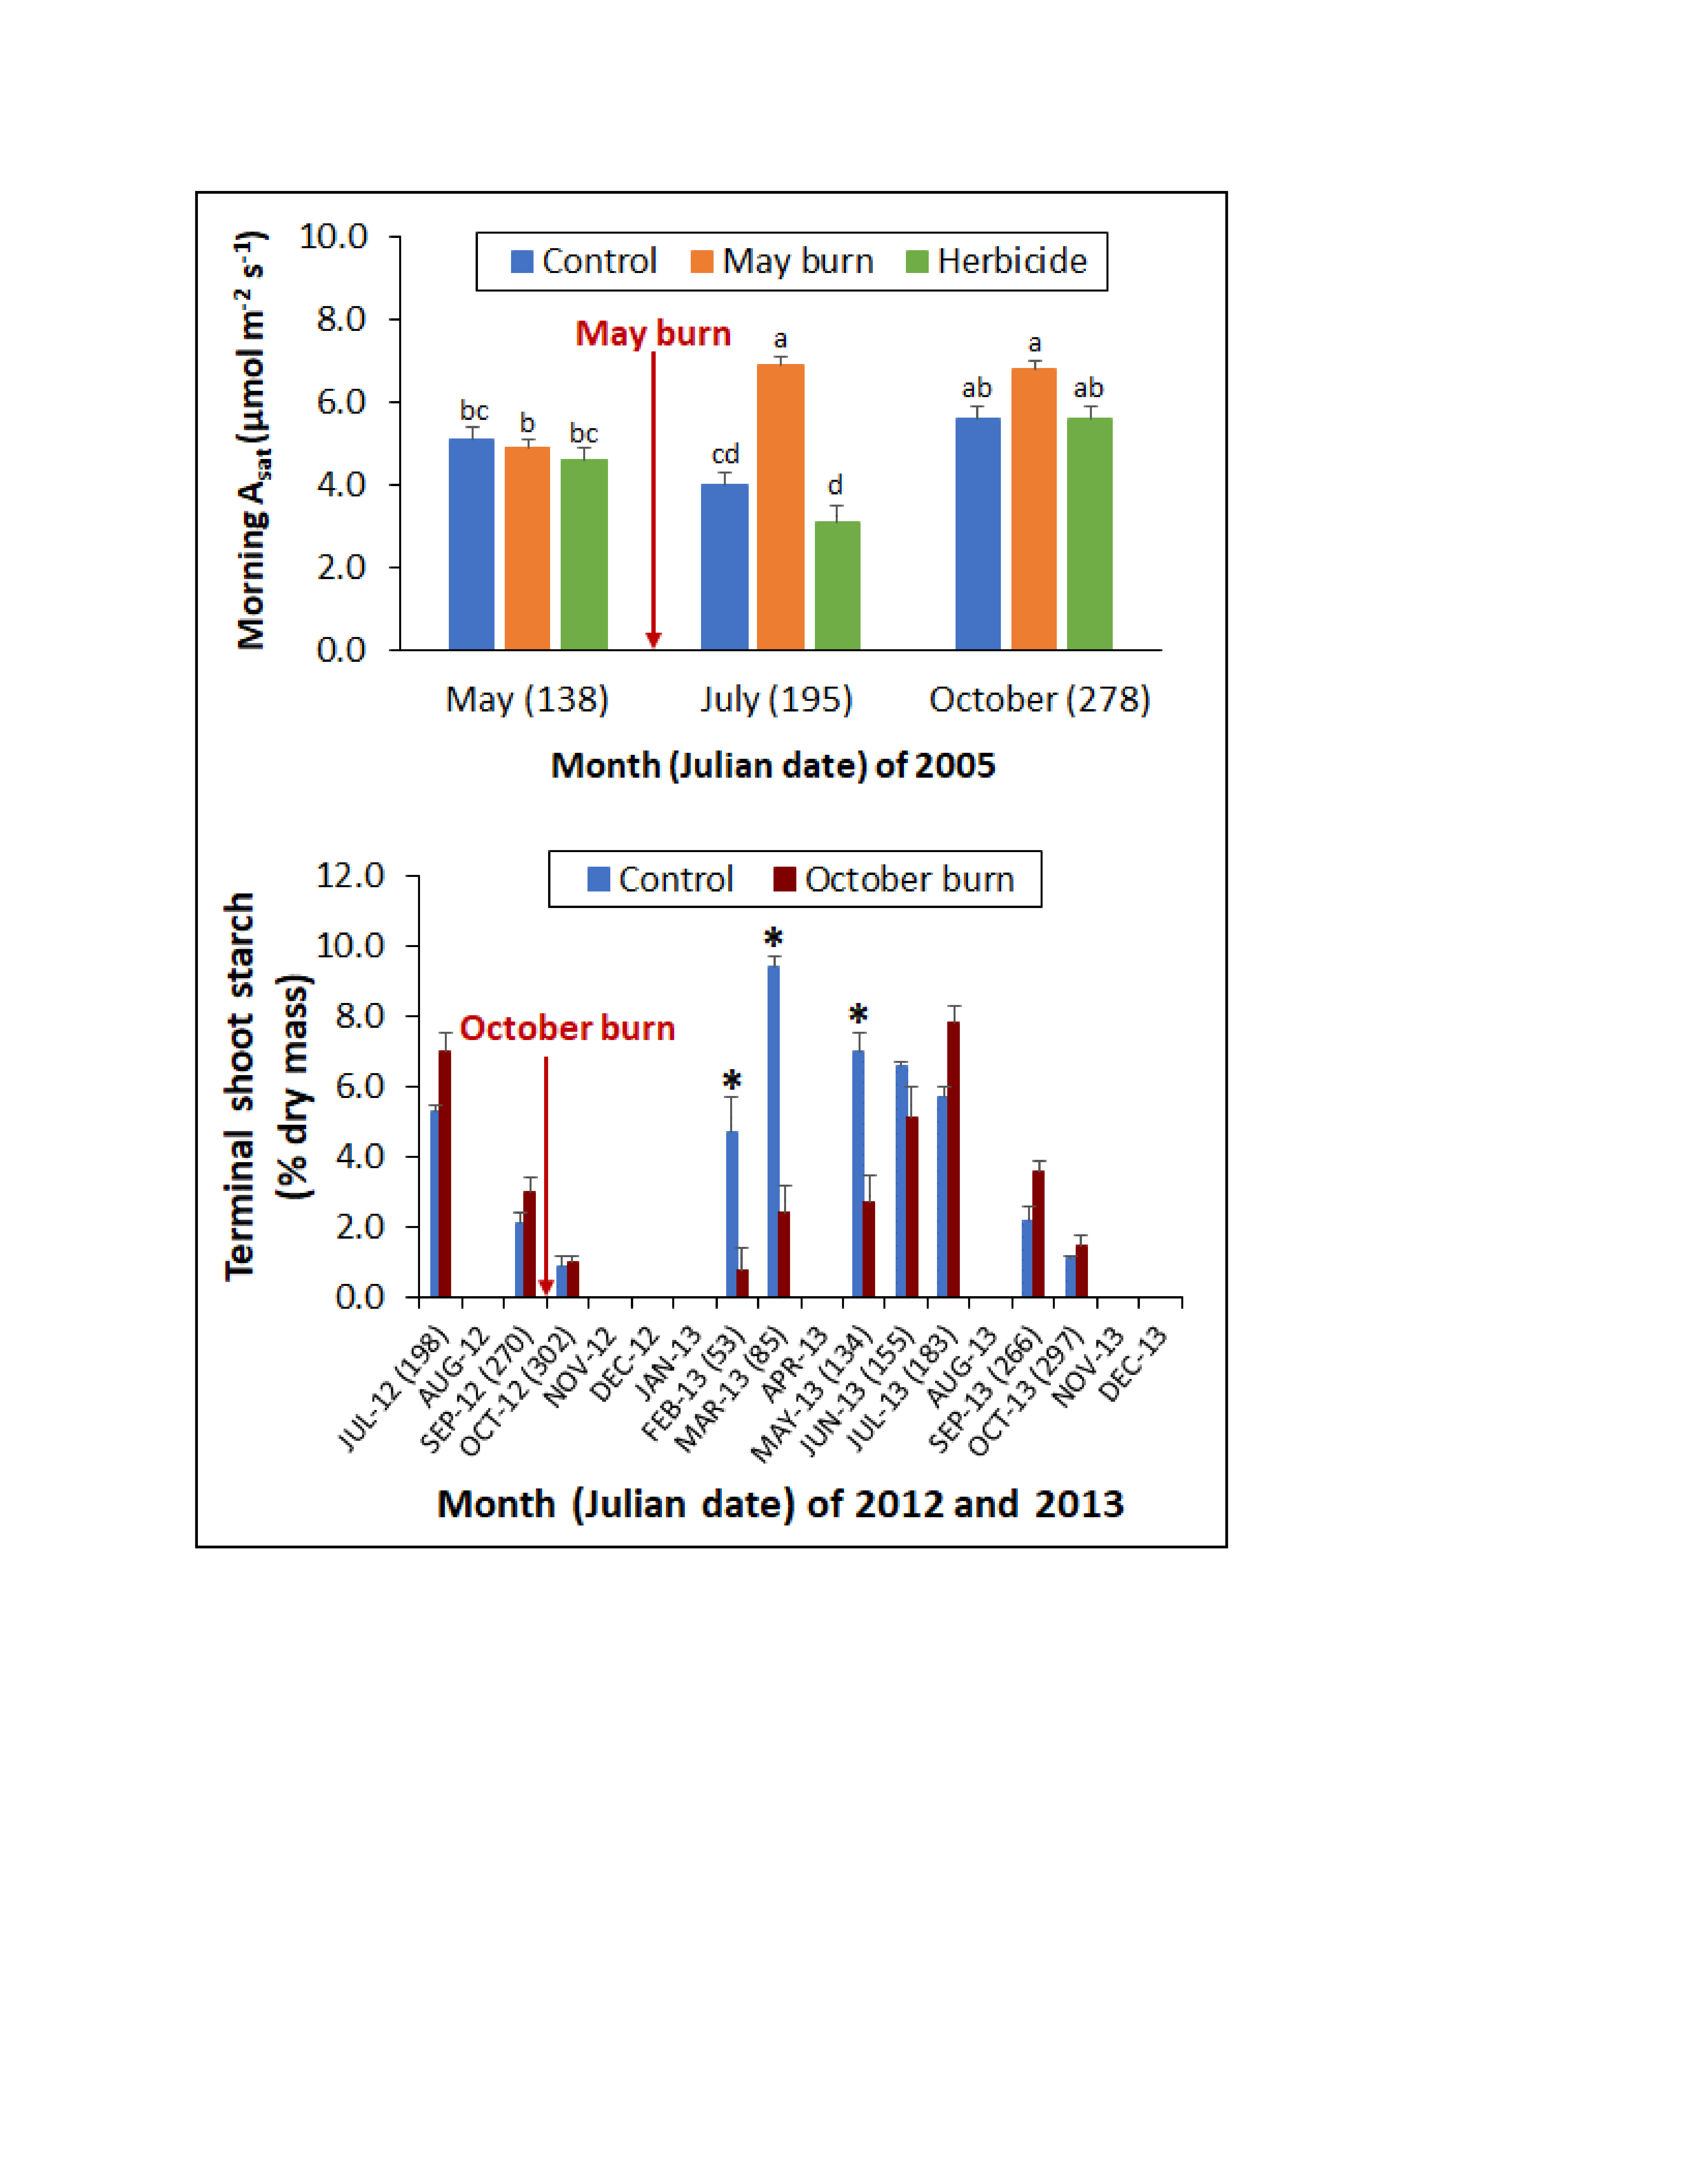
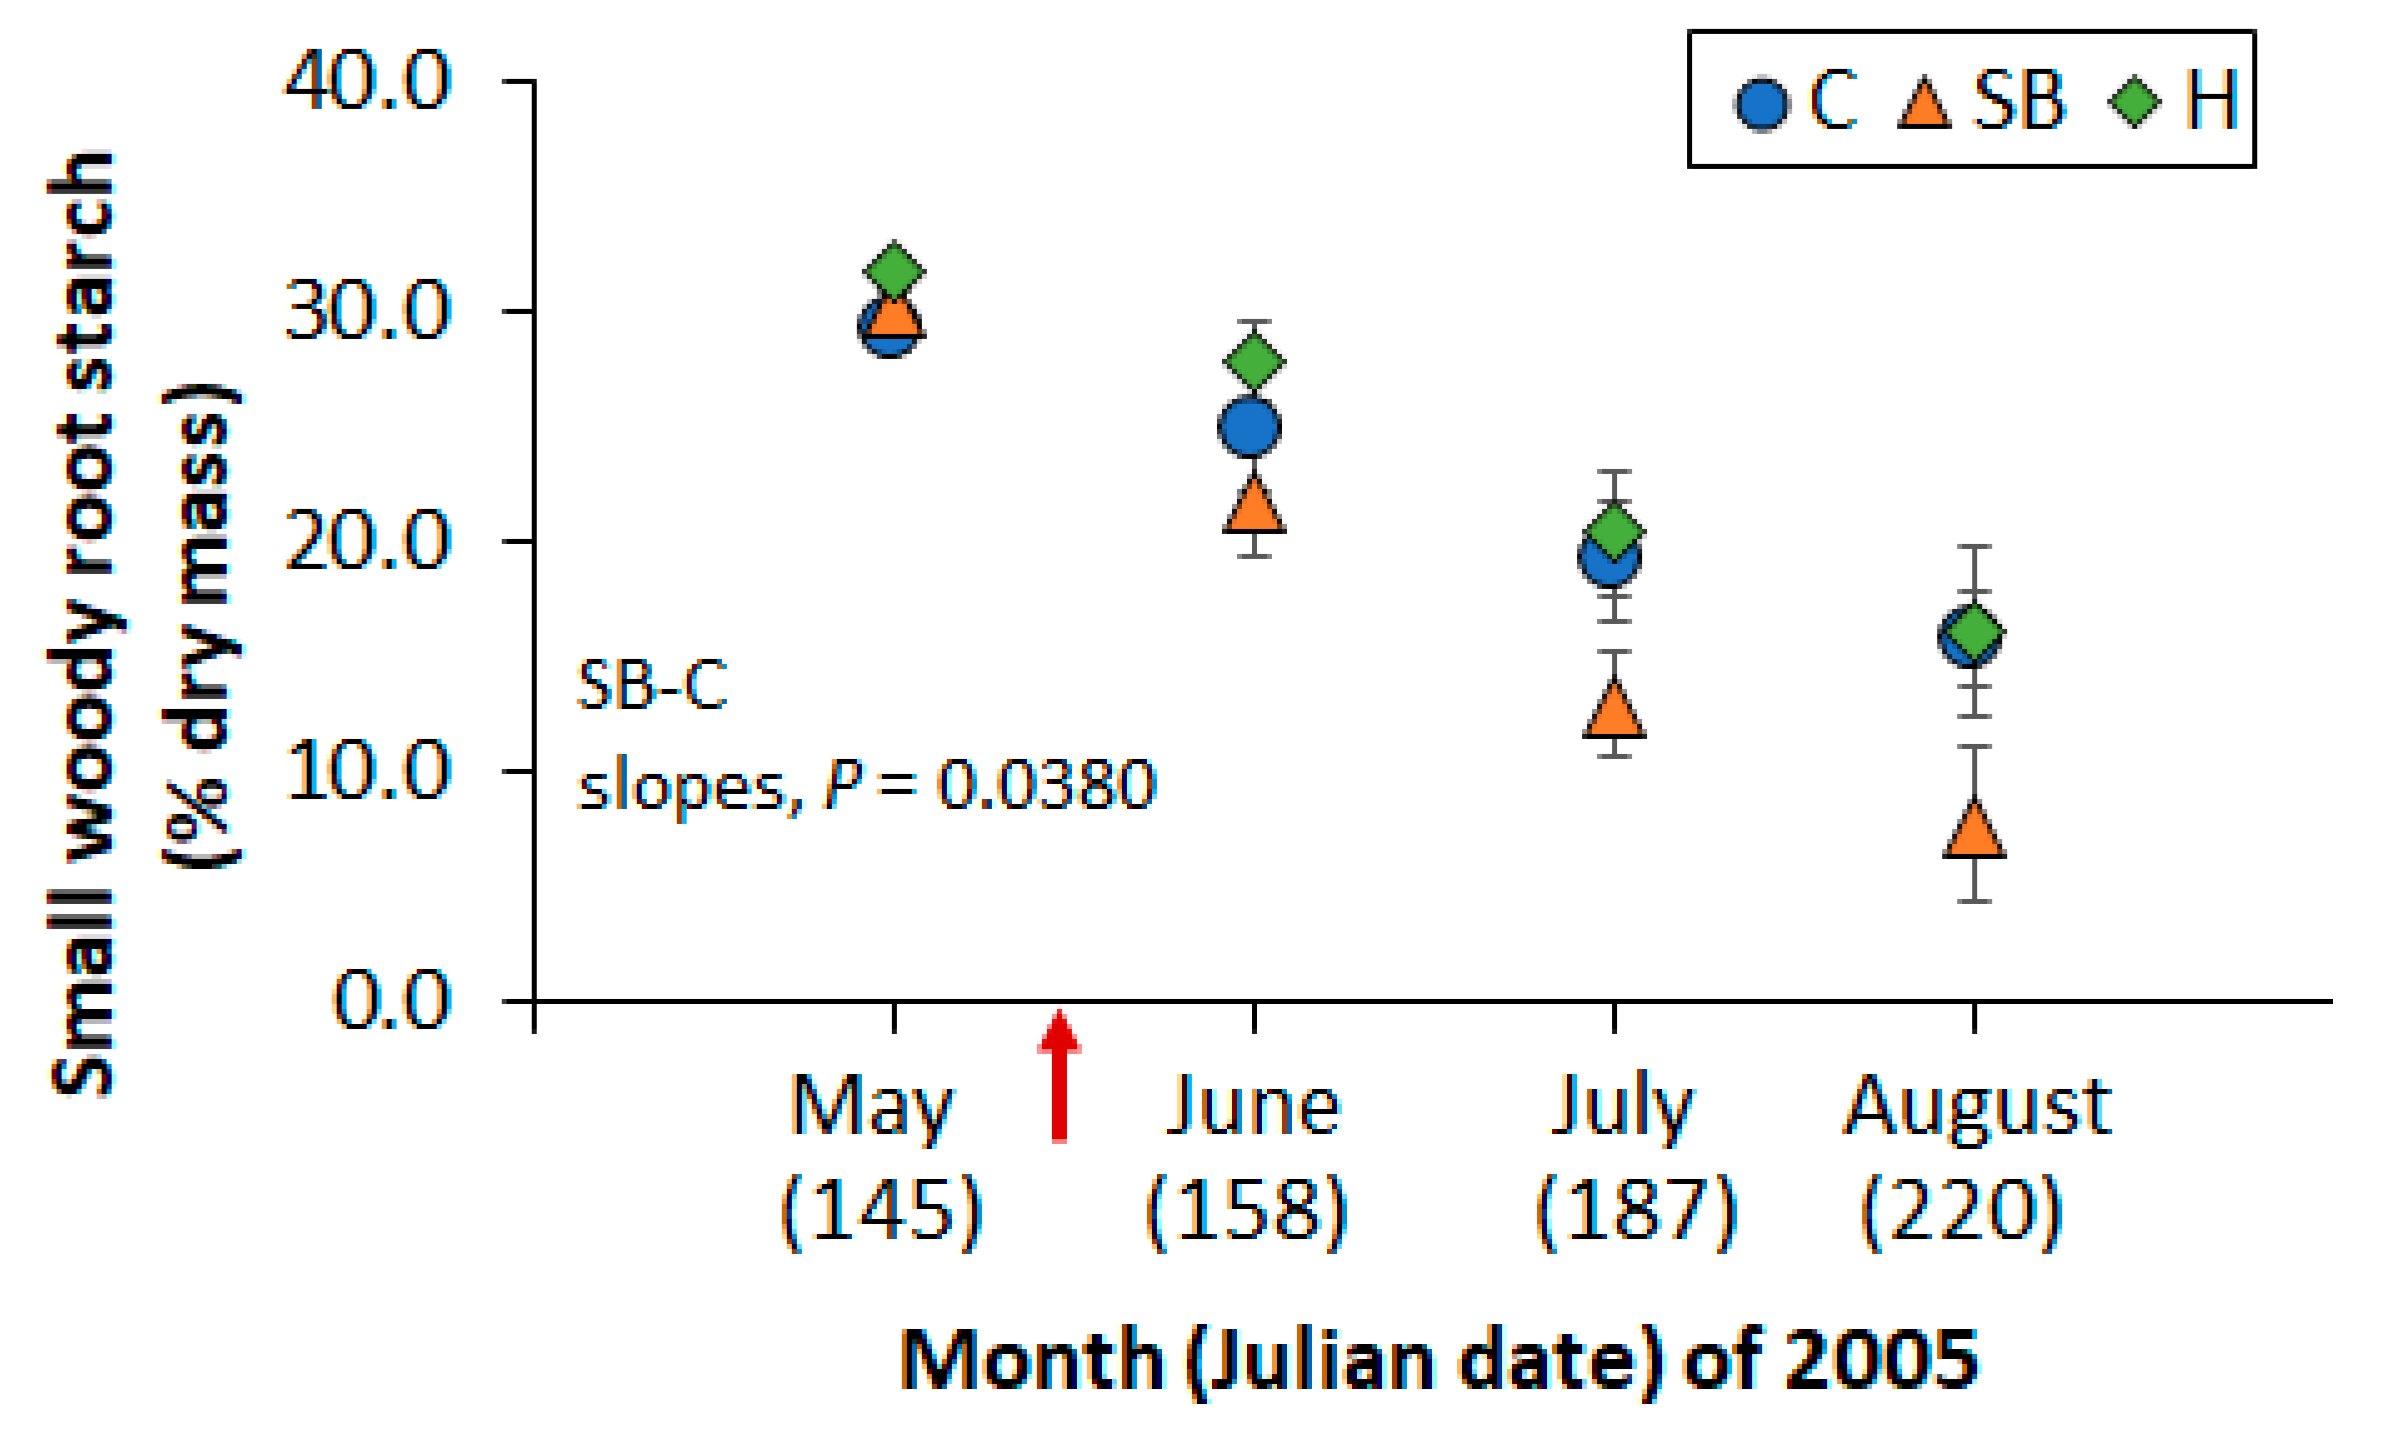
Figure 5.
Mean starch concentration in small woody roots of sapling longleaf pines at study 1 in response to three vegetation management treatments (C: no vegetation management activity after planting, SB: prescribed fire in June 2000 and May 2003 and 2005, H: herbicide control of herbaceous and woody vegetative competition). Samples were collected in May 2005 (day 145) before prescribed fire, and in June (day 158), July (day 187), and August (day 220) after prescribed fire. Symbols are the mean of five plot values and the arrow indicates prescribed fire application in May. Bars represent the standard error of the mean.
Figure 6.
Mean terminal shoot starch concentration among sapling longleaf pine at study 2 in response to no prescribed fire (C) or prescribed fire in October 2012 (FB). The arrow indicates prescribed fire application. Error bars represent the standard error of the mean. Asterisks indicate significant differences between C and FB, and † indicates a significant difference between FB terminal shoot starch concentrations in May and July 2013 at the 0.05 level.
Figure 7.
Relationships between longleaf pine (a,d,g) foliage, (b,e,h) branch, or (c,f,i) stem dry mass and sapling groundline diameter in 2003, 2004, and 2005 at study 1 in response to three vegetation management treatments (C: no vegetation management activity after planting, SB: prescribed fire in June 2000, and May 2003 and 2005, H: herbicide control of herbaceous and woody vegetative competition). Values are non-transformed means among three longleaf pine saplings per plot. Bars represent the standard error of the mean. Among all figures, the maximum y-axis range in 2003 and 2004 is 15.0 cm and that in 2005 is 20.0 cm. Among branch dry mass figures, the maximum x-axis range in 2003 is 2.0 kg and that in 2004 and 2005 is 6.0 kg.
Figure 8.
Linear regressions between non-transformed (a,b) foliage, (c,d) branch, or (e,f) stem dry mass and groundline diameter among saplings destructively harvested in October 2005. Foliage, branch, and stem linear regressions were significant by vegetation management treatment (C: no vegetation management activity after planting, SB: prescribed fire in June 2000, and May 2003 and 2005, H: herbicide control of herbaceous and woody vegetative competition). Significantly different slopes were observed between C and SB for foliage dry mass, and significantly difference slopes and y-intercepts were observed between H and SB for foliage, branch, and stem dry mass.
Figure 9.
Relationships between longleaf pine mean sapling outside-bark annual increment of stem growth and mean sapling groundline diameter among plots at study 1 in (a) 2003, (b) 2004, and (c) 2005 in response to three vegetation management treatments (C: no vegetation management activity after planting, SB: prescribed fire in June 2000, and May 2003 and 2005, H: herbicide control of herbaceous and woody vegetative competition). The x-axis is truncated. Values are means among all live longleaf pine saplings per measurement plot (2003, 2004, and 2005: 71–138, 66–134, and 62–130 saplings per plot). Bars represent the standard error of the mean.
Figure 10.
Relationships in (a) 2011 and (b) 2012 between longleaf pine mean sapling outside-bark annual increment of stem growth and mean groundline diameter among subplots in January at study 2 (16 subplots with 18–45 live saplings in 2011 and 26 subplots with 13–44 live saplings in 2012). Treatments were no prescribed fire (C) or prescribed fire in May 2011 (SB) or October 2012 (FB) with the C and FB subplots unburned in 2011. The x-axis is truncated. Bars represent the standard error of the mean. Significantly different slopes and y-intercepts were observed between SB and either C or H in 2012.
Table 1.
Probabilities of a greater F-value associated with diurnal values of upper and lower crown fascicle net photosynthesis (Asat), stomatal conductance (gw), vapor pressure deficit (VPD), and predawn fascicle water potential (PWP) in study 1 among longleaf pine saplings in 2003, 2004, and 2005 in response to three vegetation management treatments.
| Source of Variation | Year | df a | Morning | Afternoon | PWP |
|---|
| Asat | gw | VPD | Asat | gw | VPD |
|---|
| Block | 2003 | 4 | 0.2619 | 0.1046 | <0.0001 | 0.0224 | 0.3152 | 0.7769 | 0.7682 |
| Treatment (T) b | 2 | 0.0334 | 0.0144 | 0.0008 | <0.0001 | 0.0007 | 0.0543 | 0.0446 |
| Date (D) c | 2 | 0.0004 | 0.0764 | <0.0001 | 0.0022 | 0.0163 | <0.0001 | <0.0001 |
| Crown (C) d | 1 | <0.0001 | <0.0001 | 0.0034 | <0.0001 | <0.0001 | 0.0001 | — |
| D × T | 4 | 0.5824 | 0.1659 | 0.2461 | 0.0222 | 0.0295 | 0.5265 | 0.9349 |
| C × T | 2 | 0.3026 | 0.3574 | 0.5679 | 0.2142 | 0.3391 | 0.5570 | — |
| C × D | 2 | 0.4768 | 0.5555 | 0.4667 | 0.0505 | 0.7081 | 0.6964 | — |
| C × D × T | 4 | 0.8174 | 0.8462 | 0.9475 | 0.0933 | 0.3655 | 0.9640 | — |
| Block | 2004 | 4 | 0.0007 | 0.0008 | 0.2490 | 0.0888 | 0.0056 | <0.0001 | 0.4212 |
| T | 2 | 0.1412 | 0.0805 | 0.0739 | 0.0598 | 0.0139 | 0.4548 | 0.1725 |
| D | 1 | 0.0834 | 0.0005 | <0.0001 | 0.0007 | 0.0003 | <0.0001 | 0.4709 |
| C | 1 | <0.0001 | 0.0045 | 0.0468 | <0.0001 | <0.0001 | 0.0448 | — |
| D × T | 2 | 0.5608 | 0.4691 | 0.4337 | 0.1240 | 0.011 | 0.7164 | 0.4025 |
| C × T | 2 | 0.4300 | 0.9294 | 0.9058 | 0.3231 | 0.3598 | 0.8199 | — |
| C × D | 1 | 0.2035 | 0.1480 | 0.7478 | 0.0275 | 0.0053 | 0.5197 | — |
| C × D × T | 2 | 0.9017 | 0.7219 | 0.9323 | 0.6726 | 0.9435 | 0.9924 | — |
| Block | 2005 | 4 | 0.2028 | 0.4795 | 0.0001 | 0.0004 | 0.0029 | <0.0001 | 0.2760 |
| T | 2 | 0.0020 | 0.0026 | 0.0209 | <0.0001 | <0.0001 | <0.0001 | 0.0002 |
| D | 2 | <0.0001 | 0.4142 | <0.0001 | <0.0001 | <0.0001 | <0.0001 | <0.0001 |
| C | 1 | 0.0003 | 0.005 | 0.2275 | 0.0697 | 0.1400 | 0.4631 | — |
| D × T | 4 | <0.0001 | <0.0001 | 0.0494 | 0.0007 | <0.0001 | 0.0230 | 0.1091 |
| C × T | 2 | 0.3355 | 0.5853 | 0.6639 | 0.3167 | 0.2953 | 0.8039 | — |
| C × D | 2 | 0.0532 | 0.4613 | 0.7627 | 0.1478 | 0.5991 | 0.8438 | — |
| C × D × T | 4 | 0.4185 | 0.5085 | 0.9511 | 0.2122 | 0.2760 | 0.9456 | — |
Table 2.
Probabilities of a greater F-value associated with mean diurnal observations of sapling longleaf pine fascicle net photosynthesis (Asat), stomatal conductance (gw), and vapor pressure deficit (VPD) in study 2 at three measurement intervals after prescribed fire in May 2011 or October 2012.
Table 2.
Probabilities of a greater F-value associated with mean diurnal observations of sapling longleaf pine fascicle net photosynthesis (Asat), stomatal conductance (gw), and vapor pressure deficit (VPD) in study 2 at three measurement intervals after prescribed fire in May 2011 or October 2012.
| Source of Variation | df a | Morning | Afternoon |
|---|
| Asat | gw | VPD | Asat | gw | VPD |
|---|
| May 2011 prescribed fire |
| Block | 2 | 0.2299 | 0.8771 | 0.0254 | 0.6009 | 0.2386 | 0.3983 |
| Treatment (T) b | 1 | 0.2019 | 0.3036 | 0.1118 | 0.4243 | 0.8215 | 0.9159 |
| Date (D) c | 2 | <0.0001 | <0.0001 | 0.0018 | — | — | — |
| T × D | 2 | 0.0437 | 0.0232 | 0.2143 | — | — | — |
| October 2012 prescribed fire |
| Block | 2 | 0.7977 | 0.0014 | 0.0060 | 0.3610 | 0.0005 | 0.0422 |
| T | 1 | 0.9146 | 0.8036 | 0.0239 | 0.1455 | 0.0003 | <0.0001 |
| D | 2 | 0.1283 | 0.0002 | <0.0001 | 0.0684 | <0.0001 | 0.0010 |
| T × D | 2 | 0.9167 | 0.7629 | 0.7436 | 0.6473 | 0.1471 | 0.2369 |
Table 3.
Probabilities of a greater F-value associated with mean starch concentrations (% of dry mass) of small woody roots at study 1 and the square root of mean terminal shoot starch concentrations at study 2 among longleaf pine saplings in response to vegetation management treatments that included prescribed fire.
| Source of Variation | df a | Small Woody Roots | df | Terminal Shoot d | df | Terminal Shoot d |
|---|
| Study 1 (C, SB, H) | Study 2 (C, SB) | Study 2 (C, FB) |
|---|
| Block | 4 | 0.0217 | 2 | 0.4805 | 2 | 0.6016 |
| Treatment (T) b | 2 | 0.0726 | 1 | 0.1028 | 1 | 0.0864 |
| Sampling date (D) c | 9 | <0.0001 | 10 | <0.0001 | 9 | <0.0001 |
| T × D | 18 | 0.0763 | 10 | 0.0359 | 9 | <0.0001 |
Table 4.
Non-transformed mean (standard error) starch concentration of terminal shoots among sapling longleaf pine at study 2 in response to no prescribed fire (C) or May 2011 prescribed fire (SB), or in response to no prescribed fire or October 2012 prescribed fire (FB).
Table 4.
Non-transformed mean (standard error) starch concentration of terminal shoots among sapling longleaf pine at study 2 in response to no prescribed fire (C) or May 2011 prescribed fire (SB), or in response to no prescribed fire or October 2012 prescribed fire (FB).
| Sampling Interval | Prescribed Fire Treatment a |
|---|
| Month (Julian Date) and Year | C | SB | FB |
|---|
| May 2011 prescribed fire applied on Julian date 136 |
| February (49) 2011 | 3.6 (0.3) fgb | 3.1 (0.3) fgh | — |
| March (84) 2011 | 8.6 (0.3) abc | 9.9 (0.8) ab | — |
| May (146) 2011 | 5.5 (0.3) cdef | 2.6 (0.1) ghi | — |
| June (167) 2011 | 5.6 (0.6) bcdef | 3.9 (0.5) fg | — |
| July (194) 2011 | 5.3 (0.1) cdefg | 5.0 (0.4) defg | — |
| September (262) 2011 | 4.1 (0.7) efg | 2.8 (0.4) fghi | — |
| October (291) 2011 | 1.0 (0.4) i | 1.4 (0.2) hi | — |
| February (48) 2012 | 4.8 (1.0) defg | 3.3 (0.1) fgh | — |
| March (73) 2012 | 11.1 (1.0) a | 11.1 (1.4) a | — |
| May (137) 2012 | 8.1 (0.7) abcd | 6.8 (0.1) bcde | — |
| June (170) 2012 | 7.9 (1.1) abcd | 7.7 (0.7) abcd | — |
| October 2012 prescribed fire applied on Julian date 296 |
| July (198) 2012 | 5.3 (0.2) abcdfe | — | 7.0 (0.5) abc |
| September (270) 2012 | 2.1 (0.3) ghij | — | 3.0 (0.4) defghi |
| October (302) 2012 | 0.9 (0.3) ij | — | 1.0 (0.2) ij |
| February (53) 2013 | 4.7 (1.0) bcdefgh | — | 0.8 (0.6) j |
| March (85) 2013 | 9.4 (0.3) a | — | 2.4 (0.8) fghij |
| May (134) 2013 | 7.0 (0.5) abc | — | 2.7 (0.8) efghij |
| June (155) 2013 | 6.6 (0.1) abcd | — | 5.1 (0.9) abcdefg |
| July (183) 2013 | 5.7 (0.3) abcde | — | 7.8 (0.5) ab |
| September (266) 2013 | 2.2 (0.4) ghij | — | 3.6 (0.3) cdefgh |
| October (297) 2013 | 1.1 (0.1) ij | — | 1.5 (0.3) hij |
Table 5.
Probabilities of a greater F-value associated with analyses of covariance of aboveground biomass variables at study 1 in September 2003 and 2004, and October 2005 in response to three vegetation management treatments. Results are based on the destructive harvest of one sapling that was randomly chosen from among three one-third percentiles of total height per measurement plot.
| Source of Variation | df a | Biomass Variable | 2003 | 2004 | 2005 |
|---|
| Covariate b | 1 | Total foliage dry mass d | <0.0001 | <0.0001 | <0.0001 |
| Block | 4 | 0.1255 | 0.0449 | 0.4066 |
| Treatment (T) c | 2 | 0.1196 | 0.1601 | 0.0038 |
| Covariate | 1 | Upper crown foliage dry mass d | <0.0001 | <0.0001 | <0.0001 |
| Block | 4 | 0.0020 | 0.4509 | 0.4698 |
| T | 2 | 0.5598 | 0.7015 | 0.0504 |
| Covariate | 1 | Lower crown foliage dry mass d | <0.0001 | <0.0001 | <0.0001 |
| Block | 4 | 0.4785 | 0.2564 | 0.2110 |
| T | 2 | 0.1349 | 0.4101 | <0.0001 |
| Covariate | 1 | Total branch dry mass d | <0.0001 | <0.0001 | <0.0001 |
| Block | 4 | 0.1076 | 0.0015 | 0.3597 |
| T | 2 | 0.2022 | 0.0306 | 0.0493 |
| Covariate | 1 | Upper crown branch dry mass d | - | <0.0001 | <0.0001 |
| Block | 4 | - | 0.1625 | 0.8209 |
| T | 2 | - | 0.3001 | 0.2491 |
| Covariate | 1 | Lower crown branch dry mass d | - | <0.0001 | <0.0001 |
| Block | 4 | - | 0.0730 | 0.2688 |
| T | 2 | - | 0.0798 | 0.0117 |
| Covariate | 1 | Stem dry mass | <0.0001 | <0.0001 | <0.0001 |
| Block | 4 | 0.6413 | 0.2251 | 0.5976 |
| T | 2 | 0.0676 | 0.0504 | 0.0339 |
Table 6.
Probabilities of a greater F-value associated with crown architectural characteristics among longleaf pine saplings at study 1 in September 2004 and October 2005 in response to three vegetation management treatments. Results are based on the destructive harvest of one sapling that was randomly chosen from among three one-third percentiles of total height per measurement plot.
| Source of Variation | df a | Year | HBLC d | LCR d | FOBN d | BNR d | BMR d |
|---|
| Covariate b | 1 | 2004 | 0.0001 | 0.0885 | <0.0001 | 0.0035 | 0.6762 |
| Block | 4 | 0.2019 | 0.2319 | 0.1814 | 0.5464 | 0.8851 |
| Treatment c | 2 | 0.7210 | 0.8194 | 0.1233 | 0.4646 | 0.8285 |
| Covariate | 1 | 2005 | 0.2056 | 0.0103 | <0.0001 | 0.5294 | 0.4535 |
| Block | 4 | 0.6796 | 0.1622 | 0.4984 | 0.3100 | 0.9064 |
| Treatment | 2 | 0.0829 | 0.0081 | 0.5528 | 0.0031 | 0.0802 |

 ,
, 


