Article

Long-Term Wood Micro-Density Variation in Alpine Forests at Central México and Their Spatial Links with Remotely Sensed Information

1
Posgrado en Ciencias Forestales, Colegio de Postgraduados, Km 36.5 Carr. México-Texcoco, Montecillo, Estado de Mexico CP 56230, Mexico
2
Centro Nacional de Investigación Disciplinaria en Conservación y Mejoramiento de Ecosistemas Forestales CENID-COMEF, INIFAP. Av. Progreso No. 5, Barrio de Santa Catarina, Coyoacán, Ciudad de Mexico CP 04010, Mexico
3
INRAE, UMR 0588 BIOFORA, 2163 Avenue de la Pomme de Pin, CS 40001 ARDON, CEDEX 2, 45075 Orléans, France
4
Biogeochemistry and Nutrient Cycling Lab., Department of Land Air and Water Resources, University of California, Davis, One Shields Avenue, Davis, CA 95616, USA
*
Author to whom correspondence should be addressed.
Forests 2020, 11(4), 452; https://doi.org/10.3390/f11040452
Submission received: 3 March 2020 / Revised: 4 April 2020 / Accepted: 11 April 2020 / Published: 16 April 2020
(This article belongs to the Special Issue Radial Tree-Ring Traits Variation in Relation to Climate Factors)

Abstract

:
Ongoing climate variability strongly affects high-elevation forests, influencing the wood formation process (e.g., xylogenesis). Furthermore, spatio-temporal studies to establish links of wood properties and tree performance are needed. Using linear mixed-effects models, empirical cumulative distribution functions, and spatial analysis, we explore time trends and space connections of wood density of Pinus hartwegii Lindl. to remotely sensed variables (Moderate Resolution Imaging Spectro-radiometer MODIS-derived) in two high-elevation forests in México, Tláloc (TLA) and Jocotitlán (JOC) Mountains. Results indicated that elevation and cambial age effects are important factors explaining wood density variation. Minimum earlywood—MID, average—AVE, and maximum latewood density—MXD were statistically similar between mountains (p > 0.05), but TLA showed a significant increase in MID over time with higher values after 1950. Wood density values and spatial correlations were site-dependent with TLA exhibiting the highest correlations between MXD and the Normalized Difference Vegetation Index (NDVI) of the spring season (r = 0.59, p < 0.05). Overall, correlations to remotely sensed information were positive with MXD, negative for MID and divergent for AVE. Historical temperature defines MID along the elevation gradient, while MXD was related to soil moisture only at low-elevation sites where soils are deeper. We found that two high-elevation forests, 115 km away from each other, with similar climate, soil, and vegetation, behaved differently regarding their xylogenesis, indicating the potential of using the link between wood micro-density and remotely sensed information to understand forest response to climate change effects.

1. Introduction

Wood micro-density (hereinafter named wood density) is linked to the water and nutrient transport processes, plant mechanical support and in the long-term is related to the carbon-storing capacity of trees [1,2]. Furthermore, the retrospective analysis of tree-ring density is useful to capture the historical plant responses to climate variation [3] since the memory of carbon gain is imprinted in the tree-ring series [4]. Wood density is the reflection of the arrangement of components like cell wall thickness and lumen area and volume, providing indirect information of wood hydraulic properties [5], carbon fixation [2], water economy [3,6], and paleoclimate records (e.g., temperature) [7,8,9]. For example, maximum latewood density (MXD) is a useful proxy of past growing season temperatures while minimum earlywood density (MID) helps to understand water transport efficiency [10,11,12,13].
Climate change is a complex process that results from the alteration of the chemistry of the atmosphere and the global balance of energy, resulting in elevated temperatures, altered precipitation patterns, and extreme weather events [14,15]. In this context, given that high-elevation forests are climate-sensitive ecosystems [16,17], they are suitable to monitor climate change effects since they experience more rapid changes in temperature than low-elevation sites [18,19]. Thus, it is expected trees growing in the tree-line zone modulate wood formation process accordingly to climate constraints, securing water transport and physical support while balancing the trade-offs for transpiration and photosynthesis [20].
While many studies have addressed long-term trends in wood density in forests of the Northern Hemisphere [21,22,23], there are few studies in southern latitudes where temperate forests grow [24,25,26]. Retrospective wood density profiles are essential to understand past climate effects on forest ecosystems over temporal and spatial scales. In México, the Mexican Mountain Pine (Pinus hartwegii Lindl.), a tree species sensitive to climate [27,28,29,30], dominates the high-elevation forests but recent studies have found that the natural habitat of this species is at risk due to climate change [31,32,33]. Recently, Correa-Díaz, et al. [34] found a declining radial growth trend in mature P. hartwegii trees at Tláloc Mountain (TLA), starting around the middle twentieth century. Therefore, it is worthy to investigate if forests of central Mexico show an unexpected variation in tree-ring density as an early warning signal of climate change effects.
Nowadays, new research is focused on linking dendrochronology (e.g., tree-ring widths, wood isotopic compositions) to remotely sensed information, to better understand ecological processes spatially [34,35,36,37,38,39]. However, with few exceptions, tree-ring density and remote sensed properties have been studied parallel [21,40,41]. Addressing this knowledge gap, we studied trends of minimum earlywood density (MID), average wood density (AVE), and maximum latewood density (MXD) as related to photosynthetic activity at the canopy level using remotely sensed information (e.g., Normalized Difference Vegetation Index (NDVI)), evaluating how consistent the relationships are across different forests. The NDVI, derived from spectral signatures of the plant canopy, is an indirect measurement of photosynthesis and forest productivity [42]. Moreover, other remotely sensed variables like Enhanced Vegetation Index (EVI) and Leaf Area Index (LAI), could provide complementary insights on wood formation process in forests.
Here, we present the temporal variation in tree-ring wood density and the spatio-temporal links with remotely sensed variables at two high-elevation forests in central México. To assess the climate change effects in alpine forests in the region, we selected two mountains with similar climate and soils that differed in geomorphology, while TLA is part of a Sierra, JOC is an isolated volcano area. We included two levels of elevation and aspect at each mountain, defined by the natural distribution of P. hartwegii at both sites. Because physiological performance and tree growth are influenced by topographic site conditions [34,39], we expected to encompass most of the variance in wood density across the study sites. The objectives were: (i) evaluate the variability of wood density due to elevation and aspect, (ii) evaluate temporal trends for wood density variables, (iii) correlate climatic variables with annual wood density, and (iv) analyze the links between wood density and remotely sensed variables tracking photosynthetic activity and leaf area. Since a declining radial growth trend has been observed in P. hartwegii over the last decades, we expect a concomitant change in tree-ring wood density as trees prioritize water transport and structural stability [34]. Thus, we hypothesize that wood density varies according to climatic and topographic constraints, with similar responses across study sites. Furthermore, we postulate that seasonal indices of canopy activity explain the variation of wood density in tree rings.

2. Materials and Methods
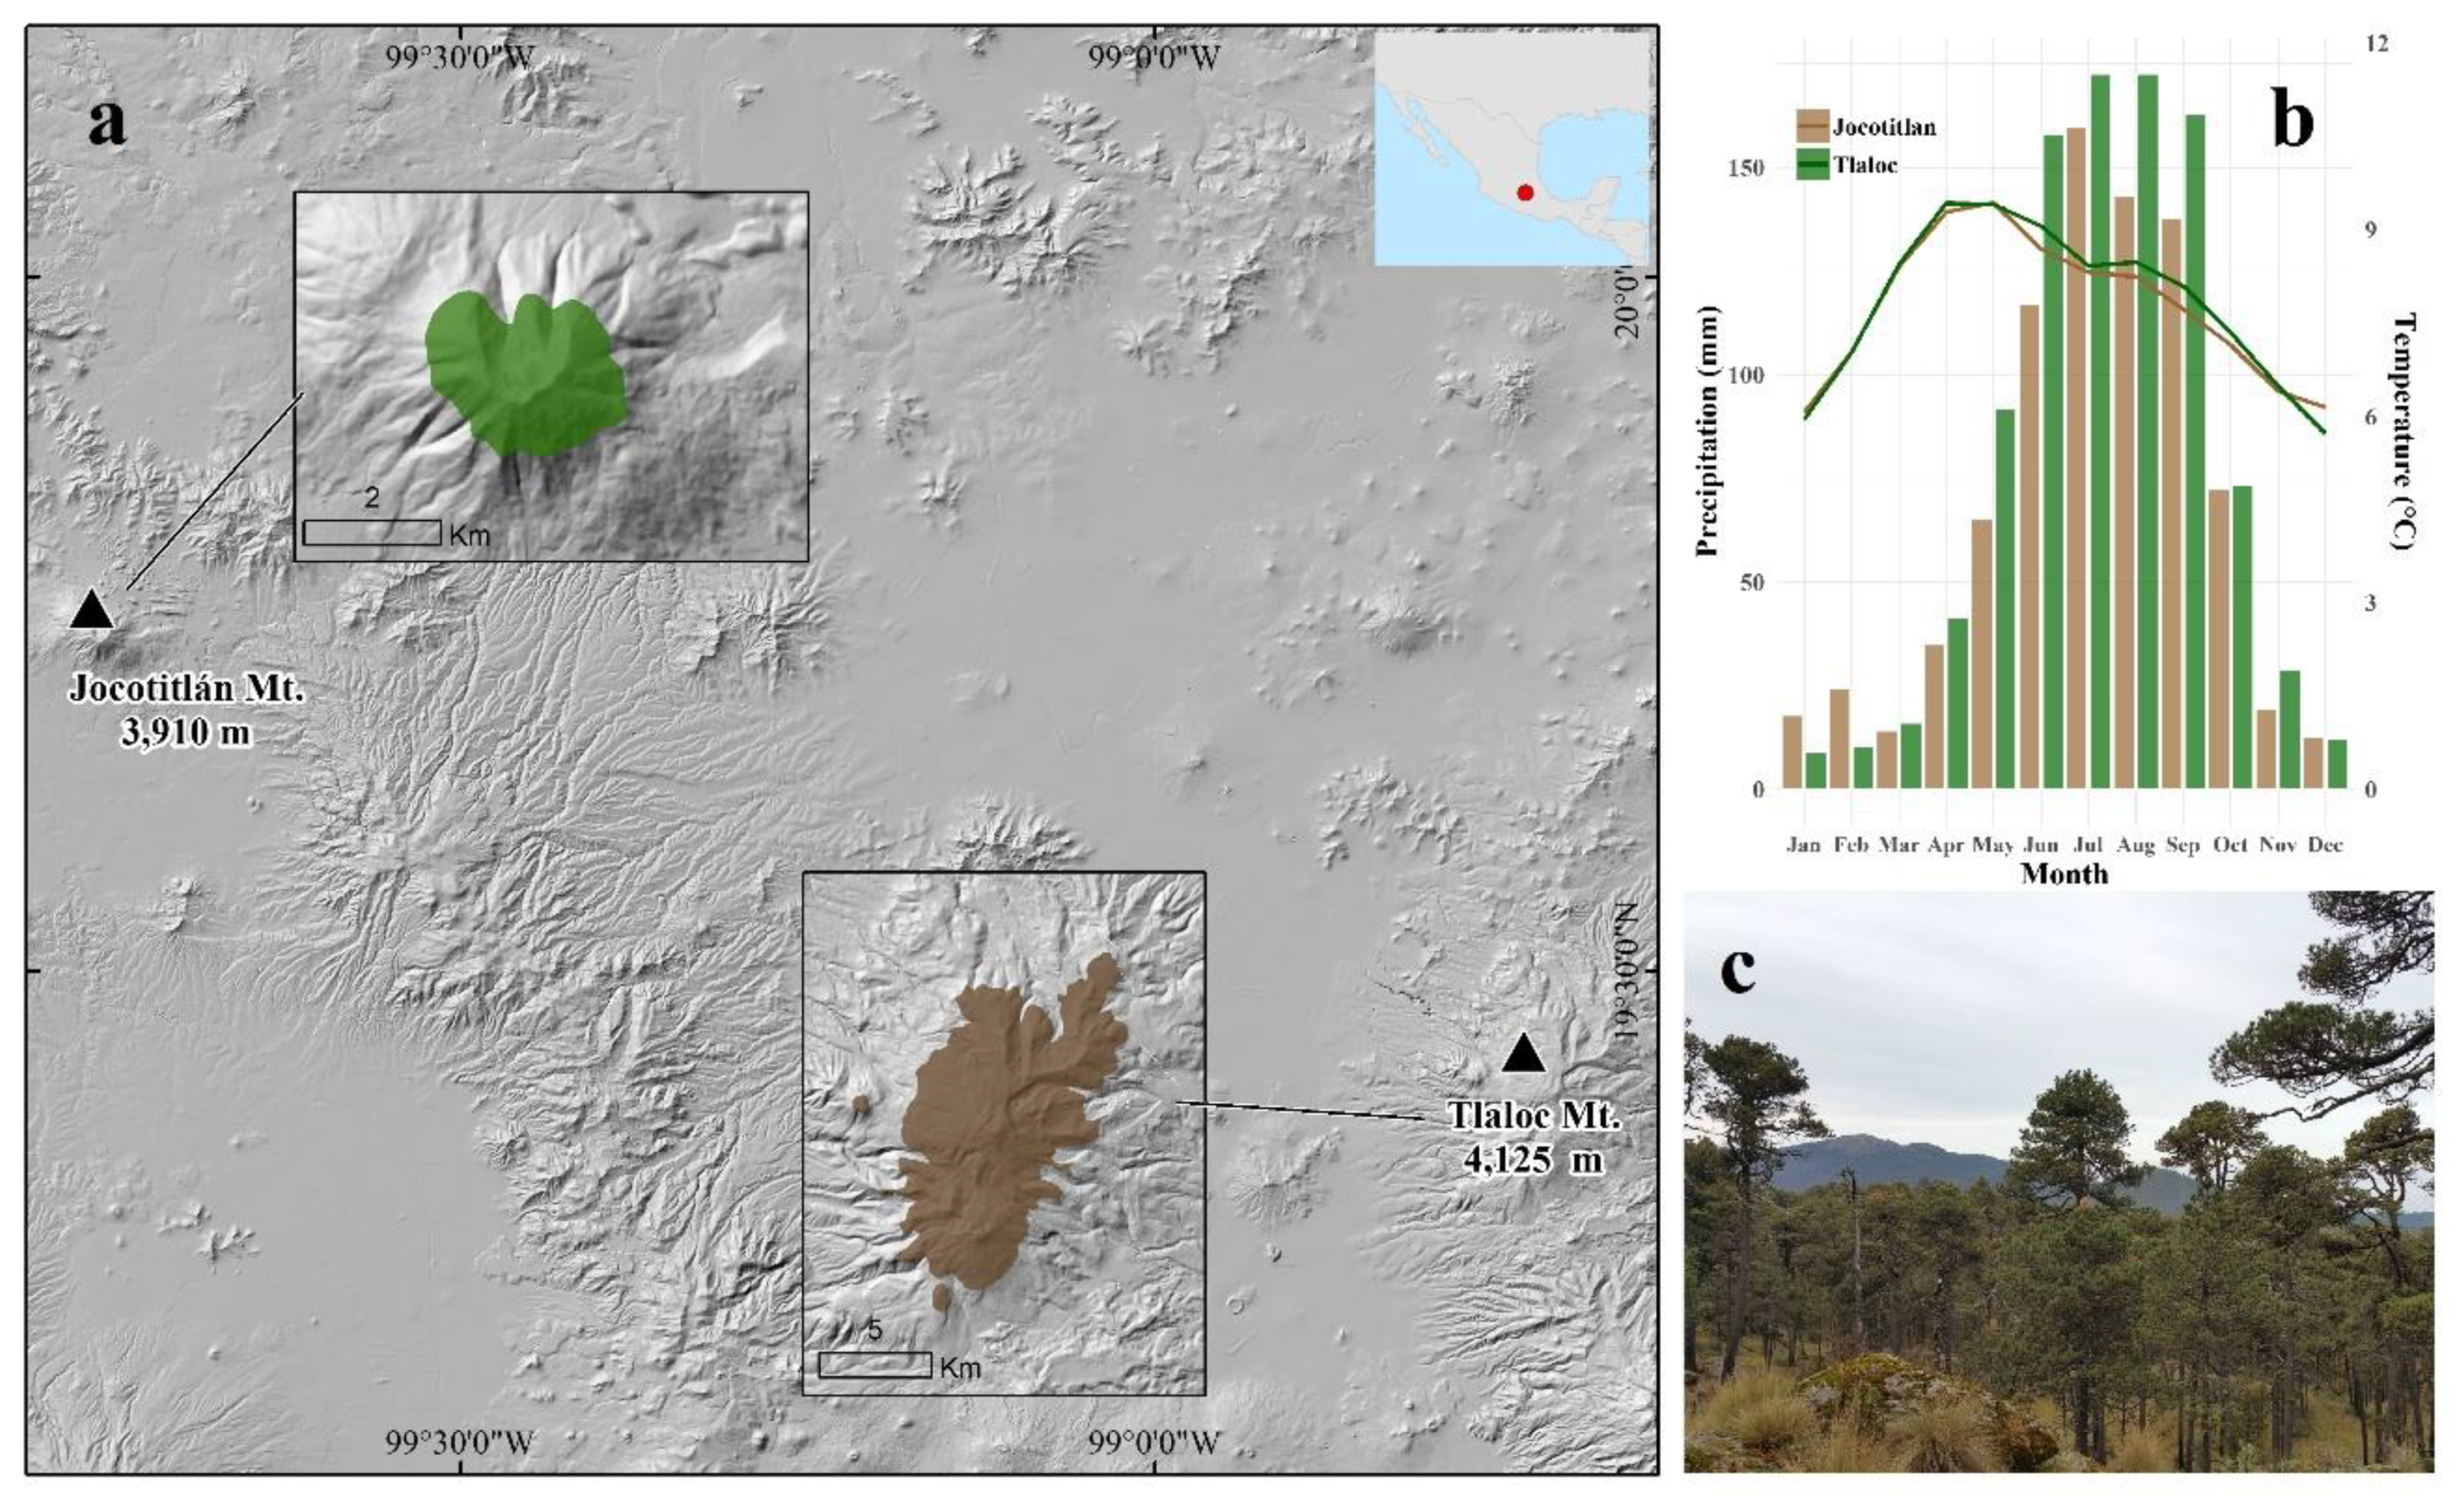
2.1. Study Sites

Two high-elevation mountain areas across the Trans-Mexican volcanic belt were studied, namely Tláloc Mountain (TLA) (19.39° N, −98.74° O and 4125 m asl) and Jocotitlán (JOC) (19.72° N, −99.76° O and 3910 m asl) located in Central Mexico (Figure 1a). The dominant tree species is Pinus hartwegii Lindl, forming pure, uneven-aged open stands [43]. Given that the summit of each mountain is different (Table 1), we focused on selecting sites formed from pure stands of P. hartwegii concentrating on those with the most contrasting elevations. We sampled P. hartwegii trees at two elevation positions (3500–3900 m asl for TLA and 3700–3800 m asl for JOC) with two contrasting aspects (Northwest and Southwest). Mean annual temperature is similar at both sites (14.8 ± 0.6 and 14.2 ± 0.4 for TLA and JOC, respectively). Precipitation is slightly higher at TLA, mainly in the period July-August (Figure 1b,c) [44]. The climate at both sites is classified as temperate subhumid (C(w2)) according to Köppen climate classification as modified by García [45] for México conditions. Soils at both sites are Andisols, developed from volcanic material resulting in high organic matter content epipedons with a high water-holding capacity [46].

2.2. Sample Collection and Density Measurements

At both mountain sites (TLA and JOC), we collected 80 increment core samples at breast-height, using a 5-mm diameter Pressler borer. The average number of trees sampled per site condition (a combination of elevation × aspect) was 10 trees, sampling only dominant and healthy mature trees. Once the increment cores were oven-dried, they were sawn using a twin-blade (1.5 mm thick cross-sections) and then, resin-extracted with in a pentane bath. To obtain X-ray data, each core was exposed about 25 min to X-ray densitometry [47,48]. Then, the X-ray microfilms were scanned (4000 dpi) and analyzed using WinDendro (Regent Instruments Inc., Quebec, Canada). WinDendro software converts the gray levels of the X-ray microfilms to density values by comparing them to a standard of known physical and optical density through a calibration curve [49]. We discarded some trees in the process because of blurred information in some micro rings (≈20% of total) but not less than six trees represented a site and condition, thus, a total of 63 trees were used for the analysis. Finally, we calculated MID, AVE, and MXD annually for each tree. All samples were prepared and processed at INRA Val de Loire Centre, Orléans France.

2.3. Mountain and Topographic Gradient Effect on Density Profiles

The topographic effect in tree-ring density variables (MID, AVE, and MXD) was tested by linear mixed-effects models for repeated measured data using R (‘nlme’ package) [23,50]. An autoregressive process of order 1 was included for the correlational structure of repeated measurements (AR1). First, we tested significant differences for the mean wood density profiles between mountains, using trees and cambial age as random factors. Since we found no significant differences between mountain profiles, we decided to combine them into a single database to test the elevation, aspect, and cambial age effects at a regional level. Here, we used a nested effect of trees within mountains as random factors, blocking any effect by the mountain source. Random intercepts and slopes were set to measure the changes of every tree. Finally, statistical differences among topographic conditions were tested by pairwise comparison using the post hoc Bonferroni’s adjustment using emmeans library in R [51].

2.4. Unbiased Trends of Density Profiles and Temporal Stability

To obtain unbiased MID, AVE, and MXD profiles by the cambial age effect, we adjusted the density measurements by site (elevation × aspect) with a linearly non-parametric method similar to the residuals RCS method [52]. The use of the subtraction operator instead of the ratio allows producing time series in the original density scale (g cm−3) and a straightforward interpretation. Afterward, temporal trends were tested by linear mixed-effects models as described above, using the slope and significance as indicators of change over time.
Empirical cumulative distribution functions (CDF) were calculated for adjusted MID, AVE, and MXD time series to probe the stability over time using a breaking point in 1950. We chose this year since it matched with a notable forest growth reduction (basal area increment) observable at TLA mountain [34]. Then, we used the nonparametric Kolmogorov–Smirnov (KS) test to prove that the distribution function of the period <1950 was equal to the more recent period (>1950); this method is particularly useful when data does not come from a normal distribution as in this case [21].

2.5. Climatic Influence on Tree-Ring Wood Density Variables

We correlated monthly temperature (maximum and minimum), precipitation and soil moisture with the adjusted density profiles by elevation level (e.g., 3500, 3700, 3800, 3900 m asl) using the bootstrapped Pearson’s correlation from “treeclim” in R [53]. All climatic variables, excluding soil moisture, were obtained using a downscaled time series (according to 250-m digital elevation model) generated by software package ClimateNA v550 from 1902 to 2016 [44,54], based on the Climate Research Unit database (CRU ts 4.01) (Table 1). Soil moisture was retrieved using the data from the project Climate Change Initiative (CCI) from the European Space Agency (ESA). We used the combined product (volumetric units m3 m−3) with a spatial resolution of 0.25° with daily resolution from 1978 to 2016.

2.6. Linking Remotely Sensed Variables from MODIS to Wood Density

We compared the Normalized Difference Vegetation Index (NDVI) and Enhanced Vegetation Index (EVI) 16-day composite time series (250-m spatial resolution) [55], and Leaf Area Index (LAI) 8-day composite time series (500-m spatial resolution) [56,57] with the adjusted tree-ring density values from 2000 to 2016. Preprocessing analysis included pixel quality analysis (avoiding snow- and cloud-contaminated pixels), harmonic interpolation (when pixel gaps were presented) and maximum value composite for LAI data (16-day composite) [58,59].
A Pearson product-moment correlation coefficient was used to explore the link between temporal and spatial variables as described by Correa-Díaz, et al. [39] where the yearly tree-ring derived measurements (e.g., MXD) are spatially correlated to remotely sensed maps from November of the previous year until September of the current year. Once the correlation maps were calculated, not statistically significant pixels were masked out according to their p-values (p < 0.05). This procedure allows for detecting the highest spatio-temporal association between yearly and bi-weekly data.

3. Results

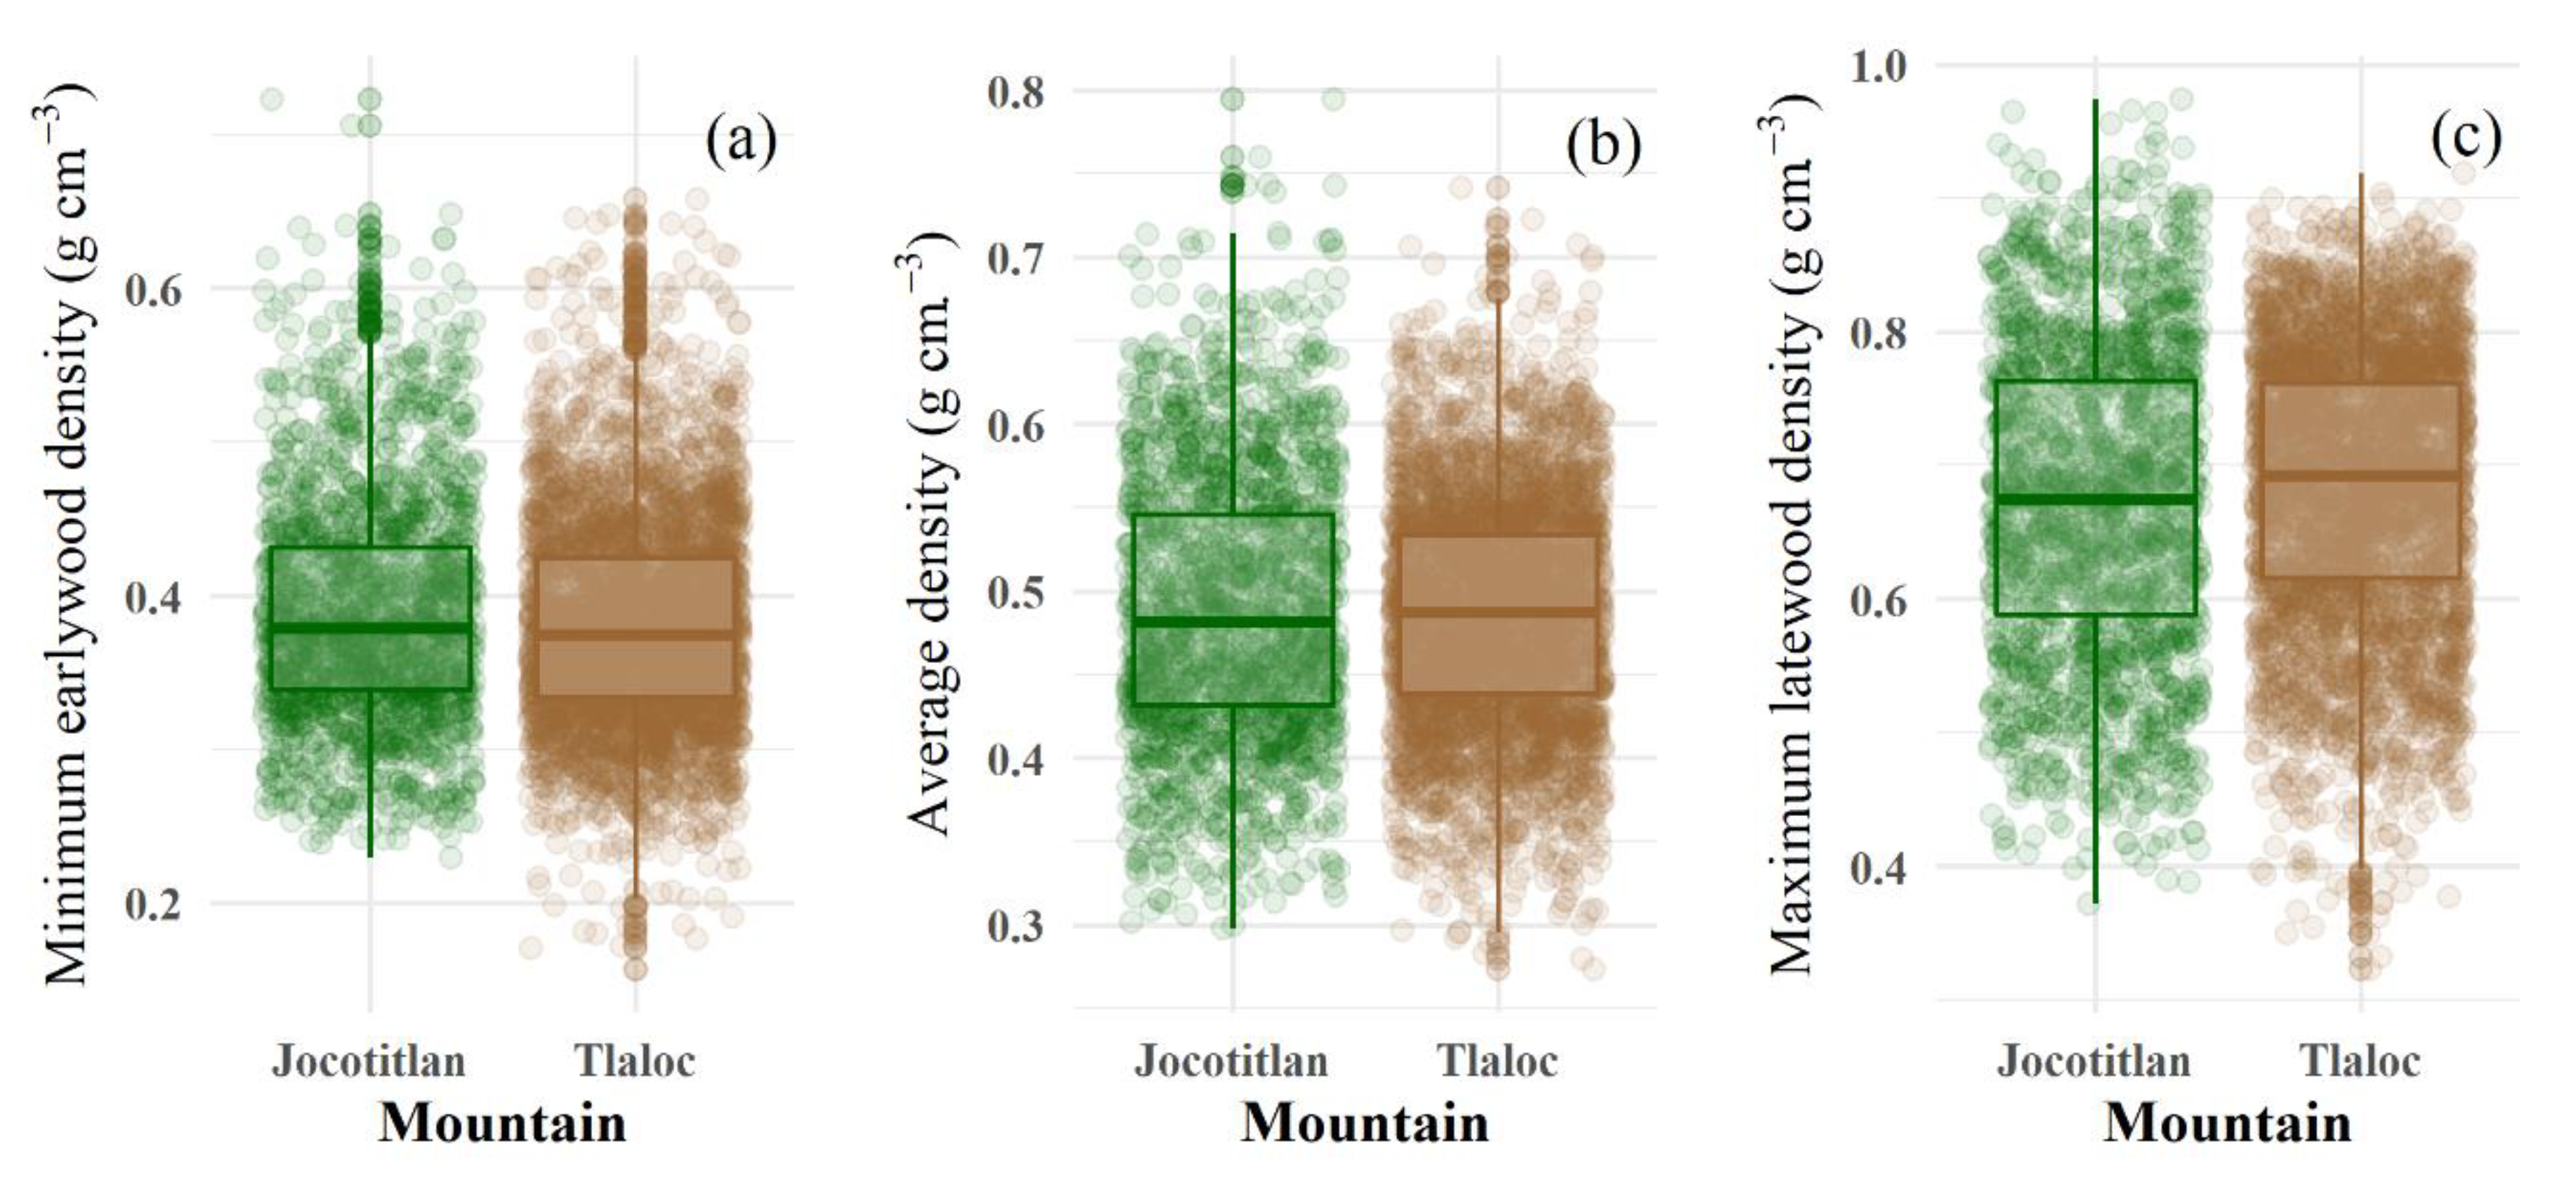
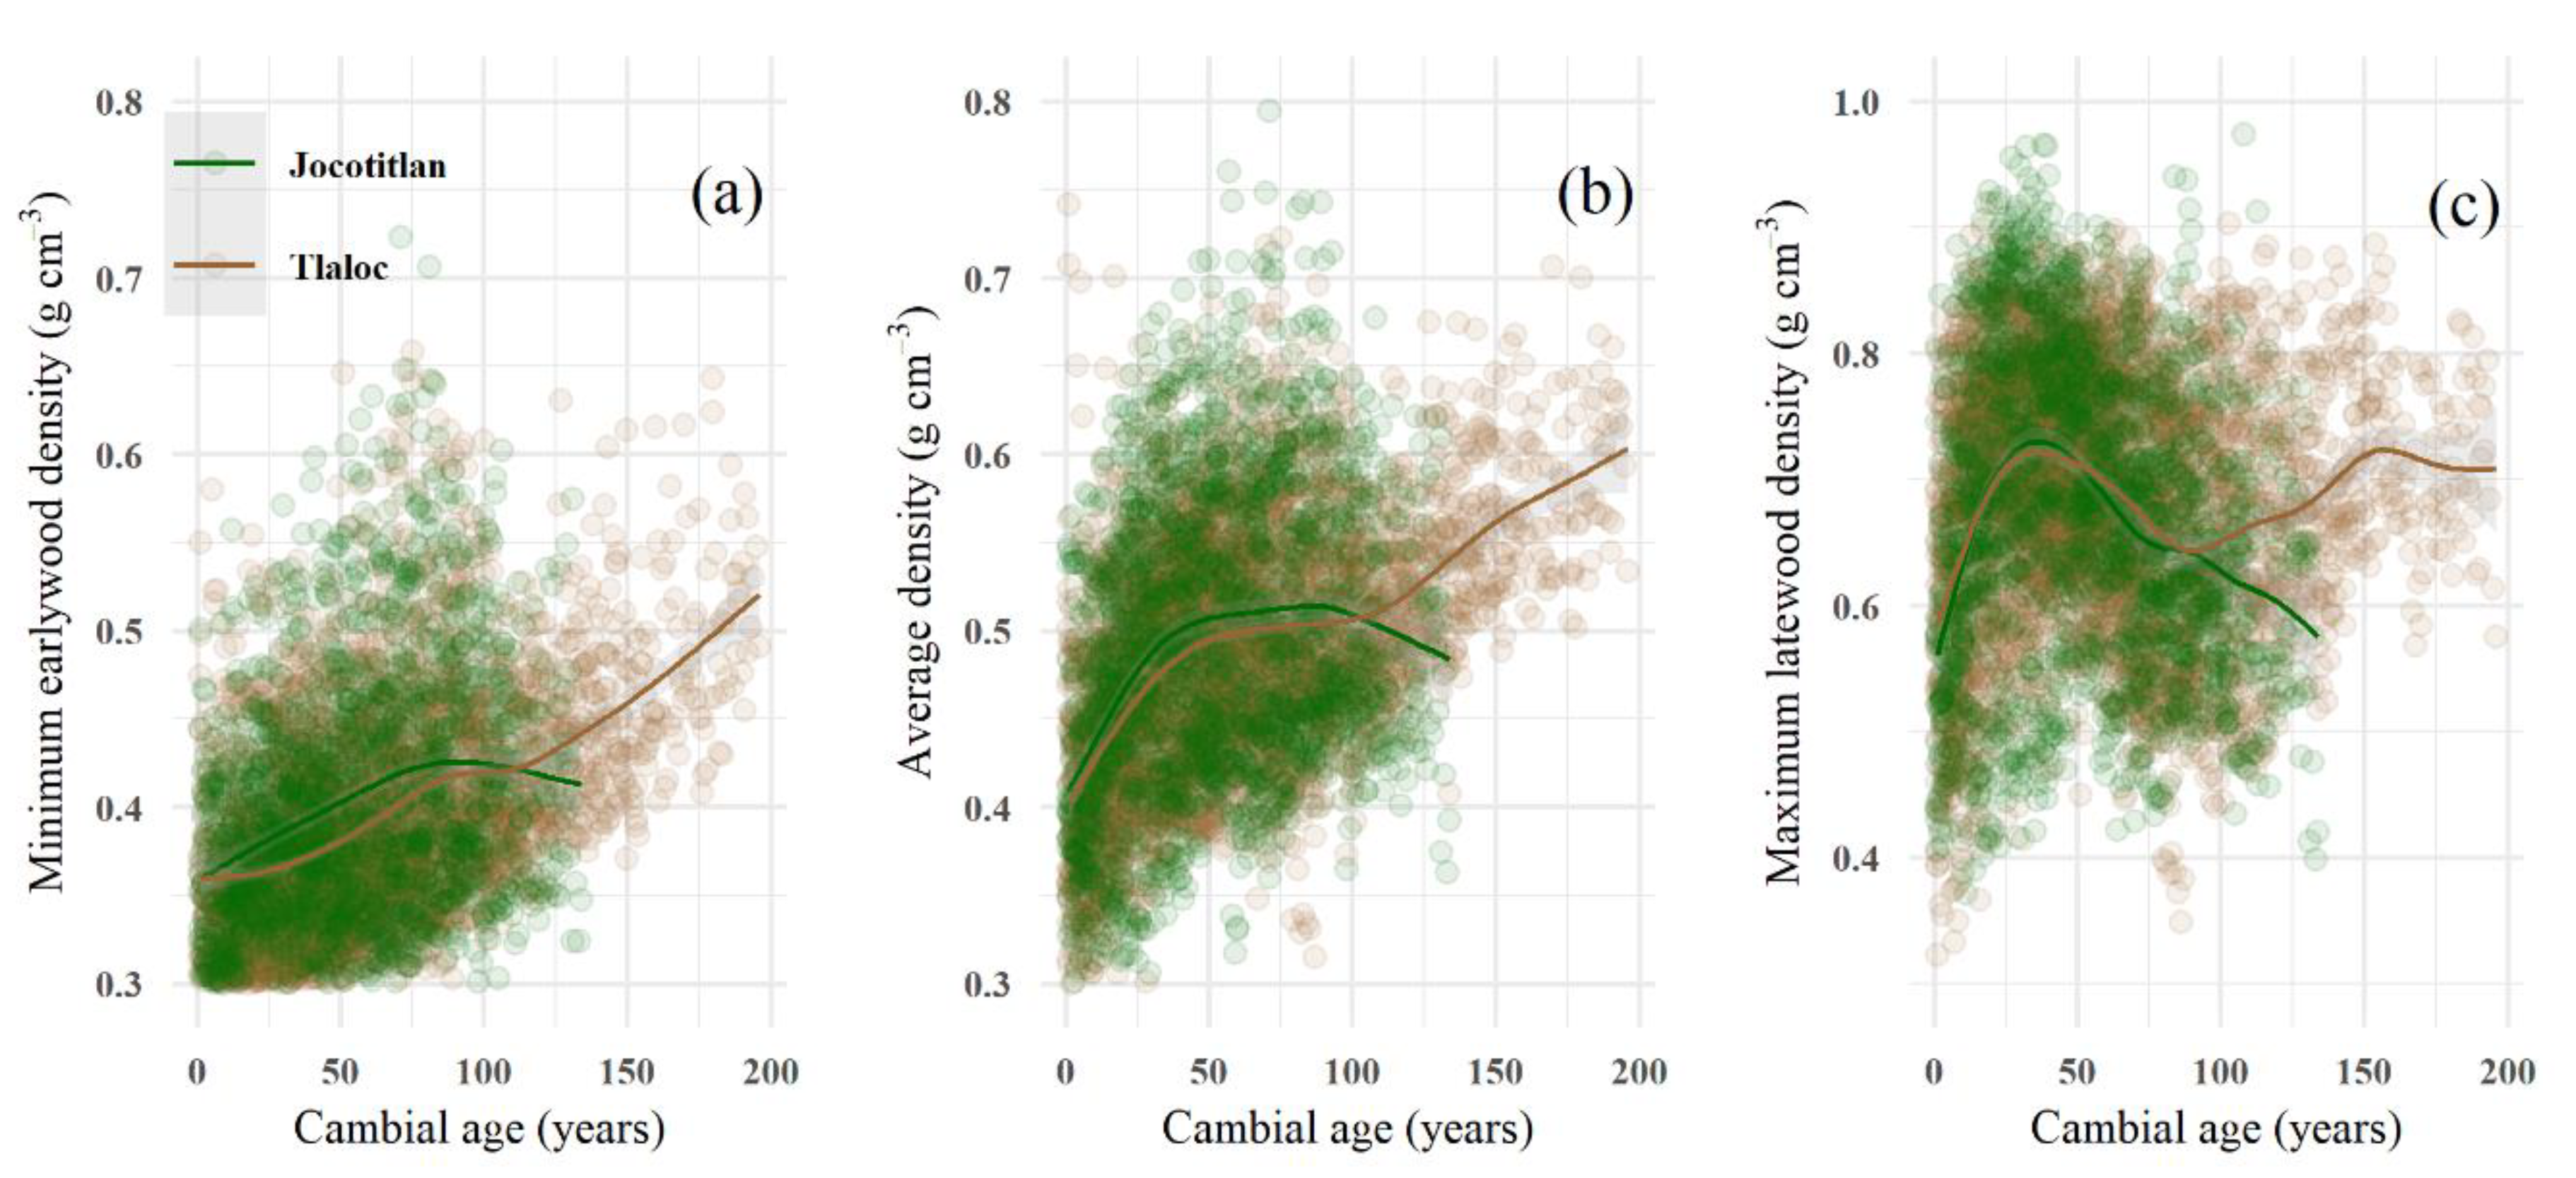
3.1. Tree-Ring Density Statistics and the Cambial Age Effect

Minimum earlywood density (MID) ranged from 0.16 to 0.72 g cm−3, with a mean of 0.39 g cm−3 for both mountains (Figure 2a). Average density (AVE) ranged from 0.26 to 0.8 g cm−3 with a mean of 0.48 g cm−3 for both mountains (Figure 2b). Corresponding values for maximum latewood density (MXD) were from 0.35 to 0.97 g cm−3, with a mean of 0.68 g cm−3 for both mountains (Figure 2c). There was no statistical difference in the mean values for MID (p = 0.32), AVE (p = 0.40) and MXD (p = 0.53) between mountains according to Bonferroni’s adjustment for multiple comparisons. Tree-ring wood density series spanned from 1793 to 2016 and 1800 to 2016 for TLA and JOC, respectively; with oldest values at the cambial age of 196 and 134 y, in the same order.
Raw tree-ring widths were negatively associated to MID and AVE at TLA (r = −0.50 and r = −0.33, p < 0.05) and JOC (r = −0.45 and r = −0.39, p < 0.05), and positively related to MXD only at TLA (r = 0.29, p < 0.05) (Figure S1). Contrary to the expected plateau in wood density for mature trees, we found a constantly increasing trend in MID and AVE at TLA and an evident reduction in MXD at JOC (Figure 3a–c). According to the cambial age, at both mountains, a peak in MXD occurs about the age of 40 y (in the juvenile stage); however, TLA showed a second peak of MXD around to the age of 150 y (Figure 3c).

3.2. Elevation and Aspect Variations for Tree-Ring Wood Density

We found that all tree-ring wood density variables showed an elevation (p < 0.05) and cambial age effect (p < 0.01) with no differences between mountains (p = 0.81). This means that these factors affected wood density in the same way regardless of geographical location. The aspect was not statistically significant for AVE (p = 0.07), and MXD (p = 0.24), however, it was relevant for MID (p = 0.029). The interaction elevation × aspect was marginally significant for MID and MXD (p < 0.08) (Table 2).
Significantly higher MID and AVE were seen at 3700 m asl, regardless of aspect. Thus, statistical differences (using Bonferroni’s adjustment for multiple comparisons) for MID were calculated between the 3700-NW site (elevation-aspect) to 3500-NW, 3800-SW, and 3900-NW sites (p < 0.05) (Figure 4a). For AVE, differences were between the 3700-SW site with 3800-SW, and 3900-NW (p < 0.05), and marginally with 3500-NW and 3900-SW sites (p < 0.10) (Figure 4b). Finally, differences for MXD were found between the 3700-SW site with 3800-NW, 3900-NW, 3800-SW and 3900-SW sites (p < 0.05) (Figure 4c).

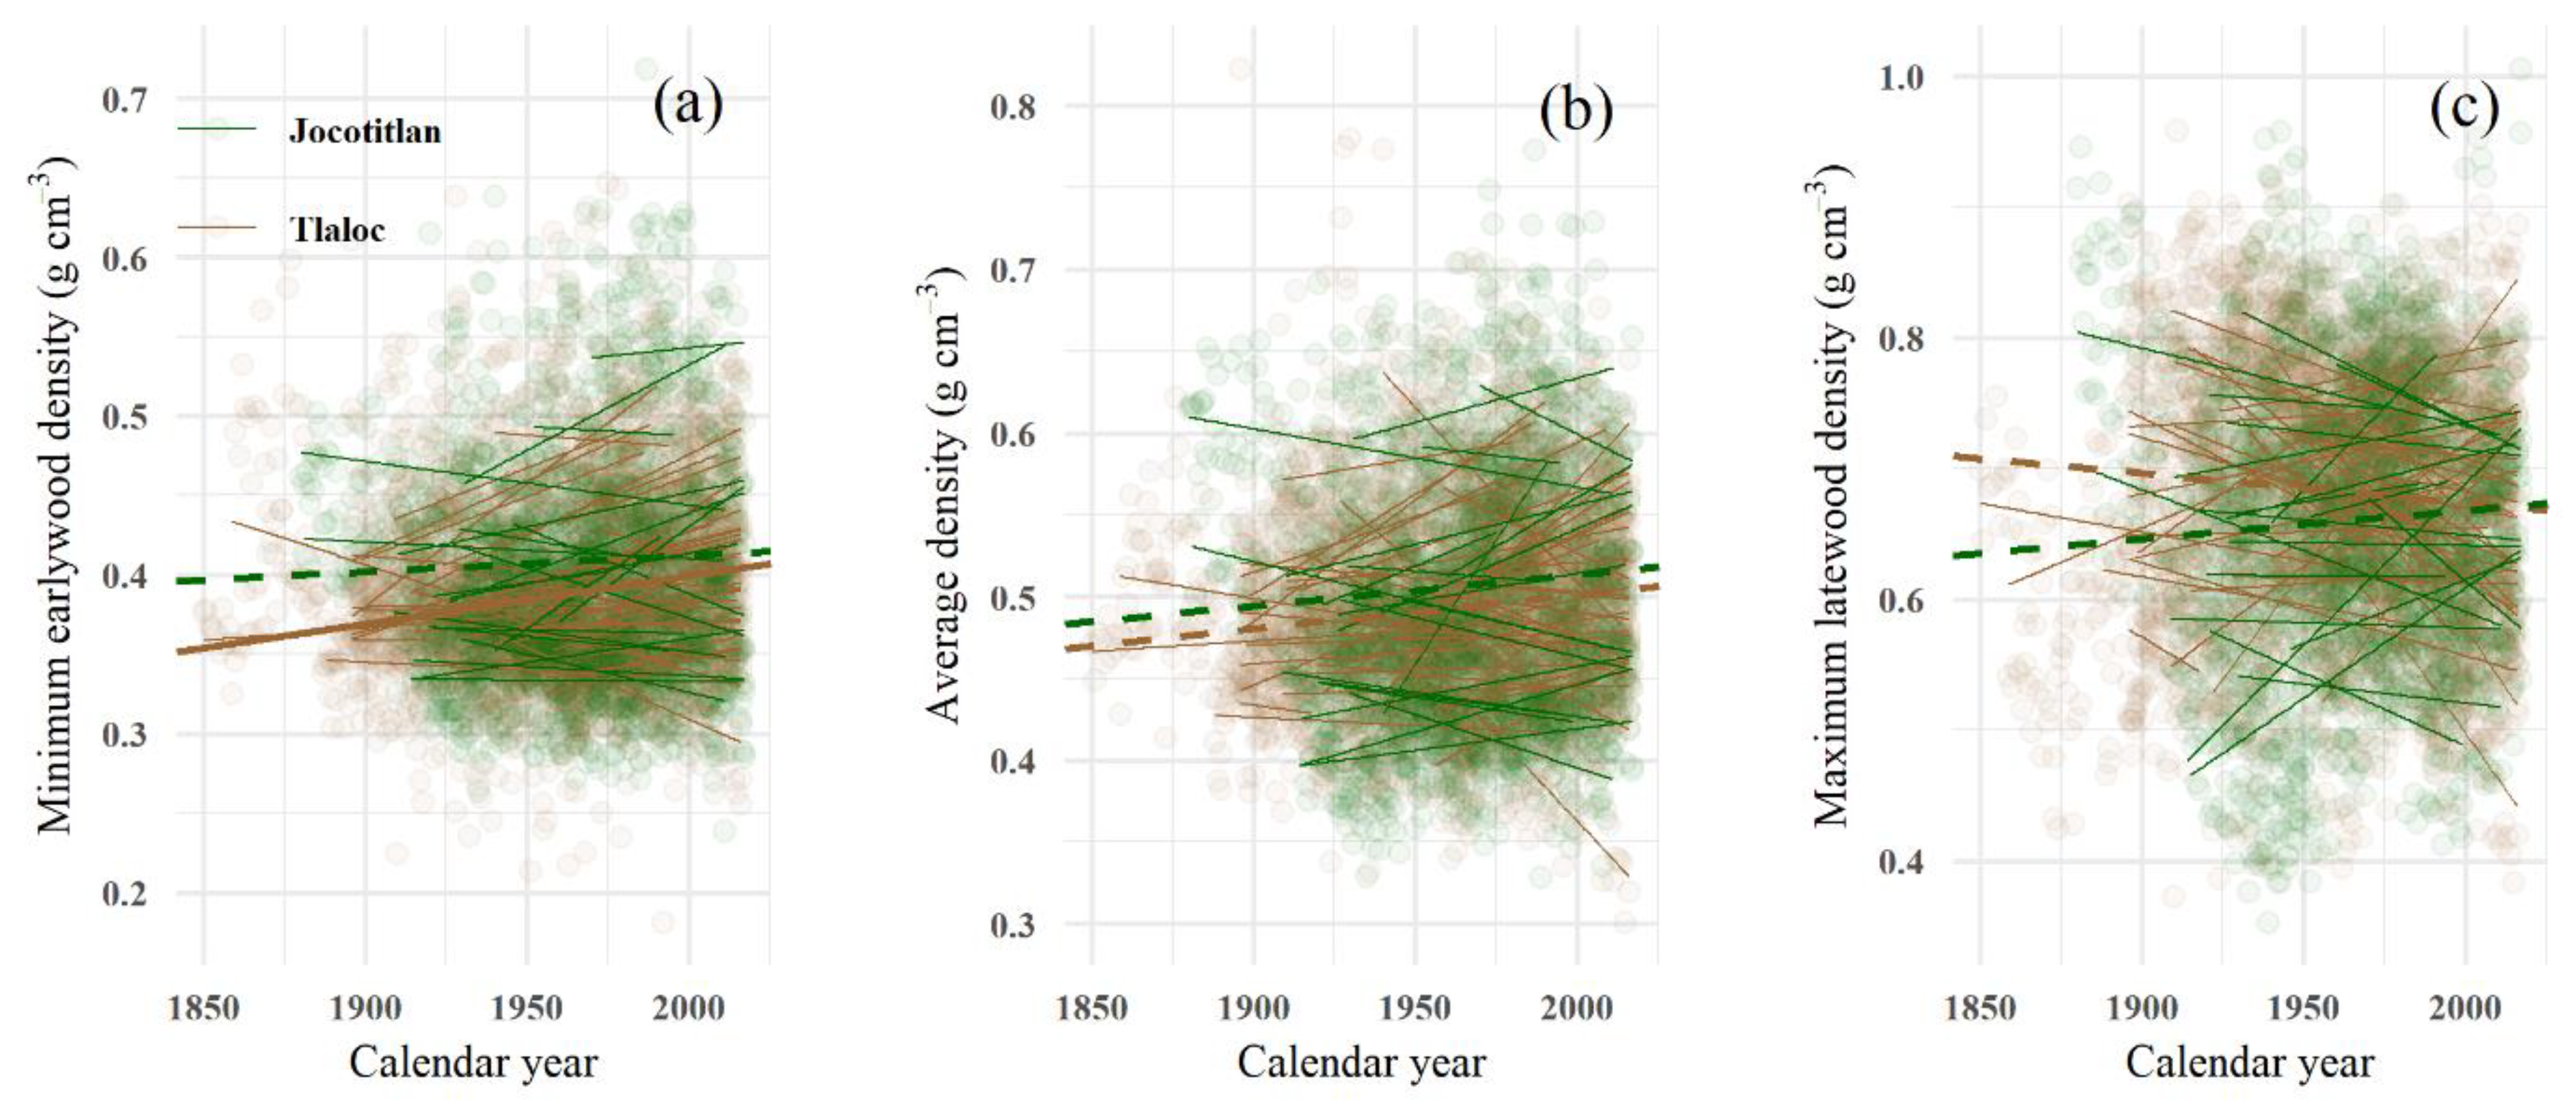
3.3. Trends and Stability in Adjusted Tree-Ring Wood Density Profiles

MID statistically increased over time (p < 0.001) (calendar year effect) at TLA mountain (Figure 5a). The average increment in MID for TLA is equivalent to 33 kg m−3 decade−1, this is approximately an increase of 50 kg m−3 throughout the life of the trees. However, at the tree level, we found increases up to 100 kg m−3. The rate of increase in MID was significantly higher (p = 0.001) at high elevation sites (3900-NW and 3900-SW). In contrast, MID, AVE, and MXD did not change over time at any mountain (p > 0.10) (Figure 5b,c). The difference between MXD and MID was similar at both mountains, but this amplitude increased over time at TLA (p = 0.03), possibly caused by a rising MID, denoting higher reaction response at this site.
The empirical cumulative distribution functions (CDF) and the Kolmogorov–Smirnov test confirmed that all tree-ring wood density distributions were significantly different between the two periods analyzed, <1950 and >1950 (Table 3). Remarkably, we found the same pattern between mountains for MID and AVE, showing a shift to denser rings after the second half of the 20th century. However, for MXD divergent conclusions arose, whereas a larger CDF after 1950 (p < 0.001) was found in TLA (less dense rings), and a smaller CDF was found for JOC (denser rings > 1950) (p < 0.001) (Figure S2).

3.4. Responses of Wood Density to Climate

MID responded positively to the temperature (maximum and minimum), mainly at low-elevation sites. Remarkably both mountains followed the same pattern, with the maximum correlations in April for minimum temperature (r = 0.55, p < 0.01) and during the summer season for maximum temperature (r = 0.54, p < 0.01) (Figure 6a). In contrast, precipitation and soil moisture were not significantly related to MID except for few months at 3500 and 3700 m asl (Figure 6a). A divergent response was seen for maximum temperature correlated to MXD since the lowest elevation sites (i.e., 3500 m asl) showed negative correlations in April (r = −0.40, p < 0.01) and positive correlation for the sites with the highest elevation in JOC (r = 0.22, p < 0.01). In the same way, we found a negative (3500 m asl), and positive (3800 m asl) correlations with minimum temperature. Finally, MXD showed a negative relationship with soil moisture during the summer at the lowest elevation (3500 m asl) (Figure 6b).

3.5. The Connection between Remotely Sensed Information and Wood Density Traits

Significant correlations were detected between remotely sensed information and tree-ring wood density variables; however, the best spatial associations (referred to as a larger surface with high correlations) were at TLA for MXD (Figure S3). Figure 7 summarizes the Pearson correlation with the total area for both mountains considering an α = 0.05. Overall, positive correlations were found for MXD, negative for MID and an opposite pattern for AVE.
In TLA, MXD significantly correlated to the NDVI from previous winter to spring with a maximum association in early March (day of the year 065, r = 0.59, and 56% total area), and with LAI in late August (doy 241, r = 0.58, 37% total area (Figure 7). MID was negatively correlated to NDVI from previous winter to spring with a maximum association in middle-January at TLA (doy 017, r = −0.60, 44% total area), and with EVI from previous-December (previous doy 337, r = −0.54, 35% total area). At JOC, AVE was negatively correlated to EVI in early-April at JOC (doy 097, r = −0.55, 55% total area). Spatially, the northernmost part of TLA Mountain was more suitable to establish significant links between tree-ring wood density variables and remotely sensed data (Figure 8a). Therefore, MXD seems to be more reliable to explain spring photosynthetic activity with drops in 2003, 2011 and 2013.

4. Discussion

4.1. Hypothesis Testing Summary

The temporal wood density analysis provides new insights into how high-elevation forests modulate wood formation processes (i.e., xylogenesis) to cope with climate variation and assure survival. We showed that both mountains (TLA and JOC) had statistically the same mean wood density, but the elevation and cambial age are important factors. The notable increase in MID over time only at TLA rejects our hypothesis of the same response at different locations. Stronger evidence on the adjustment of wood density in TLA at high elevations suggests a higher response in this location. Probably the fact that JOC is an isolated volcano has also isolated this tree community and resulting in it being a less responsive forest. While the cumulative distribution functions (CDF) detected significantly higher wood density after 1950 (MID and AVE), progressive changes over time evaluated with linear mixed models were partially demonstrated. Unexpectedly, considering the well-known concept that MXD is highly correlated to summer temperatures, we found a poor association, and it was MID that demonstrated a higher correlation. MID was relevant because lower wood density relates to wider cells which occurs in the growing season. Finally, although we compared three different spatial variables that were highly correlated among them (NDVI, LAI, and EVI), the NDVI was the most important related to MXD during the spring season at TLA but no concurrent at JOC.

4.2. Average Wood Density Profiles of Pinus hartwegii

Pinus hartwegii wood density values have been previously reported [25,60,61,62]. While average density values reported by Zobel [62] and Morgado-González, et al. [25] are lower and higher than ours; results from Rojas Garcia and Villers Ruiz [60] agree with this study (0.48 g cm−3) (Figure 2). Compared with other mountain pine species, P. hartwegii’s MXD values (0.68 g cm−3) were lower than Pinus cooperi Blanco at a Northern Sierra site in Mexico (0.77 g cm−3) [26] but higher than Pinus cembra L from the European Alps (0.56 g cm−3) [7], and Pinus uncinata Ramon ex DC in the Spanish Pyrenees (0.60 g cm−3) [3] (Figure 2c). Conversely, we found higher average MID values (0.38 g cm−3) compared with Abies alba Mill and Pinus uncinata in the Spanish Pyrenees (0.31 and 0.34 g cm−3, respectively) [3,10] but lower than Juniperus thurifera L also in Spain [11] (Figure 2a). Nevertheless, this is the first study providing long-term micro density records for Pinus hartwegii (e.g., minimum earlywood and maximum latewood).

4.3. Tree-Ring Wood Density Patterns across Mountains, Elevations, and Aspects

Similar to other studies [63,64], we found that temporal variations in wood density are strongly influenced by cambial age and once the juvenile stage is finished there can be a declining or irregular trend (Figure 3). In fact, for TLA a clear increasing trend was observed for MID and AVE even with ages older than 100 years, which could suggest that trees growing at TLA have been adapting their wood morphological outcomes to climate variability more strongly than at JOC. The negative correlation found between raw tree-ring width and density (MID and AVE) (Figure S1) suggest that any increase in radial growth results in lower wood density until it reaches a plateau. Lower density and wider cell lumen improve hydraulic conductivity but with a higher risk for cavitation [11]. On the other hand, the positive relationship with MXD for TLA could suggest the densification of woody tissues (higher carbon investment) within wider rings but only until a threshold is reached (Figure S1) [3].
Elevation was an important factor explaining P. hartwegii wood density variation whereas aspect was a poor predictor except for MID (Table 2). Morgado-González, et al. [25] found similar results at TLA; however, they found that elevation × aspect interaction was statistically significant for AVE, while in this study only MID and MX were marginally significant (p < 0.10). Possible discrepancies could be attributed to the acquisition method since Morgado-González, et al. [25] tested X-ray computed tomography rather than X-ray densitometer that is demonstrated to be more accurate [65]. Many studies that focused on understanding wood density response with elevation have not found a clear pattern across regions. For example, an increase [66], a decrease [67] or even no change with elevation has been reported [68]. Thus, the increase in wood density at intermediate elevations (e.g., 3700 m asl) with a decrease at extreme elevations (e.g., 3500 and 3900 m asl) (Figure 4) is a pattern previously reported by Topaloğlu, et al. [69] for Fagus orientalis Lipsky.

4.4. The Temporal Stability of Tree-Ring Wood Density at Two High-Elevation Forests

Conversely to other studies showing a common decrease in average or latewood density during the second half of the twentieth century in Northern ecosystems [22,23,70], here we found a rising MID at TLA (using linear mixed models). Nevertheless, the temporal trends were dependent on the statistical method used, thus, the CDF analysis showed a shift to denser rings after 1950 (Table 3) for MID and AVE regardless of Mountain site. Although not all long-term trends in Figure 5 are statistically significant with linear mixed models (p < 0.05); they matched with slope direction in Kolmogorov–Smirnov test results. For example, less dense MXD values in TLA after 1950 agree with a negative slope observed in Figure 5c and denser MXD values in JOC agreed with a positive slope (Figure 5c). Andreu-Hayles, et al. [21] reported the same wood density adjustment with a shift to denser rings after 1950 for Picea glauca in Alaska.
Despite the statistical method used, the results suggest that, most notably at TLA, P. hartwegii modulate wood formation process according to climate variation (Figure 5a) as influenced by topographic position. We argue that climate sensitive tree-ring series are also indicative of the regulation of wood formation processes. In this regard, TLA exhibited a higher series intercorrelation and mean sensitivity than JOC (0.486 vs. 0.338 and 0.25 vs. 0.18, respectively), however, further information is needed to support this affirmation. Probably the fact that JOC is an isolated volcano expose this mountain to abrupt daily changes in temperatures, influencing cambial activity and leading lower correlation between wood density and climate and remote sensed variables.
The MID increase and the subsequent reduction of wood density range (e.g., the difference between MXD and MID) in TLA, could mean that trees are reducing water transport, despite high-elevation sites having better water status conditions than low-elevation sites [71]. Nevertheless, it is interesting to point out that not all trees followed the same trend which could denote either high phenotypic plasticity or a high genetic variation of P. hartwegii [72] (Figure 5).

4.5. Climate—Wood Density Responses

The maximum latewood density (MXD) is a well-known proxy for summer temperatures in northern forests [7,9,10,73,74]. Overall, MXD increases due to higher temperatures allow for production and deposition of more cell wall components due to longer growing seasons [7]. However, in Mexican temperate forests, an inverse relationship has been reported, Pompa-García and Venegas-González [26] found a negative correlation with maximum temperature during the spring season. In our study, we did not find a noticeable influence of temperature but rather soil moisture was important during the late growing season (Figure 6b). MXD is related to cell differentiation processes (thickening or lignification) in latewood tracheids at the end of the summer season [75]. The negative response found between MXD and soil moisture suggests that the growth of P. hartwegii is controlled by soil moisture at the lowest elevation (3500 m asl) which drives the thickening of cell walls and the production of total tracheid lumens [11,76]. The soil water content affects lumen size by influencing the turgor pressure during the tracheid’s differentiation process [77,78]
On the other hand, the positive correlations between MID and temperature (maximum and minimum) suggest that the higher values in MID are accelerated by high temperatures with an exception at the highest elevation (3900 m asl). In this regard, Camarero, et al. [11] found similar results for Juniperus thurifera with positively (temperature) and negatively (rainfall) correlations with MID during the May–June period.

4.6. Mountain Dependent Associations between Wood Density and MODIS Variables

During the last decades, a major effort has been made to evaluate the dynamics of wood formation (xylogenesis) at a tracheid level and assessing the rates of differentiation (cell enlarging and wall thickening), however, these studies are spatially restricted [79,80]. Thus, to assess xylogenesis at larger spatio-temporal scales, studies have explored relations between remotely sensed variables and the carbon allocation process. For example, several studies have correlated tree-ring width records with NDVI across different spatial and temporal scales [34,35,36,38]. However, less frequently, tree-ring density variables have also been explored [21,40,41]. From these studies, we can conclude that photosynthetic activity and carbon allocation (e.g., MXD) are broadly linked although they deal with different aspects of plant physiology.
Documented links between MXD and NDVI at northern latitudes showed that summer NDVI (May and June) is important to explain xylogenesis as related to the vigor canopy and growing season effect on the cell differentiation process [21,40]. However, we did not find the May–June period relevant to wood density, instead, we found that the previous winter until spring period showed a strong positive correlation (highest correlation in doy 065—March) with NDVI at TLA but not at JOC (Figure 7). This relationship implies that higher NDVI values during the first months of the year are translated into denser woody tissues at the end of the growing season but not all sites are suitable to establish robust links. It is well known that there is a lag time between processes, first with photosynthesis and then with the carbon allocation process. Thus, several intra and inter-specific factors could modify the first signal captured by remote sensed information such as edaphoclimatic conditions or the age of trees, that can alter the priority of carbon allocation, leaf area and light use efficiency [81]. For example, we saw a poor association at JOC for almost all remotely sensed variables, thus, although both mountains are strongly temperature-limited, JOC is probably restricted by another factor. The negative correlation observed between NDVI and MID (highest correlation in doy 017-January) indicates that high photosynthetic activity (NDVI) at this time is matched with low MID. Perhaps because carbon allocation at the start of the growing season is primarily directed towards shoot growth (leaf area) and the start of cambial activity, wood cell division and enlargement (i.e., wider xylem cells) have priority over cell wall thickening. Mäkinen, et al. [82] reported a decrease in wood density when well-watered and optimal nutrients conditions are supplied.
The NDVI is an appropriate indicator of canopy vigor and thus the health status of plants [83]. The fact that the MXD time series at TLA mirrored the NDVI activity but not at JOC, reinforces the idea that more studies are needed to improve our understanding of the relationship between the canopy and cambial activity at local scales and the potential impact of climate change on forests tree growth and productivity.

5. Conclusions

We demonstrated that two high-elevation forests closely located on different mountain sites and dominated by the same tree species (Pinus hartwegii Lindl.) could have statistically similar wood density profiles, but different wood density trajectories suggesting different behaviors in the wood formation process. Tree-ring wood adjustments coupled with a decrease in productivity (previously reported) can provide early-warning signals of stressed forests as water transport efficiency can be affected as a result of climate variation. Compared to MXD, we reported higher correlations between MID and temperature. A set of significant correlations between MXD and the Normalized Difference Vegetation Index—NDVI indicates the potential use of the link between wood micro-density and remotely sensed information to understand forest response climate change effects but not at all site conditions.

Supplementary Materials

The following are available online at https://www.mdpi.com/1999-4907/11/4/452/s1, Figure S1. Scatter plot between tree-ring width and tree-ring wood density by Mountain. The solid line represents a generalized additive model fitted by Mountain. Figure S2. Empirical cumulative distribution function (CDF) for adjusted tree-ring wood density variables by mountain. Figure S3. Spatial correlation (p < 0.05) between maximum latewood density-MXD, average density-AVE and minimum latewood density-MID and normalized difference vegetation index-NDVI at Tlaloc Mountain. “DOY” represents the day of the year for the current year while the word “doy” in lowercase represents the day for the previous year.

Author Contributions

Conceptualization, A.C.-D. and A.G.-G.; Data curation, P.R.; Funding acquisition, P.R. and W.R.H.; Investigation, A.C.-D. and A.G.-G.; Methodology, A.C.-D. and J.J.V.-H.; Resources, J.J.V.-H. and W.R.H.; Software, P.R.; Visualization, W.R.H.; Writing—original draft, A.C.-D. and A.G.-G.; Writing—review and editing, A.G.-G., W.R.H. and J.J.V.-H. All authors have read and agree to the published version of the manuscript.

Funding

This research received funding from The National Council for Research and Technology (CONACyT) and the ECOS NORD Program for French-Mexican collaboration, under the project number 0276777 “Impacto del cambio climático en la adaptación y plasticidad fenotipica del crecimiento en árboles forestales”-M16A01 “Impact du changement climatique sur la plasticité phénotypique de la microdensité du xylème” and the J. G. Boswell Endowed Chair in Soil Science.

Acknowledgments

We thank the followings institutions for the logistic support for this research: Colegio de Postgraduados (México) and the French National Institute for Agriculture, Food, and Environment (INRAE—France).

Conflicts of Interest

The authors declare no conflict of interest.

References

  1. McDowell, N.G.; Allen, C.D. Darcy’s law predicts widespread forest mortality under climate warming. Nat. Clim. Chang. 2015, 5, 669. [Google Scholar] [CrossRef]
  2. Chave, J.; Coomes, D.; Jansen, S.; Lewis, S.L.; Swenson, N.G.; Zanne, A.E. Towards a worldwide wood economics spectrum. Ecol. Lett. 2009, 12, 351–366. [Google Scholar] [CrossRef] [PubMed]
  3. Granda, E.; Camarero, J.J.; Galván, J.D.; Sangüesa-Barreda, G.; Alla, A.Q.; Gutierrez, E.; Dorado-Liñán, I.; Andreu-Hayles, L.; Labuhn, I.; Grudd, H.; et al. Aged but withstanding: Maintenance of growth rates in old pines is not related to enhanced water-use efficiency. Agric. For. Meteorol. 2017, 243, 43–54. [Google Scholar] [CrossRef]
  4. Babst, F.; Bouriaud, O.; Papale, D.; Gielen, B.; Janssens, I.A.; Nikinmaa, E.; Ibrom, A.; Wu, J.; Bernhofer, C.; Köstner, B.; et al. Above-ground woody carbon sequestration measured from tree rings is coherent with net ecosystem productivity at five eddy-covariance sites. New Phytol. 2014, 201, 1289–1303. [Google Scholar] [CrossRef] [PubMed] [Green Version]
  5. Hacke, U.G.; Sperry, J.S.; Pockman, W.T.; Davis, S.D.; McCulloh, K.A. Trends in wood density and structure are linked to prevention of xylem implosion by negative pressure. Oecologia 2001, 126, 457–461. [Google Scholar] [CrossRef]
  6. Martinez-Meier, A.; Fernández, M.E.; Dalla-Salda, G.; Gyenge, J.; Licata, J.; Rozenberg, P. Ecophysiological basis of wood formation in ponderosa pine: Linking water flux patterns with wood microdensity variables. For. Ecol. Manag. 2015, 346, 31–40. [Google Scholar] [CrossRef]
  7. Cerrato, R.; Salvatore, M.C.; Gunnarson, B.E.; Linderholm, H.W.; Carturan, L.; Brunetti, M.; De Blasi, F.; Baroni, C. A Pinus cembra L. tree-ring record for late spring to late summer temperature in the Rhaetian Alps, Italy. Dendrochronologia 2019, 53, 22–31. [Google Scholar] [CrossRef]
  8. Chen, F.; Yuan, Y.; Wei, W.; Yu, S.; Fan, Z.; Zhang, R.; Zhang, T.; Li, Q.; Shang, H. Temperature reconstruction from tree-ring maximum latewood density of Qinghai spruce in middle Hexi Corridor, China. Theor. Appl. Climatol. 2012, 107, 633–643. [Google Scholar] [CrossRef]
  9. Briffa, K.R.; Osborn, T.J.; Schweingruber, F.H. Large-scale temperature inferences from tree rings: A review. Glob. Planet. Chang. 2004, 40, 11–26. [Google Scholar] [CrossRef]
  10. Camarero, J.J.; Gutiérrez, E. Wood density of silver fir reflects drought and cold stress across climatic and biogeographic gradients. Dendrochronologia 2017, 45, 101–112. [Google Scholar] [CrossRef]
  11. Camarero, J.J.; Rozas, V.; Olano, J.M.; Fernández-Palacios, J.M. Minimum wood density of Juniperus thurifera is a robust proxy of spring water availability in a continental Mediterranean climate. J. Biogeogr. 2014, 41, 1105–1114. [Google Scholar] [CrossRef]
  12. Wang, L.; Payette, S.; Bégin, Y. Relationships between anatomical and densitometric characteristics of black spruce and summer temperature at tree line in northern Quebec. Can. J. For. Res. 2002, 32, 477–486. [Google Scholar] [CrossRef]
  13. Wu, P.; Wang, L.; Shao, X. Reconstruction of summer temperature variation from maximum density of alpine pine during 1917-2002 for west Sichuan Plateau, China. J. Geogr. Sci. 2008, 18, 201–210. [Google Scholar] [CrossRef]
  14. Blunden, J.; Arndt, D.S. State of the Climate in 2017. Bull. Am. Meteorol. Soc. 2018, 99, 332. [Google Scholar] [CrossRef]
  15. IPCC. Climate Change 2013: The Physical Science Basis. Summary for Policymakers; Cambridge University Press: London, UK, 2013; p. 231. [Google Scholar]
  16. Körner, C. Alpine Treelines; Springer: Basel, Switzerland, 2012; p. 220. [Google Scholar] [CrossRef]
  17. Holtmeier, F.-K. Mountain Timberlines: Ecology, Patchiness, and Dynamics; Springer Science & Business Media: Berlin, Germany, 2009; Volume 36, p. 421. [Google Scholar]
  18. Körner, C. The use of ‘altitude’ in ecological research. Trends Ecol. Evol. 2007, 22, 569–574. [Google Scholar] [CrossRef]
  19. Pepin, N.; Bradley, R.S.; Diaz, H.F.; Baraer, M.; Caceres, E.B.; Forsythe, N.; Fowler, H.; Greenwood, G.; Hashmi, M.Z.; Liu, X.D.; et al. Elevation-dependent warming in mountain regions of the world. Nat. Clim. Chang. 2015, 5, 424–430. [Google Scholar] [CrossRef] [Green Version]
  20. Mayr, S.; Schwienbacher, F.; Bauer, H. Winter at the alpine timberline. Why does embolism occur in Norway spruce but not in stone pine? Plant Physiol. 2003, 131, 780–792. [Google Scholar] [CrossRef] [Green Version]
  21. Andreu-Hayles, L.; D’Arrigo, R.; Anchukaitis, K.J.; Beck, P.S.A.; Frank, D.; Goetz, S. Varying boreal forest response to Arctic environmental change at the Firth River, Alaska. Environ. Res. Lett. 2011, 6. [Google Scholar] [CrossRef]
  22. Briffa, K.R.; Schweingruber, F.H.; Jones, P.D.; Osborn, T.J.; Shiyatov, S.G.; Vaganov, E.A. Reduced sensitivity of recent tree-growth to temperature at high northern latitudes. Nature 1998, 391, 678–682. [Google Scholar] [CrossRef]
  23. Franceschini, T.; Bontemps, J.-D.; Leban, J.-M. Transient historical decrease in earlywood and latewood density and unstable sensitivity to summer temperature for Norway spruce in northeastern France. Can. J. For. Res. 2012, 42, 219–226. [Google Scholar] [CrossRef]
  24. González-Cásares, M.; Yerena-Yamallel, J.I.; Pompa-García, M. Measuring temporal wood density variation improves carbon capture estimates in Mexican forests. Acta Univ. 2016, 26, 11–14. [Google Scholar] [CrossRef]
  25. Morgado-González, G.; Gómez-Guerrero, A.; Villanueva-Díaz, J.; Terrazas, T.; Ramírez-Herrera, C.; de la Rosa, P.H. Wood density of Pinus hartwegii Lind. At two altitude and exposition levels. Agrociencia 2019, 53, 645–660. [Google Scholar]
  26. Pompa-García, M.; Venegas-González, A. Temporal Variation of Wood Density and Carbon in Two Elevational Sites of Pinus cooperi in Relation to Climate Response in Northern Mexico. PLoS ONE 2016, 11, e0156782. [Google Scholar] [CrossRef] [PubMed]
  27. Villanueva-Díaz, J.; Cerano Paredes, J.; Vázquez Selem, L.; Stahle, D.W.; Fulé, P.Z.; Yocom, L.L.; Franco Ramos, O.; Ariel Ruiz Corral, J. Red dendrocronológica del pino de altura (Pinus hartwegii Lindl.) para estudios dendroclimáticos en el noreste y centro de México. Investig. Geográficasboletín Del Inst. De Geogr. 2015, 2015, 5–14. [Google Scholar] [CrossRef] [Green Version]
  28. Yocom, L.L.; Fulé, P.Z.; Brando, P. Human and climate influences on frequent fire in a high-elevation tropical forest. J. Appl. Ecol. 2012, 49, 1356–1364. [Google Scholar] [CrossRef]
  29. Astudillo-Sánchez, C.C.; Villanueva-Díaz, J.; Endara-Agramont, A.R.; Nava-Bernal, G.E.; Gómez-Albores, M.A. Climatic variability at the treeline of Monte Tlaloc, Mexico: A dendrochronological approach. Trees 2017, 31, 441–453. [Google Scholar] [CrossRef]
  30. Cerano-Paredes, J.; Villanueva-Diaz, J.; Vazquez-Selem, L.; Cervantes-Martinez, R.; Esquivel-Arriaga, G.; Guerra-de la Cruz, V.; Fule, P.Z. Historical fire regime and its relationship with climate in a forest of Pinus hartwegii to the north of Puebla State, Mexico. Bosque 2016, 37, 389–399. [Google Scholar] [CrossRef] [Green Version]
  31. Ricker, M.; Gutierrez-Garcia, G.; Daly, D.C. Modeling long-term tree growth curves in response to warming climate: Test cases from a subtropical mountain forest and a tropical rainforest in Mexico. Can. J. For. Res. 2007, 37, 977–989. [Google Scholar] [CrossRef]
  32. Gómez-Mendoza, L.; Arriaga, L. Modeling the Effect of Climate Change on the Distribution of Oak and Pine Species of Mexico. Conserv. Biol. 2007, 21, 1545–1555. [Google Scholar] [CrossRef]
  33. Rehfeldt, G.E.; Crookston, N.L.; Sáenz-Romero, C.; Campbell, E.M. North American vegetation model for land-use planning in a changing climate: A solution to large classification problems. Ecol. Appl. 2012, 22, 119–141. [Google Scholar] [CrossRef]
  34. Correa-Díaz, A.; Silva, L.C.R.; Horwath, W.R.; Gómez-Guerrero, A.; Vargas-Hernández, J.; Villanueva-Díaz, J.; Velázquez-Martínez, A.; Suárez-Espinoza, J. Linking Remote Sensing and Dendrochronology to Quantify Climate-Induced Shifts in High-Elevation Forests Over Space and Time. J. Geophys. Res. Biogeosci. 2019, 124, 166–183. [Google Scholar] [CrossRef]
  35. Berner, L.T.; Beck, P.S.A.; Bunn, A.G.; Lloyd, A.H.; Goetz, S.J. High-latitude tree growth and satellite vegetation indices: Correlations and trends in Russia and Canada (1982–2008). J. Geophys. Res. Biogeosci. 2011, 116, 1–13. [Google Scholar] [CrossRef] [Green Version]
  36. Bunn, A.G.; Hughes, M.K.; Kirdyanov, A.V.; Losleben, M.; Shishov, V.V.; Berner, L.T.; Oltchev, A.; Vaganov, E.A. Comparing forest measurements from tree rings and a space-based index of vegetation activity in Siberia. Environ. Res. Lett. 2013, 8. [Google Scholar] [CrossRef]
  37. Kaufmann, R.K.; D’Arrigo, R.D.; Paletta, L.F.; Tian, H.Q.; Jolly, W.M.; Myneni, R.B. Identifying Climatic Controls on Ring Width: The Timing of Correlations between Tree Rings and NDVI. Earth Interact. 2008, 12, 1–14. [Google Scholar] [CrossRef] [Green Version]
  38. Vicente-Serrano, S.M.; Camarero, J.J.; Olano, J.M.; Martin-Hernandez, N.; Pena-Gallardo, M.; Tomas-Burguera, M.; Gazol, A.; Azorin-Molina, C.; Bhuyan, U.; El-Kenawy, A. Diverse relationships between forest growth and the Normalized Difference Vegetation Index at a global scale. Remote Sens. Environ. 2016, 187, 14–29. [Google Scholar] [CrossRef] [Green Version]
  39. Correa-Díaz, A.; Silva, L.C.R.; Horwath, W.R.; Gómez-Guerrero, A.; Vargas-Hernández, J.; Villanueva-Díaz, J.; Suárez-Espinoza, J.; Velázquez-Martínez, A. From Trees to Ecosystems: Spatiotemporal Scaling of Climatic Impacts on Montane Landscapes Using Dendrochronological, Isotopic, and Remotely Sensed Data. Glob. Biogeochem. Cycles 2020, 34, e2019GB006325. [Google Scholar] [CrossRef]
  40. D’Arrigo, R.D.; Jacoby, G.C.; Bunker, D.E.; Malmstrom, C.M.; Los, S.O. Correlation between maximum latewood density of annual tree rings and NDVI based estimates of forest productivity. Int. J. Remote Sens. 2000, 21, 2329–2336. [Google Scholar] [CrossRef]
  41. Beck, P.S.A.; Andreu-Hayles, L.; D’Arrigo, R.; Anchukaitis, K.J.; Tucker, C.J.; Pinzon, J.E.; Goetz, S.J. A large-scale coherent signal of canopy status in maximum latewood density of tree rings at arctic treeline in North America. Glob. Planet. Chang. 2013, 100, 109–118. [Google Scholar] [CrossRef]
  42. Miyeni, R.B.; Hall, F.G.; Sellers, P.J.; Marshak, A.L. The interpretation of spectral vegetation indexes. IEEE Trans. Geosci. Remote Sens. 1995, 33, 481–486. [Google Scholar] [CrossRef]
  43. Perry, J.P. The Pines of Mexico and Central America; Timber Press: Portland, OR, USA, 1991; p. 231. [Google Scholar]
  44. Wang, T.; Hamann, A.; Spittlehouse, D.; Carroll, C. Locally Downscaled and Spatially Customizable Climate Data for Historical and Future Periods for North America. PLoS ONE 2016, 11, e0156720. [Google Scholar] [CrossRef]
  45. García, E. Modificaciones al Sistema de Clasificación Climática de Koppen, 5th ed.; Universidad Nacional Autónoma de México: Ciudad de México, CDMX, Mexico, 2004; p. 91. [Google Scholar]
  46. Dubroeucq, D.; Geissert, D.; Barois, I.; Ledru, M.-P. Biological and mineralogical features of Andisols in the Mexican volcanic higlands. Catena 2002, 49, 183–202. [Google Scholar] [CrossRef]
  47. Polge, H. Fifteen years of wood radiation densitometry. Wood Sci. Technol. 1978, 12, 187–196. [Google Scholar] [CrossRef]
  48. Mothe, F.; Duchanois, G.; Zannier, B.; Leban, J.-M. Microdensitometric analysis of wood samples: Data computation method used at Inra-ERQB (CERD program). Ann. Des Sci. For. 1998, 55, 301–313. [Google Scholar] [CrossRef] [Green Version]
  49. Schweingruber, F.H. Tree Rings and Environment Dendroecology; Paul Haupt: Berne, Switzerland, 1996; p. 609. [Google Scholar]
  50. Pinheiro, J.; Bates, D.; DebRoy, S.; Sarkar, D.; R Core Team. nlme: Linear and Nonlinear Mixed Effects Models; R Package Version 3.1131.1; R Foundation: Vienna, Austria, 2018. [Google Scholar]
  51. Hochberg, Y. A sharper Bonferroni procedure for multiple tests of significance. Biometrika 1988, 75, 800–802. [Google Scholar] [CrossRef]
  52. Esper, J.; Cook, E.R.; Krusic, P.J.; Peters, K.; Schweingruber, F.H. Tests of the RCS method for preserving low-frequency variability in long tree-ring chronologies. Tree-Ring Res. 2003, 59, 81–98. [Google Scholar]
  53. Zang, C.; Biondi, F. treeclim: An R package for the numerical calibration of proxy-climate relationships. Ecography 2015, 38, 431–436. [Google Scholar] [CrossRef]
  54. Wang, T.; Hamann, A.; Spittlehouse, D.L.; Murdock, T.Q. ClimateWNA—High-Resolution Spatial Climate Data for Western North America. J. Appl. Meteorol. Climatol. 2012, 51, 16–29. [Google Scholar] [CrossRef] [Green Version]
  55. Didan, K. MOD13Q1 MODIS/Terra Vegetation Indices 16-Day L3 Global 250m SIN Grid V006; NASA EOSDIS Land Processes DAAC: Sioux Falls, SD, USA, 2015.
  56. Myneni, R.; Knyazikhin, Y.; Park, T. MOD15A2H MODIS/Terra Leaf Area Index/FPAR 8-Day L4 Global 500m SIN Grid V006; NASA EOSDIS Land Processes DAAC: Sioux Falls, SD, USA, 2015.
  57. AppEEARS, T. Application for Extracting and Exploring Analysis Ready Samples (AppEEARS). Ver. 2.27; NASA EOSDIS Land Processes Distributed Active Archive Center (LP DAAC), USGS/Earth Resources Observation and Science (EROS) Center: Sioux Falls, SD, USA, 2019.
  58. Eastman, J. TerrSet Manual; Clark University: Worcester, MA, USA, 2016; p. 390. [Google Scholar]
  59. Jenkerson, C.; Maiersperger, T.; Schmidt, G. eMODIS: A User-friendly Data Source; Open-File Report 2010-1055; U.S. Geological Survey: Reston, VA, USA, 2010; p. 10.
  60. Rojas Garcia, F.; Villers Ruiz, L. Comparison of two methods for estimating the wood density of Pinus hartwegii Lindl. from La Malinche volcano. Madera Y Bosques 2005, 11, 63–71. [Google Scholar]
  61. Rojas-Garcia, F.; Villers-Ruiz, L. Estimation of the forest biomass of Malinche National Park, Tlaxcala-Puebla. Cienc. For. En Mex. 2008, 33, 59–86. [Google Scholar]
  62. Zobel, B.J. Variation in specific gravity and tracheid length for several species of Mexican Pine. Silvae Genet. 1965, 14, 1–12. [Google Scholar]
  63. Ivković, M.; Gapare, W.; Wu, H.; Espinoza, S.; Rozenberg, P. Influence of cambial age and climate on ring width and wood density in Pinus radiata families. Ann. For. Sci. 2013, 70, 525–534. [Google Scholar] [CrossRef] [Green Version]
  64. Zubizarreta-Gerendiain, A.; Gort-Oromi, J.; Mehtätalo, L.; Peltola, H.; Venäläinen, A.; Pulkkinen, P. Effects of cambial age, clone and climatic factors on ring width and ring density in Norway spruce (Picea abies) in southeastern Finland. For. Ecol. Manag. 2012, 263, 9–16. [Google Scholar] [CrossRef]
  65. Björklund, J.; von Arx, G.; Nievergelt, D.; Wilson, R.; Van den Bulcke, J.; Günther, B.; Loader, N.J.; Rydval, M.; Fonti, P.; Scharnweber, T.; et al. Scientific Merits and Analytical Challenges of Tree-Ring Densitometry. Rev. Geophys. 2019, 57, 1–41. [Google Scholar] [CrossRef] [Green Version]
  66. Kiaei, M. Effect of site and elevation on wood density and shrinkage and their relationships in Carpinus betulus. For. Stud. China 2012, 14, 229–234. [Google Scholar] [CrossRef]
  67. Govorčin, S.; Sinković, T.; Trajković, J. Some physical and mechanical properties of beech wood grown in Croatia. Wood Res. 2003, 48, 39–52. [Google Scholar]
  68. Fajardo, A. Insights into intraspecific wood density variation and its relationship to growth, height and elevation in a treeline species. Plant Biol. 2018, 20, 456–464. [Google Scholar] [CrossRef]
  69. Topaloğlu, E.; Ay, N.; Altun, L.; Serdar, B. Effect of altitude and aspect on various wood properties ofOriental beech (Fagus orientalis Lipsky) wood. Turk. J. Agric. For. 2016, 40, 397–406. [Google Scholar] [CrossRef]
  70. Franceschini, T.; Bontemps, J.-D.; Gelhaye, P.; Rittie, D.; Herve, J.-C.; Gegout, J.-C.; Leban, J.-M. Decreasing trend and fluctuations in the mean ring density of Norway spruce through the twentieth century. Ann. For. Sci. 2010, 67, 816. [Google Scholar] [CrossRef] [Green Version]
  71. Sáenz-Romero, C.; Lamy, J.-B.; Loya-Rebollar, E.; Plaza-Aguilar, A.; Burlett, R.; Lobit, P.; Delzon, S. Genetic variation of drought-induced cavitation resistance among Pinus hartwegii populations from an altitudinal gradient. Acta Physiol. Plant. 2013, 35, 2905–2913. [Google Scholar] [CrossRef]
  72. Viveros-Viveros, H.; Sáenz-Romero, C.; Vargas-Hernández, J.J.; López-Upton, J.; Ramírez-Valverde, G.; Santacruz-Varela, A. Altitudinal genetic variation in Pinus hartwegii Lindl. I: Height growth, shoot phenology, and frost damage in seedlings. For. Ecol. Manag. 2009, 257, 836–842. [Google Scholar] [CrossRef]
  73. Chen, F.; Yuan, Y.J.; Wei, W.S.; Fan, Z.A.; Zhang, T.W.; Shang, H.M.; Zhang, R.B.; Yu, S.L.; Ji, C.R.; Qin, L. Climatic response of ring width and maximum latewood density of Larix sibirica in the Altay Mountains, reveals recent warming trends. Ann. For. Sci. 2012, 69, 723–733. [Google Scholar] [CrossRef]
  74. D’Arrigo, R.D.; Jacoby, G.C.; Free, R.M. Tree-ring width and maximum latewood density at the North American tree line: Parameters of climatic change. Can. J. For. Res. 1992, 22, 1290–1296. [Google Scholar] [CrossRef]
  75. Rossi, S.; Deslauriers, A.; Anfodillo, T.; Carraro, V. Evidence of threshold temperatures for xylogenesis in conifers at high altitudes. Oecologia 2007, 152, 1–12. [Google Scholar] [CrossRef] [PubMed]
  76. Bouriaud, O.; Leban, J.M.; Bert, D.; Deleuze, C. Intra-annual variations in climate influence growth and wood density of Norway spruce. Tree Physiol. 2005, 25, 651–660. [Google Scholar] [CrossRef] [PubMed] [Green Version]
  77. Von Wilpert, K. Intraannual variation of radial tracheid diameters as monitor of site specific water stress. Dendrochronologia 1991, 9, 95–113. [Google Scholar]
  78. Liang, E.; Balducci, L.; Ren, P.; Rossi, S. Chapter 3—Xylogenesis and Moisture Stress A2—Kim, Yoon Soo. In Secondary Xylem Biology; Funada, R., Singh, A.P., Eds.; Academic Press: Boston, MA, USA, 2016; pp. 45–58. [Google Scholar] [CrossRef]
  79. Cuny, H.E.; Fonti, P.; Rathgeber, C.B.K.; von Arx, G.; Peters, R.L.; Frank, D.C. Couplings in cell differentiation kinetics mitigate air temperature influence on conifer wood anatomy. Plant Cell Environ. 2019, 42, 1222–1232. [Google Scholar] [CrossRef]
  80. Cuny, H.E.; Rathgeber, C.B.K.; Frank, D.; Fonti, P.; Fournier, M. Kinetics of tracheid development explain conifer tree-ring structure. New Phytol. 2014, 203, 1231–1241. [Google Scholar] [CrossRef]
  81. Lapenis, A.G.; Lawrence, G.B.; Heim, A.; Zheng, C.Y.; Shortle, W. Climate warming shifts carbon allocation from stemwood to roots in calcium-depleted spruce forests. Glob. Biogeochem. Cycles 2013, 27, 101–107. [Google Scholar] [CrossRef]
  82. Mäkinen, H.; Saranpää, P.; Linder, S. Wood-density variation of Norway spruce in relation to nutrient optimization and fibre dimensions. Can. J. For. Res. 2002, 32, 185–194. [Google Scholar] [CrossRef]
  83. Kaufmann, R.K.; D’Arrigo, R.D.; Laskowski, C.; Myneni, R.B.; Zhou, L.; Davi, N.K. The effect of growing season and summer greenness on northern forests. Geophys. Res. Lett. 2004, 31. [Google Scholar] [CrossRef]
Figure 1. (a) Localization of the study area (Tláloc-TLA and Jocotitlán-JOC); (b) Climograph representing monthly temperature (lines) and precipitation (bars) values according to climatic data extracted using ClimateNA [44]; and (c) General view of Mexican high-elevation forest at TLA.
Forests 11 00452 g001
Figure 2. Boxplot of tree-ring wood density at two high-elevation forests in central Mexico (a) minimum earlywood density—MID, (b) average density—AVE, and (c) maximum latewood density—MXD. Note that for all cases the mean values were statistically similar.
Forests 11 00452 g002
Figure 3. Cambial age effect for: (a) minimum earlywood density—MID, (b) average density—AVE and (c) maximum latewood density—MXD. The solid line represents a generalized additive model fit by Mountain.
Forests 11 00452 g003
Figure 4. Graphical comparison for site condition (elevation × aspect) in tree-ring wood density variables (a) minimum earlywood density—MID, (b) average density—AVE, and (c) maximum latewood density—MXD. Blue bars represent confidence intervals for estimated marginal means or least-square means, and red arrows allow comparisons among them. When arrows overlap differences are not significant (p > 0.05).
Forests 11 00452 g004
Figure 5. Linear mixed-effect predictions for (a) minimum earlywood density—MID, (b) average density—AVE, and (c) maximum latewood density—MXD grouped by tree response. Thin lines represent individual trees and the solid line represents the average response. Note that continuous a line means that the calendar year effect was significant while the opposite with the dotted.
Forests 11 00452 g005
Figure 6. Correlations between (a) adjusted minimum earlywood density (MID) (upper panel) and (b) maximum latewood density (MXD) (bottom panel) and monthly climatic variables (Tmax—maximum temperature (°C), Tmin—minimum temperature (°C), Prec—precipitation (mm) and SM—Soil moisture (m3 m−3) at two high-elevation forests (3500–3900 for Tláloc, and 3700–3800 for Jocotitlán). Significant correlations are indicated by triangles at the 0.01 significance level. Months of the previous year are indicated by lowercase letters while current is in uppercase letters.
Forests 11 00452 g006
Figure 7. Temporal associations between density values (Minimum earlywood density—MID, average density—AVE, and maximum latewood density—MXD) with remotely sensed variables derived from MODIS (Normalized Difference Vegetation Index—NDVI, Leaf Area Index—LAI, and Enhanced Vegetation Index—EVI) in two high-elevation forests in central Mexico (Tláloc—TLA and Jocotitlán—JOC). The color ramp represents the area covered by a significant correlation while the symbols (negative in red and positive in black) describe the slope of the correlation. Day of previous year are indicated with in lowercase (doy) and in uppercase for the current years. Note the relevance of DOY065 and DOY097 for TLA and JOC, regarding MXD and AVE, respectively.
Forests 11 00452 g007
Figure 8. (a) Example of the highest spatial correlation (p < 0.05) between the maximum latewood density—MXD time series and the Normalized Difference Vegetation Index—NDVI on the day of the year 065 at Tláloc mountain (TLA). Gray lines are contour-lines at 100-m intervals starting at 3500 m asl. (b) Temporal profile of significant NDVI pixels from the left panel (grey lines) with the MXD average chronology (red line).
Forests 11 00452 g008
Table 1. Climatic and topographic characteristics for the study sites.
VariableSite
Tláloc Mt (TLA)Jocotitlán Mt (JOC)
Summit (m asl)41253910
Average treeline position4000Not reached for this site
Mean annual maximum temperature (°C)14.83 ± 0.714.23 ± 0.4
Mean annual average temperature (°C)7.82 ± 0.57.74 ± 0.3
Mean annual minimum temperature (°C)0.81 ± 0.41.24 ± 0.3
Mean annual precipitation (mm)949.77 ± 65.5819.59 ± 71.4
Average soil moisture (m3 m−3)0.21 ± 0.030.18 ± 0.02
Soil typeAndisol (Ustivitrands/Haplustands)Andisol (Ustivitrands/Haplustands)
Table 2. Results of the analysis of variance on linear mixed-effects models fitted to the tree-ring wood variables of Pinus hartwegii. In the analysis, trees and mountain sites were tested as random effects. DF, degrees of freedom. Significance levels † p < 0.1, * p < 0.05, and ** p < 0.001.
VariableFixed EffectDFF-Valuep-Value
MIDElevation554.0300.012 *
Aspect555.0180.029 *
Elevation × Aspect552.500.069 †
Cambial age5508187.76<0.001 **
AVEElevation553.6420.018*
Aspect553.3800.071 †
Elevation × Aspect551.4930.227
Cambial age5508167.06<0.001 **
MXDElevation553.5920.019 *
Aspect551.4120.240
Elevation × Aspect552.3700.080 †
Cambial age550839.581<0.001 **
Table 3. Comparison of empirical cumulative distribution functions (CDF) between two periods (<1950 and >1950) for tree-ring wood density variables according to Kolmogorov–Smirnov tests.
Tree-Ring Wood Density VariableTláloc (TLA)
<1950 vs. >1950
Jocotitlán (JOC)
<1950 vs. >1950
Minimum earlywood densityNull hypothesisp-valueNull hypothesisp-value
Equal 1Rejected<0.001Rejected0.005
Larger 2Not rejected0.11Not rejected0.07
Smaller 3Rejected<0.001Rejected0.002
Average density
Equal 1Rejected<0.001Rejected0.01
Larger 2Not rejected0.71Not rejected0.81
Smaller 3Rejected<0.001Rejected0.006
Maximum latewood density
Equal 1Rejected<0.001Rejected<0.001
Larger 2Rejected<0.001Not rejected0.22
Smaller 3Not rejected0.24Rejected<0.001
1 Ho: The CDF’s come from the same distribution. 2 Ho: The CDF of <1950 is not less than CDF of >1950. 3 Ho: The CDF of <1950 is not greater than CDF of >1950.

