Article

Single-Molecule Real-Time Sequencing of the Madhuca pasquieri (Dubard) Lam. Transcriptome Reveals the Diversity of Full-Length Transcripts

College of Forestry and Landscape Architecture, South China Agricultural University, Guangzhou 510642, China
*
Author to whom correspondence should be addressed.
Forests 2020, 11(8), 866; https://doi.org/10.3390/f11080866
Submission received: 18 June 2020 / Revised: 2 August 2020 / Accepted: 6 August 2020 / Published: 8 August 2020
(This article belongs to the Section Forest Ecophysiology and Biology)

Abstract

:
Madhuca pasquieri (Dubard) Lam. is a tree on the International Union for Conservation of Nature Red List and a national key protected wild plant (II) of China, known for its seed oil and timber. However, lacking of genomic and transcriptome data for this species hampers study of its reproduction, utilization, and conservation. Here, single-molecule long-read sequencing (PacBio) and next-generation sequencing (Illumina) were combined to obtain the transcriptome from five developmental stages of M. pasquieri. Overall, 25,339 transcript isoforms were detected by PacBio, including 24,492 coding sequences (CDSs), 9440 simple sequence repeats (SSRs), 149 long non-coding RNAs (lncRNAs), and 182 alternative splicing (AS) events, a majority was retained intron (RI). A further 1058 transcripts were identified as transcriptional factors (TFs) from 51 TF families. PacBio recovered more full-length transcript isoforms with a longer length, and a higher expression level, whereas larger number of transcripts (124,405) was captured in de novo from Illumina. Using Nr, Swissprot, KOG, and KEGG databases, 24,405 transcripts (96.31%) were annotated by PacBio. Functional annotation revealed a role for the auxin, abscisic acid, gibberellin, and cytokinine metabolic pathways in seed germination and post-germination. These findings support further studies on seed germination mechanism and genome of M. pasquieri, and better protection of this endangered species.

1. Introduction

Madhuca pasquieri (Dubard) Lam., a member of the Sapotaceae family, is considered a vulnerable (VU) species on the International Union for Conservation of Nature (IUCN) Red List, and in China, is listed as a national key protected wild plant (II) and wild plant of extremely small population. This tree is endemic to southwest Guangdong, southern Guangxi, and southeast Yunnan, China, and usually grows in mixed forests or mountain forest margins at elevations below 1100 m. The oil content of M. pasquieri seeds can reach approximately 30%. In addition, it is a precious timber species, with a basic density of 0.711 and an air-dry density of 0.893, which is often used for its strength, wear resistance, when used for equipment or furniture, and in veneer manufacturing. The whole M. pasquieri plant is rich in latex; its bark contains tannin, which can be extracted for hard rubber and rubber. However, we previously showed that understory seedlings of M. pasquieri are rare, and its native habitat is fragmented or lost due to excessive logging and digging, which affects regeneration (including seed germination, seedling survival, and growth) of the wild M. pasquieri community. To date, few studies have investigated the in-situ protection, ex-situ protection, chemical composition, and artificial cultivation of this species; however, such studies remain in the preliminary stage, and data from long-term follow-up are lacking. Moreover, a lack of genomic and high-quality transcriptome information acts as a barrier to the development of in-depth molecular studies, preventing a comprehensive exploration of the plant’s value.
Knowledge on the transcriptome, which comprises all RNA transcripts produced by the genome, is vital for understanding the relationship between genotype and phenotype [1]. Next-generation high-throughput sequencing (NGS) technology, also known as second-generation sequencing, is a revolutionary tool that aims to better understand differential gene expression and regulatory mechanisms due to its lower costs and greater sequencing depth compared with first-generation Sanger sequencing technology [2]. This approach requires no strict reference genome sequence [3]; therefore, it is suitable for model species, such as Arabidopsis (Arabidopsis pumila [Steph.] N. Busch) [4] and rice (Oryza sativa L.) [5], or non-model species, such as sugarcane (Saccharum officinarum L.) [6] and Nothapodytes nimmoniana (Graham) Mabb [7]. Transcriptome sequences obtained by NGS have been important for capturing diversity in RNA populations at a high sequencing depth [8]. However, incomplete and low-quality transcripts are a major limitation in NGS short-read sequencing, which makes it difficult to analyze alternative splicing (AS) variants and to correct annotation [9]. Single-molecule real-time (SMRT) sequencing, developed by Pacific Biosciences (PacBio, Menlo Park, CA, USA), enables long-read or full-length (FL) transcriptomes to be obtained without assembly, permitting the collection of large-scale long-read transcripts with complete coding sequences, and the subsequent characterization of gene families [10,11]. FL transcripts can significantly improve the accuracy of genome annotation and transcriptome information [12]. Thus, the PacBio platform provides a user-friendly and accurate technique that can be used for gene annotation [13], novel gene and isoform identification [14], AS identification [15], and long non-coding RNA (lncRNA) discovery [16]. For example, RNA-Seq was able to map up to 85.94% of the castor (Ricinus communis) genome to the reference genome; however, using PacBio, 22.71% of the transcripts were completely or partially mapped to the reference genome, and nearly 62% of those might be new transcripts of known genes. This indicates that the information content of the genome covered by SMRT sequencing is greater than that of the known genome [11]. Using PacBio transcriptome sequencing, 30,591 transcripts were identified in ramie (Boehmeria nivea L. Gaud), with an average length of 2629 bp, 91.1% of which were functionally annotated. Compared with previous studies, PacBio significantly improved the length and number of annotated transcripts, further demonstrating the advantage of PacBio in transcriptome sequencing [17]. So far, no report has been found about the application of SMRT technology in a plant species from the family Sapotaceae.
Although PacBio reads are longer than Illumina reads, PacBio provides inaccurate isoforms on genes and less coverage of genes, leading to a high error rate [18]; this can be corrected using Illumina RNA-Seq reads and circular consensus sequence (CCS) reads [19]. In a study on the highly polyploid sugarcane, Illumina RNA-Seq was used to improve the PacBio transcript isoforms by short-read error correction. The results showed that the corrected PacBio dataset was more complete than the non-corrected dataset (CEGMA (Core eukaryotic genes mapping approach): 98 and 96%; BUSCO (Benchmarking universal single-copy orthologs): 90 and 87%, respectively) [20]. Recently, PacBio and Illumina have been combined to obtain comprehensive information, detect more gene isoforms, and determine functional variety on a transcriptional level. Thus, the genome database offers a scientific basis for species conservation and molecular breeding [21,22,23,24].
According to our previous investigation, we found that the seedlings of M. pasquieri in understory were very rare, and difficult to regenerate. Seed germination is the beginning of plant life cycle [25], and seed germination and post-germination directly affect the maintenance of the population and its quantity in time and space, which is particularly important for the protection of rare and endangered plants [26]. To evaluate seed germination and post-germination stages, and ensure wide coverage of transcript isoforms, M. pasquieri plants from five developmental stages, including seed germination, hypocotyl elongation, epicotyl elongation, two-leaf, and nine-leaf stages, were mixed for transcriptome analysis by SMRT. The PacBio Sequel platform has been used to generate comprehensive full-length transcriptome of M. pasquieri, and combined with Illumina platform to obtain a more complete transcriptome. In this study, Illumina RNA-Seq was used to correct short-read errors on SMRT transcripts obtained from PacBio, allowing differences to be compared between the two platforms. Then, we functionally annotated the full-length transcriptomes. Isoform analysis revealed the complexity of AS in M. pasquieri, and lncRNAs were also identified. Thus, we systematically characterized the complexity of the M. pasquieri transcriptome, as well as its structure and functional annotation. This in-depth characterization will provide a valuable tool for understanding the seed germination and growth mechanism of M. pasquieri and for future conservation purposes. Furthermore, this transcriptome provides basic data and important references for future studies on functional gene mining and utilization, genetic resource classification and evolution, and molecular marker development to promote the efficient and sustainable exploitation of this precious biological resource.

2. Materials and Methods

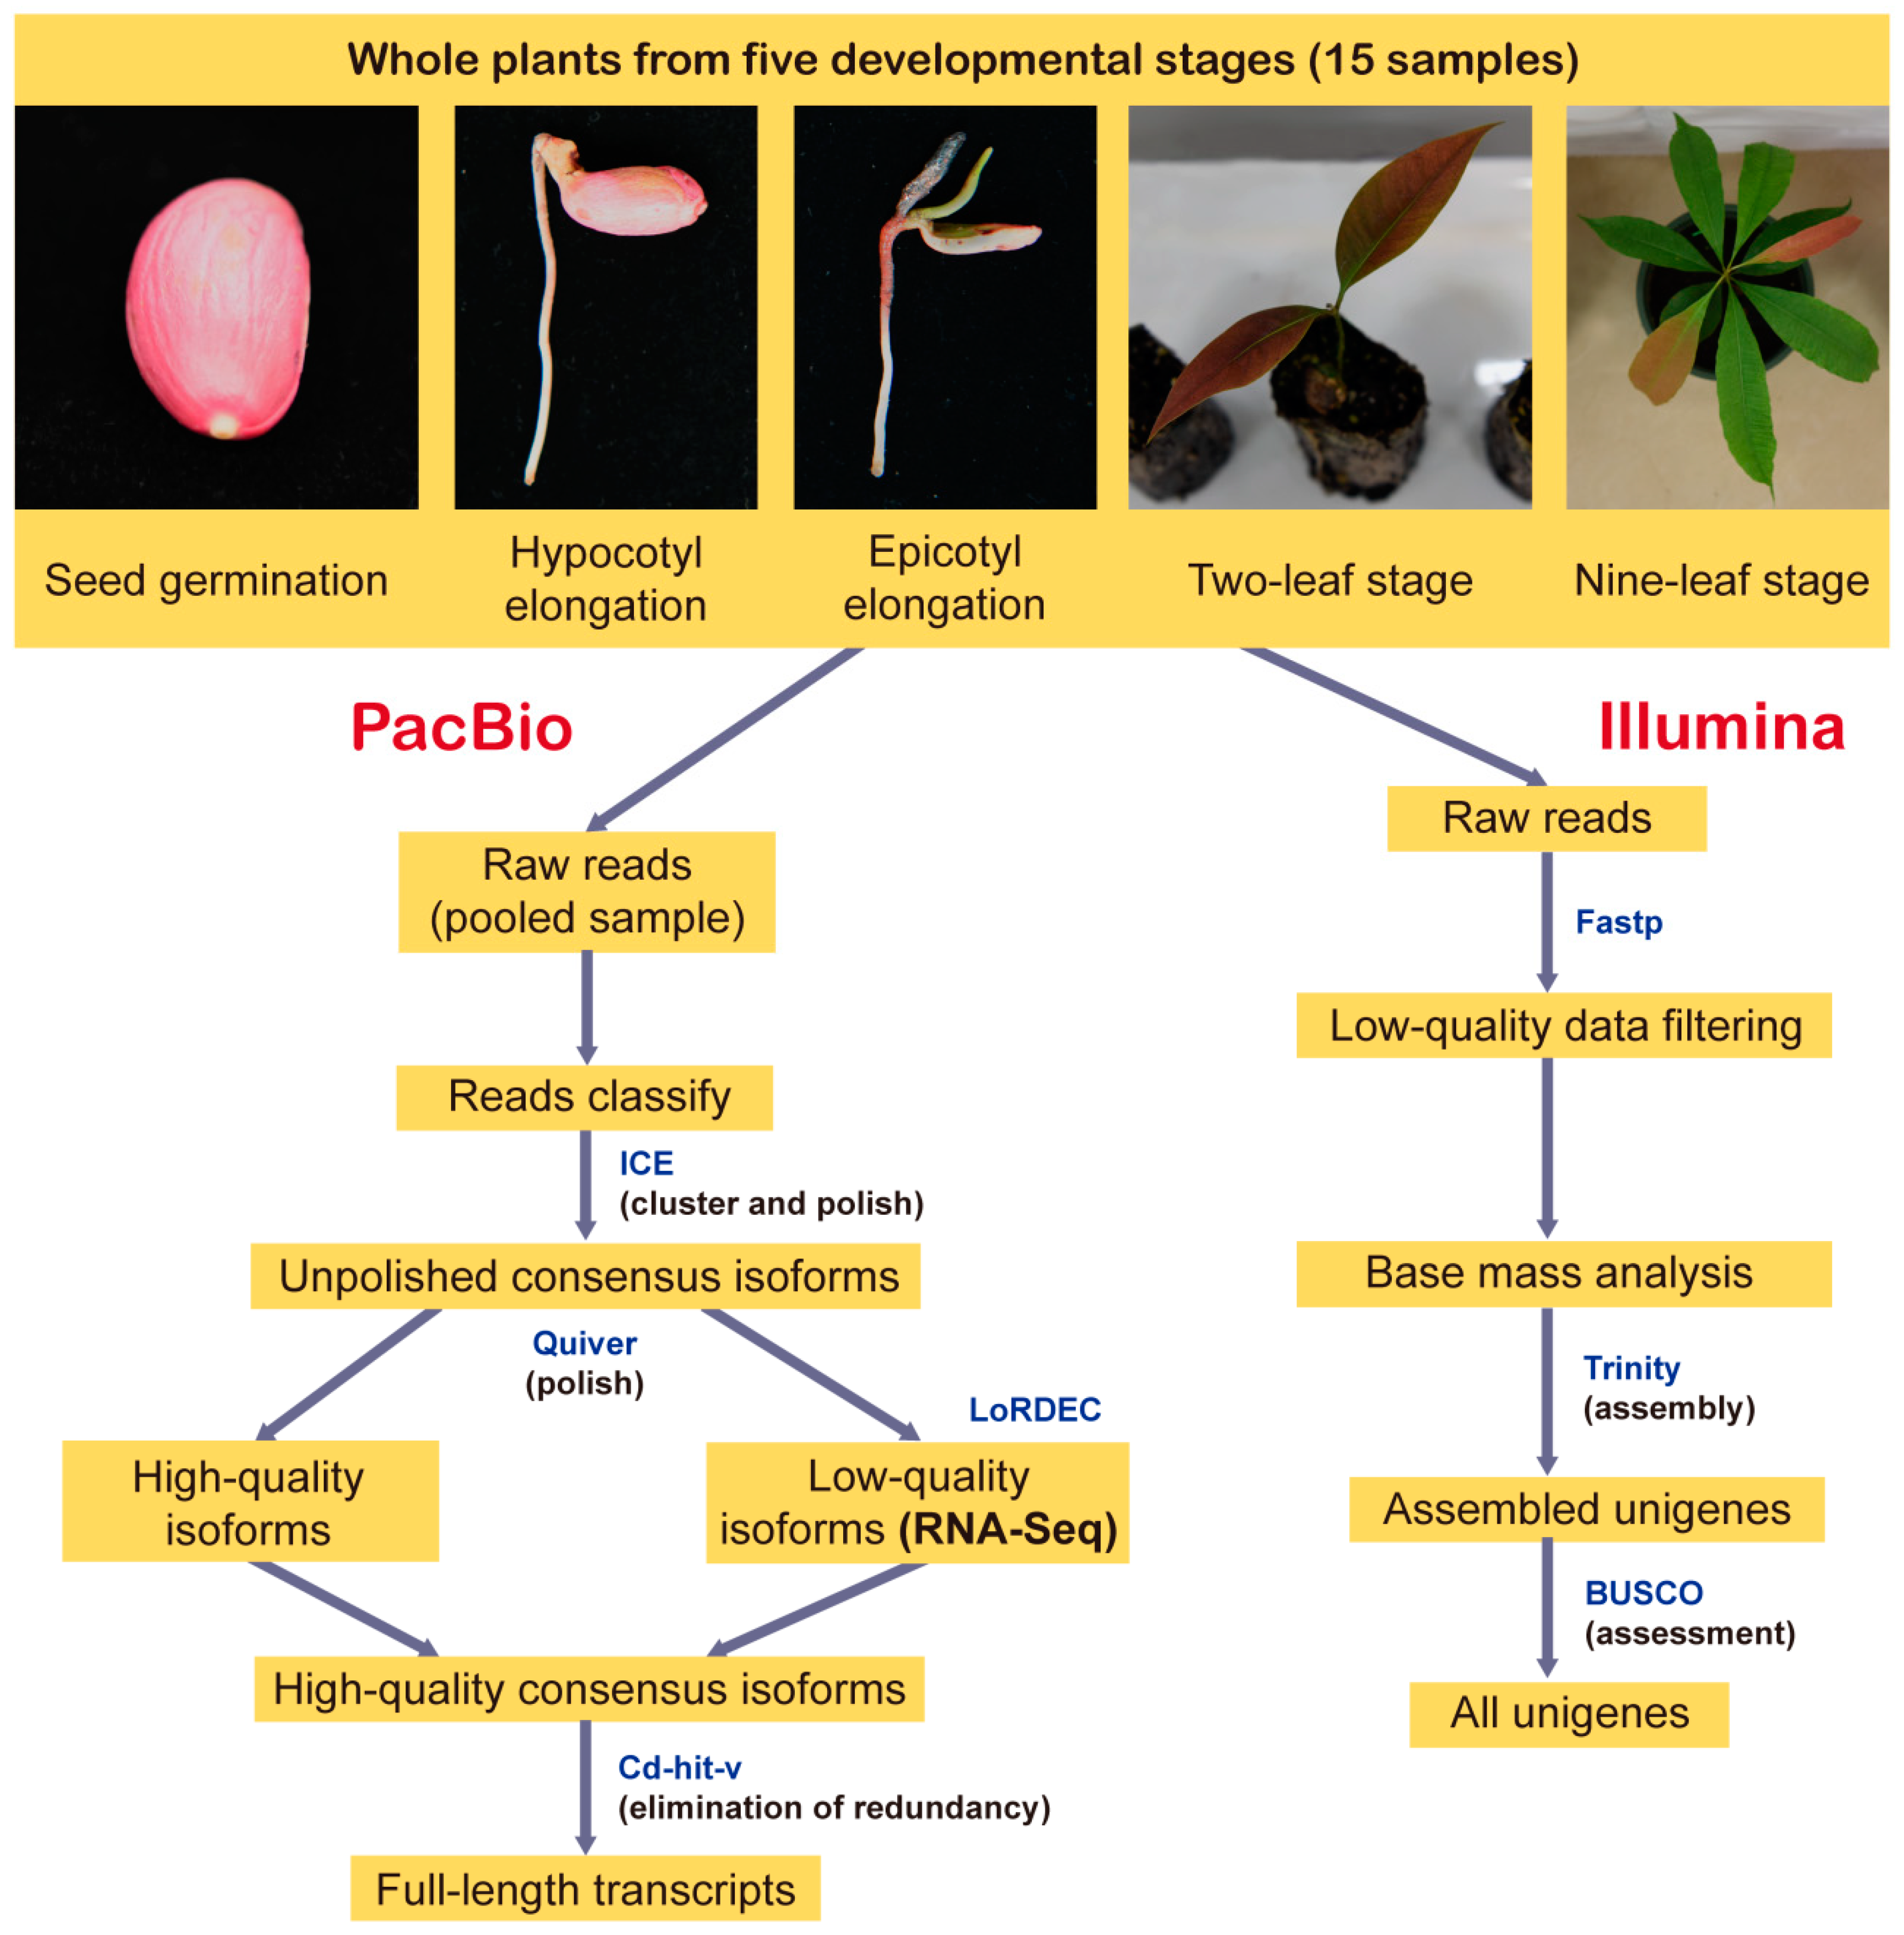
2.1. Plant Materials

M. pasquieri was grown in an artificial climate chamber, with a light cycle of 14 h/10 h (day/night), 17,600 lx, temperature 25 °C, and humidity of 60%–80%, at South China Agricultural University in China. During seed germination and post-germination growth, M. pasquieri plants were selected based on five developmental stages from the same batch of light matrix culture in the artificial climate chamber (seed germination, hypocotyl elongation, epicotyl elongation, two-leaf, and nine-leaf stages; Figure 1), with three biological replicates per stage. Collected samples were snap frozen in liquid nitrogen and stored at −80 °C until use.

2.2. Library Construction and SMRT Sequencing

Total M. pasquieri plants from five developmental stages, with three biological replicates per stage, were pooled. Total RNA was extracted by grinding tissue in TRIzol reagent (Life Technologies, Carlsbad, CA, USA) on dry ice and processed following the manufacturer’s protocol. RNA integrity was determined using the Agilent 2100 Bioanalyzer and agarose gel electrophoresis. RNA purity and concentration were determined via a Nanodrop micro-spectrophotometer (Thermo Fisher Scientific, Wilmington, DE, USA). mRNA was enriched by Oligo (dT) magnetic beads, and then reverse-transcribed into cDNA using the Clontech SMARTer PCR cDNA Synthesis Kit (Clontech Laboratories, CA, USA). The PCR program was optimized to determine the optimal number of amplification cycles for the downstream large-scale PCR. Then, the optimized cycle number was used to generate double-stranded cDNA. In addition, cDNA of >4 kb was selected using the BluePippinTM Size Selection System (Sage Science, Beverly, MA, USA) and mixed equally with the no-size-selection cDNA. Large-scale PCR was also performed to construct the next SMRTbell library. cDNA underwent DNA-damage repair, end-repair, and was ligated to sequencing adapters. The SMRTbell template was annealed to a sequencing primer, bound to a polymerase, and sequenced on the PacBio Sequel platform using P6-C6 chemistry with 10 h movies.

2.3. Analysis of SMRT Sequencing Data

The raw sequencing reads of cDNA libraries were classified and clustered into a transcript consensus using the SMRT Link v5.0.1 pipeline supported by Pacific Biosciences. CCS reads were extracted from subreads BAM files and then were classified as FL non-chimeric, non-full-length (nFL), chimeras, or short reads based on cDNA primers and the polyA tail signal. Short reads were discarded. Subsequently, the full-length non-chimeric (FLNC) reads were clustered by Iterative Clustering for Error Correction (ICE) software to generate the cluster consensus isoforms. To improve the accuracy of PacBio reads, two strategies were employed: (1) the nFL reads were used to polish the obtained cluster consensus isoforms by Quiver software to attain FL polished high-quality consensus sequences (accuracy ≥ 99%). (2) The LoRDEC tool (version 0.8) was used to further correct the low-quality isoforms using Illumina short reads obtained from the same samples. Then, the final transcriptome isoform sequences were filtered by removing redundant sequences using the software CD-HIT-v4.6.7 with a threshold of 0.99 identities (Figure 1).

2.4. Illumina RNA Sequencing and De Novo Assembly of Short Reads

M. pasquieri plants sampled at five developmental stages, with three biological replicates per stage, were each used for Illumina RNA sequencing. After total RNA was extracted, eukaryotic mRNA with a polyA tail was enriched by Oligo (dT) beads, and then the enriched mRNA was fragmented into short fragments by ultrasonic waves and reverse-transcribed into cDNA using random primers. Second-strand cDNA was synthesized by DNA polymerase I, RNase H, dNTP, and buffer (New England Biolabs, Ipswich, MA, USA). Next, the cDNA fragments were purified using a QiaQuick PCR extraction kit (Qiagen, Düsseldorf, GER) end-repaired, the polyA was added, and the fragments were then ligated to Illumina sequencing adapters. The ligation products were size-selected by agarose gel electrophoresis, amplified by PCR, and sequenced using Illumina HiSeqTM 4000. SMRT sequencing and Illumina RNA sequencing were performed by Gene Denovo Biotechnology Company (Guangzhou, China).
Reads obtained from the sequencing machines included raw reads containing adapters or low-quality bases, which affect subsequent assembly and analysis. Thus, high-quality clean reads were obtained by further filtering according to the following rules: (1) removal of reads containing adapters; (2) removal of reads containing more than 10% of unknown nucleotides (N); (3) removal of reads containing all A bases; (4) removal of low-quality reads containing more than 50% low-quality (Q-value ≤ 20) bases. After filtering the data, base composition and mass distribution were analyzed to visualize data quality. The more balanced the base composition, the higher the quality, and the more accurate the subsequent analysis will be. Then, Trinity v2.8.4 software was used to assemble reads (Figure 1), and the quality of the assembly could be evaluated from the N50 value.

2.5. Evaluation of Sequencing Results

The protein sequences predicted from two sequencing results were analyzed using BUSCO v3 i to determine the completeness of the conserved content in the transcriptome. The percentage of transcripts that fully aligned (≥70%) and partially aligned to the conserved proteins, as well as the percentage missing proteins were determined and compared.

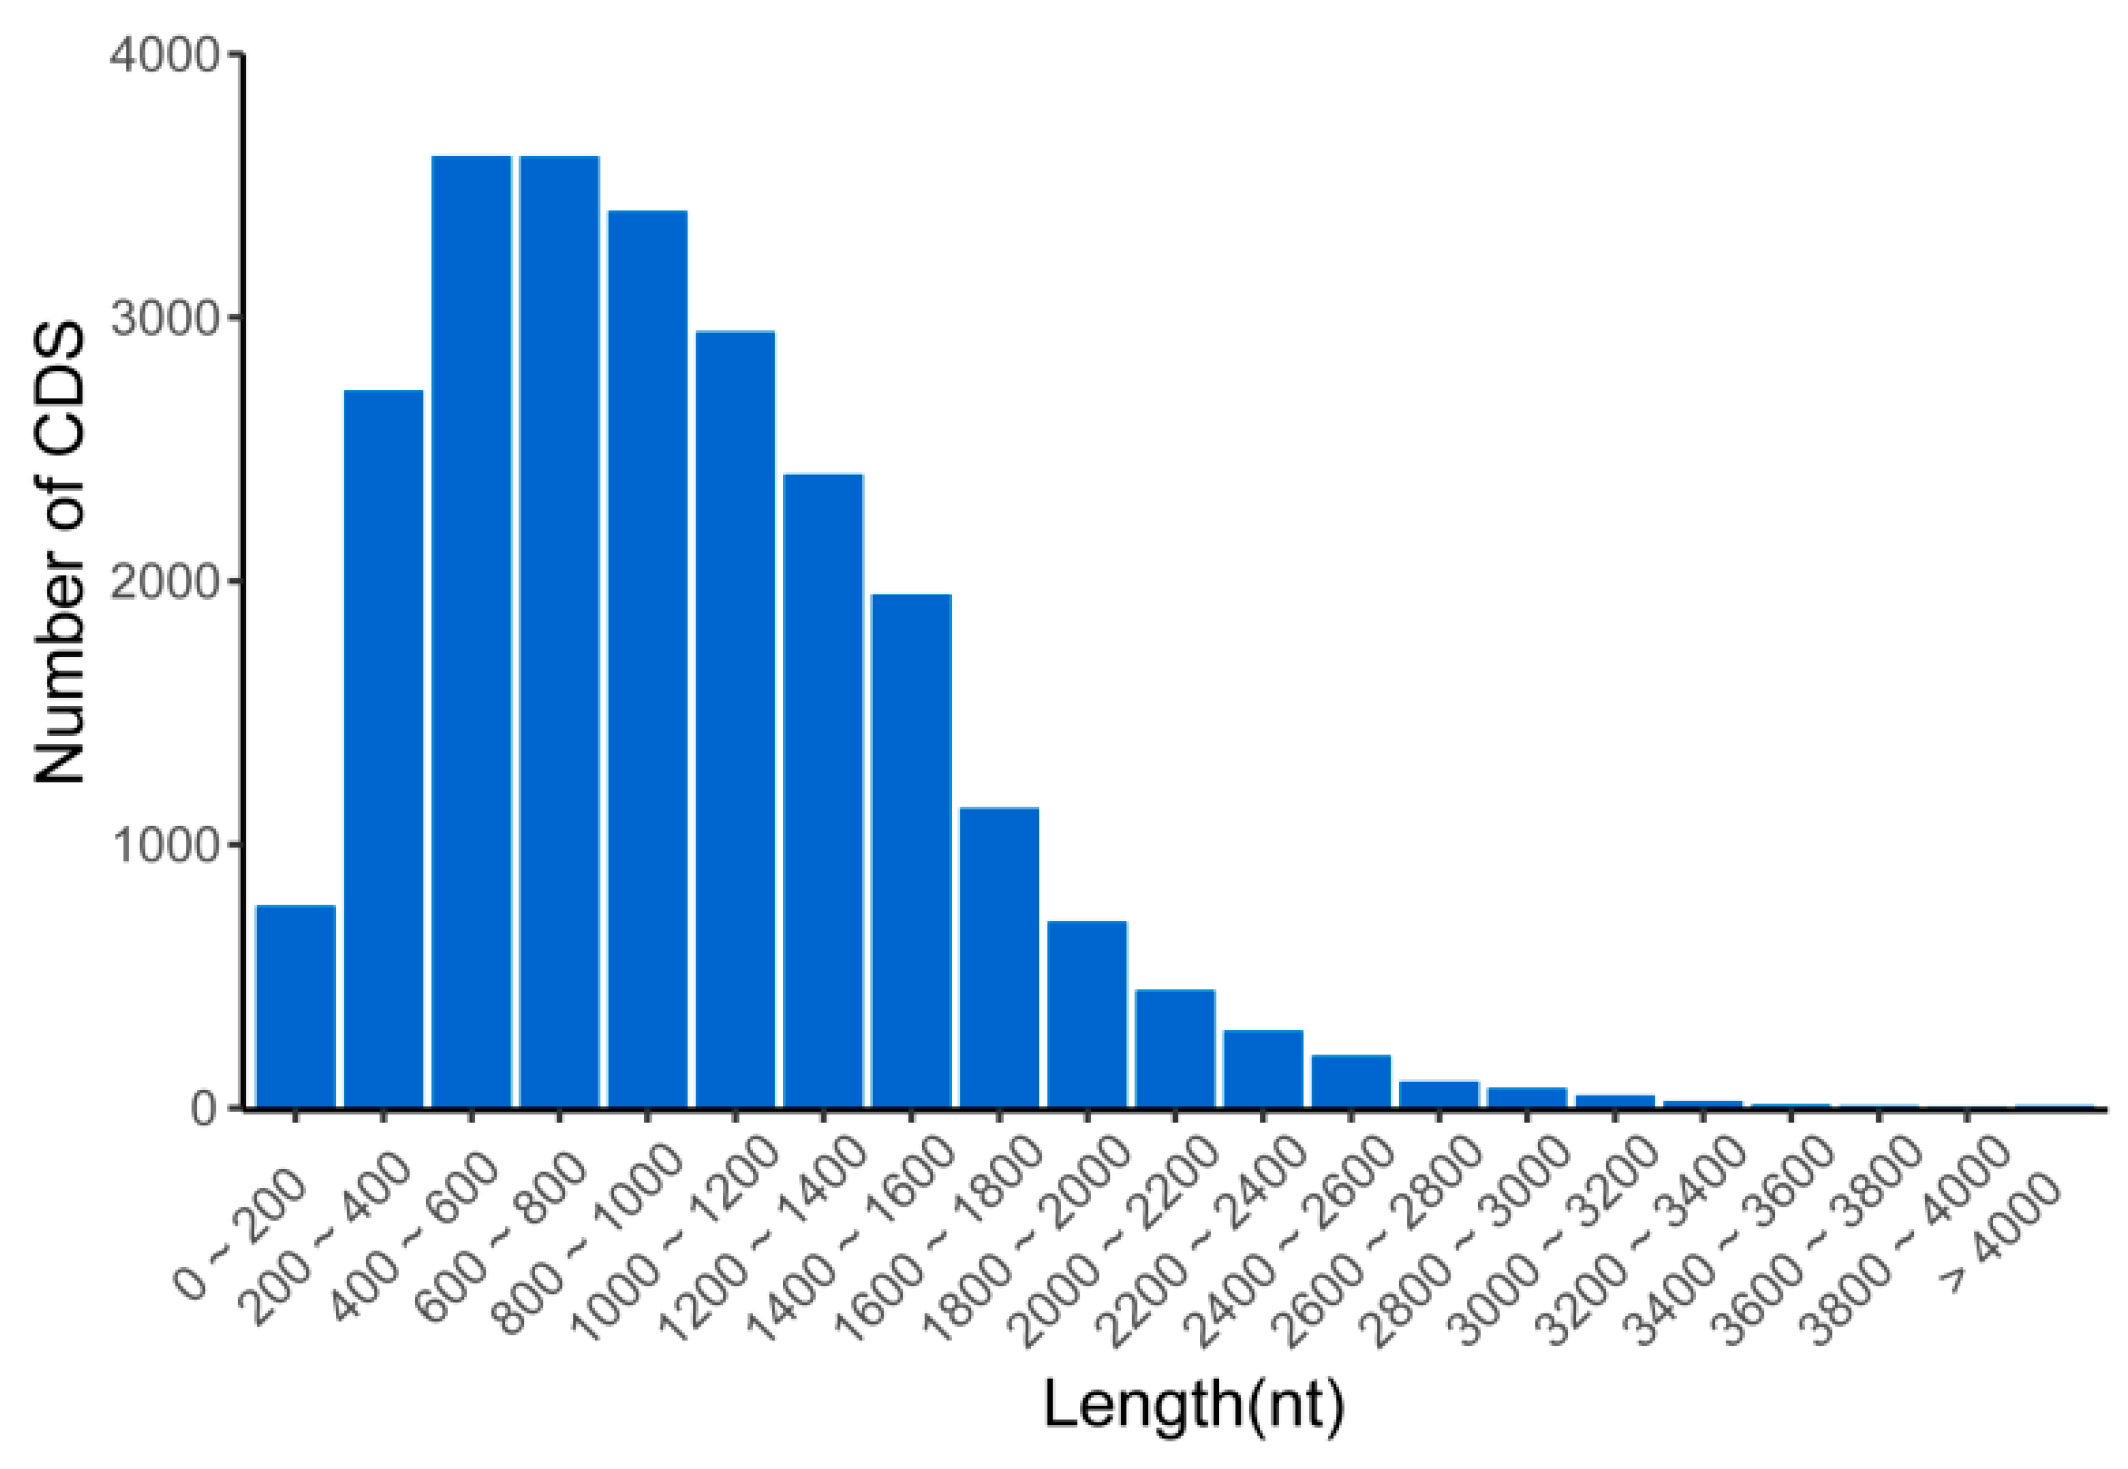
2.6. Prediction of Coding Sequences (CDSs), Simple Sequence Repeats (SSRs), and Transcription Factors (TFs)

Open reading frames (ORFs) in the isoform sequences were detected using ANGEL software in order to determine the CDSs, protein sequences, and untranslated region (UTR) sequences.
SSR prediction was analyzed using the MISA (version 1) software (http://pgrc.ipk-gatersleben.de/misa/) 64 with default parameters in the whole transcriptome. Based on the MISA results, Primer 1.1.4 was used to design primer pairs specific for the flanking regions of SSRs for subsequent validation.
Protein coding sequences of isoforms were aligned by hmmscan to Plant TFdb (http://planttfdb.cbi.pku.edu.cn/) or Animal TFdb (http://www.bioguo.org/AnimalTFdb/) to predict TF families.

2.7. Characterization of AS Events

To analyze AS events of transcript isoforms, the COding GENome reconstruction Tool (Cogent) was first used to partition transcripts into gene families based on k-mer similarity, and to reconstruct each family into a coding reference genome based on De Bruijn graph methods. Then, the SUPPA tool was used to analyze AS events of transcript isoforms. Five major types of AS events, namely A3 (alternative 3′ splice sites), A5 (alternative 5′ splice sites), AF (alternative first exon), RI (retained intron), and SE (skipping exons), were extracted from the output files and counted.

2.8. LncRNA Identification from PacBio Sequences

CNCI (version 2), CPAT, CPC (version 1), and Pfam were used to assess the protein-coding potential of transcripts without annotations by default parameters for potential lncRNAs. To better annotate lncRNAs on an evolutionary level, the software Infernal (http://eddylab.org/infernal/) was used for sequence alignment. LncRNAs were classified based on their secondary structures and sequence conservation.

2.9. Functional Annotation

Corrected isoforms were analyzed by BLAST against the NCBI non-redundant protein (Nr) database (http://www.ncbi.nlm.nih.gov), the Swiss-Prot protein database (http://www.expasy.ch/sprot), the Kyoto Encyclopedia of Genes and Genomes (KEGG) database (http://www.genome.jp/kegg), and the COG/KOG database (http://www.ncbi.nlm.nih.gov/COG) using the BLASTx program (http://www.ncbi.nlm.nih.gov/BLAST/) at an E-value threshold of 1 × 10⁻⁵ to evaluate sequence similarity with genes of other species. Gene Ontology (GO) annotation was analyzed by Blast2GO software with Nr annotation results of isoforms. Isoforms with the top 20 highest scores, and no shorter than 33 high-scoring segment pair (HSP) hits were selected for Blast2GO analysis. Then, isoforms were functionally classified using WEGO software.

3. Results

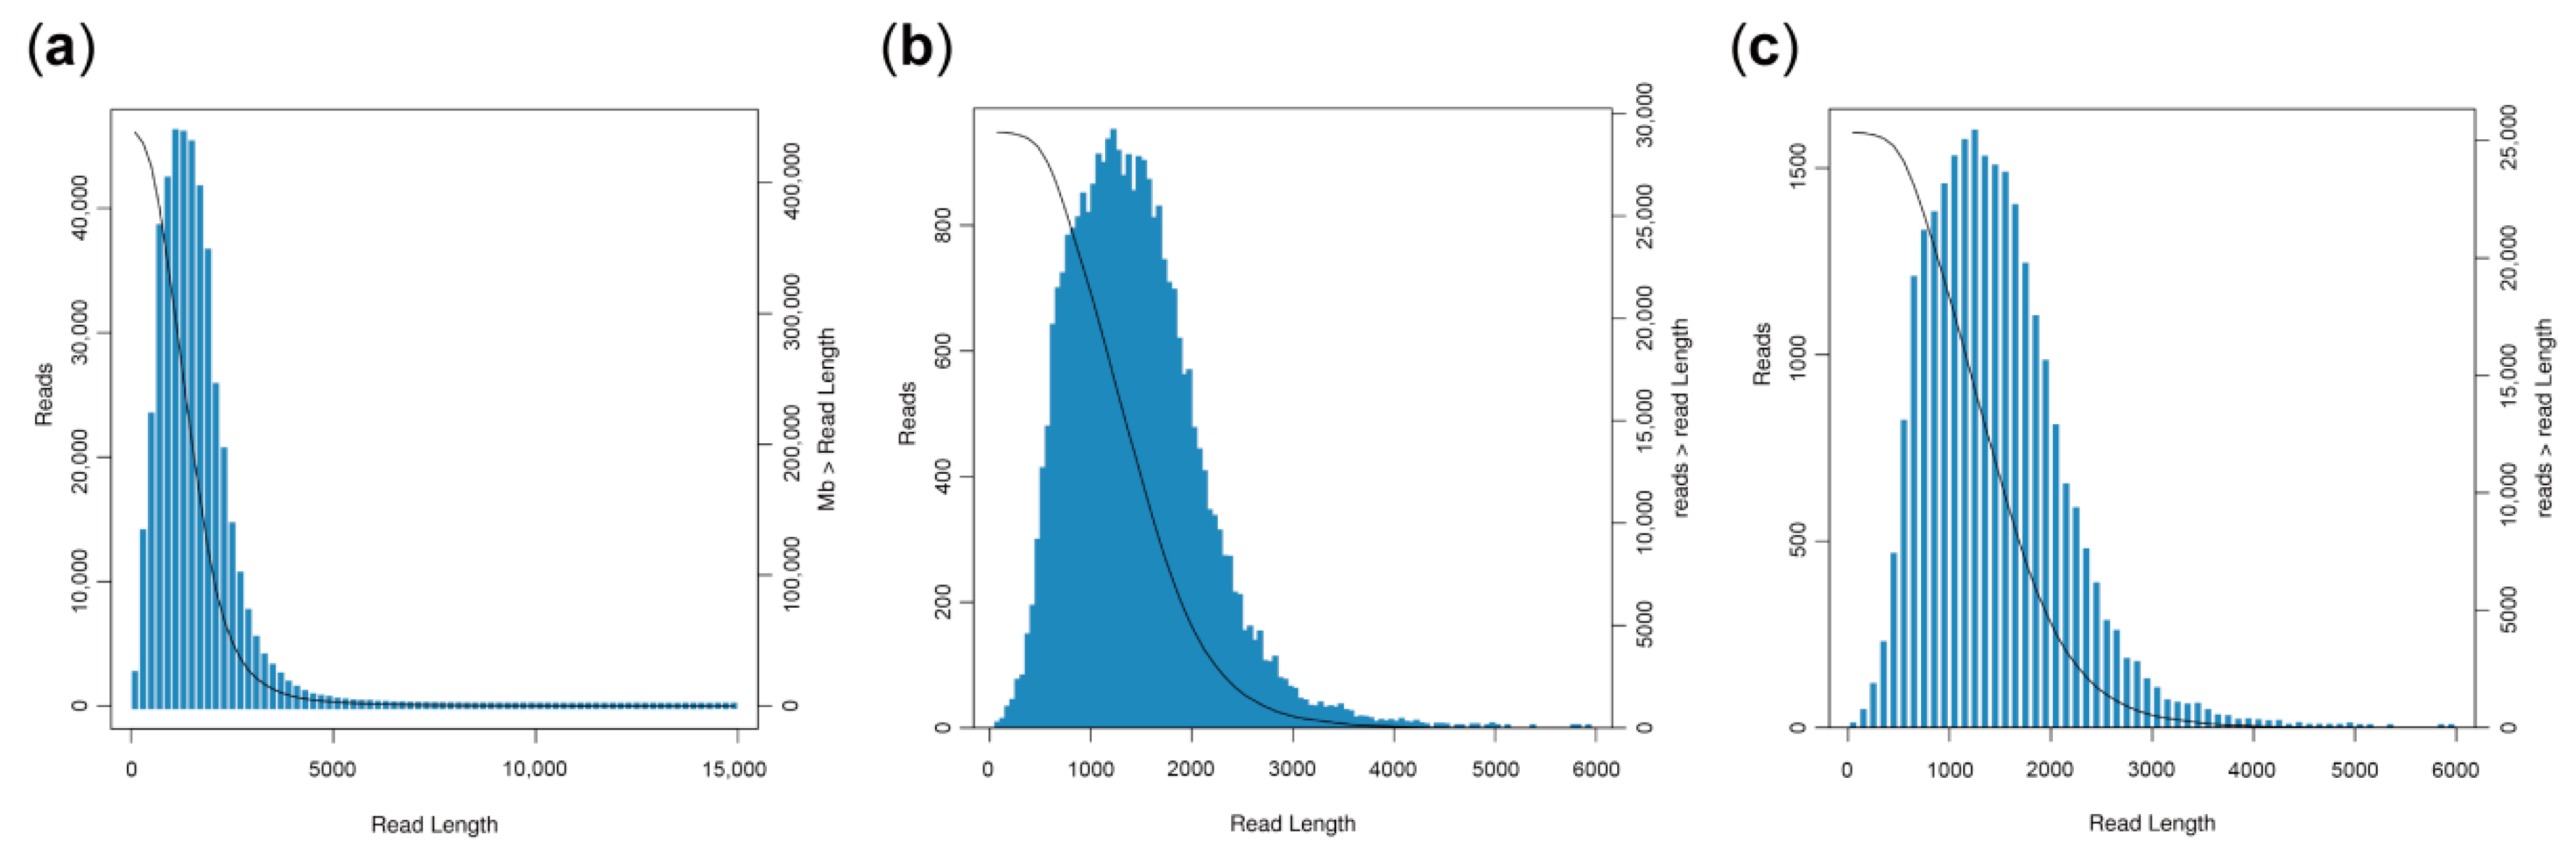
3.1. General Properties of Single-Molecule Long-Reads

In order to obtain M. pasquieri transcripts that were as complete as possible, high-quality total RNA was extracted from each pooled sample representing the five different developmental stages. Because PacBio Sequel does not screen fragments, a full library of samples was built. After filtering, 22,704,140 subreads were obtained, with a mean length of 1193 bp and a N50 of 1529 bp. A total of 438,795 CCSs with an average depth of nine passes were generated from subreads after merging and correcting errors by multiple sequencing. The length distribution of CCSs was consistent with the expected size (Figure 2a). Furthermore, ICE and Quiver algorithms were used to obtain 29,003 high-quality sequences and 85 low-quality sequences. The length distribution of consensus isoforms is shown in Figure 2b.

3.2. Acquisition of High-Quality Sequences and Error Correction of Long Reads Using Illumina Data

The basic error rate of the SMRT sequences was 12–15%, mainly due to the insertion of extra bases. Low-quality sequences obtained on the PacBio Sequel platform were corrected using Illumina RNA-Seq transcripts and LoRDEC (version 0.8). After polishing, low-quality sequences with polish coverage (percentage of bases corrected by the second-generation data in the third-generation consistent sequence) of more than 99% were combined with the high-quality sequences obtained by Quiver polish. Finally, 29,042 sequences were obtained, with a mean length of 1438.11 bp, a N50 of 1645 bp, and GC content of 44.59% (Table S1). Then, cd-hit-v4.6.7 software was used to remove redundant sequences from the high-quality consistent sequences in the library. Local alignment was adopted, where the alignment rate was 99% for shorter sequences and the number of bases unaligned was less than 30 bp. For longer sequences, the alignment rate was 90% and the number of bases unaligned was less than 100 bp. The final set of PacBio transcript isoforms contained 25,339 sequences, with a mean length of 1436.77 bp, a N50 of 1652 bp, and GC content of 44.39% (Table S1); the length distribution of these isoforms is shown in Figure 2c. Overall, correcting errors improved transcript prediction, with more transcripts covering the full-length of known proteins, and a longer N50, which is suitable for further structural and functional analysis. To assess the completeness of our transcriptome, BUSCO was used to evaluate the sequencing results and showed that 26.81% were complete and single-copy BUSCOs, 12.22% were complete and duplicated BUSCOs, 3.54% were fragmented BUSCOs, and 57.43% were missing BUSCOs (Figure S1).

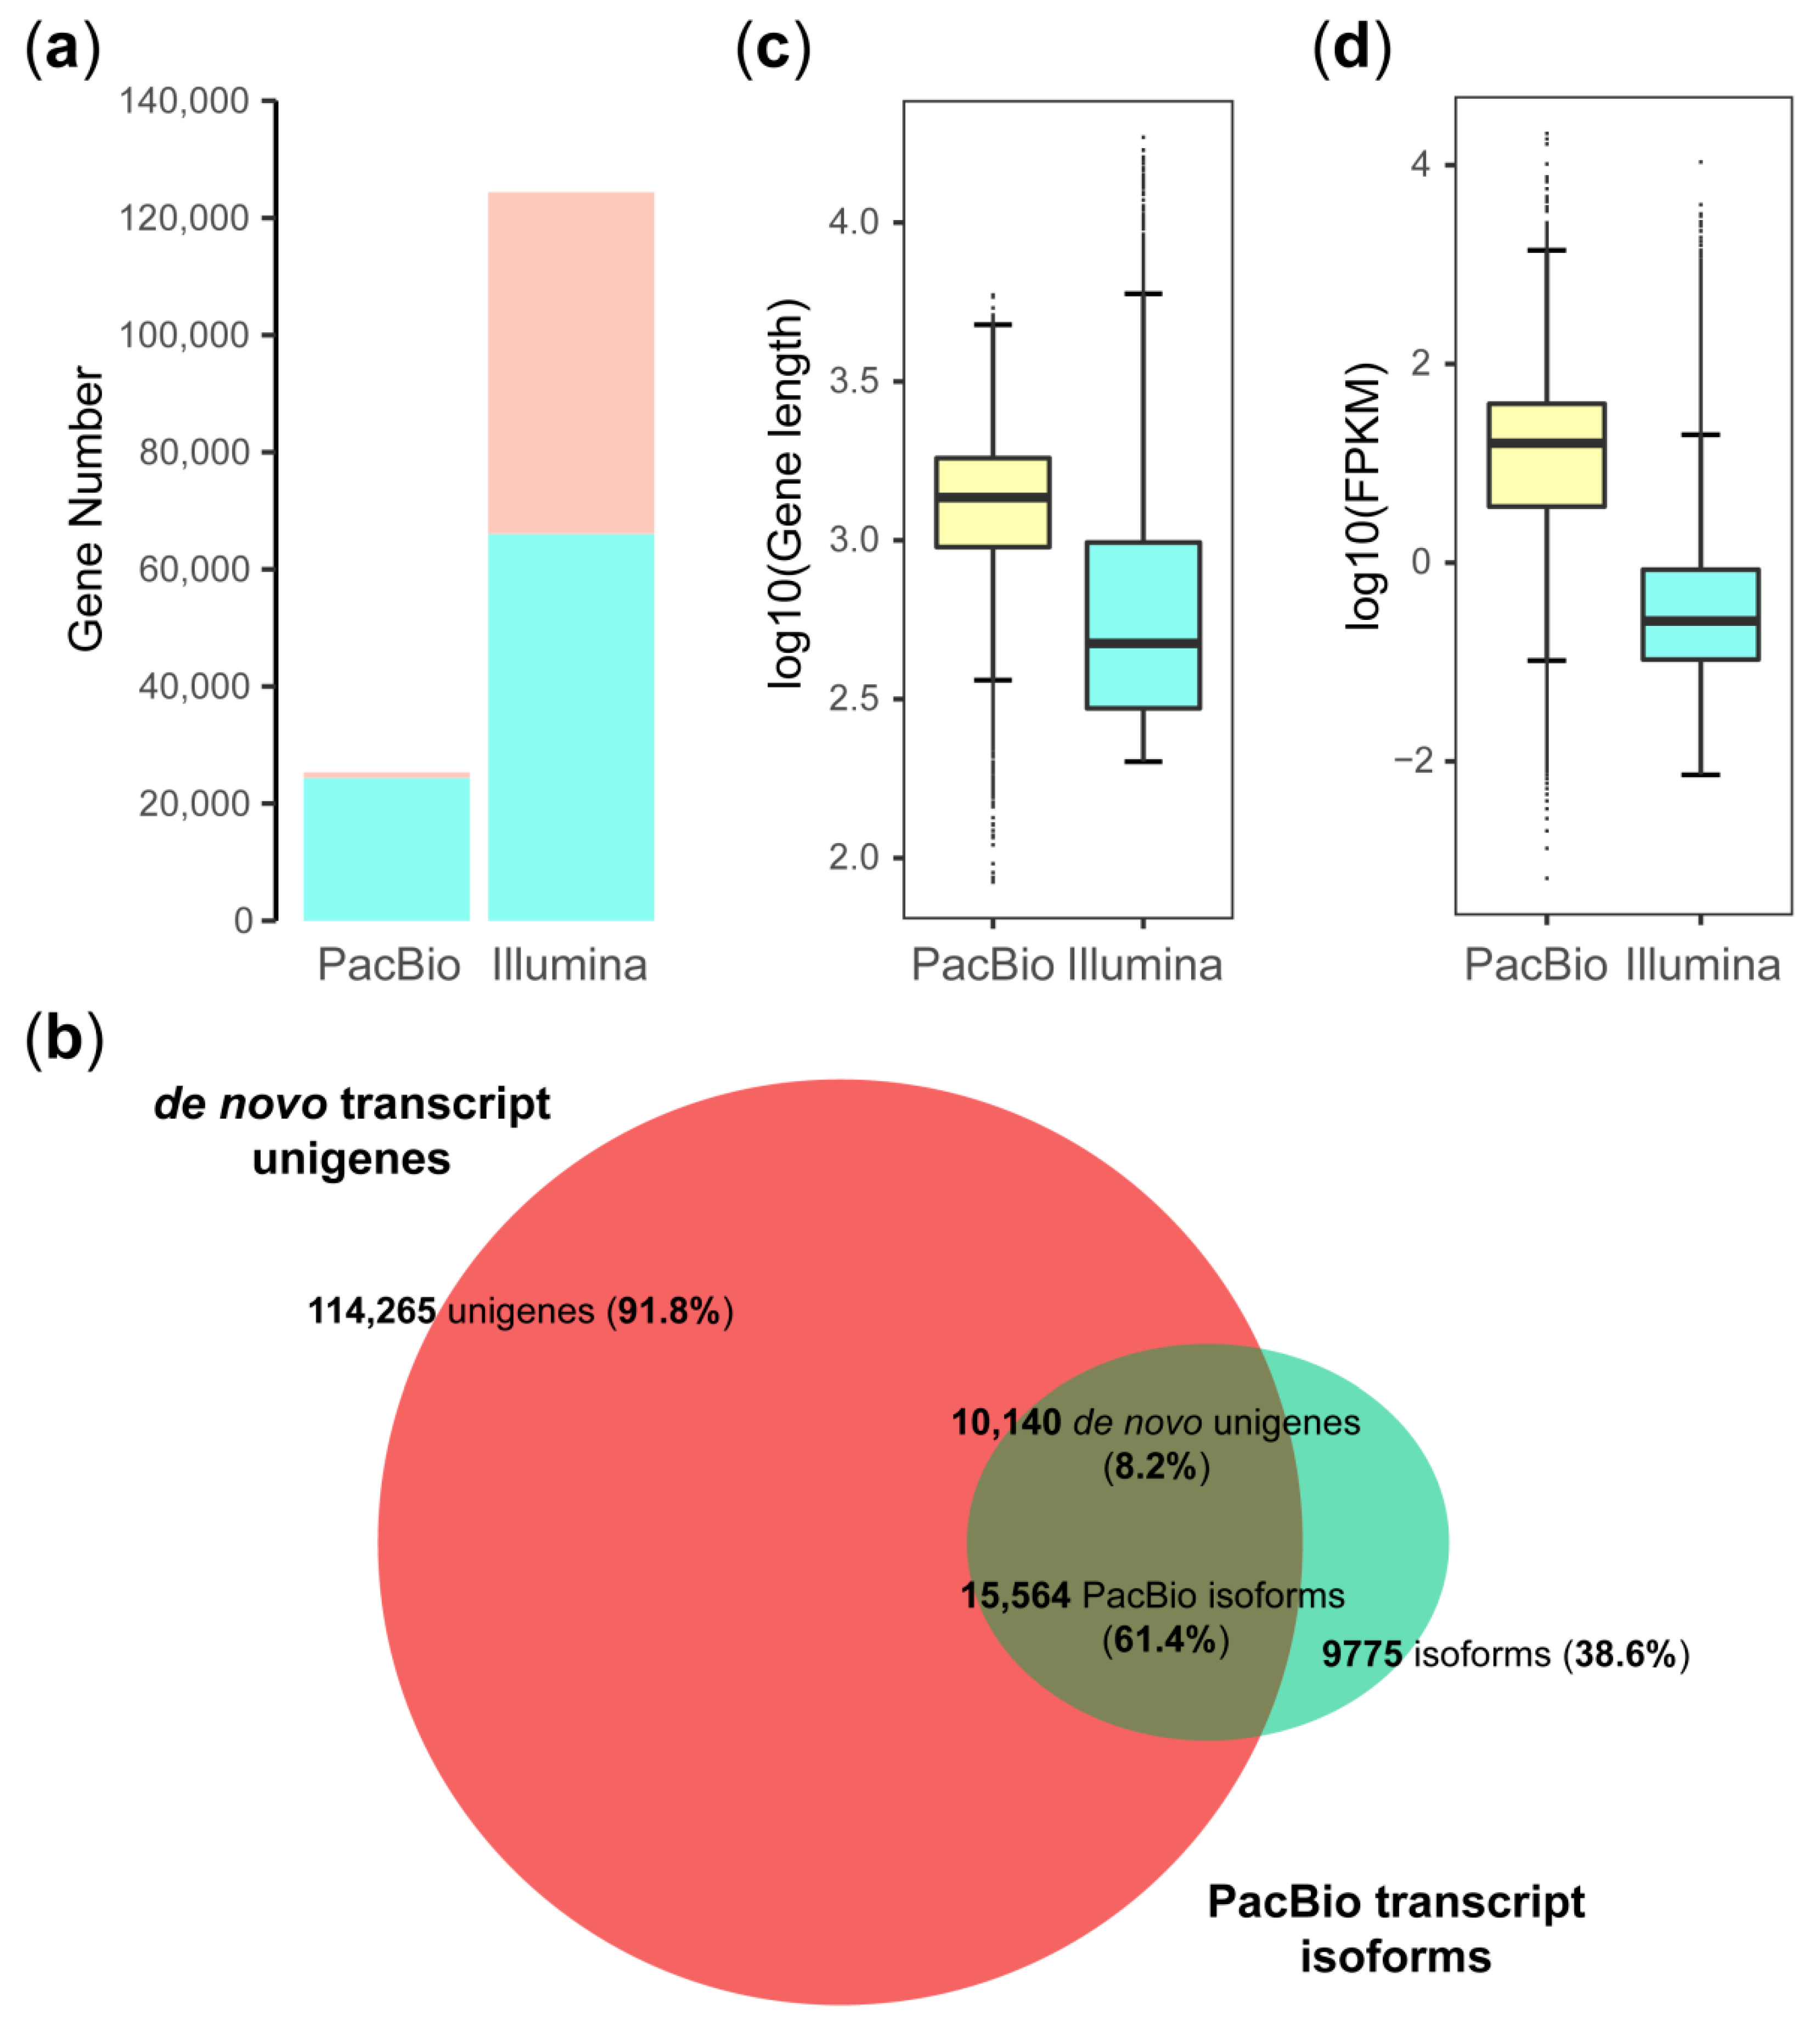
3.3. Comparison of PacBio and Illumina Transcripts and Sequencing Depth

De novo assembly has been used widely to construct transcriptomes without any reference sequence; therefore, the M. pasquieri transcriptome was assembled from Illumina short-reads to provide a comparative reference for the isoform transcript sequences obtained from PacBio Sequel. In this study, 15 samples were tested, generating an average of 45,627,996 raw reads. Then, fastp 0.18.0 was used to filter raw data and obtain clean reads (each sample > 99.5%, Table S2). After filtering, the base composition and mass distribution was analyzed to visualize data quality. The results showed that the Q20 and Q30 of each sample were both >90% and the GC content of each sample was >47% (Table S3), indicating the quality of data sequencing. Trinity v2.8.4 was used to assemble reads, resulting in 124,405 unigenes, with a mean length of 834 bp, a N50 of 1387 bp, and a GC content of 44.89% (Table S1). The length distribution of assembled unigenes is shown in Figure S2. BUSCO was then used to evaluate the sequencing results; there were 1035 (71.88%) complete and single-copy BUSCOs, 108 (7.5%) complete and duplicated BUSCOs, 170 (11.81%) fragmented BUSCOs, and 127 (8.82%) missing BUSCOs (Figure S1).
Compared to PacBio transcript isoforms, de novo assembly form Illumina detected more unigenes (124,405), as well as more annotated unigenes (66,026 de novo versus 24,405 PacBio) (Figure 3a and Figure S3). Of the annotated transcripts, 8.2% of the de novo transcript unigenes (10,140 unigenes) exhibited similarity to 61.4% of the PacBio transcript isoforms (15,564 isoforms) by BLASTN (e-value ≤ 1 × 10⁻²⁰, pairwise identity ≥ 75%, min bit score ≥ 100), and 114,265 (91.8%) de novo transcript unigenes, and 9775 (38.6%) PacBio transcript isoforms were specifically identified by each of the datasets (Figure 3b). Moreover, the de novo transcript unigenes from Illumina were expressed at low levels and were shorter than the PacBio transcript isoforms in SMRT (Figure 3c,d). In conclusion, these results indicated that although the SMRT sequencing depth was less than that of the Illumina platform, SMRT significantly improved the length and expression level of transcripts.

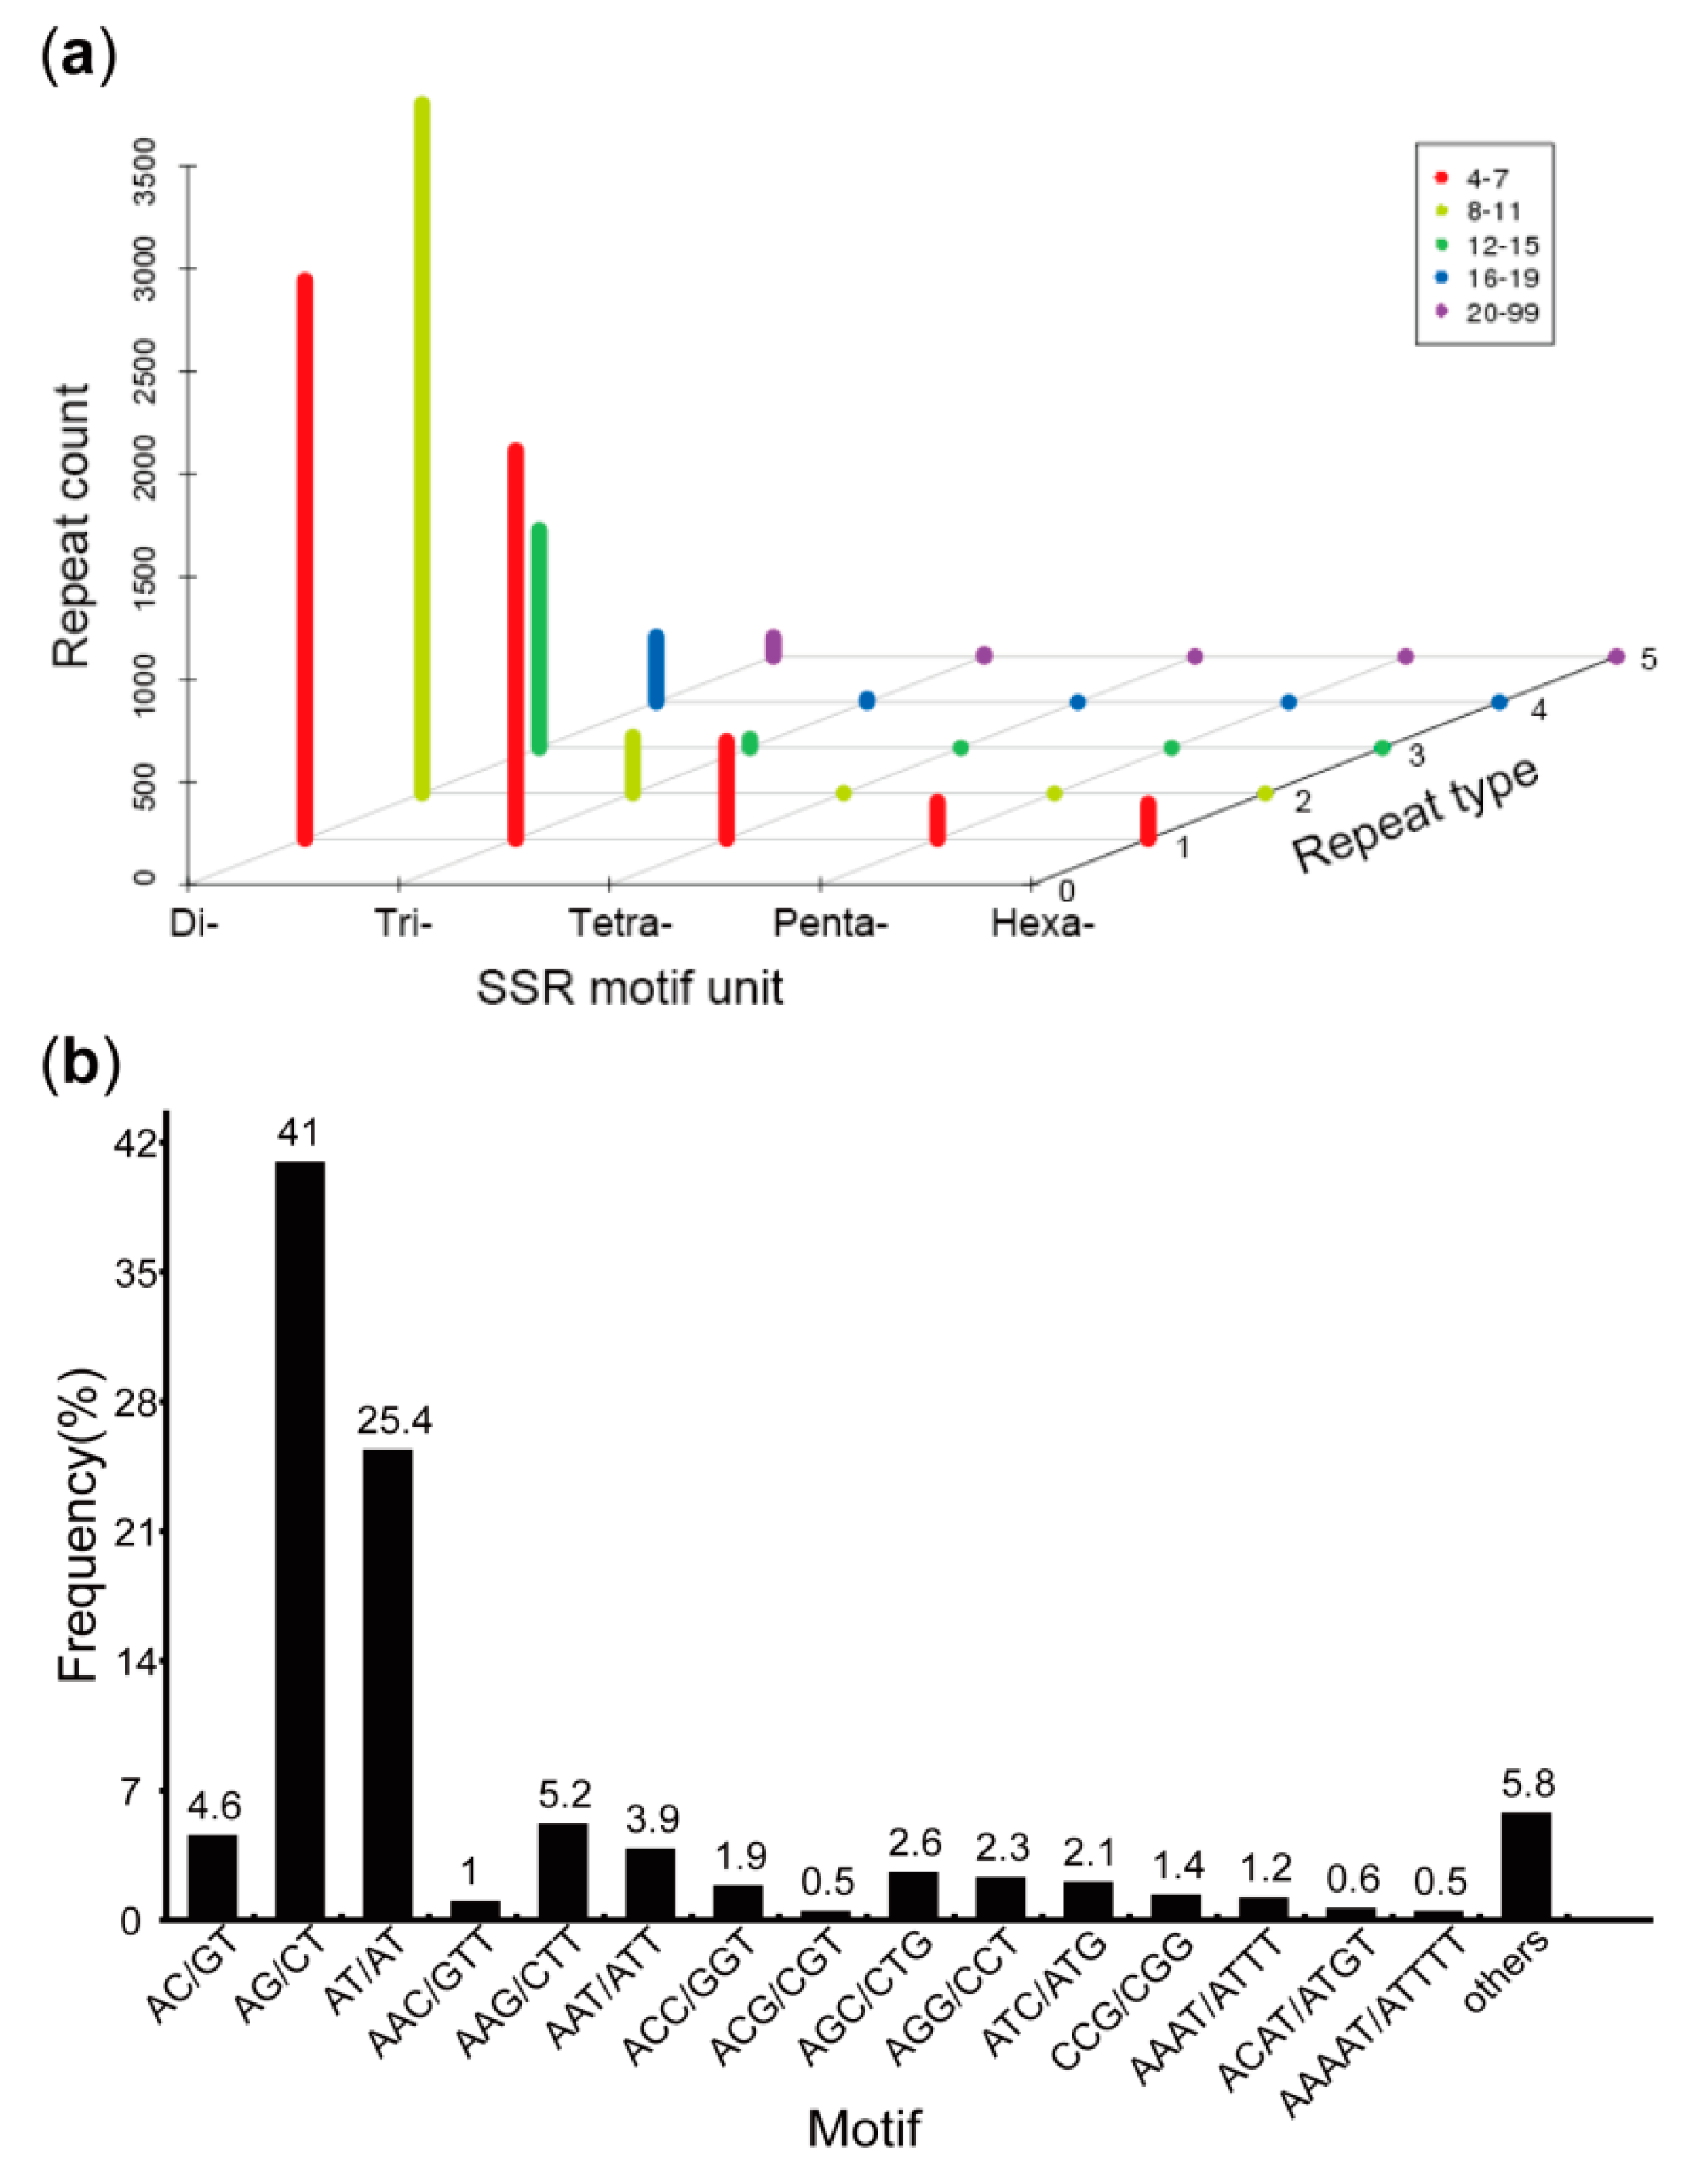
3.4. Prediction of CDSs, SSRs, and TFs

CDS is a sequence of protein products that correspond exactly to a protein codon. A total of 24,492 CDSs were predicted by PacBio Sequel, and the number and length distribution of proteins encoded by CDS regions are shown in Figure 4. Additionally, 65,297 CDSs were identified based on Illumina data; however, the mean length was less than that predicted by PacBio (Figure S4).
SSR markers can serve as useful tools for genetic diversity analysis, genetic linkage, evolutionary studies, and marker-assisted breeding in many species, especially endangered species, due to their abundance, highly polymorphic nature, co-dominant inheritance, and random distribution throughout the genome [27,28,29,30]. In this study, 9400 SSRs and 7819 SSR-containing sequences were detected across 25,339 transcripts from M. pasquieri. Of these, 1363 transcripts contained more than one SSR, and 1033 contained compound SSRs. Di-nucleotide repeat transcripts were the most frequent type (5269, 67.39%) with six to 30 repeats, followed by 1718 (21.97%) tri-nucleotide repeats transcripts with five to 24 repeats, 369 (4.72%) tetra-nucleotide repeats transcripts with four to eight repeats, 162 (2.07%) penta-nucleotide repeats, and 141 (1.80%) hexa-nucleotide repeats both with four to seven repeats (Figure 5a). Among the di-, tri-, and tetra-nucleotide repeats, the motifs were AC/GT, AAC/GTT, and AAAT/TTTA, respectively. Detailed information is shown in Figure 5b. A total of 18,070 SSRs and 15,444 SSR-containing sequences were detected across 124,405 unigenes. Di-nucleotide repeat unigenes were also the most frequent type (11,633), followed by 5105 tri-nucleotide repeats unigenes, 1081 tetra-nucleotide repeats unigenes, 451 penta-nucleotide repeats unigenes, and 326 hexa-nucleotide repeats unigenes (Table S4). In the di-, tri-, tetra- and penta-nucleotide repeats, the motif was AG/CT, AAG/CTT, AAAT/ATTT, and AAACC/GGTTT, respectively (Figure S5).
TFs play important roles in the regulation of plant growth and development [31]. We compared the predicted protein sequences with the corresponding TF database (plant TFdb/animal TFdb) for hmmscan. A total of 1058 transcripts were identified as TFs and classified into 51 TF families. The top 10 TF families were ERF (121, 11.44%), WRKY (96, 9.07%), GRAS (87, 8.22%), NAC (71, 6.71%), bHLH (70, 6.62%), C3H (68, 6.43%), bZIP (49, 4.63%), C2H2 (46, 4.35%), MYB_related (45, 4.25%), and TALE (38, 3.59%) (Table 1). Conversely, among the de novo transcript unigenes, we identified 2048 TFs from 57 TF families, among which HB-PHD, SRS, SAP, STAT, LFY and HRT-like families were specific. And C2H2 (241, 11.77%), bHLH (172, 8.40%), ERF (154, 7.52%), bZIP (141, 6.88%), MYB (124, 6.05%), NAC (99, 4.83%), GRAS (88, 4.30%), WRKY (83, 4.05%), MYB_related (82, 4.00%), and C3H (72, 3.52%) were the top 10 TF families (Table 1).

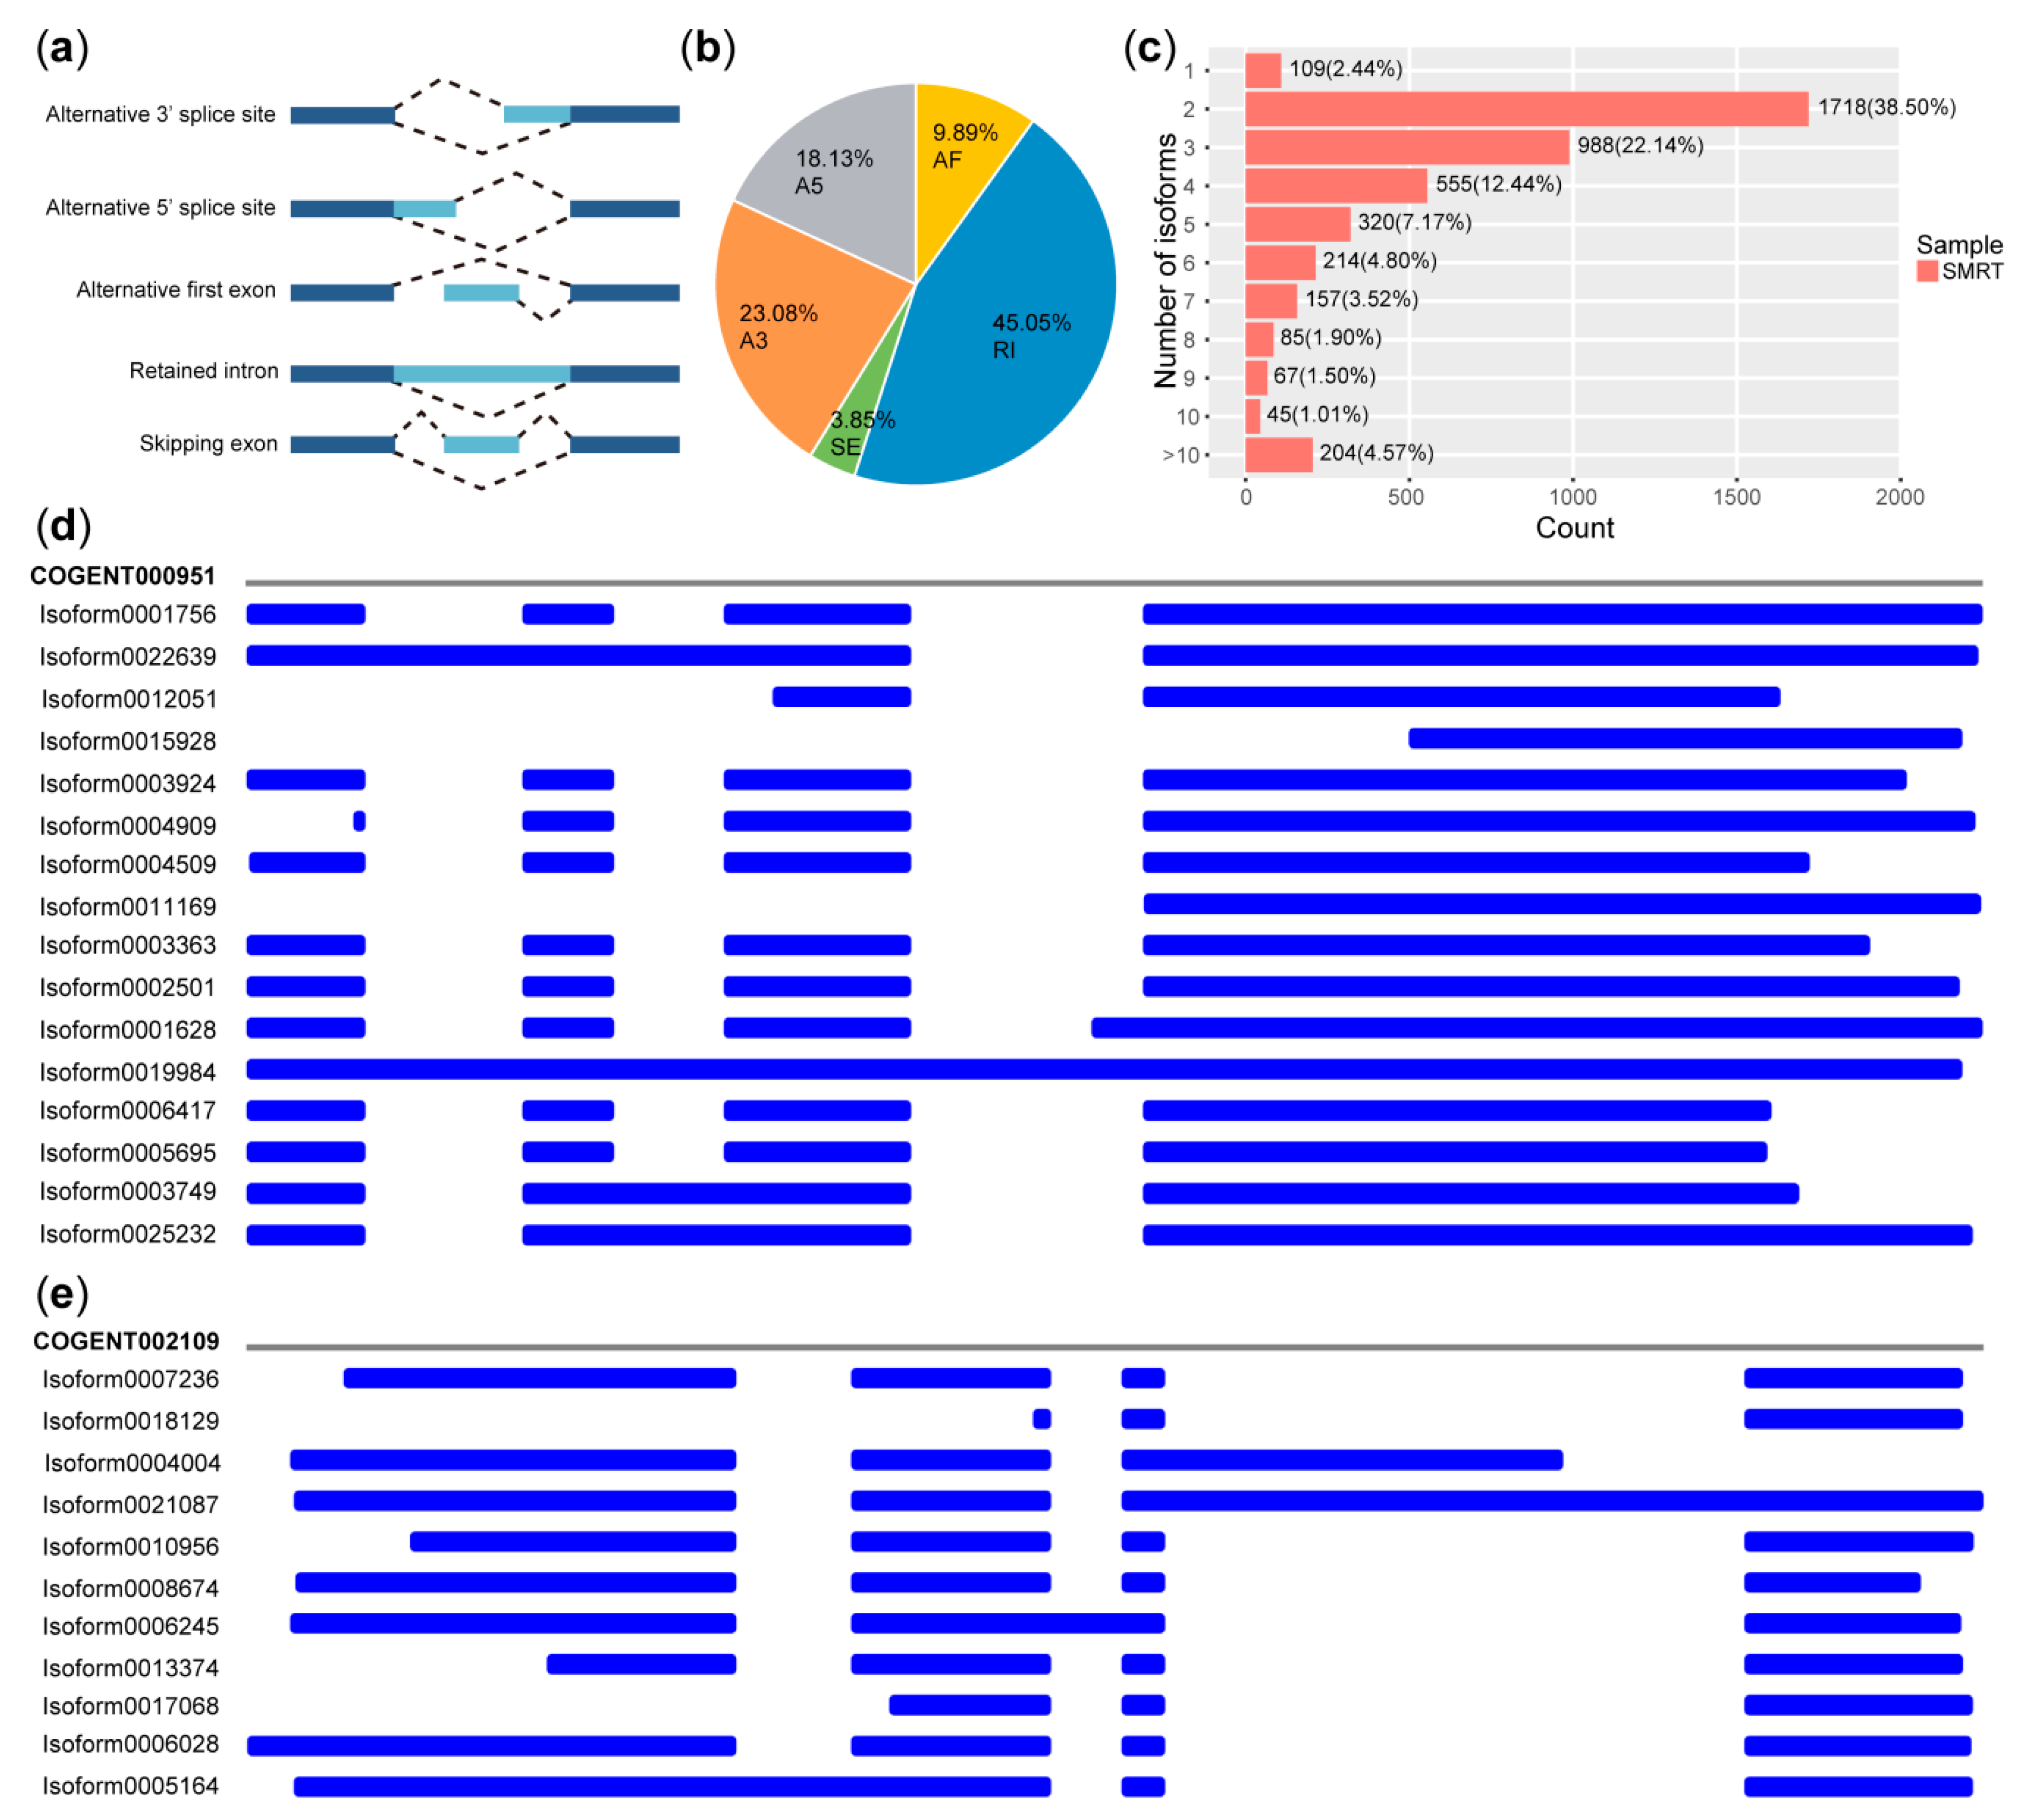
3.5. AS Events Detected from PacBio Sequel

Using the results obtained from PacBio transcript isoforms, 182 AS events were identified, including 42 (23.08%) A3, 33 (18.13%) A5, 18 (9.89%) AF, 82 (45.05%) RI, and seven (3.85%) SE, among which RI was the main AS event (Figure 6a,b). The AS events in our study largely enriched the transcript information for M. pasquieri. Due to the lack of a genome database, splice isoforms of unannotated genes remain unknown. Results from the PacBio analysis indicated that only a single isoform was detected in 109 (2.44%) genes, and two or more isoforms were found in 4353 genes (97.55%) (Figure 6c). Ten; and more than ten splice isoforms were detected in 204 (4.57%) genes. For example, 16 different COGENT000951 isoforms were identified in this study and were predicted to be associated with metabolic pathways, biosynthesis of secondary metabolites, and phenylpropanoid biosynthesis; sequencing results are shown in Figure 6d (example of A3). Additionally, 11 different COGENT002109 isoforms were identified, and the results are shown in Figure 6e, which were predicted to be associated with plant hormone signal transduction (an example of RI).

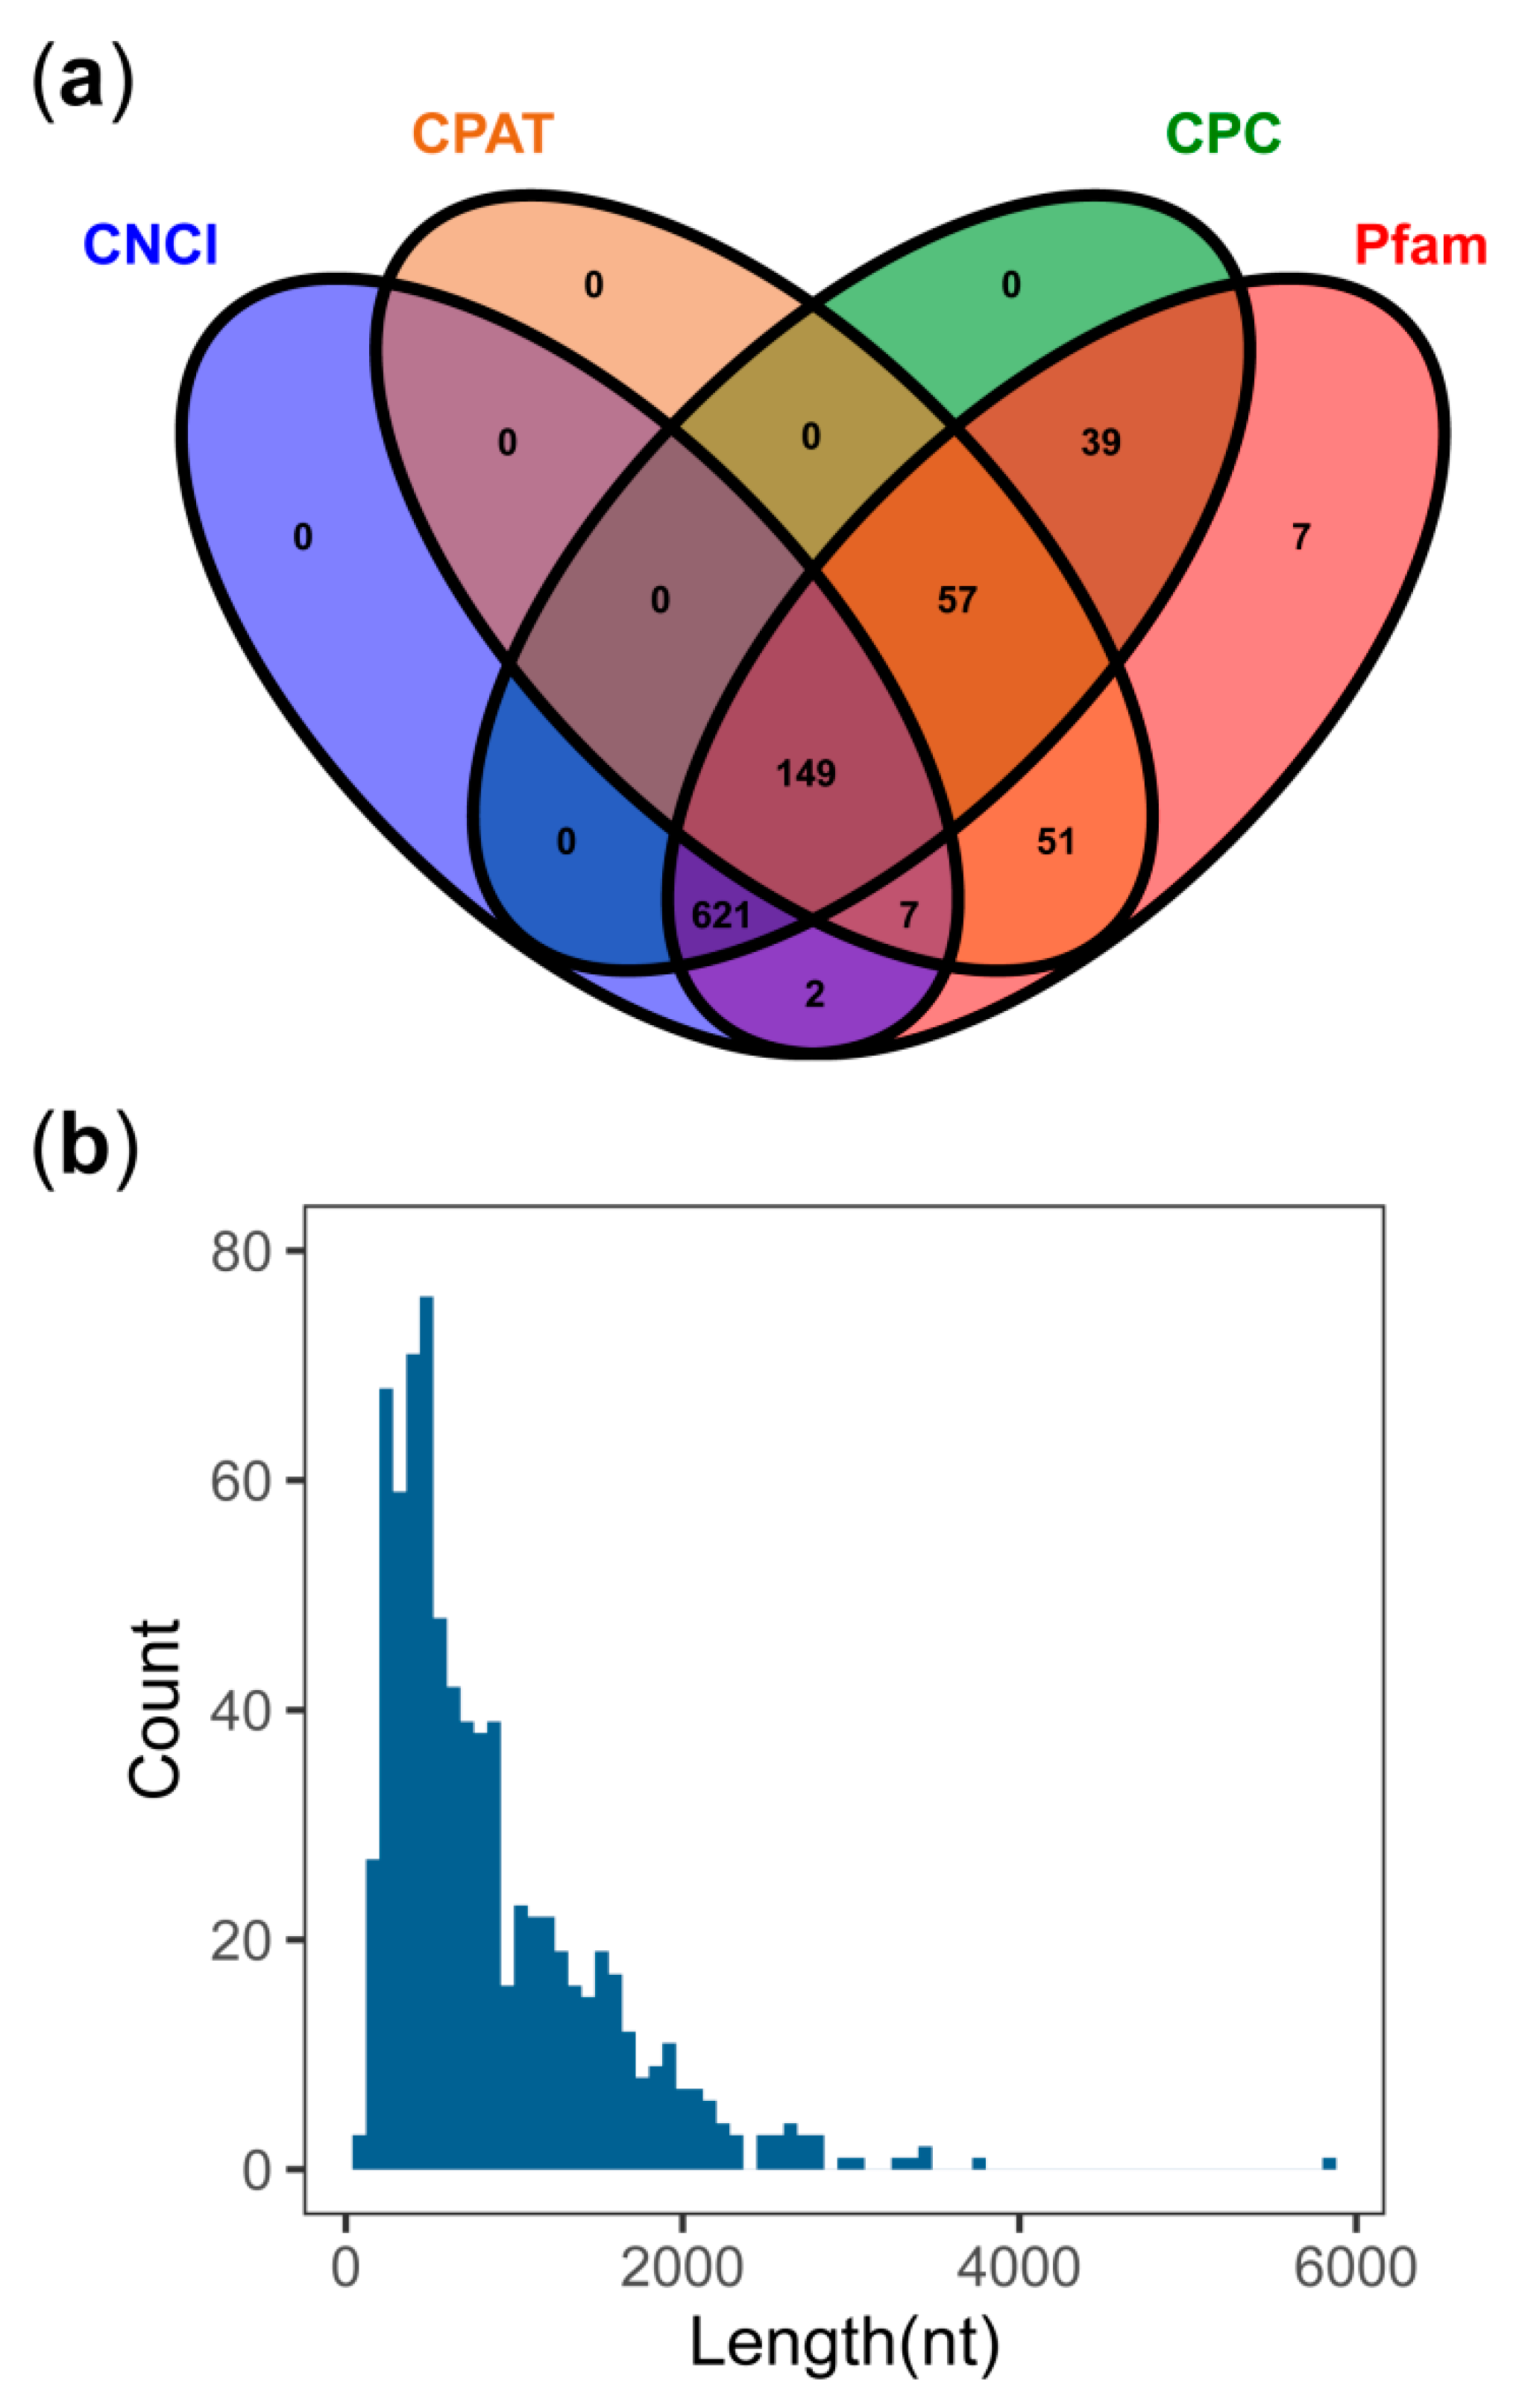
3.6. LncRNA Detected from PacBio Sequel

Four computational approaches (CNCI, CPAT, CPC, and Pfam) were combined to predict lncRNAs from putative protein-coding RNAs among the unknown transcripts. From the four different analyses, 779, 264, 866, and 933 transcripts longer than 200 nt were selected as lncRNAs, among which 149 common lncRNAs were predicted for subsequent analysis (Figure 7a). Some of these lncRNAs were up to 4000nt long (Figure 7b).

3.7. Functional Annotation of Transcripts

All 25,339 transcripts (corrected isoforms) were functionally annotated by searching Nr, Swissprot, KOG, and KEGG databases, and 24,405 transcripts (96.31%) were annotated in PacBio. Of these, 24,358 transcripts were annotated in the Nr database, 21,059 were annotated in the Swissprot database, 16,957 were annotated in the KOG database, and 13,185 were annotated in the KEGG database (Figure 8a and Figure S3). A total of 934 transcripts did not return any matches and may reflect novel transcripts in the M. pasquieri transcriptome. Homologous species were analyzed by comparing the transcript sequences with those in the Nr database, and the results showed that the highest numbers of transcripts were found in Vitis vinifera (3484, 14.30%), Theobroma cacao (1432, 5.88%), Sesamum indicum (1182, 4.85%), Juglans regia (1182, 4.85%), Nelumbo nucifera (1063, 4.36%), Cephalotus follicularis (895, 3.67%), Ziziphus jujuba (753, 3.09%), Camellia sinensis (725, 2.98%), Jatropha curcas (664, 2.73%), and Citrus sinensis (535, 2.20%) (Figure 8b).

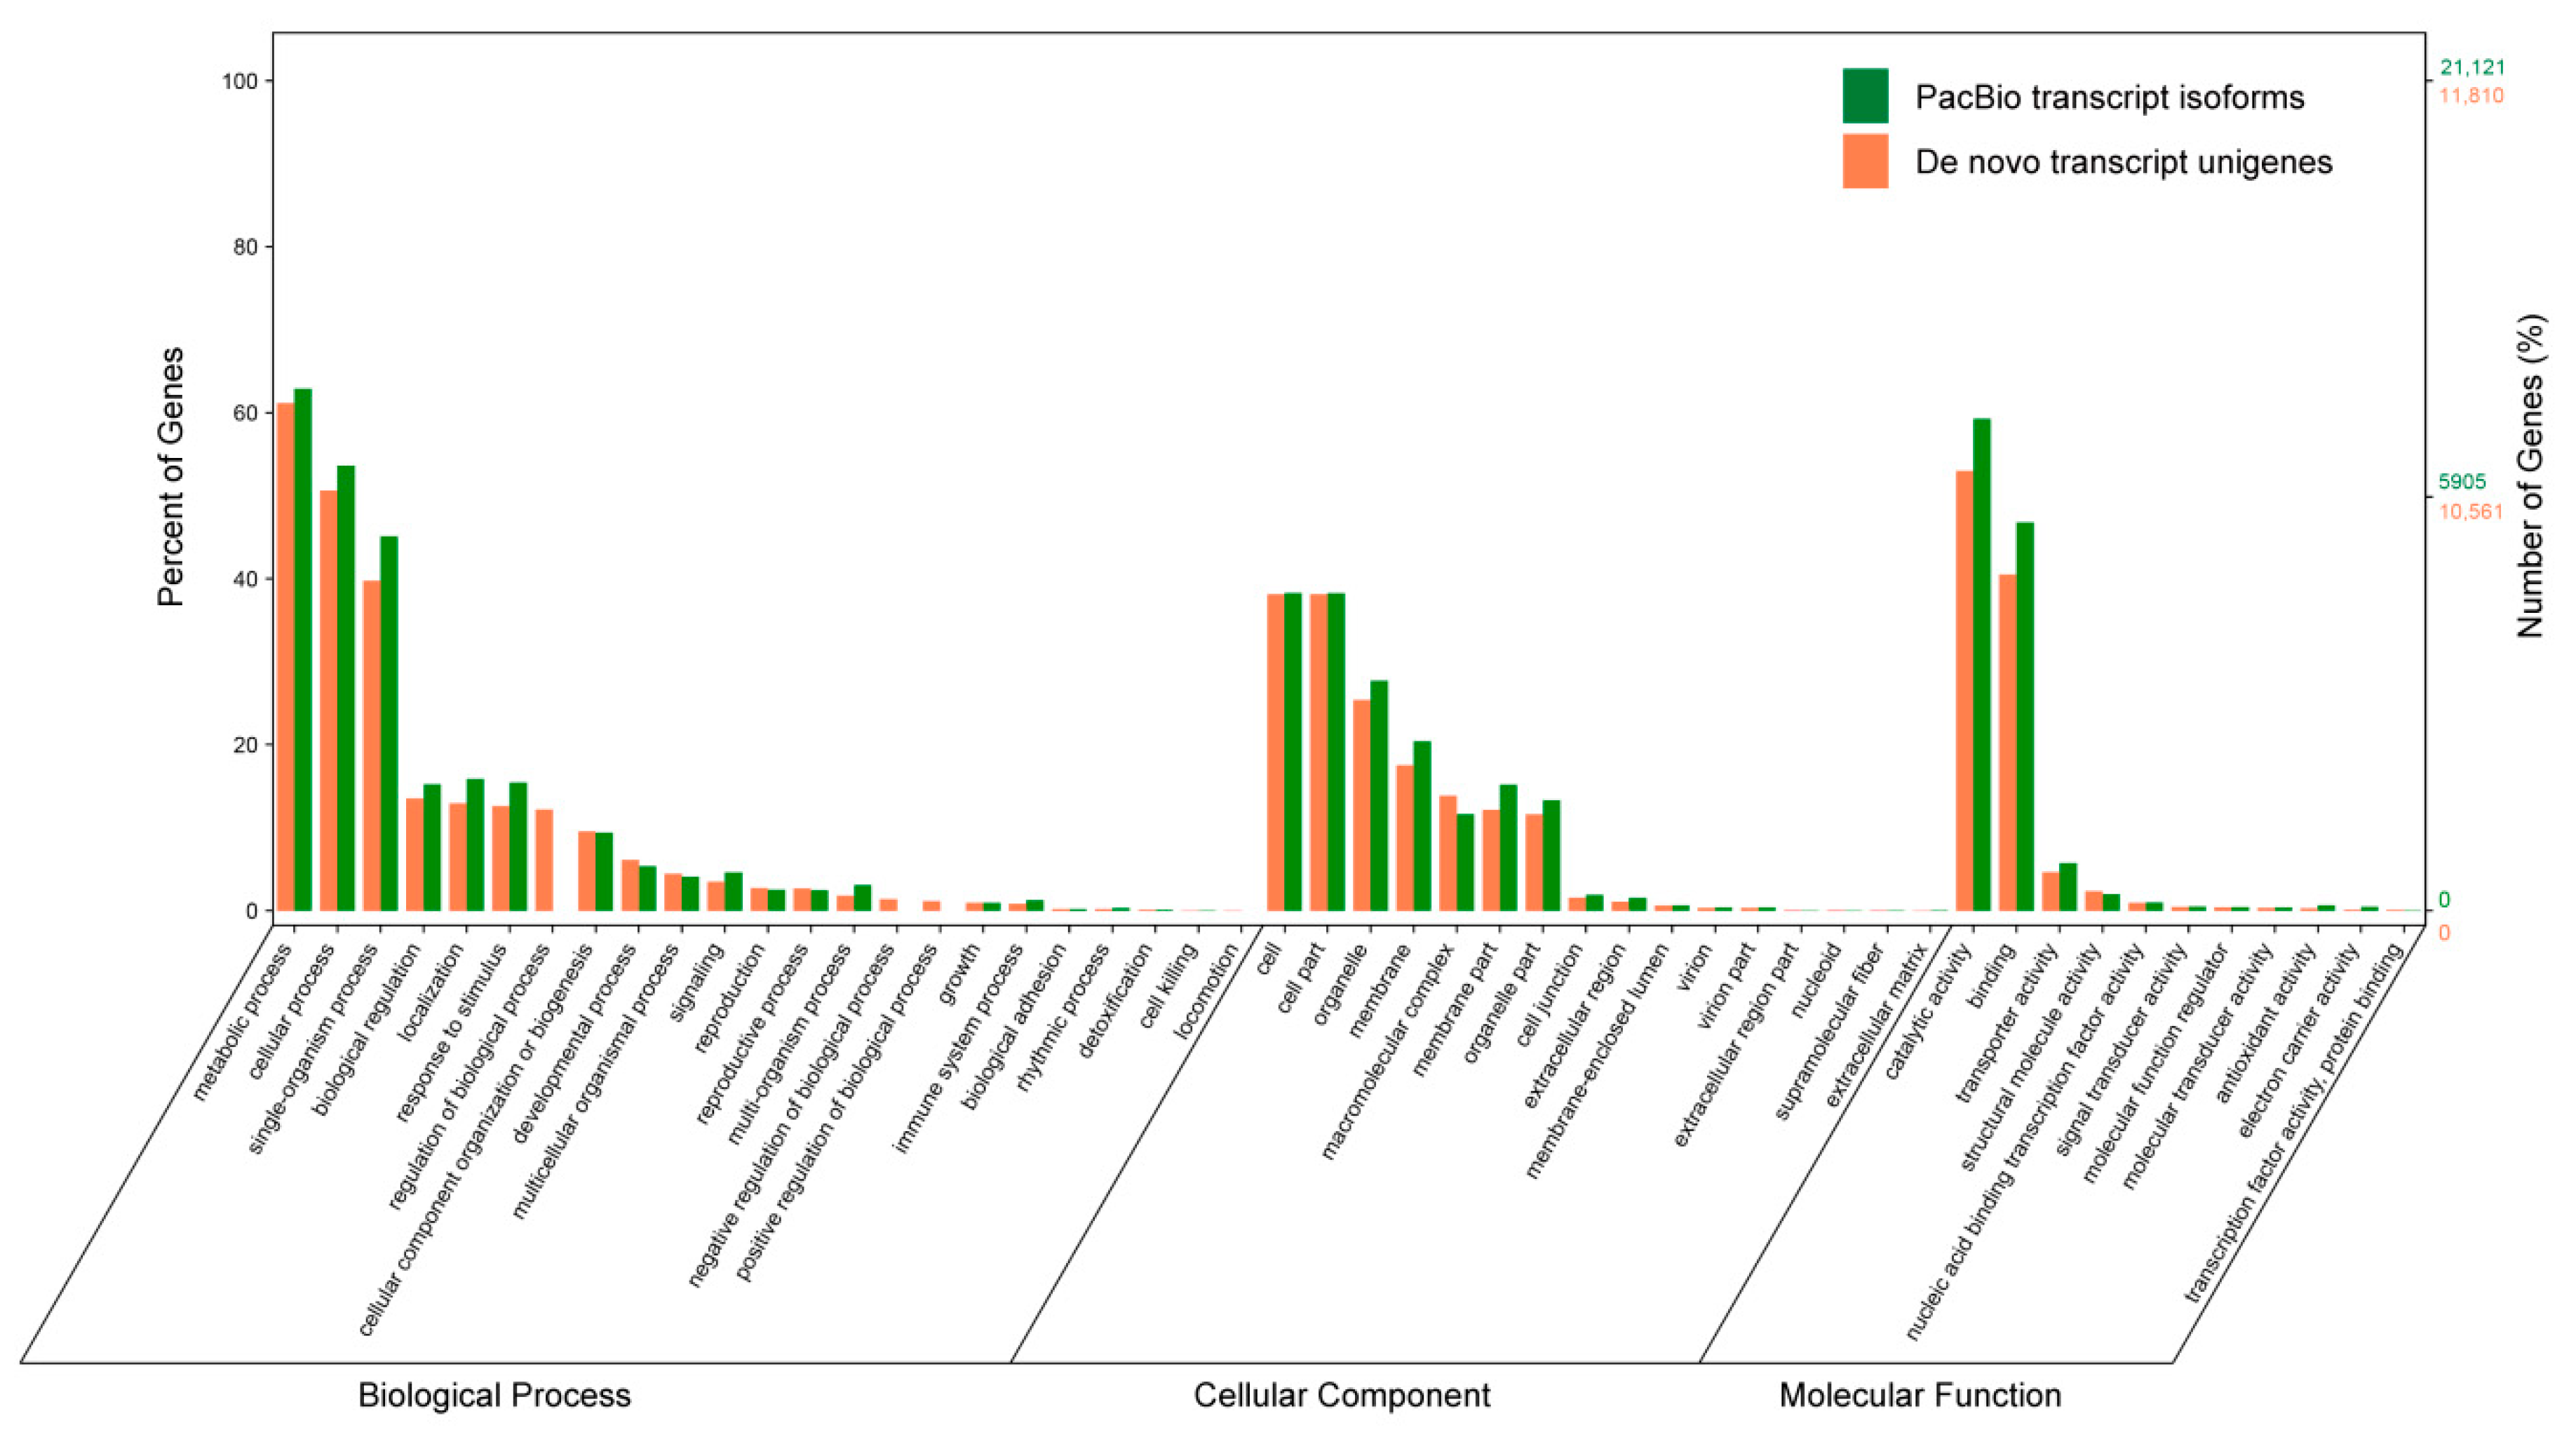
3.8. Gene Ontology (GO) Annotation

GO analysis showed that 11,810 PacBio transcript isoforms (46.61% of total set) could be divided into three groups; biological processes, molecular functions, and cellular components. Transcripts in ‘biological processes’ were mainly enriched for metabolic process, cellular process, single-organism process, and others (Figure 9). Transcripts involved in ‘cellular components’ consisted of cell, cell part, organelle, membrane, and membrane part. For the category ‘molecular function’, transcripts were mainly involved in catalytic activity, binding, and transporter activity. A comparison of enriched GO terms between the PacBio transcript isoforms and de novo transcript unigenes (which had 76,548 unigenes annotated, accounting for 61.53% of the total de novo set) is presented in Figure 9.

3.9. Analysis of KEGG Pathways and Gene Annotation Information

KEGG pathway analysis provided additional functional information relating to the pathways associated with each transcript isoform, since one gene could be assigned to more than one GO term in the Gene Ontology annotation. The KEGG results demonstrated that 13,185 PacBio transcript isoforms (52.03% of the total) from M. pasquieri were annotated to 132 KEGG pathways, while 55,975 de novo transcript unigenes (44.99% of the total) were annotated to 136 KEGG pathways (Figure 10). The functional pathway was first assigned to five KEGG biochemical pathways, including cellular processes, environmental information processing, genetic information processing, metabolism, and organismal systems. ‘Metabolism’ represented the largest group in both PacBio and de novo transcript datasets, containing 102 and 105 pathways, respectively. With most associated with metabolic pathway (3795/7267), biosynthesis of secondary metabolites (2189/4069), biosynthesis of antibiotics (1229/0), microbial metabolism in diverse environments (1081/0), carbon metabolism (910/1504), and biosynthesis of amino acids (679/1236). Those pathways related to genetic information processing were the second largest group, including transcripts involved in protein processing in endoplasmic reticulum (715/971), ribosome (672/2321), spliceosome (509/780), and RNA transport (387/718). The third largest group comprised cellular processes, with a majority of transcripts involved in endocytosis (381/618) and phagosome (220/430). Plant hormone signal transduction (349/436) and plant-pathogen interaction (336/728) were the most in environmental information processing and organismal systems, respectively. In addition, some important pathways were also found in M. pasquieri, including carbon fixation in photosynthetic organisms, photosynthesis, phenylpropanoid biosynthesis, flavonoid biosynthesis, anthocyanin biosynthesis, isoflavonoid biosynthesis, flavone and flavonol biosynthesis, terpenoid backbone biosynthesis, sesquiterpenoid and triterpenoid biosynthesis, monoterpenoid biosynthesis, and diterpenoid biosynthesis (Table S5). These results provide a valuable resource for investigating metabolic pathways in M. pasquieri.
Plant hormone signal transduction is important for regulating germination and growth, and 349 PacBio transcript isoforms have been shown to be involved in plant hormone signal transduction pathway (ko04075; Table S5). Auxin, gibberellin (GA), and cytokinine signal transduction pathways accelerate seed germination and plant development, while abscisic acid (ABA) signal transduction pathway plays the opposite role. In the auxin pathway, 59 transcripts were annotated as key genes, which encoded auxin transporter protein 1 (AUX1), transport inhibitor response 1 (TIR1), auxin/indole-3-acetic acid (AUX/IAA), auxin response factor (ARF), gretchen hagen 3 (GH3), and small auxin upregulated RNA (SAUR). In the GA pathway, 22 transcripts were annotated as four key genes, GA-insensitive dwarf mutant 1 (GID1), GA-insensitive dwarf mutant 2 (GID2), DELLA, and TF. In the cytokinine pathway, nine transcripts were annotated as four key genes, cytokinin response 1 (CRE1), arabidopsis histidine-containing phosphotransfer protein (AHP), type-B arabidopsis response regulators (B-ARR), and type-A arabidopsis response regulators (A-ARR). In the ABA pathway, 47 transcripts were annotated as pyrabactin resistance/PYR-like (PYR/PYL), Protein Phosphatase 2 C (PP2C), Sucrose non-fermenting 1-related protein kinases subfamily 2 (SnRK2), and ABRE-binding factor (ABF) (ko04075; Figure S6).

4. Discussion

4.1. Comparison of PacBio Transcripts and De Novo Unigenes

The de novo transcriptome assembly of second-generation sequencing technology has been used widely for transcriptome analysis in species without a genomic reference. Large-scale sequencing of transcriptome data by second-generation sequencing cannot generate full-length sequences or alternatively spliced forms of RNA. With the emergence of SMRT sequencing technology, full-length transcripts could be obtained without large-scale assembly. For example, de novo assembly from short reads only reconstructed 8% of PacBio isoforms in maize (Zea mays) [32]. Moreover, compared with RNA-Seq data or previously annotated references, PacBio retrieved longer transcripts, including for Amborella trichopoda [33], avocado (Persea americana) [34], and Populus alba var. pyramidalis [35]. To date, no genomic or transcriptome information for M. pasquieri has been reported. In this study, five developmental stages of M. pasquieri were sampled to obtain more comprehensive transcript information, and 438,795 CCSs were obtained by PacBio Sequel. Due to the high error rate associated with third-generation sequencing, Illumina RNA-Seq transcripts and LoRDEC (v 0.8) were used to correct the low-quality sequences. Finally, 25,339 full-length transcripts were obtained, with a mean length of 1436.77 bp and an N50 value of 1652 bp, which will benefit further studies on M. pasquieri. However, these transcripts were shorter than reported in previous transcriptome studies of alfalfa (Medicago sativa L.) (mean length = 2551 bp, N50 = 2928 bp) [36] and Gnetum luofuense (mean length = 3237 bp, N50 = 3629 bp) [37], using the same technology. This result may be related to the differences in the parameters and nature characteristics of the species.
In this study, de novo assembly from Illumina using the same experimental material generated more transcripts (124,405 unigenes) than PacBio Sequel; however, the mean length of the transcripts was 834 bp and the N50 was 1387 bp, which were substantially shorter than those obtained by PacBio, at 1436.77 bp and 1652 bp, respectively (Table S1). The results indicate that PacBio is better able to capture long transcript sequences, similar to those reported in adlay (Coix lacryma-jobi) [38]. Although de novo assembly resulted in a higher number of transcripts and annotated transcripts (66,026), the latter accounted for only 53.07% of the total transcripts, which was much lower than the 96.31% obtained by PacBio. Notably, the annotation rate in all databases was significantly higher with PacBio sequencing data compared with Illumina data; for example, Nr, 51.19% Illumina versus 96.13% PacBio; Swissprot, 36.69% Illumina versus 83.11% PacBio; COG/KOG, 30.58% Illumina versus 66.92% PacBio; and KEGG, 44.99% Illumina versus 52.03% PacBio) (Figure 3a and Figure S3). By comparing de novo and PacBio transcripts, 10,140 unigenes and 15,564 isoforms were found in common by BLASTN, accounting for 8.2 and 61.4% respectively. Additionally, 91.8% (114,265) transcripts were found specifically in de novo assembly, and 38.6% (9775) in PacBio (Figure 3b). Thus, although de novo assembly can obtain a large number of transcripts and annotated transcripts, this may account for the great depth of reads used for assembly [20], while a large number of unannotated transcripts may contain many new transcripts. Therefore, although Illumina provides more transcripts and greater sequencing depth compared with PacBio Sequel, the PacBio Sequel method can detect more full-length transcripts and more accurately annotated transcripts; this is more conducive to obtaining accurate transcript information for M. pasquieri.

4.2. Analysis of Alternative Splicing in Transcriptomes

AS of precursor mRNAs (pre-mRNAs) during eukaryotic gene transcription may increase the number of protein isoforms produced by the removal of introns and the joining of exons [39,40,41]. The splicing mode of multi-exon mRNA may vary in several ways, and is usually divided into SE, A5, A3, Mutually Exclusive Exon (MX), RI, AF, and Alternative Last Exon (AL), leading to multiple transcripts of some genes [42]. Therefore, AS markedly increases the complexity and flexibility of the transcriptome and proteome [43]. In addition, AS is involved in the regulation of growth, development, signal transduction, flowering, and responses to various abiotic stresses [44,45,46,47]. Although RNA-Seq can accurately quantify and annotate individual AS events, it is hard to deduce full-length splicing isoforms that contain a combination of these individual events [48,49]. SMRT sequencing enables the generation of full-length sequences and the identification of complex splice isoforms, which are difficult to detect and reconstruct by RNA-Seq [50]. For example, PacBio identified more AS events in strawberry (Fragaria vesca) (17,260) compared with Illumina (12,080) [42]. In cotton (Gossypium spp.), PacBio (133,229) retrieved eight-times more AS events than Illumina (16,437) [51]. In the present study, 182 AS events were identified by PacBio Sequel in M. pasquieri, which were classified into five types, including 42 A3, 33 A5, 18 AF, 82 RI, and seven SE (Figure 6b,c). The majority of AS events were RI (45.5%), similar to previous reports in other plant species, such as sorghum (Sorghum bicolor BTx623) [52], bread wheat (Triticum aestivum L.) [53], and cassava (Manihot esculenta) [54]. In our study, these AS events greatly enriched the transcriptional information of M. pasquieri. Studies have reported specific expression of AS events in different plant tissues. For example, the proportion of different AS events varied among maize and sorghum tissues [55]. Dynamic changes in AS events occur during different development stages and tissues of strawberry; for example, anthers at floral stages 7 and 8 had more AS genes compared with anthers from other anther stages [42]. These studies also provide direction for further research on AS events in M. pasquieri.

4.3. Analysis of lncRNAs Detected by PacBio Sequel

In addition to protein-coding RNAs, non-coding RNAs constitute a major component of the transcriptome [56]. Generally, lncRNAs are more than 200 nt in length, possess no apparent CDS or ORF, and lack protein coding capability [57]. Based on their genomic location, lncRNAs can be classified as antisense, intronic, and long intergenic noncoding RNA [58]. In recent years, studies have found that lncRNAs play a significant role in the physiology and development of plants, especially in some key biological processes [59]. However, only a small number of lncRNA functions have been determined. For example, studies have confirmed that lncRNAs participate in abiotic stress responses and act as regulatory factors [60]. In a transcriptional study on soybean (Glycine max) roots under continuous salt stress, about 77% of identified lncRNAs were activated or up-regulated by more than two-fold, and functional analysis of proteins with binding and catalytic activities were major targets of these newly identified lncRNAs, indicating the regulatory role of lncRNAs in soybean roots resistant to salt stress [61]. RNA Seq short-read sequencing, which is a powerful tool used to describe gene expression, has been widely used; however, it cannot provide full-length sequences for each RNA, which also increases the difficulty of detecting lncRNAs. Nevertheless, SMRT-seq technology can effectively capture full-length sequences of the genome and transcriptome [50]. In a study investigating the maize transcriptome, SMRT-seq identified 867 novel high-confidence lncRNAs with a mean length of 1.1 kb, which were much longer than the lncRNAs identified by RNA-Seq short-read sequencing [32]. LncRNAs have not yet been identified in M. pasquieri. In the present study, 149 common lncRNAs were predicted by four programs (Figure 7a), which will contribute to the functional study of lncRNAs in M. pasquieri. Although lncRNAs were identified by PacBio Sequel in this study, they could not be classified nor further studied due to a lack of genome data for M. pasquieri. A previous study also detected 223 and 205 lncRNAs in the leaf and root of Astragalus membranaceus, respectively [62], which may be helpful for the further study of lncRNA expression in different tissues of M. pasquieri.

4.4. Analysis of Nr Annotation and Transcription Factors

Among 25,339 transcripts, a total of 24,405 transcripts were annotated using four databases (Nr, Swissprot, KOG, and KEGG), including 24,358 transcripts annotated in the Nr database, accounting for 96.13% of the total annotated transcripts (Figure 3a and Figure S3). Comparison of M. pasquieri transcripts with the Nr data revealed that M. pasquieri shares homology with Vitis vinifera (3484, 14.30%), Theobroma cacao (1432, 5.88%), Sesamum indicum (1182, 4.85%), Juglans regia (1182, 4.85%), and Nelumbo nucifera (1063, 4.36%) (Figure 8b). Vitis vinifera possesses the highest homology, which may be explained by its relatively extensive database and better annotation compared with that of other species; however, its homology ratio is relatively low compared with other species. For example, in coffee (Coffea arabica) bean, a Nr-annotated tobacco species was much larger than that of Coffea canephora (1,746,308 versus 142,656 hits; maximum 50 hits per sequence) [63]. This is not unexpected, since there is no available genomic and transcriptomic information for M. pasquieri or a comprehensive genomic resource for Sapotaceae, only the genome of Argania spinosa has been reported [64], so as the plastome sequence of Pouteria campechiana (Kunth) Baehni [65], Manilkara zapota (L.) P.Royen [66], and chloroplast genome of Lucuma nervosa [67], Vitellaria paradoxa, and Sideroxylon wightianum [68]. Since studies on M. pasquieri remain in their infancy, and information available from other plants is relatively limited, further research is needed.
TFs are important regulatory components for seed germination and plant development [69], and many TF families, including WRKY, MYB, NAC, and bHLH, have been studied extensively in model plants and crops [70], but fewer studied in non-model plants [71]. For example, members of the MYB (HORVU0Hr1G018970, HORVU2Hr1G010450) and NAC (HORVU2Hr1G077320) family were found associated with regulating germination or root development in barley (Hordeum vulgare) [72]. SPATULA, a member of bHLH, mediates seed germination by affecting cell elongation in Arabidopsis [73]. Here, 1058 and 2048 TF genes were identified by PacBio and Illumina, and were classified into 51 and 57 TF families, respectively. Moreover, we found that they have the same abundant TF families, including ERF, WRKY, GRAS, NAC, bHLH, C3H, bZIP, C2H2, and MYB_related (Table 1). This indicated that these TF families were actively involved in the material synthesis and growth metabolism of M. pasquieri during all stages, which requires further studies.

4.5. Excavation of KEGG Annotation Pathways Gene Annotation Information in M. pasquieri

A large number of transcripts from M. pasquieri were associated with metabolic pathways (3795), biosynthesis of secondary metabolites (2189), biosynthesis of antibiotics (1229), microbial metabolism in diverse environments (1081), and carbon metabolism (910), indicating that the germination and growth of M. pasquieri requires varied metabolic supports. This also shows that there are multiple functional metabolites in M. pasquieri, many of which may be of potential value. Although some pathways were associated with fewer transcripts, they may still be worth noting.
Previous studies have indicated that most phytohormones, such as ABA, GA, auxin, ethylene, cytokinine, brassinosteroid and jasmonic acid are involved in seed germination and growth regulation [74]. In this study, 349 PacBio transcript isoforms have been involved in plant hormone signal transduction pathway (ko04075; Table S5). Studies have shown that GA promotes seed germination, whereas ABA is the most notorious GA antagonist for its inhibitory effect on seed germination [75,76]. It has been reported that GA mainly stimulates germination by promoting radicle elongation and penetration of the seed coat [71], and GA-GID1 complex induces the degradation of the plant growth inhibitor DELLA proteins to promote plant germination [77]. In the study, 22 transcripts were involved in GA pathway, and nine and ten transcripts were annotated as GID1 and DELLA, respectively. These results might suggest that specific members of the GID1 and DELLA genes of M. pasquieri are involved in the regulation of seed germination. Furthermore, PYR/PYL (17), PP2C (10), SnRK2 (19), and ABF (11), associated with ABA pathway, were identified in our study, which have been proven to be key components of ABA signaling in sheepgrass (Leymus chinensis) [78]. Auxin is present in the seedling radicle tip during and after germination, and cytokinine is activated during germination [79]. And, we found AUX1 (8), TIR1 (5), AUX/IAA (26), ARF (12), GH3 (2), and SAUR (6) were involved in auxin pathway; CRE1 (1), AHP (2), B-ARR (3), and A-ARR (3) in cytokinine pathway of M. pasquieri. Although, these results might indicate that these specific transcripts were associated with the regulation of seed germination and post-germination in M. pasquieri, we could not obtain more accurate information in specific time, and tissues.
Other pathways, like carbon fixation in photosynthetic organisms (ko00710), photosynthesis (ko00195) pathways were also important in M. pasquieri, especially in post-germination stages. Notably, during cultivation of M. pasquieri, the leaves changed from a distinct red to a dark red, and finally to green between the two to the nine-leaf stage, which may be associated with anthocyanin biosynthesis pathway (ko00942) and 20 annotated transcripts were involved in the study. Furthermore, flavonoid biosynthesis pathway (ko00941), isoflavonoid biosynthesis pathway (ko00943), flavone and flavonol biosynthesis pathway (ko00944), terpenoid backbone biosynthesis (ko00900), sesquiterpenoid and triterpenoid biosynthesis (ko00909), monoterpenoid biosynthesis (ko00902), and diterpenoid biosynthesis (ko00904) pathways were also found, providing support for development and utilization of M. pasquieri.
Interestingly, 1229 and 1081 PacBio transcript isoforms have been involved in biosynthesis of antibiotics (ko01130) and microbial metabolism in diverse environments (ko01120), respectively, while none of transcript unigenes involved in de novo assembly from Illumina. On the one hand, this might be the differences between PacBio and Illumina platforms. And the sample used in SMRT sequencing were mixed, however in NGS de novo assembly were individual samples, which may filter some lowquality reads during assembly, resulting in different transcripts being obtained. On the other hand, previous studies have shown that the annotation rate of PacBio isoforms were much higher than that of the de novo unigenes [42,80]. And our results showed the same conclusion (96.31% versus 53.07%), suggesting that longer transcripts may be easier annotated. This may explain that transcript unigenes, involved in biosynthesis of antibiotics and microbial metabolism in diverse environments, were not annotated, which need further studies.

5. Conclusions

In conclusion, this was the first comprehensive transcriptome analysis of M. pasquieri combining SMRT and NGS sequencing. We identified 25,339 transcript isoforms by PacBio, including 24,492 CDSs, 9440 SSRs, and 149 lncRNAs. A total of 1058 transcripts were identified as TFs, which were classified into 51 TF families. Additionally, 182 AS events were detected across five types (A3, A5, AF, RI, and SE), among which a majority was IR. Although de novo assembly from Illumina obtained more unigenes (124,405) owing to its greater sequencing depth, PacBio Sequel recovered more FL transcripts, with a longer mean length and N50, longer CDSs, and higher expression level. Using four databases, 24,405 transcripts (96.31%) were annotated by PacBio, while 66,026 unigenes were annotated by de novo assembly, accounting for only 53.07% of the total, indicating that PacBio can more accurately annotate transcripts. And, we found that 8.2% of the de novo transcript unigenes exhibited similarity to 61.4% of the PacBio transcript isoforms, and that 91.8% unigenes and 38.6% isoforms were unique to the Illumina and PacBio database, respectively. Functional annotation revealed a role for the auxin, GA, ABA, and cytokinine metabolic pathways, which are associated with seed germination and post-germination. In addition, multiple flavonoid and terpenoid metabolic pathways have been identified, which may be related to the potential value of M. pasquieri. Moreover, we can combine the metabolomics and proteomics in the further research, so as to better understand the mechanism of germination and growth of M. pasquieri. Our work provides a comprehensive transcriptome resource for future studies on functional gene mining and utilization, genetic resource classification and evolution, molecular marker development, and endangered mechanism of M. pasquieri.

Supplementary Materials

The following are available online at https://www.mdpi.com/1999-4907/11/8/866/s1, Figure S1: Evaluation of PacBio and Illumina data by BUSCO software, Figure S2: Length distribution of unigenes obtained by de novo assembly, Figure S3: Functional annotations of unique transcripts in transcriptomes generated by Illumina and PacBio, Figure S4: The length distribution of Blast coding sequences (CDSs) in de novo assembly, Figure S5: The proportion of SSRs of different tandem repeat element types among the total SSR in de novo assembly, Figure S6: Annotated transcripts in ‘plant hormone signal transduction’ of KEGG pathways, Table S1: Statistics of the PacBio and de novo assembly data, Table S2: Statistics of 15 samples data filtering of RNA-Seq, Table S3: Base information statistics for 15 samples of RNA-Seq, Table S4: Statistics of simple sequence repeat (SSR) distribution in de novo assembly, Table S5: Statistics of KEGG pathways enriched of transcripts in M. pasquieri.

Author Contributions

Conceptualization, L.K.; methodology, L.K.; software, L.K.; validation, L.K. and Q.L.; formal analysis, L.K.; investigation, Q.L., Y.T. and S.W.; resources, L.Z.; data curation, Q.L.; writing—original draft preparation, L.K.; writing—review and editing, L.Z. and Z.S.; visualization, L.K.; supervision, L.Z.; project administration, L.Z.; funding acquisition, L.Z. All authors have read and agreed to the published version of the manuscript.

Funding

This research was funded by Guangdong Provincial Special Fund for Forestry Development and Protection (Forestry Science and Technology Innovation Project 2017KJCX037/2019KJCX007), Guangdong Strategy for Rural Revitalization of Finance Special Fund (forest resources cultivation, management and protection, development of forestry industry) (2130207-2) and Forestry Department of Guangdong Province, China, for non-commercial ecological forest research (2020STGYL001).

Acknowledgments

We thank the Guangzhou Gene Denovo Biotechnology Company for assisting with the sequencing analysis.

Conflicts of Interest

The authors declare no conflict of interest. Data Availability: Transcriptome datasets supporting the conclusions of this article are available in the NCBI SRA repository under the accession number SRP267710.

References

  1. Conesa, A.; Madrigal, P.; Tarazona, S.; Gomez-Cabrero, D.; Cervera, A.; McPherson, A.; Szczesniak, M.W.; Gaffney, D.J.; Elo, L.L.; Zhang, X.; et al. A survey of best practices for RNA-seq data analysis. Genome Biol. 2016, 17, 13. [Google Scholar] [CrossRef] [PubMed] [Green Version]
  2. Chao, Y.; Yuan, J.; Li, S.; Jia, S.; Han, L.; Xu, L. Analysis of transcripts and splice isoforms in red clover (Trifolium pratense L.) by single-molecule long-read sequencing. BMC Plant Biol. 2018, 18, 300. [Google Scholar] [CrossRef] [PubMed] [Green Version]
  3. Liu, N.; Cheng, F.; Zhong, Y.; Guo, X. Comparative transcriptome and coexpression network analysis of carpel quantitative variation in Paeonia rockii. BMC Genom. 2019, 20, 683. [Google Scholar] [CrossRef] [PubMed] [Green Version]
  4. Yang, L.; Jin, Y.; Huang, W.; Sun, Q.; Liu, F.; Huang, X. Full-length transcriptome sequences of ephemeral plant Arabidopsis pumila provides insight into gene expression dynamics during continuous salt stress. BMC Genom. 2018, 19, 717. [Google Scholar] [CrossRef] [PubMed]
  5. Wang, Y.; Ju, D.; Yang, X.; Ma, D.; Wang, X. Comparative transcriptome analysis between resistant and susceptible rice cultivars responding to striped stem borer (SSB), Chilo suppressalis (Walker) infestation. Front. Physiol. 2018, 9, 1717. [Google Scholar] [CrossRef] [PubMed] [Green Version]
  6. Piriyapongsa, J.; Kaewprommal, P.; Vaiwsri, S.; Anuntakarun, S.; Wirojsirasak, W.; Punpee, P.; Klomsa-Ard, P.; Shaw, P.J.; Pootakham, W.; Yoocha, T.; et al. Uncovering full-length transcript isoforms of sugarcane cultivar Khon Kaen 3 using single-molecule long-read sequencing. PeerJ 2018, 6, e5818. [Google Scholar] [CrossRef] [Green Version]
  7. Rather, G.A.; Sharma, A.; Pandith, S.A.; Kaul, V.; Nandi, U.; Misra, P.; Lattoo, S.K. De novo transcriptome analyses reveals putative pathway genes involved in biosynthesis and regulation of camptothecin in Nothapodytes nimmoniana (Graham) Mabb. Plant Mol. Biol. 2018, 96, 197–215. [Google Scholar] [CrossRef]
  8. Dharshini, S.; Chakravarthi, M.; Narayan, J.A.; Manoj, V.M.; Naveenarani, M.; Kumar, R.; Meena, M.; Ram, B.; Appunu, C. De novo sequencing and transcriptome analysis of a low temperature tolerant Saccharum spontaneum clone IND 00-1037. J. Biotechnol. 2016, 231, 280–294. [Google Scholar] [CrossRef]
  9. Xu, Q.; Zhu, J.; Zhao, S.; Hou, Y.; Li, F.; Tai, Y.; Wan, X.; Wei, C. Transcriptome profiling using single-molecule direct RNA sequencing approach for in-depth understanding of genes in secondary metabolism pathways of Camellia sinensis. Front. Plant Sci. 2017, 8, 1205. [Google Scholar] [CrossRef] [Green Version]
  10. Rhoads, A.; Au, K.F. PacBio sequencing and its applications. Genom. Proteom. Bioinf. 2015, 13, 278–289. [Google Scholar] [CrossRef] [Green Version]
  11. Wang, L.; Jiang, X.; Wang, L.; Wang, W.; Fu, C.; Yan, X.; Geng, X. A survey of transcriptome complexity using PacBio single-molecule real-time analysis combined with Illumina RNA sequencing for a better understanding of ricinoleic acid biosynthesis in Ricinus communis. BMC Genom. 2019, 20, 456. [Google Scholar] [CrossRef] [PubMed]
  12. Chao, Y.; Yuan, J.; Guo, T.; Xu, L.; Mu, Z.; Han, L. Analysis of transcripts and splice isoforms in Medicago sativa L. by single-molecule long-read sequencing. Plant Mol. Biol. 2019, 99, 219–235. [Google Scholar] [CrossRef] [PubMed]
  13. Dong, L.; Liu, H.; Zhang, J.; Yang, S.; Kong, G.; Chu, J.S.; Chen, N.; Wang, D. Single-molecule real-time transcript sequencing facilitates common wheat genome annotation and grain transcriptome research. BMC Genom. 2015, 16, 1039. [Google Scholar] [CrossRef] [PubMed] [Green Version]
  14. Wang, T.; Wang, H.; Cai, D.; Gao, Y.; Zhang, H.; Wang, Y.; Lin, C.; Ma, L.; Gu, L. Comprehensive profiling of rhizome-associated alternative splicing and alternative polyadenylation in moso bamboo (Phyllostachys edulis). Plant J. 2017, 91, 684–699. [Google Scholar] [CrossRef] [PubMed] [Green Version]
  15. Ma, J.; Xiang, Y.; Xiong, Y.; Lin, Z.; Xue, Y.; Mao, M.; Sun, L.; Zhou, Y.; Li, X.; Huang, Z. SMRT sequencing analysis reveals the full-length transcripts and alternative splicing patterns in Ananas comosus var. bracteatus. PeerJ 2019, 7, e7062. [Google Scholar] [CrossRef] [PubMed] [Green Version]
  16. Zuo, C.; Blow, M.; Sreedasyam, A.; Kuo, R.C.; Ramamoorthy, G.K.; Torres-Jerez, I.; Li, G.; Wang, M.; Dilworth, D.; Barry, K.; et al. Revealing the transcriptomic complexity of switchgrass by PacBio long-read sequencing. Biotechnol. Biofuels 2018, 11, 170. [Google Scholar] [CrossRef] [Green Version]
  17. Wang, Y.; Zeng, Z.; Li, F.; Yang, X.; Gao, X.; Ma, Y.; Rao, J.; Wang, H.; Liu, T. A genomic resource derived from the integration of genome sequences, expressed transcripts and genetic markers in ramie. BMC Genom. 2019, 20, 476. [Google Scholar] [CrossRef]
  18. Edger, P.P.; VanBuren, R.; Colle, M.; Poorten, T.J.; Wai, C.M.; Niederhuth, C.E.; Alger, E.I.; Ou, S.; Acharya, C.B.; Wang, J.; et al. Single-molecule sequencing and optical mapping yields an improved genome of woodland strawberry (Fragaria vesca) with chromosome-scale contiguity. Gigascience 2018, 7, 1–7. [Google Scholar] [CrossRef] [Green Version]
  19. An, D.; Cao, H.X.; Li, C.; Humbeck, K.; Wang, W. Isoform sequencing and state-of-art applications for unravelling complexity of plant transcriptomes. Genes 2018, 9, 43. [Google Scholar] [CrossRef] [Green Version]
  20. Hoang, N.V.; Furtado, A.; Mason, P.J.; Marquardt, A.; Kasirajan, L.; Thirugnanasambandam, P.P.; Botha, F.C.; Henry, R.J. A survey of the complex transcriptome from the highly polyploid sugarcane genome using full-length isoform sequencing and de novo assembly from short read sequencing. BMC Genom. 2017, 18, 395. [Google Scholar] [CrossRef]
  21. Xu, Z.; Peters, R.J.; Weirather, J.; Luo, H.; Liao, B.; Zhang, X.; Zhu, Y.; Ji, A.; Zhang, B.; Hu, S.; et al. Full-length transcriptome sequences and splice variants obtained by a combination of sequencing platforms applied to different root tissues of Salvia miltiorrhiza and tanshinone biosynthesis. Plant J. 2015, 82, 951–961. [Google Scholar] [CrossRef] [PubMed]
  22. Xu, C.Q.; Liu, H.; Zhou, S.S.; Zhang, D.X.; Zhao, W.; Wang, S.; Chen, F.; Sun, Y.Q.; Nie, S.; Jia, K.H.; et al. Genome sequence of Malania oleifera, a tree with great value for nervonic acid production. Gigascience 2019, 8, 1–14. [Google Scholar] [CrossRef] [PubMed] [Green Version]
  23. Tan, C.; Liu, H.; Ren, J.; Ye, X.; Feng, H.; Liu, Z. Single-molecule real-time sequencing facilitates the analysis of transcripts and splice isoforms of anthers in Chinese cabbage (Brassica rapa L. ssp. pekinensis). BMC Plant Biol. 2019, 19, 517. [Google Scholar] [CrossRef] [PubMed]
  24. Kuang, X.; Sun, S.; Wei, J.; Li, Y.; Sun, C. Iso-Seq analysis of the Taxus cuspidata transcriptome reveals the complexity of Taxol biosynthesis. BMC Plant Biol. 2019, 19, 210. [Google Scholar] [CrossRef] [Green Version]
  25. Liu, B.; Lin, R.; Jiang, Y.; Jiang, S.; Xiong, Y.; Lian, H.; Zeng, Q.; Liu, X.; Liu, Z.J.; Chen, S. Transcriptome analysis and identification of genes associated with starch metabolism in Castanea henryi seed (Fagaceae). Int. J. Mol. Sci. 2020, 21, 1431. [Google Scholar] [CrossRef] [Green Version]
  26. Iralu, V.; Barbhuyan, H.S.A.; Upadhaya, K. Ecology of seed germination in threatened trees: A review. Energ. Ecol. Environ. 2019, 4, 189–210. [Google Scholar] [CrossRef]
  27. Zhou, T.; Li, Z.H.; Bai, G.Q.; Feng, L.; Chen, C.; Wei, Y.; Chang, Y.X.; Zhao, G.F. Transcriptome sequencing and development of genic SSR markers of an endangered Chinese endemic Genus Dipteronia Oliver (Aceraceae). Molecules 2016, 21, 166. [Google Scholar] [CrossRef] [Green Version]
  28. Zhang, Y.; Zhang, X.; Wang, Y.H.; Shen, S.K. De Novo assembly of transcriptome and development of novel EST-SSR markers in Rhododendron rex Levl. through Illumina Sequencing. Front. Plant Sci. 2017, 8, 1664. [Google Scholar] [CrossRef] [Green Version]
  29. Li, X.; Li, M.; Hou, L.; Zhang, Z.; Pang, X.; Li, Y. De novo transcriptome assembly and population genetic analyses for an endangered Chinese endemic Acer miaotaiense (Aceraceae). Genes 2018, 9, 378. [Google Scholar] [CrossRef] [Green Version]
  30. Chen, S.; Dong, M.; Zhang, Y.; Qi, S.; Liu, X.; Zhang, J.; Zhao, J. Development and characterization of simple sequence repeat markers for, and genetic diversity analysis of Liquidambar formosana. Forests 2020, 11, 203. [Google Scholar] [CrossRef] [Green Version]
  31. Chen, F.; Hu, Y.; Vannozzi, A.; Wu, K.; Cai, H.; Qin, Y.; Mullis, A.; Lin, Z.; Zhang, L. The WRKY transcription factor family in model plants and crops. Crit. Rev. Plant Sci. 2018, 36, 311–335. [Google Scholar] [CrossRef]
  32. Wang, B.; Tseng, E.; Regulski, M.; Clark, T.A.; Hon, T.; Jiao, Y.; Lu, Z.; Olson, A.; Stein, J.C.; Ware, D. Unveiling the complexity of the maize transcriptome by single-molecule long-read sequencing. Nat. Commun. 2016, 7, 11708. [Google Scholar] [CrossRef] [PubMed] [Green Version]
  33. Liu, X.; Mei, W.; Soltis, P.S.; Soltis, D.E.; Barbazuk, W.B. Detecting alternatively spliced transcript isoforms from single-molecule long-read sequences without a reference genome. Mol. Ecol. Resour. 2017, 17, 1243–1256. [Google Scholar] [CrossRef] [PubMed]
  34. Ge, Y.; Cheng, Z.; Si, X.; Ma, W.; Tan, L.; Zang, X.; Wu, B.; Xu, Z.; Wang, N.; Zhou, Z.; et al. Transcriptome profiling provides insight into the genes in carotenoid biosynthesis during the mesocarp and seed developmental stages of avocado (Persea americana). Int. J. Mol. Sci. 2019, 20, 4117. [Google Scholar] [CrossRef] [PubMed] [Green Version]
  35. Hu, H.; Yang, W.; Zheng, Z.; Niu, Z.; Yang, Y.; Wan, D.; Liu, J.; Ma, T. Analysis of alternative splicing and alternative polyadenylation in Populus alba var. pyramidalis by single-molecular long-read sequencing. Front. Genet. 2020, 11, 48. [Google Scholar] [CrossRef]
  36. Luo, D.; Zhou, Q.; Wu, Y.; Chai, X.; Liu, W.; Wang, Y.; Yang, Q.; Wang, Z.; Liu, Z. Full-length transcript sequencing and comparative transcriptomic analysis to evaluate the contribution of osmotic and ionic stress components towards salinity tolerance in the roots of cultivated alfalfa (Medicago sativa L.). BMC Plant Biol. 2019, 19, 32. [Google Scholar] [CrossRef] [Green Version]
  37. Deng, N.; Hou, C.; Ma, F.; Liu, C.; Tian, Y. Single-molecule long-read sequencing reveals the diversity of full-length transcripts in leaves of Gnetum (Gnetales). Int. J. Mol. Sci. 2019, 20, 6350. [Google Scholar] [CrossRef] [Green Version]
  38. Kang, S.H.; Lee, J.Y.; Lee, T.H.; Park, S.Y.; Kim, C.K. De novo transcriptome assembly of the Chinese pearl barley, adlay, by full-length isoform and short-read RNA sequencing. PLoS ONE 2018, 13, e0208344. [Google Scholar] [CrossRef]
  39. Hallegger, M.; Llorian, M.; Smith, C.W. Alternative splicing: Global insights. FEBS J. 2010, 277, 856–866. [Google Scholar] [CrossRef] [Green Version]
  40. McManus, C.J.; Graveley, B.R. RNA structure and the mechanisms of alternative splicing. Curr. Opin. Genet. Dev. 2011, 21, 373–379. [Google Scholar] [CrossRef] [Green Version]
  41. Reddy, A.S.; Marquez, Y.; Kalyna, M.; Barta, A. Complexity of the alternative splicing landscape in plants. Plant Cell 2013, 25, 3657–3683. [Google Scholar] [CrossRef] [PubMed] [Green Version]
  42. Li, Y.; Dai, C.; Hu, C.; Liu, Z.; Kang, C. Global identification of alternative splicing via comparative analysis of SMRT- and Illumina-based RNA-seq in strawberry. Plant J. 2017, 90, 164–176. [Google Scholar] [CrossRef] [PubMed] [Green Version]
  43. Chaudhary, S.; Jabre, I.; Reddy, A.S.N.; Staiger, D.; Syed, N.H. Perspective on alternative splicing and proteome complexity in plants. Trends Plant Sci. 2019, 24, 496–506. [Google Scholar] [CrossRef] [PubMed]
  44. Zhang, Q.; Zhang, X.; Wang, S.; Tan, C.; Zhou, G.; Li, C. Involvement of alternative splicing in barley seed germination. PLoS ONE 2016, 11, e0152824. [Google Scholar] [CrossRef] [Green Version]
  45. Chao, Q.; Gao, Z.; Zhang, D.; Zhao, B.; Dong, F.; Fu, C.; Liu, L.; Wang, B. The developmental dynamics of the Populus stem transcriptome. Plant Biotechnol. J. 2019, 17, 206–219. [Google Scholar] [CrossRef] [Green Version]
  46. Qian, X.; Sun, Y.; Zhou, G.; Yuan, Y.; Li, J.; Huang, H.; Xu, L.; Li, L. Single-molecule real-time transcript sequencing identified flowering regulatory genes in Crocus sativus. BMC Genom. 2019, 20, 857. [Google Scholar] [CrossRef]
  47. Li, Y.; Mi, X.; Zhao, S.; Zhu, J.; Guo, R.; Xia, X.; Liu, L.; Liu, S.; Wei, C. Comprehensive profiling of alternative splicing landscape during cold acclimation in tea plant. BMC Genom. 2020, 21, 65. [Google Scholar] [CrossRef] [Green Version]
  48. Steijger, T.; Abril, J.F.; Engstrom, P.G.; Kokocinski, F.; Consortium, R.; Hubbard, T.J.; Guigo, R.; Harrow, J.; Bertone, P. Assessment of transcript reconstruction methods for RNA-seq. Nat. Methods 2013, 10, 1177–1184. [Google Scholar] [CrossRef] [Green Version]
  49. Shang, X.; Cao, Y.; Ma, L. Alternative splicing in plant genes: A means of regulating the environmental fitness of plants. Int. J. Mol. Sci. 2017, 18, 432. [Google Scholar] [CrossRef]
  50. Zhao, L.; Zhang, H.; Kohnen, M.V.; Prasad, K.; Gu, L.; Reddy, A.S.N. Analysis of transcriptome and epitranscriptome in plants using PacBio Iso-Seq and Nanopore-Based direct RNA sequencing. Front. Genet. 2019, 10, 253. [Google Scholar] [CrossRef] [Green Version]
  51. Wang, M.; Wang, P.; Liang, F.; Ye, Z.; Li, J.; Shen, C.; Pei, L.; Wang, F.; Hu, J.; Tu, L.; et al. A global survey of alternative splicing in allopolyploid cotton: Landscape, complexity and regulation. New Phytol. 2018, 217, 163–178. [Google Scholar] [CrossRef] [PubMed] [Green Version]
  52. Abdel-Ghany, S.E.; Hamilton, M.; Jacobi, J.L.; Ngam, P.; Devitt, N.; Schilkey, F.; Ben-Hur, A.; Reddy, A.S. A survey of the sorghum transcriptome using single-molecule long reads. Nat. Commun. 2016, 7, 11706. [Google Scholar] [CrossRef] [PubMed] [Green Version]
  53. Wei, J.; Cao, H.; Liu, J.D.; Zuo, J.H.; Fang, Y.; Lin, C.T.; Sun, R.Z.; Li, W.L.; Liu, Y.X. Insights into transcriptional characteristics and homoeolog expression bias of embryo and de-embryonated kernels in developing grain through RNA-Seq and Iso-Seq. Funct. Integr. Genom. 2019, 19, 919–932. [Google Scholar] [CrossRef] [PubMed]
  54. Li, S.; Yu, X.; Cheng, Z.; Zeng, C.; Li, W.; Zhang, L.; Peng, M. Large-scale analysis of the cassava transcriptome reveals the impact of cold stress on alternative splicing. J. Exp. Bot. 2020, 71, 422–434. [Google Scholar] [CrossRef]
  55. Wang, B.; Regulski, M.; Tseng, E.; Olson, A.; Goodwin, S.; McCombie, W.R.; Ware, D. A comparative transcriptional landscape of maize and sorghum obtained by single-molecule sequencing. Genome Res. 2018, 28, 921–932. [Google Scholar] [CrossRef] [Green Version]
  56. Long, Y.; Wang, X.; Youmans, D.T.; Cech, T.R. How do lncRNAs regulate transcription? Sci. Adv. 2017, 3, eaao2110. [Google Scholar] [CrossRef] [Green Version]
  57. Cui, J.; Luan, Y.; Jiang, N.; Bao, H.; Meng, J. Comparative transcriptome analysis between resistant and susceptible tomato allows the identification of lncRNA16397 conferring resistance to Phytophthora infestans by co-expressing glutaredoxin. Plant J. 2017, 89, 577–589. [Google Scholar] [CrossRef] [Green Version]
  58. Rai, M.I.; Alam, M.; Lightfoot, D.A.; Gurha, P.; Afzal, A.J. Classification and experimental identification of plant long non-coding RNAs. Genomics 2019, 111, 997–1005. [Google Scholar] [CrossRef]
  59. Tian, J.; Feng, S.; Liu, Y.; Zhao, L.; Tian, L.; Hu, Y.; Yang, T.; Wei, A. Single-molecule long-read sequencing of Zanthoxylum bungeanum Maxim. transcriptome: Identification of aroma-related genes. Forests 2018, 9, 765. [Google Scholar] [CrossRef] [Green Version]
  60. Deng, F.; Zhang, X.; Wang, W.; Yuan, R.; Shen, F. Identification of Gossypium hirsutum long non-coding RNAs (lncRNAs) under salt stress. BMC Plant Biol. 2018, 18, 23. [Google Scholar] [CrossRef]
  61. Chen, R.; Li, M.; Zhang, H.; Duan, L.; Sun, X.; Jiang, Q.; Zhang, H.; Hu, Z. Continuous salt stress-induced long non-coding RNAs and DNA methylation patterns in soybean roots. BMC Genom. 2019, 20, 730. [Google Scholar] [CrossRef] [PubMed] [Green Version]
  62. Li, J.; Harata-Lee, Y.; Denton, M.D.; Feng, Q.; Rathjen, J.R.; Qu, Z.; Adelson, D.L. Long read reference genome-free reconstruction of a full-length transcriptome from Astragalus membranaceus reveals transcript variants involved in bioactive compound biosynthesis. Cell Discov. 2017, 3, 17031. [Google Scholar] [CrossRef] [PubMed]
  63. Cheng, B.; Furtado, A.; Henry, R.J. Long-read sequencing of the coffee bean transcriptome reveals the diversity of full-length transcripts. Gigascience 2017, 6, 1–13. [Google Scholar] [CrossRef] [PubMed] [Green Version]
  64. El Bahloul, Y.; Dauchot, N.; Machtoun, I.; Gaboun, F.; Van Cutsem, P. Development and characterization of microsatellite loci for the Moroccan endemic endangered species Argania spinosa (Sapotaceae). Appl. Plant Sci. 2014, 2, 1300071. [Google Scholar] [CrossRef]
  65. Jo, S.; Kim, H.-W.; Kim, Y.-K.; Cheon, S.-H.; Kim, K.-J. The first complete plastome sequence from the family Sapotaceae, Pouteria campechiana(Kunth) Baehni. Mitochondrial DNA B 2016, 1, 734–736. [Google Scholar] [CrossRef] [Green Version]
  66. Li, S.; Zhang, X.; Wang, H.; Zhu, Z.; Wang, H. Complete plastome sequence of Manilkara zapota (L.) P.Royen (Sapotaceae). Mitochondrial DNA B 2019, 4, 3114–3115. [Google Scholar] [CrossRef] [Green Version]
  67. Niu, Y.; Ni, S.; Liu, Z.; Zheng, C.; Mao, C.; Shi, C.; Liu, J. The complete chloroplast genome of tropical and sub-tropical fruit tree Lucuma nervosa (Sapotaceae). Mitochondrial DNA B 2018, 3, 440–441. [Google Scholar] [CrossRef] [Green Version]
  68. Wang, Y.; Yuan, X.; Chen, Z.; Luo, T. The complete chloroplast genome sequence of Vitellaria paradoxa. Mitochondrial DNA B 2019, 4, 2403–2404. [Google Scholar] [CrossRef] [Green Version]
  69. Han, Z.; Wang, B.; Tian, L.; Wang, S.; Zhang, J.; Guo, S.; Zhang, H.; Xu, L.; Chen, Y. Comprehensive dynamic transcriptome analysis at two seed germination stages in maize (Zea mays L.). Physiol. Plant. 2020, 168, 205–217. [Google Scholar] [CrossRef]
  70. Kushwaha, S.K.; Grimberg, A.; Carlsson, A.S.; Hofvander, P. Charting oat (Avena sativa) embryo and endosperm transcription factor expression reveals differential expression of potential importance for seed development. Mol. Genet. Genom. 2019, 294, 1183–1197. [Google Scholar] [CrossRef] [Green Version]
  71. Song, Q.; Cheng, S.; Chen, Z.; Nie, G.; Xu, F.; Zhang, J.; Zhou, M.; Zhang, W.; Liao, Y.; Ye, J. Comparative transcriptome analysis revealing the potential mechanism of seed germination stimulated by exogenous gibberellin in Fraxinus hupehensis. BMC Plant Biol. 2019, 19, 199. [Google Scholar] [CrossRef] [PubMed] [Green Version]
  72. Liew, L.C.; Narsai, R.; Wang, Y.; Berkowitz, O.; Whelan, J.; Lewsey, M.G. Temporal tissue-specific regulation of transcriptomes during barley (Hordeum vulgare) seed germination. Plant J. 2020, 101, 700–715. [Google Scholar] [CrossRef] [PubMed]
  73. Groszmann, M.; Bylstra, Y.; Lampugnani, E.R.; Smyth, D.R. Regulation of tissue-specific expression of SPATULA, a bHLH gene involved in carpel development, seedling germination, and lateral organ growth in Arabidopsis. J. Exp. Bot. 2010, 61, 1495–1508. [Google Scholar] [CrossRef] [PubMed] [Green Version]
  74. Wu, Q.; Bai, X.; Wu, X.; Xiang, D.; Wan, Y.; Luo, Y.; Shi, X.; Li, Q.; Zhao, J.; Qin, P.; et al. Transcriptome profiling identifies transcription factors and key homologs involved in seed dormancy and germination regulation of Chenopodium quinoa. Plant Physiol. Biochem. 2020, 151, 443–456. [Google Scholar] [CrossRef] [PubMed]
  75. Wang, Y.; Htwe, Y.M.; Li, J.; Shi, P.; Zhang, D.; Zhao, Z.; Ihase, L.O. Integrative omics analysis on phytohormones involved in oil palm seed germination. BMC Plant Biol. 2019, 19, 363. [Google Scholar] [CrossRef] [PubMed]
  76. Kurita, M.; Mishima, K.; Tsubomura, M.; Takashima, Y.; Nose, M.; Hirao, T.; Takahashi, M. Transcriptome analysis in male strobilus induction by gibberellin treatment in Cryptomeria japonica D. Don. Forests 2020, 11, 633. [Google Scholar] [CrossRef]
  77. Gazara, R.K.; de Oliveira, E.A.G.; Rodrigues, B.C.; Nunes da Fonseca, R.; Oliveira, A.E.A.; Venancio, T.M. Transcriptional landscape of soybean (Glycine max) embryonic axes during germination in the presence of paclobutrazol, a gibberellin biosynthesis inhibitor. Sci. Rep. 2019, 9, 9601. [Google Scholar] [CrossRef] [Green Version]
  78. Li, X.; Liu, S.; Yuan, G.; Zhao, P.; Yang, W.; Jia, J.; Cheng, L.; Qi, D.; Chen, S.; Liu, G. Comparative transcriptome analysis provides insights into the distinct germination in sheepgrass (Leymus chinensis) during seed development. Plant Physiol. Biochem. 2019, 139, 446–458. [Google Scholar] [CrossRef]
  79. Shen, Q.; Zhang, S.; Liu, S.; Chen, J.; Ma, H.; Cui, Z.; Zhang, X.; Ge, C.; Liu, R.; Li, Y.; et al. Comparative transcriptome analysis provides insights into the seed germination in cotton in response to chilling stress. Int. J. Mol. Sci. 2020, 21, 2067. [Google Scholar] [CrossRef] [Green Version]
  80. Lin, J.; Shi, X.; Fang, S.; Zhang, Y.; You, C.; Ma, H.; Lin, F. Comparative transcriptome analysis combining SMRT and NGS sequencing provides novel insights into sex differentiation and development in mud crab (Scylla paramamosain). Aquaculture 2019, 513, 734447. [Google Scholar] [CrossRef]
Figure 1. Images of Madhuca pasquieri (Dubard) Lam., which was used for sequencing, and the workflows used in this study.
Forests 11 00866 g001
Figure 2. The length distribution of PacBio single-molecule long-read (SMRT) sequencing. (a) Length distribution of circular consensus sequences (CCSs). (b) Length distribution of consensus isoforms. (c) Length distribution of isoforms sequences.
Forests 11 00866 g002
Figure 3. Comparison of PacBio and Illumina data. (a) The number of transcripts detected by PacBio and Illumina. (b) Comparison between the M. pasquieri PacBio transcript isoforms and de novo transcript unigenes. (c) Boxplot showing the length of transcript isoforms in PacBio and transcript unigenes in Illumina. (d) Boxplot showing the expression level of transcript isoforms in PacBio and transcript unigenes in Illumina.
Forests 11 00866 g003
Figure 4. The length distribution of coding sequences (CDSs).
Forests 11 00866 g004
Figure 5. Distribution of simple sequence repeat (SSR) nucleotide classes among different nucleotide types in the transcriptome of M. pasquieri. (a) Distribution statistics for six types of SSRs from M. pasquieri. (b) The proportion of SSRs of different types of tandem repeat elements in total SSRs.
Forests 11 00866 g005
Figure 6. Analysis of alternative splicing (AS) events in the M. pasquieri transcriptome. (a) Schematic representation of five AS modes. (b) The number and percentage of different types of AS events detected by PacBio. A3, alternative 3′ splice site; A5, alternative 5′ splice site; AF, alternative first exon; RI, retained intron; SE, skipping exon. (c) Statistics for the isoforms of some genes. (d) Sequence analysis of different COGENT000951 isoforms. (e) Sequence analysis of different COGENT002109 isoforms.
Forests 11 00866 g006
Figure 7. Identification of M. pasquieri long non-coding RNAs (lncRNA). (a) Venn diagram of lncRNAs predicted by CNCI, CPAT, CPC, and Pfam computational approaches. (b) Length distribution of identified lncRNAs.
Forests 11 00866 g007
Figure 8. Functional annotation of corrected isoforms. (a) Venn diagram of annotated result in four different databases, Nr, Swissprot, KOG, and KEGG. (b) Distribution diagram showing the top ten Nr homologous species of transcripts.
Forests 11 00866 g008
Figure 9. Gene ontology enrichment analysis of M. pasquieri transcript sequences.
Forests 11 00866 g009
Figure 10. KEGG metabolic pathway classification of M. pasquieri PacBio transcript isoforms and de novo transcript unigenes.
Forests 11 00866 g010
Table 1. Statistics for the transcriptional factor (TF) family predicted by Illumina and PacBio in M. pasquieri.
FamilyPacBioIlluminaFamilyPacBioIlluminaFamilyPacBioIllumina
ERF121154TCP1328ARR-B28
WRKY9683BBR-BPC129CPP211
GRAS8788ARF1124LSD28
NAC7199B31137M-type222
bHLH70172BES11110S1Fa-like26
C3H6872DBB1013YABBY29
bZIP49141Dof942CAMTA17
C2H246241GeBP96E2F/DP17
MYB_related4582CO-like612GRF111
TALE3829ZF-HD622HB-other111
MYB28124FAR1538Whirly13
EIL276LBD532HB-PHD02
HD-ZIP2555NF-YA511HRT-like01
Trihelix2547NF-YB530LFY01
GATA2348SBP522SAP02
Nin-like1913AP2420SRS08
G2-like1840RAV42STAT01
HSF1732WOX45
NF-YC1418NF-X132
MIKC1320VOZ31

