Article

Regular Biochar and Bacteria-Inoculated Biochar Alter the Composition of the Microbial Community in the Soil of a Chinese Fir Plantation

1
Research Institute of Forestry, Chinese Academy of Forestry, Beijing 100091, China
2
State Key Laboratory of Tree Genetics and Breeding, State Forestry and Grassland Administration, Beijing 100091, China
3
Key Laboratory of Tree Breeding and Cultivation of State Forestry Administration, Chinese Academy of Forestry, Beijing 100091, China
*
Author to whom correspondence should be addressed.
Forests 2020, 11(9), 951; https://doi.org/10.3390/f11090951
Submission received: 20 July 2020 / Revised: 26 August 2020 / Accepted: 26 August 2020 / Published: 31 August 2020
(This article belongs to the Section Forest Ecology and Management)

Abstract

:
Biochar is a promising material for the improvement of soil quality. However, studies on biochar have mostly been carried out in laboratory conditions or have focused on agricultural aspects. The impacts of the application of biochar on soil characteristics and related ecological processes of the forest ecosystem have not been fully resolved. In this study, we investigated the effects of regular biochar and bacteria-loaded biochar on the microbial communities in the bulk soil and the rhizosphere soil of an annual Chinese fir plantation. In early spring (April), the two types of biochar were added to the soil at the rates of 2.22 t·ha−1, 4.44 t·ha−1, 6.67 t·ha−1, 8.89 t·ha−1, and 11.11 t·ha−1 by ring furrow application around the seedlings, and soil samples were collected at the end of autumn (November). The results showed that biochar addition increased the soil nutrient content and promoted the growth and diversity of soil microbial communities. The diversity of soil fungi was significantly increased, and the diversity of soil bacteria was significantly decreased. Principal component analysis under the different biochar types and application rates demonstrated that microbial communities differed significantly between the treatments and controls and that the effect of biochar on the microbial community of the bulk soil was more significant than that of the rhizosphere soil. Under the same dosage, the effect of bacteria-loaded biochar on soil was more significant than that of regular biochar.

1. Introduction

Maintaining plant health and promoting plant productivity are the abilities of healthy soil [1]. However, many plantations with rapid growth and intensive management have resulted in areas with soil nutrient deficiency. In recent decades in particular, the rapid extension of plantations that mainly involve clear cutting, conversion of natural forests into pure forests, repeated planting of the same tree species, and the enforcement of long-term intensive plantation management has deteriorated soil health and reduced productivity [2,3,4], drawing attention to the need for long-term soil quality and sustainable production systems [5].
Chinese fir (Cunninghamia lanceolate (Lamb.), Hook), is one of the most important tree species for timber production in southern China due to its high yield and excellent wood quality. It is a fast-growing, evergreen coniferous tree. Therefore, native forests are often transformed into pure Chinese fir plantations. Furthermore, successive rotations of the fir are grown at the same site and this results in severe deterioration of the soil, particularly soil nutrients, soil enzyme activity, and microbial quantity and diversity, causing productivity to be seriously reduced [6,7,8]. Thus, scholars have suggested that using fertilizers in Chinese fir plantations can supply nutrients and maintain yield between the first and second rotations [9]. Extending the rotation length by five years may also benefit the soil nutrient status of Chinese fir plantations [10]. However, long-term fertilization will reduce soil microbial activity, cause soil degradation, and reduce crop yields [11], while extending the rotation length will require a substantial amount of time [12,13]. Therefore, it is critical to find cost-effective, environmentally friendly, and sustainable ways to enhance plantation productivity while preventing natural soil degradation.
Biochar is the solid, carbon-rich product of heating biomass with the exclusion of air (pyrolysis or “charring”) [14]. It has a high proportion of aromatic carbon [15] and high chemical and biological stability [16]. Research on biochar has increased in recent years, and because of its high porosity, large specific surface area, adsorption ability, and high cation exchange capacity [17,18], biochar has been applied in various fields [19]. Most nutrients (minerals and nitrogen) from the raw biomass are largely retained in the solid biochar after pyrolysis [20]. Therefore, a key attraction of biochar is that it can enhance the fertility and resilience of cropland [14].
Many studies have evaluated and demonstrated the ability of biochar to improve soil physical and biochemical characteristics, enhance stability and organic carbon stock, stimulate soil microbial activity, and reduce greenhouse gas emissions [15,17,21]. In addition, as biochar amendments alter soil microbial biomass, activity, and community composition [6,22,23], they have the potential to restore soil health and increase yield [11,24]. Further, the raw materials and pyrolysis conditions used in the production of biochar, and the dosages, mixing methods, and even climatic conditions under which it is applied have complex effects on the soil, affecting its performance in agricultural and forestry systems [15,25]. The main mechanisms responsible for the change in forest soil microbial communities because of using various biochar amendments have been reviewed by several researchers. Mitchell et al. [26] reported that, in temperate forest soil, biochar application at the rate of 10 and 20 t ha−1 resulted in significant increase of the bacterial/fungal ratio and a decrease in the Gram-negative/Gram-positive bacterial ratio. After three years of using biochar in a temperate hardwood forest, the concentration of fungal PLFA increased significantly [27]. Interestingly, it was found that the application of biochar had no significant effect on the composition of bacterial and fungal communities in the same research area [28]. Some studies showed that the application of biochar pyrolyzed from yeast enhances promoted fungi, while the glucose-derived biochar promotes the growth of soil bacteria [29]. These results indicate that the impact of biochar application on the structure of the soil microbial community is complicated, especially since the application of biochar influences soil physicochemical properties, which may then lead to complex interactions which affect soil microbial community characteristics.
Recently, biochar has become an ideal carrier material for microorganisms [30]. Bacteria inoculated biochar not only retains the advantages of the original biochar, but also improves its performance [19,30,31,32]. The combination of biochar and bioremediation with functional bacterial or fungal strains is considered an effective and emerging strategy for the sustainable remediation of degraded soil and for increased yield of crops [30,33]. Araujo et al. [34] reported that inoculation with native Bradyrhizobium strains formulated with biochar as the carrier improved the performance of pigeonpea (Cajanus cajan (Linn.) Millsp.). Many studies on the application of biochar in soil have been carried out in subject areas related to agriculture, grassland, heavy metals, and other fields [35,36,37], and most of these studies have been conducted in laboratories or greenhouses. In contrast, the effects of biochar on soil microbial communities in Chinese fir plantation under field conditions have rarely been reported [21,38].
The objectives of this study were to investigate the effects of different doses of regular biochar and bacteria-loaded biochar treatments on soil microbial community and nutrients in a Chinese fir plantation. The experiment was set up in a second-generation Chinese fir plantation built in early 2018 in Fenyi County, Jiangxi Province, China. We hypothesized that the application of regular biochar and bacteria-loaded biochar would alter soil physicochemical properties and microbial community, and that the different doses of biochar would have different effects on soil properties. In this study, we analyzed the soil microbial community in response to biochar amendments by using high-throughput amplicon sequencing. The aim of the study was to provide new insights into the amelioration of degenerated Chinese fir plantation soils via new and emerging methods and techniques using biochar.

2. Materials and Methods

2.1. Site Description and Experimental Design

The biochar experimental plots were set up in the Shanxia Forest Farm (27°47′8″ N, 114°34′42″ E) of the Experimental Center of Subtropical Forestry, Chinese Academy of Forestry, located in Fenyi County, Jiangxi Province, China. The region is characterized by a central subtropical monsoon climate with a mean annual temperature and precipitation of 17.5 °C and 1590.9 mm, respectively. The parent rock is mainly shale and the soil is characterized as typical red soil. The study area underwent prescribed burning and soil preparation at the end of 2017, and the second-generation Chinese fir plantation (one-year-old seedlings were provided by the Experimental Center of Subtropical Forestry, Chinese Academy of Forestry) was built in early 2018 with plant spacing of 1.5 × 1.5 m. The area was divided into plots and the background soil properties were measured in early April 2019; biochar was applied immediately after. The background soil physicochemical characteristics were as follows: moisture, 26.03% ± 2.46%; bulk density, 1.15 ± 0.03 g·cm−3; porosity, 50.06% ± 1.89%; pH 4.27 ± 0.27 (weight ratio of soil/water was 1/2.5); soil organic carbon (OC), 23.44 ± 5.07 g·kg−1; total nitrogen (TN), 1.42 ± 0.13 g·kg−1; total phosphorus (TP), 0.16 ± 0.00 g·kg−1; total potassium (TK), 19.90 ± 2.05 g·kg−1; available nitrogen (AN), 176.60 ± 49.64 mg·kg−1; available phosphorus (AP), 9.04 ± 2.38 mg·kg−1; and available potassium (AK), 60.31 ± 9.93 mg·kg−1.
The biochar was purchased from the International Center for Bamboo and Rattan, China. The chemical properties of the biochar are shown in Table 1. The bamboo biochar (B) was produced from bamboo at a final temperature of 700 °C for 1.5 h, had a particle size of 2 mm, and an ash content of 3.17%. The specific surface area was 287 m2·kg−1. The bacteria-loaded biochar (M) was made in the laboratory by inoculating bacteria using the bamboo biochar as the raw material; the microbial inoculant was a mixture of Bacillus strains, Lactic acid bacteria, and Actinobacteria. The above-mentioned three kinds of bacteria were inoculated from the mother liquor into the corresponding medium by 1/3 of each amount. After 3–5 days of cultivation, a bacterial suspension with a bacterial solution volume solubility of 2% was made; then, 5% of the amount was sprayed on B and fixed for 5–7 days at a temperature of 15–25 °C. The total bacterial biomass was approximately 1.5% of dry matter, of which around 50%, 25%, and 25% belonged to the Bacillus strains, Lactic acid bacteria, and Actinobacteria, respectively.
Three repetition blocks of 33 × 18 m were set on the southeast slope with a slope of 30–35°, and each block was divided into 11 plots of 3 × 18 m, each plot containing 24 Chinese fir seedlings (two rows with 12 trees in each row). In early April 2019, the treatments were administered to the plots as follows: B and M applied at the rate of 2.22 t ha−1 (B1 and M1, respectively), 4.44 t ha−1 (B2 and M2, respectively), 6.67 t ha−1 (B3 and M3, respectively), 8.89 t ha−1 (B4 and M4, respectively), 11.11 t ha−1 (B5 and M5, respectively), and blank control (0). The application was performed in the following manner: an annular ditch (0–10 cm) was dug under the canopy of each tree, and the respective amount of biochar and the soil were mixed evenly and sprinkled into the ditch.

2.2. Soil Sampling

Soil samples were collected in November 2019. Each bulk soil sample was a mixture of three individual soil cores (one from each end and one from the center of the plot), collected at a depth of 0–20 cm. Five Chinese fir seedlings were randomly selected from each plot. The loose soil present on the plants roots was shaken off and the remaining soil on the roots was collected; rhizosphere soil from all plants within the same treatment plot was mixed together evenly. The rhizosphere and bulk soils in the three repeated plots totaled 66 soil samples. All soil samples were immediately sieved (2 mm) and visible roots, plant residues, and stones were removed. A portion of each soil sample was placed into a 50-mL centrifuge tube and stored at −80 °C for microbial community analysis, and the remaining soil was air-dried and ground in order to measure soil properties. Hereafter, bulk soil samples of B and M treatments are referred to as BBS and MBS, and rhizosphere soil samples of B and M treatments are referred to as BRS and MRS, respectively.

2.3. Analyses of Soil Properties

Soil pH was measured using a soil water suspension (in a ratio of 1:2.5 w/v). Soil OC was determined by the K2Cr2O7-H2SO4 oxidation method [39]. TN was measured using a 2300 Kjeltec Analyzer Unit (FOSS, Höganäs, Sweden) [40]. Following previously described methods, TP and TK were extracted [8], AN content was determined [41], and AP and AK were extracted and assayed [42]. TP, TK, AP, and AK contents were measured by inductively coupled plasma emission spectrometry (Spectro Analytical Instruments, Spectro Arcos ICP, Kleve, Germany) [43,44].

2.4. Soil Microbial Community

The comparison between the fungal and bacterial communities was performed using high-throughput sequencing technology (Illumina HiSeq 2500, BioMarker Technologies Corporation, Beijing, China) (www.biomarker.com.cn). Soil DNA was extracted from the frozen soil samples by using the Power Soil DNA Isolation Kit (MoBio Laboratories, Carlsbad, CA, USA), following the manufacturer’s instructions. The ITS1 forward primer (5′-CTTGGTCATTTAGAGGAAGTAA-3′) and the ITS2 reverse primer (5′-GCTGCGTTCTTCATCGATGC-3′) were used for amplifying the fungal ITS1 barcode region, while the 338 forward primer (5′- ACTCCTACGGGAGGCAGCA-3′) and the 806 reverse primer (5′- GGACTACHVGGGTWTCTAAT-3′) were used for amplifying the bacterial V3–V4 barcode region. The polymerase chain reaction (PCR) parameters were as follows: denaturation at 95 °C for 5 min; 25 cycles of 95 °C for 30 s, 50 °C for 30 s, and 72 °C for 40 s; and final extension at 72 °C for 7 min. Amplicons were purified using a GeneJET Gel Extraction Kit (Thermo Scientific, Waltham, MA, USA) and quantified using a Qubit dsDNA HS Assay Kit (Life Technologies, Carlsbad, CA, USA). The raw paired-end reads were joined with FLASH (v.1.2.11) [45] and analyzed using QIIME (v.1.8.0) [46]. To study the microbial diversity information of the samples, clean tags were clustered at a 97% sequence similarity level using USEARCH in QIIME [47]. Different operational taxonomic units (OTUs) were obtained [48]; then, based on SILVA (bacteria) and UNITE (fungal) taxonomy databases, the OTUs were classified and annotated, and used to compute and plot rarefaction curves with the help of R (R v.3.8.2).

2.5. Statistical Analysis

An analysis of variance (ANOVA) was conducted using SPSS (Version 22.0) (IBM Co., New York, NY, USA) and was used to evaluate the differences in the soil properties and microbial community compositions between different treatments. Once a significant treatment effect was indicated (p < 0.05), a pairwise comparison between all treatments was performed using Tukey’s HSD test (α = 0.05). The alpha and beta diversity indices, the Chao1 richness estimator, the Shannon–Wiener diversity index, and the relationships between microbial alpha diversity and the soil’s chemical properties were calculated in Mothur version 1.30; Origin2018 was used to produce the figures. Principal component analysis (PCA) based on the OTU ordination plots was used to identify differences in fungal and bacterial community composition. Redundancy analysis (RDA) or canonical correlation analysis (CCA) was performed while taking into account the relationships of the microbial community, treatments, and environmental factors. The PCA and RDA/CCA analyses mentioned above were performed using the “vegan” package in R (R v.3.8.2).

3. Results

3.1. Soil Properties and Plant Growth

Biochar addition increased soil pH, OC, TN, and AK to some extent; the trends in TK and AP were opposite (Table 2). However, biochar addition had no significant effect on the chemical properties of the soil for both the rhizosphere and the bulk soils, regardless of biochar type (p < 0.05) (Table 2). The degrees of change in the pH and nutrients of the rhizosphere soils were larger than in the bulk soils. The effects on the soil properties by M application were more significant than those from B application at the same dosage (Table 2). In addition, the growth of the plants was not significantly influenced by one growing season of biochar addition. Though not significant, biochar addition, to some extent, increased growth in terms of height and diameter in B1 and M2 (Figure 1).

3.2. Soil Microbial Diversity and Its Relationships with Soil Properties

In total, 1,480,542 partial ITS rRNA quality sequences were assembled ranging from 48,428 to 71,389 sequences per sample (mean = 67,297); the read lengths ranged from 231 to 289 bp, with a mean length of 243 bp. All the sequences were clustered into 635 OTUs with a similarity threshold of 97%, and a mean of 399 OTUs per sample. In addition, 1,611,072 partial 16S rRNA quality sequences were assembled ranging from 42,897 to 75,787 sequences per sample (mean = 73,231); the read lengths ranged from 410 to 418 bp, with a mean length of 412 bp, all of which were clustered into 928 OTUs with a similarity threshold of 97% and an average of 761 OTUs per sample. The dilution curve based on the super optimal broth tended to be flat, indicating that the amount of microbial sequencing data was sufficient for representation. The dilution curve based on the Shannon index indicated that the samples could effectively reflect the diversity of the fungal and bacterial communities.
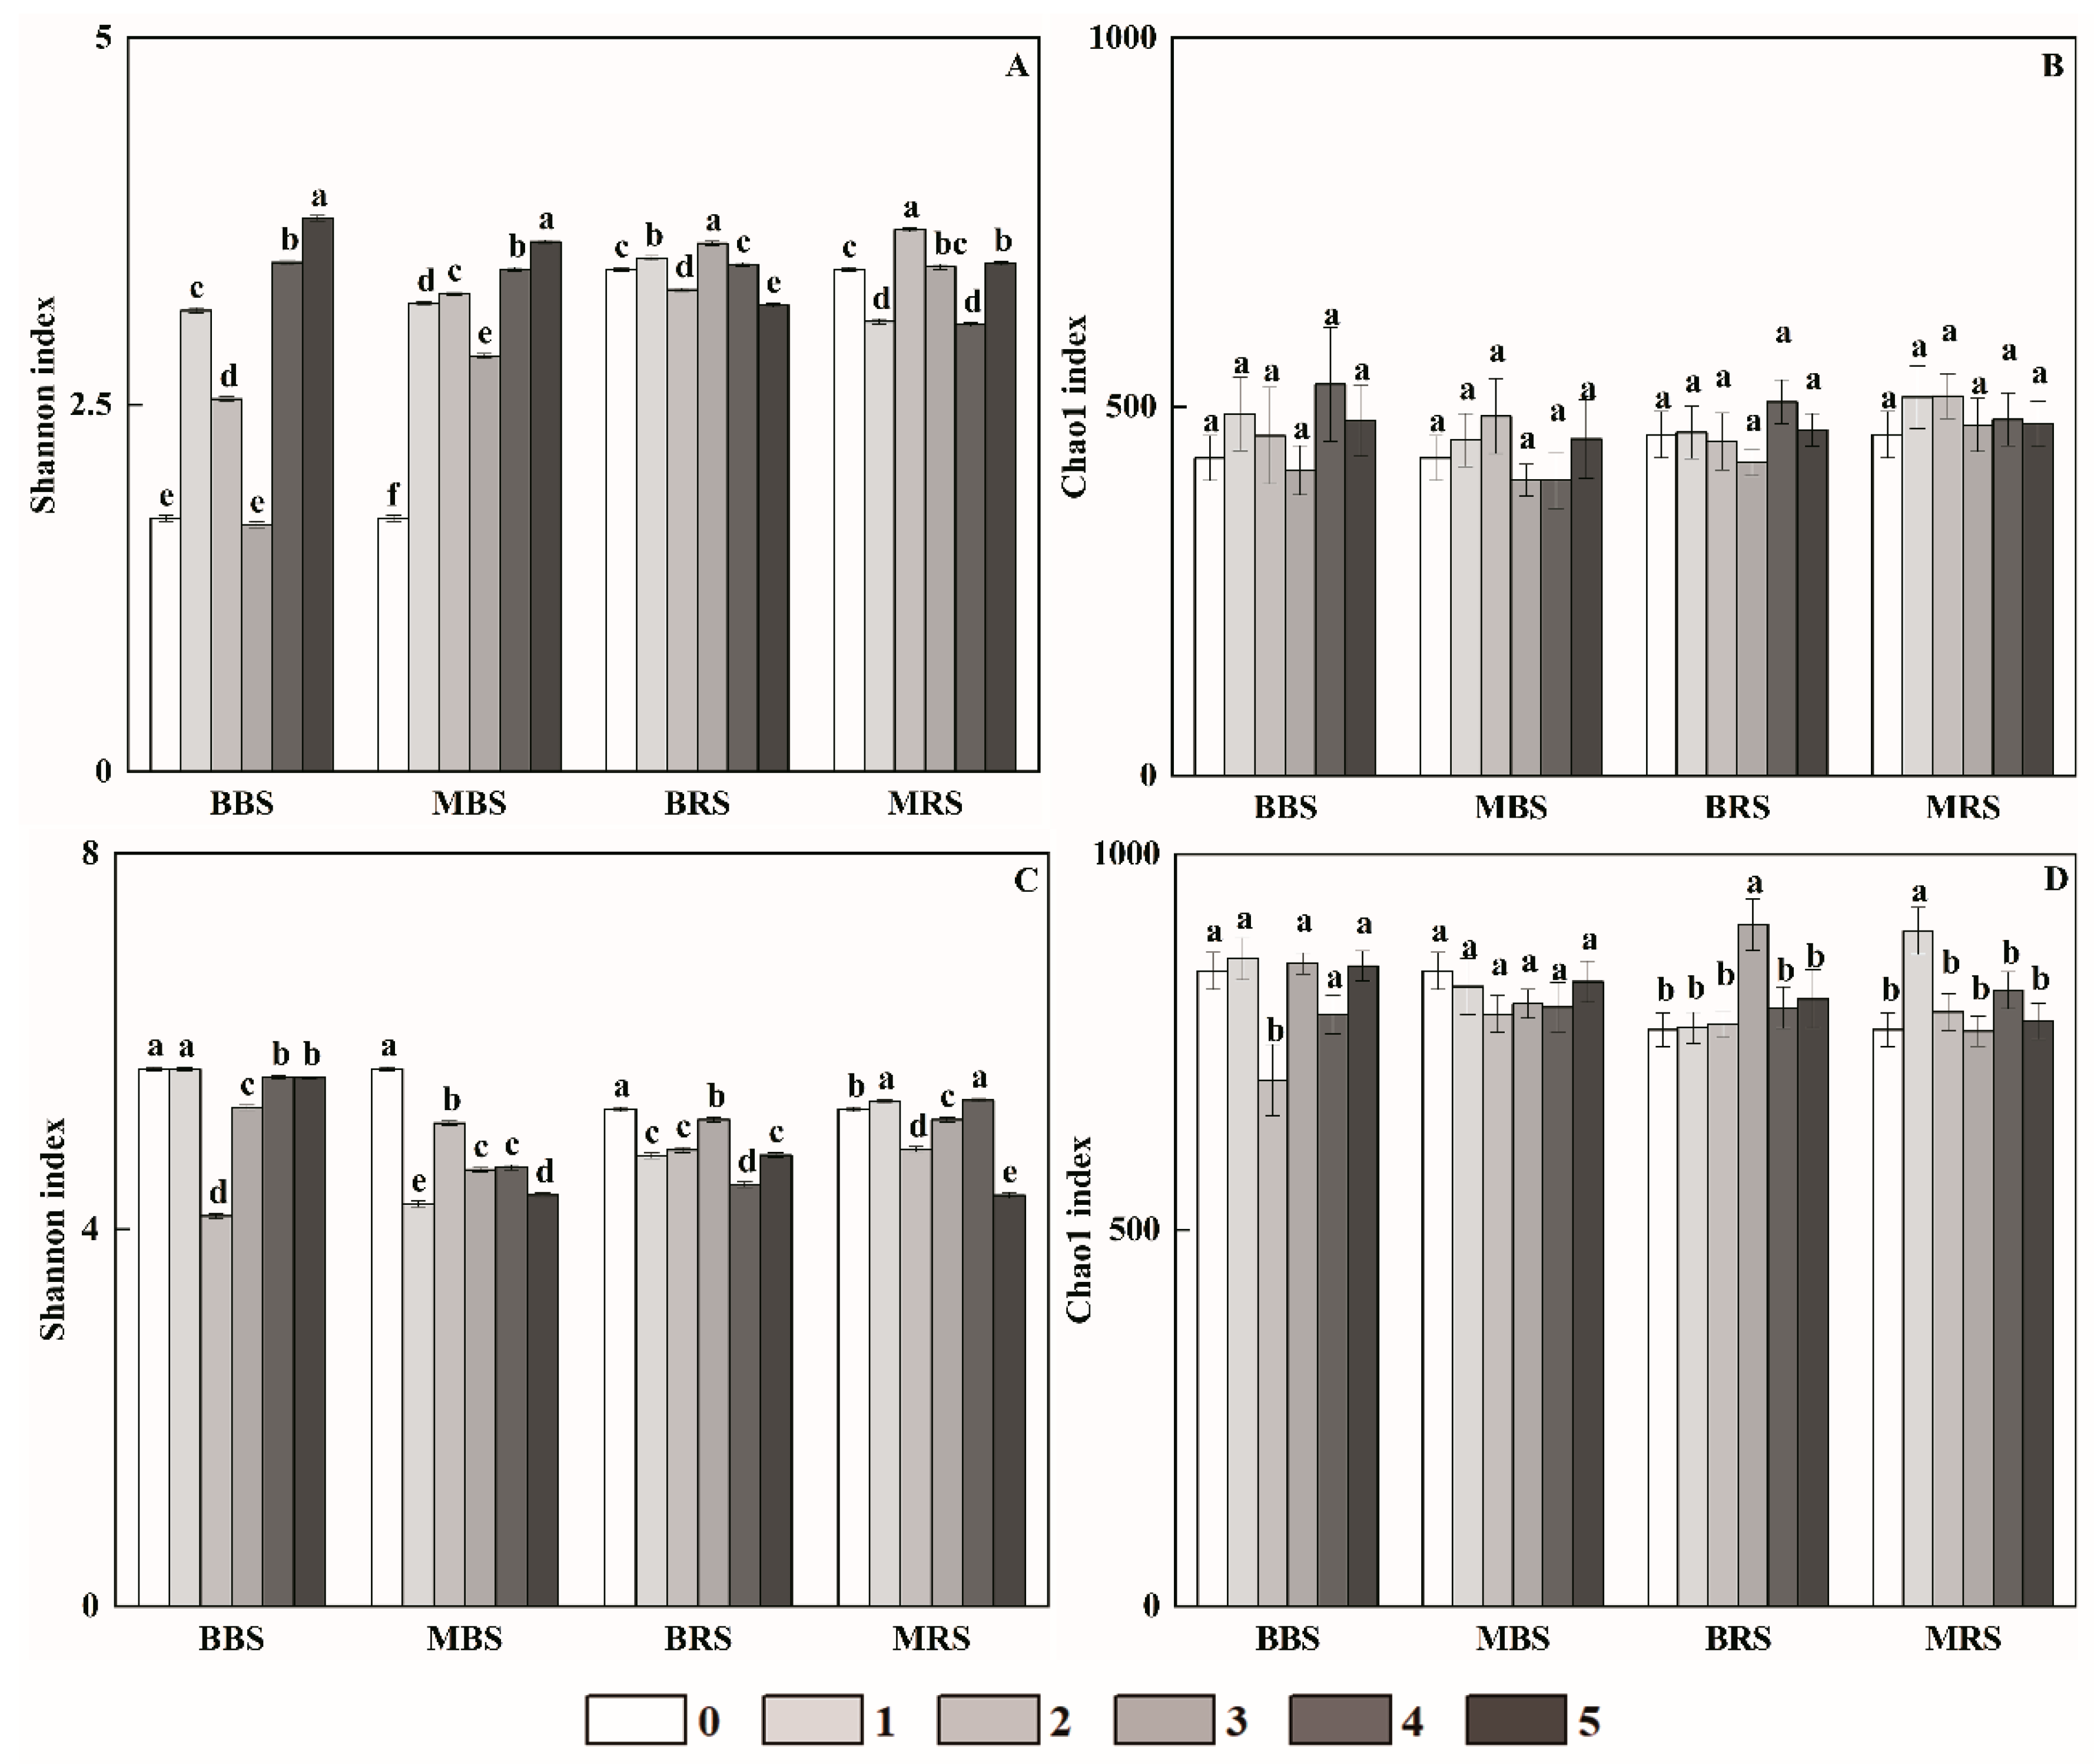
In the bulk soil samples, we found that all the treatments that were applied resulted in significantly more soil fungal diversity (Shannon index) than what was observed in the control, except for BBS3; in terms of bacterial diversity, the opposite trend was observed, except for BBS1 (Figure 2A,C). Fungal diversity showed a trend of first decreasing, and then increasing with the increase in biochar addition, regardless of the type of biochar. However, the fungal diversity in MBS2 and MBS3 was significantly greater than that in BBS2 and BBS3. The bacterial diversity of all treatments in the bulk soil was significantly lower than what was observed in the control, except for that in BBS2. In addition, the bacterial diversity in BBS was higher than that in MBS, except that the bacterial diversity of BBS2 was lower than that of MBS2. The fungal richness and bacterial richness (Chao1 index) of all treatments applied in the bulk soil were not significantly different from those of the control, except for BBS2, which had bacterial richness significantly lower than that of the control (Figure 2B,D).
Diversity and richness of fungi and bacteria in the rhizosphere soil were as follows. Bacterial diversity in the soil of BRS1, BRS3, and MRS2 was significantly higher than that in the control (Figure 2C). BRS presented significantly less bacterial diversity than what was found in the control; MRS1 and MRS4, however, had significantly more bacterial diversity than that of the control (Figure 2C). In addition, the richness of the rhizosphere soil bacterial and fungal communities was not significantly different between treatments and the control, except in BRS3 and MRS1 (Figure 2B,D).
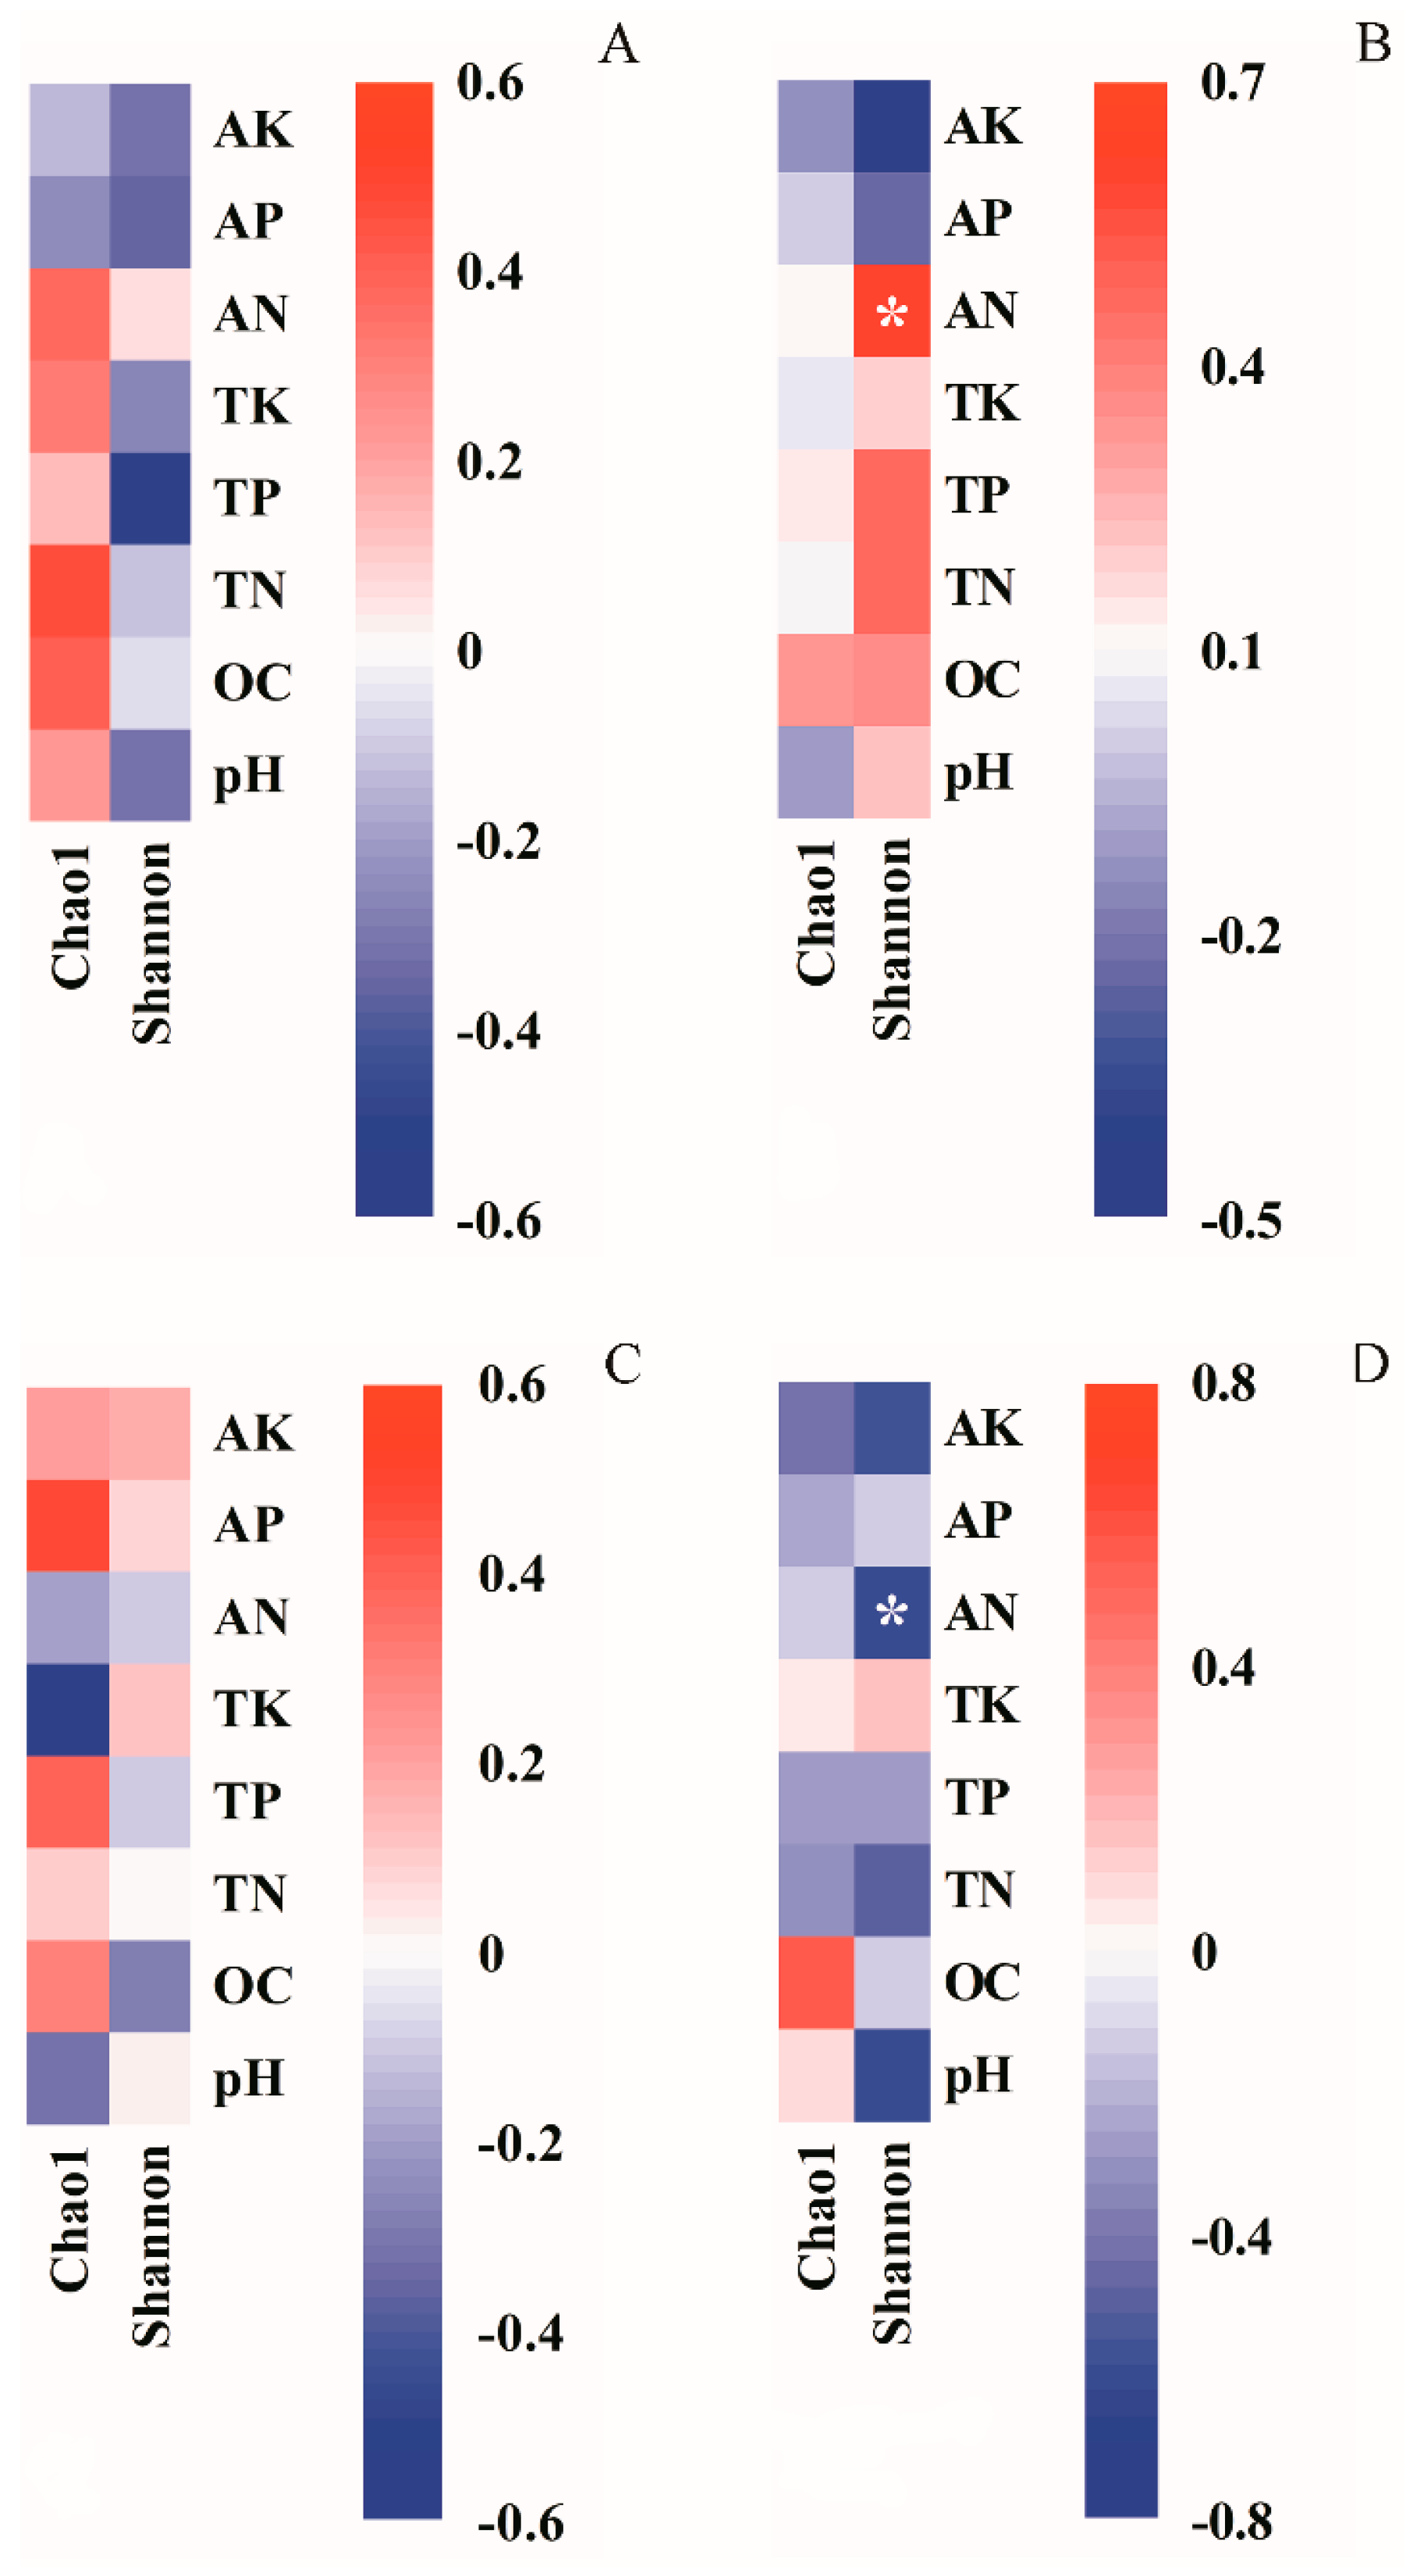
Biochar amendment changed microbial diversity and soil environmental characteristics. In this study, Pearson’s correlation analysis revealed that microbial diversity was primarily affected by environmental characteristics (including TN, TP, TK, AN, AP, AK, OC, and pH). As shown in Figure 3, in terms of bulk soil, most of the soil chemical variables had positive correlations with bacterial diversity, but a negative correlation with fungal diversity. The correlations were opposite for rhizosphere soil. The bacterial Shannon index of bulk soil was positively related to AN, and the bacterial Shannon index of rhizosphere soil was negatively related to AN (p < 0.05, Figure 3B,D); however, not all diversity indexes of fungi were significantly related to soil environmental characteristics (Figure 3A,C).

3.3. Taxonomic Classification and Relative Abundances of Fungi and Bacteria

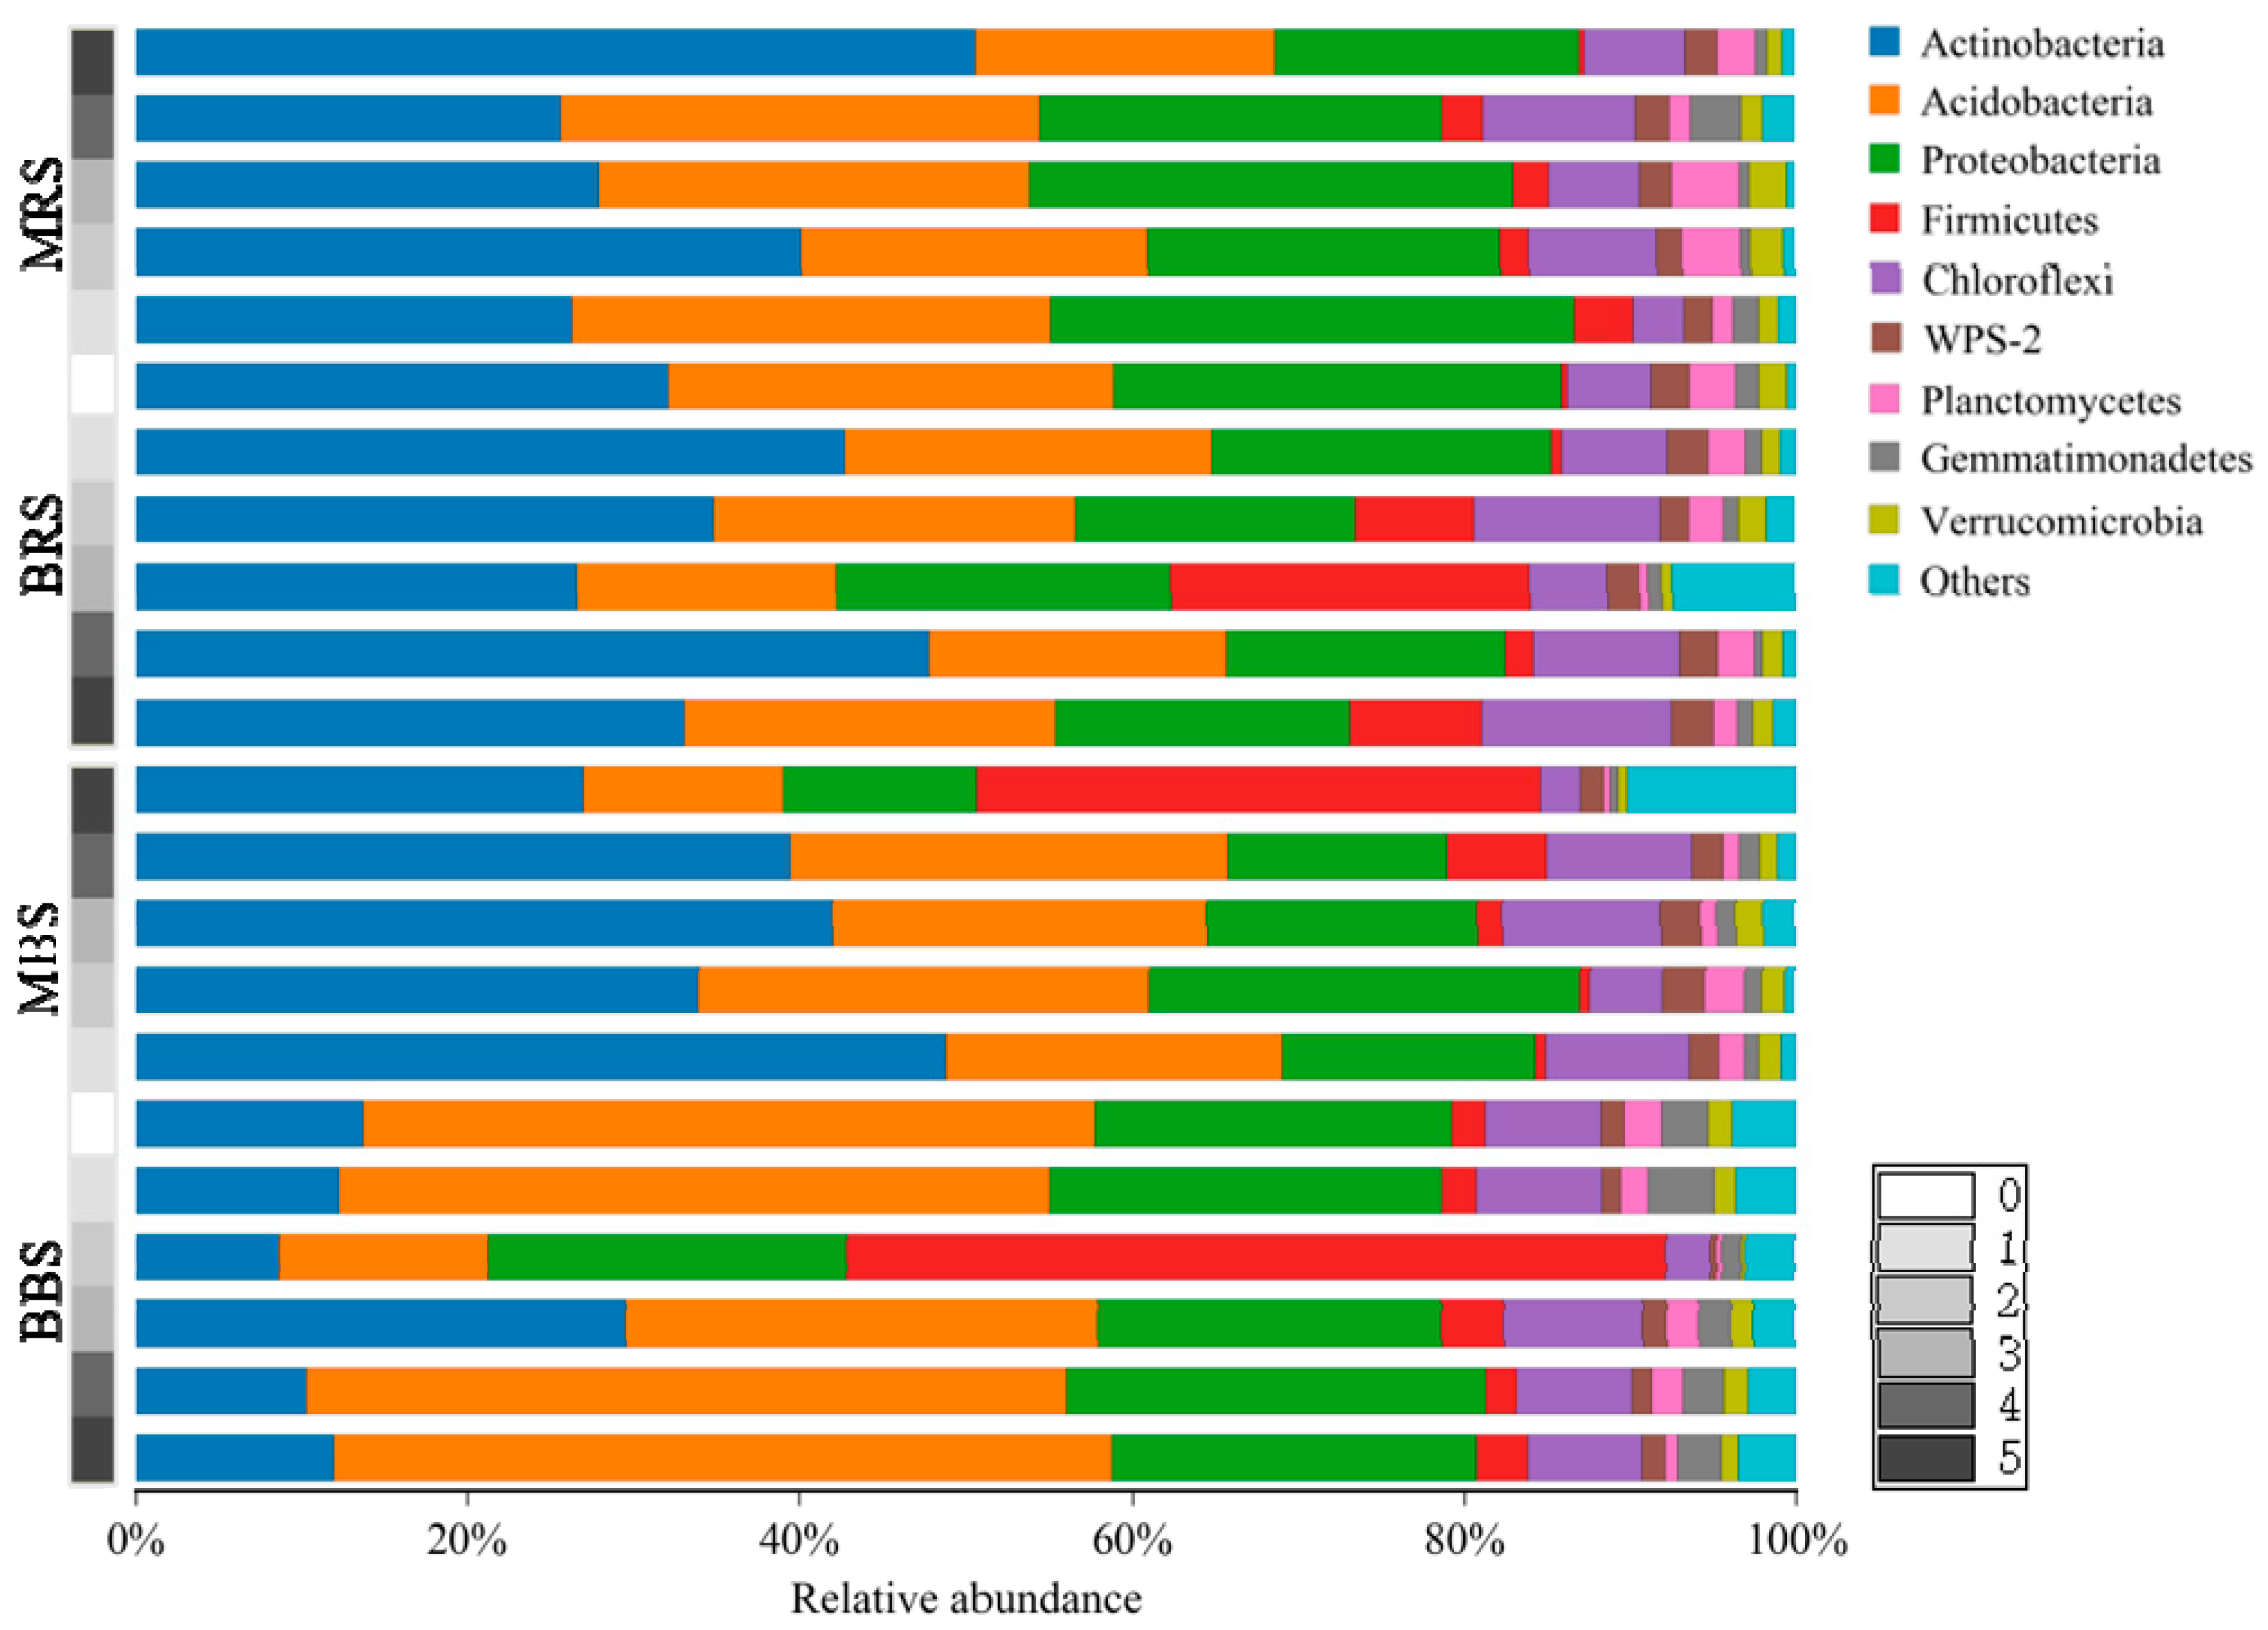
Eight fungal phyla and 20 bacterial phyla were detected by comparing the obtained sample sequences with those in the SILVA and UNITE databases (Figure 4 and Figure 5). The taxonomic analysis of the soil fungal communities treated with biochar revealed that there were three species of fungi with relative abundances greater than 1%, belonging to Ascomycota, Basidiomycota, and Mortierellomycota; their relative abundances ranged from 21.73% to 96.33% and 54.67% to 88.08%, from 1.91% to 63.60% and 2.58% to 24.58%, and from 0.53% to 27.08% and 1.51% to 23.67% across bulk soil and rhizosphere soil samples, respectively (Figure 4).
The relative abundances of different fungal phyla fluctuated with biochar treatments. The bulk soil with biochar addition presented significantly lower Ascomycota relative abundance and higher Basidiomycota relative abundance than the control, regardless of the biochar type. Moreover, there were no significant trends between BBS and the control for Mortierellomycota abundance. However, MBS presented significantly higher Mortierellomycota abundance than the control and BBS.
The analysis of the rhizosphere soil samples demonstrated that MRS3 presented a significantly higher Ascomycota abundance, but lower Mortierellomycota and Basidiomycota abundances than the control. The relative abundance of fungi in MRS4 was the opposite to that of MRS3. BRS1 and BRS3 presented significantly higher Mortierellomycota abundance and lower Ascomycota abundance than the control; BRS4 and BRS5 presented significantly lower Mortierellomycota abundance than the control. In addition, MRS1 and MRS3 presented significantly higher Ascomycota abundance than BRS1 and BRS3; however, samples from the other treatments presented the opposite trend. MRS4 and MRS5 presented significantly higher Mortierellomycota abundance than BRS4 and BRS5, while the samples from the other treatments presented the opposite trend. The relative abundance of basidiomycetes in the rhizosphere soil with M addition was higher than that in the rhizosphere soil with B addition.
The taxonomic analysis of soil bacterial communities treated with biochar addition showed that there were nine bacterial phyla with relative abundances greater than 1% (Figure 5). From the highest to the lowest abundance, these included Actinobacteria, Acidobacteria, Proteobacteria, Firmicutes, Chloroflexi, WPS-2, Planctomycetes, Gemmatimonadetes, and Verrucomicrobia.
The relative abundances of different bacterial phyla fluctuated with biochar treatments. MBS presented significantly higher Actinobacteria abundance and lower Acidobacteria abundance than the control. MBS further showed that Firmicutes increased with the addition of biochar; the Firmicute abundances in MBS4 and MBS5 were significantly higher than the control. BBS2 presented significantly higher Firmicute abundance and lower Acidobacteria abundance than the control while BBS3 presented significantly higher Actinobacteria and lower Acidobacteria abundances than the control. There was no significant difference in other bacterial phyla. BRS presented significantly higher Firmicute and Chloroflexi abundance and lower Acidobacteria and Proteobacteria abundance than the control. MRS1–MRS4 presented significantly higher Firmicutes than the control and MRS5 presented significantly higher Actinobacteria and lower Acidobacteria and Proteobacteria abundances than the control.
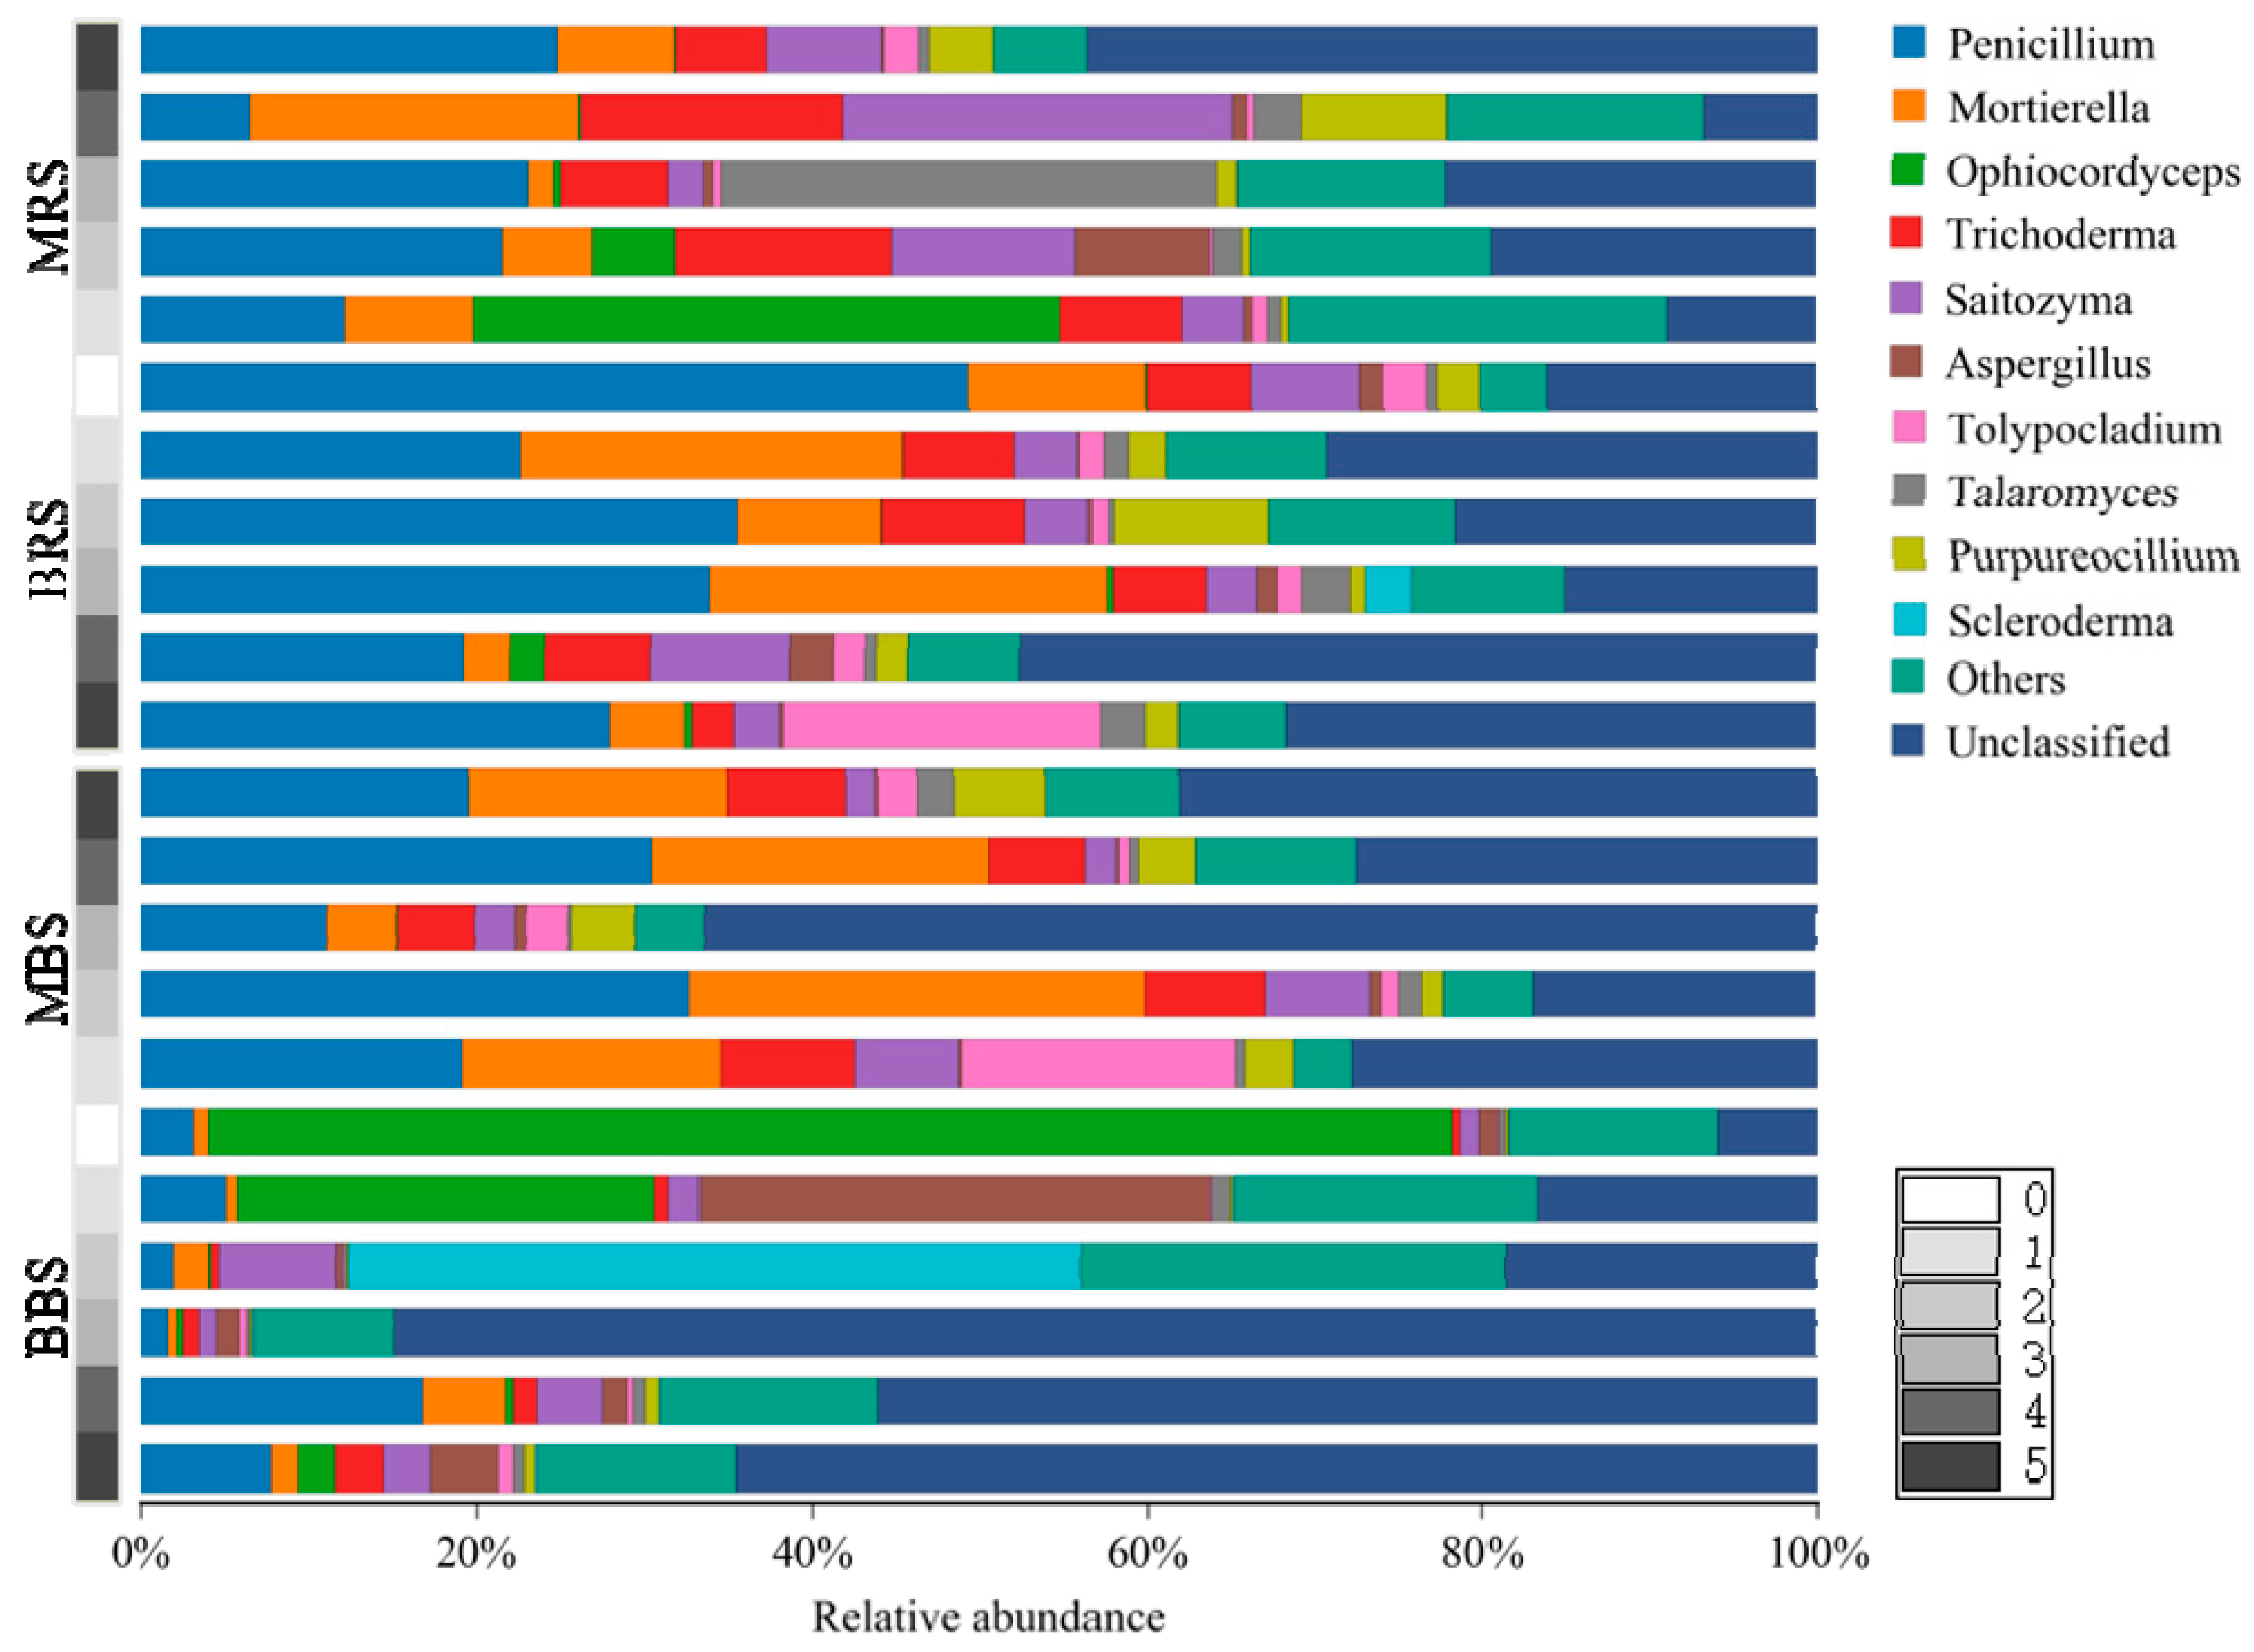
At the genus level, the relative abundances of some genera were gradually changed with biochar amendment (Figure 6 and Figure 7). Among the dominant fungal genera (the relative abundances of the top 10 main fungal genera), the bulk soil with B or M addition had significantly lower relative abundances of Ophiocordyceps compared with the control. MBS had significantly higher relative abundances of the nine other genera, including potentially beneficial fungi such as Penicillium and Trichoderma. The relative abundance of Aspergillus in BBS1, the relative abundance of Saitozyma and Scleroderma in BBS2, and the relative abundances of Penicillium, Mortierella, and Saitozyma in BBS4 were significantly higher than those in the control. Compared with the control, the rhizosphere soil with B or M addition had significantly lower relative abundance of Penicillium (Figure 6). M addition has a more obvious effect with the same biochar dosage.
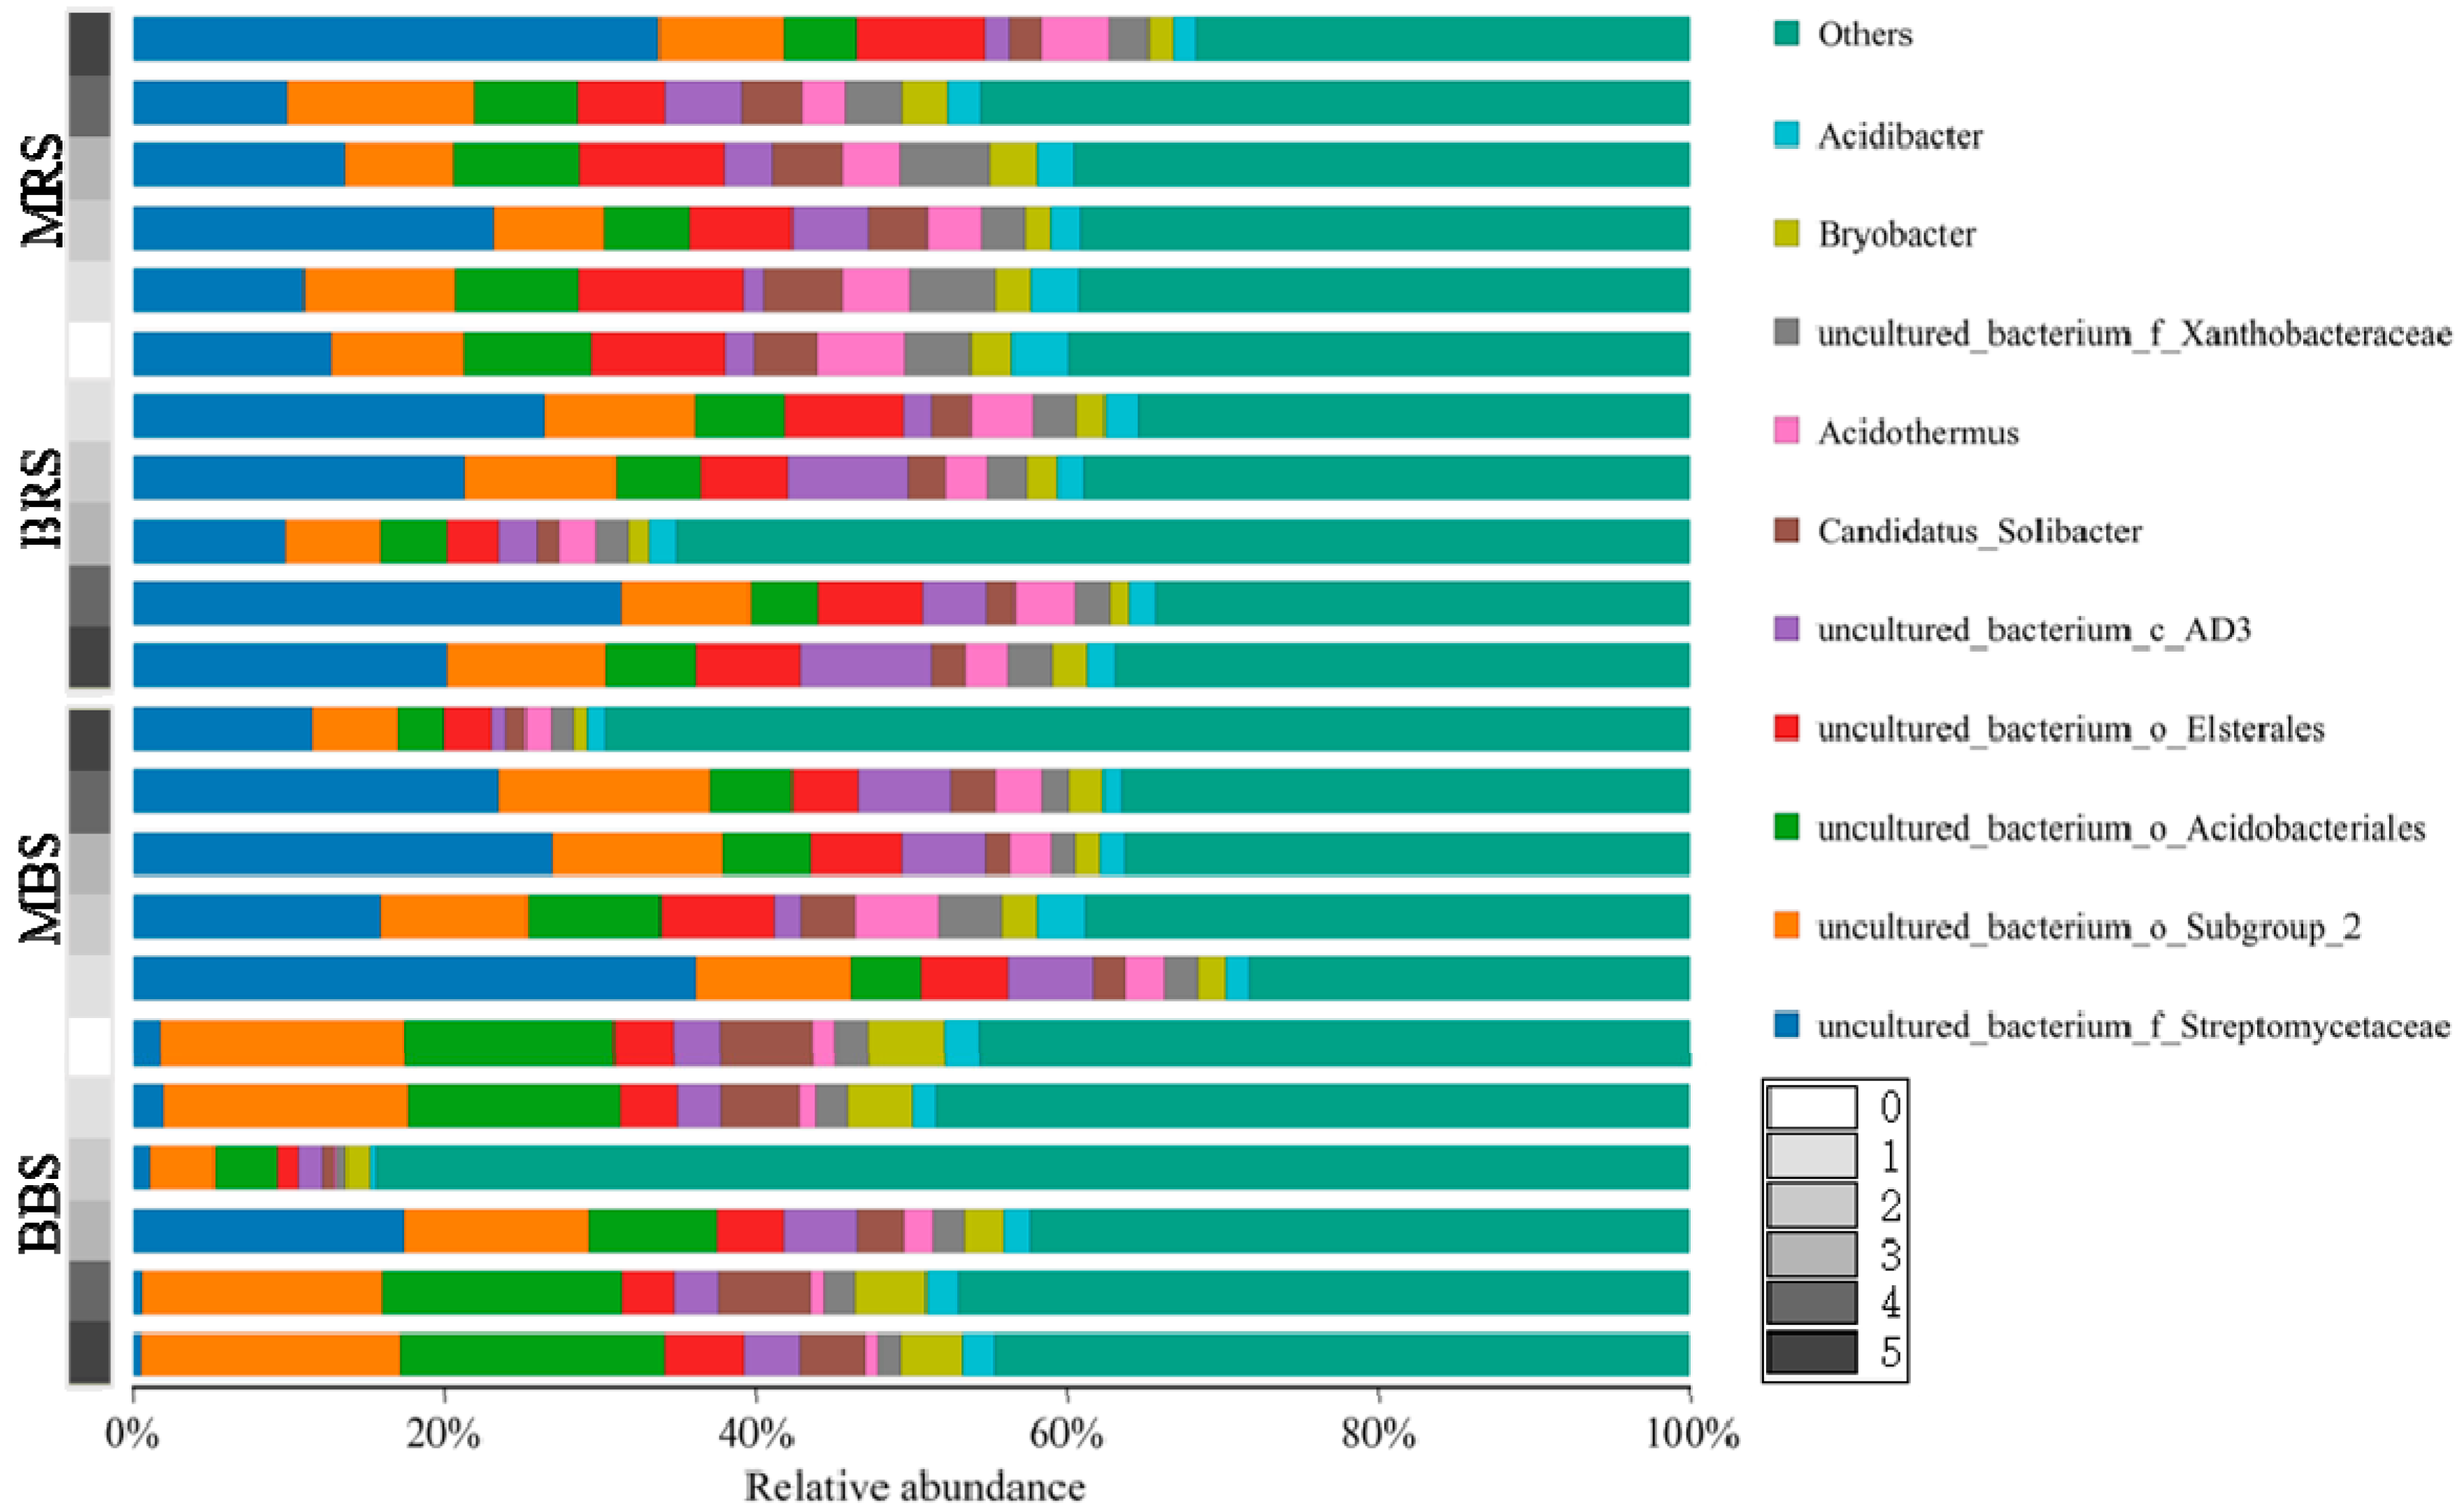
Among the dominant bacterial genera (the relative abundances of the top 10 main bacterial genera), MBS and BBS3 had significantly higher relative abundances of Streptomycetaceae compared with the control. In addition, compared with the control, BRS1, BRS2, BRS4, MRS2, and MRS5 had significantly higher relative abundance of Streptomycetaceae (Figure 7).

3.4. Soil Microbial Community Structure

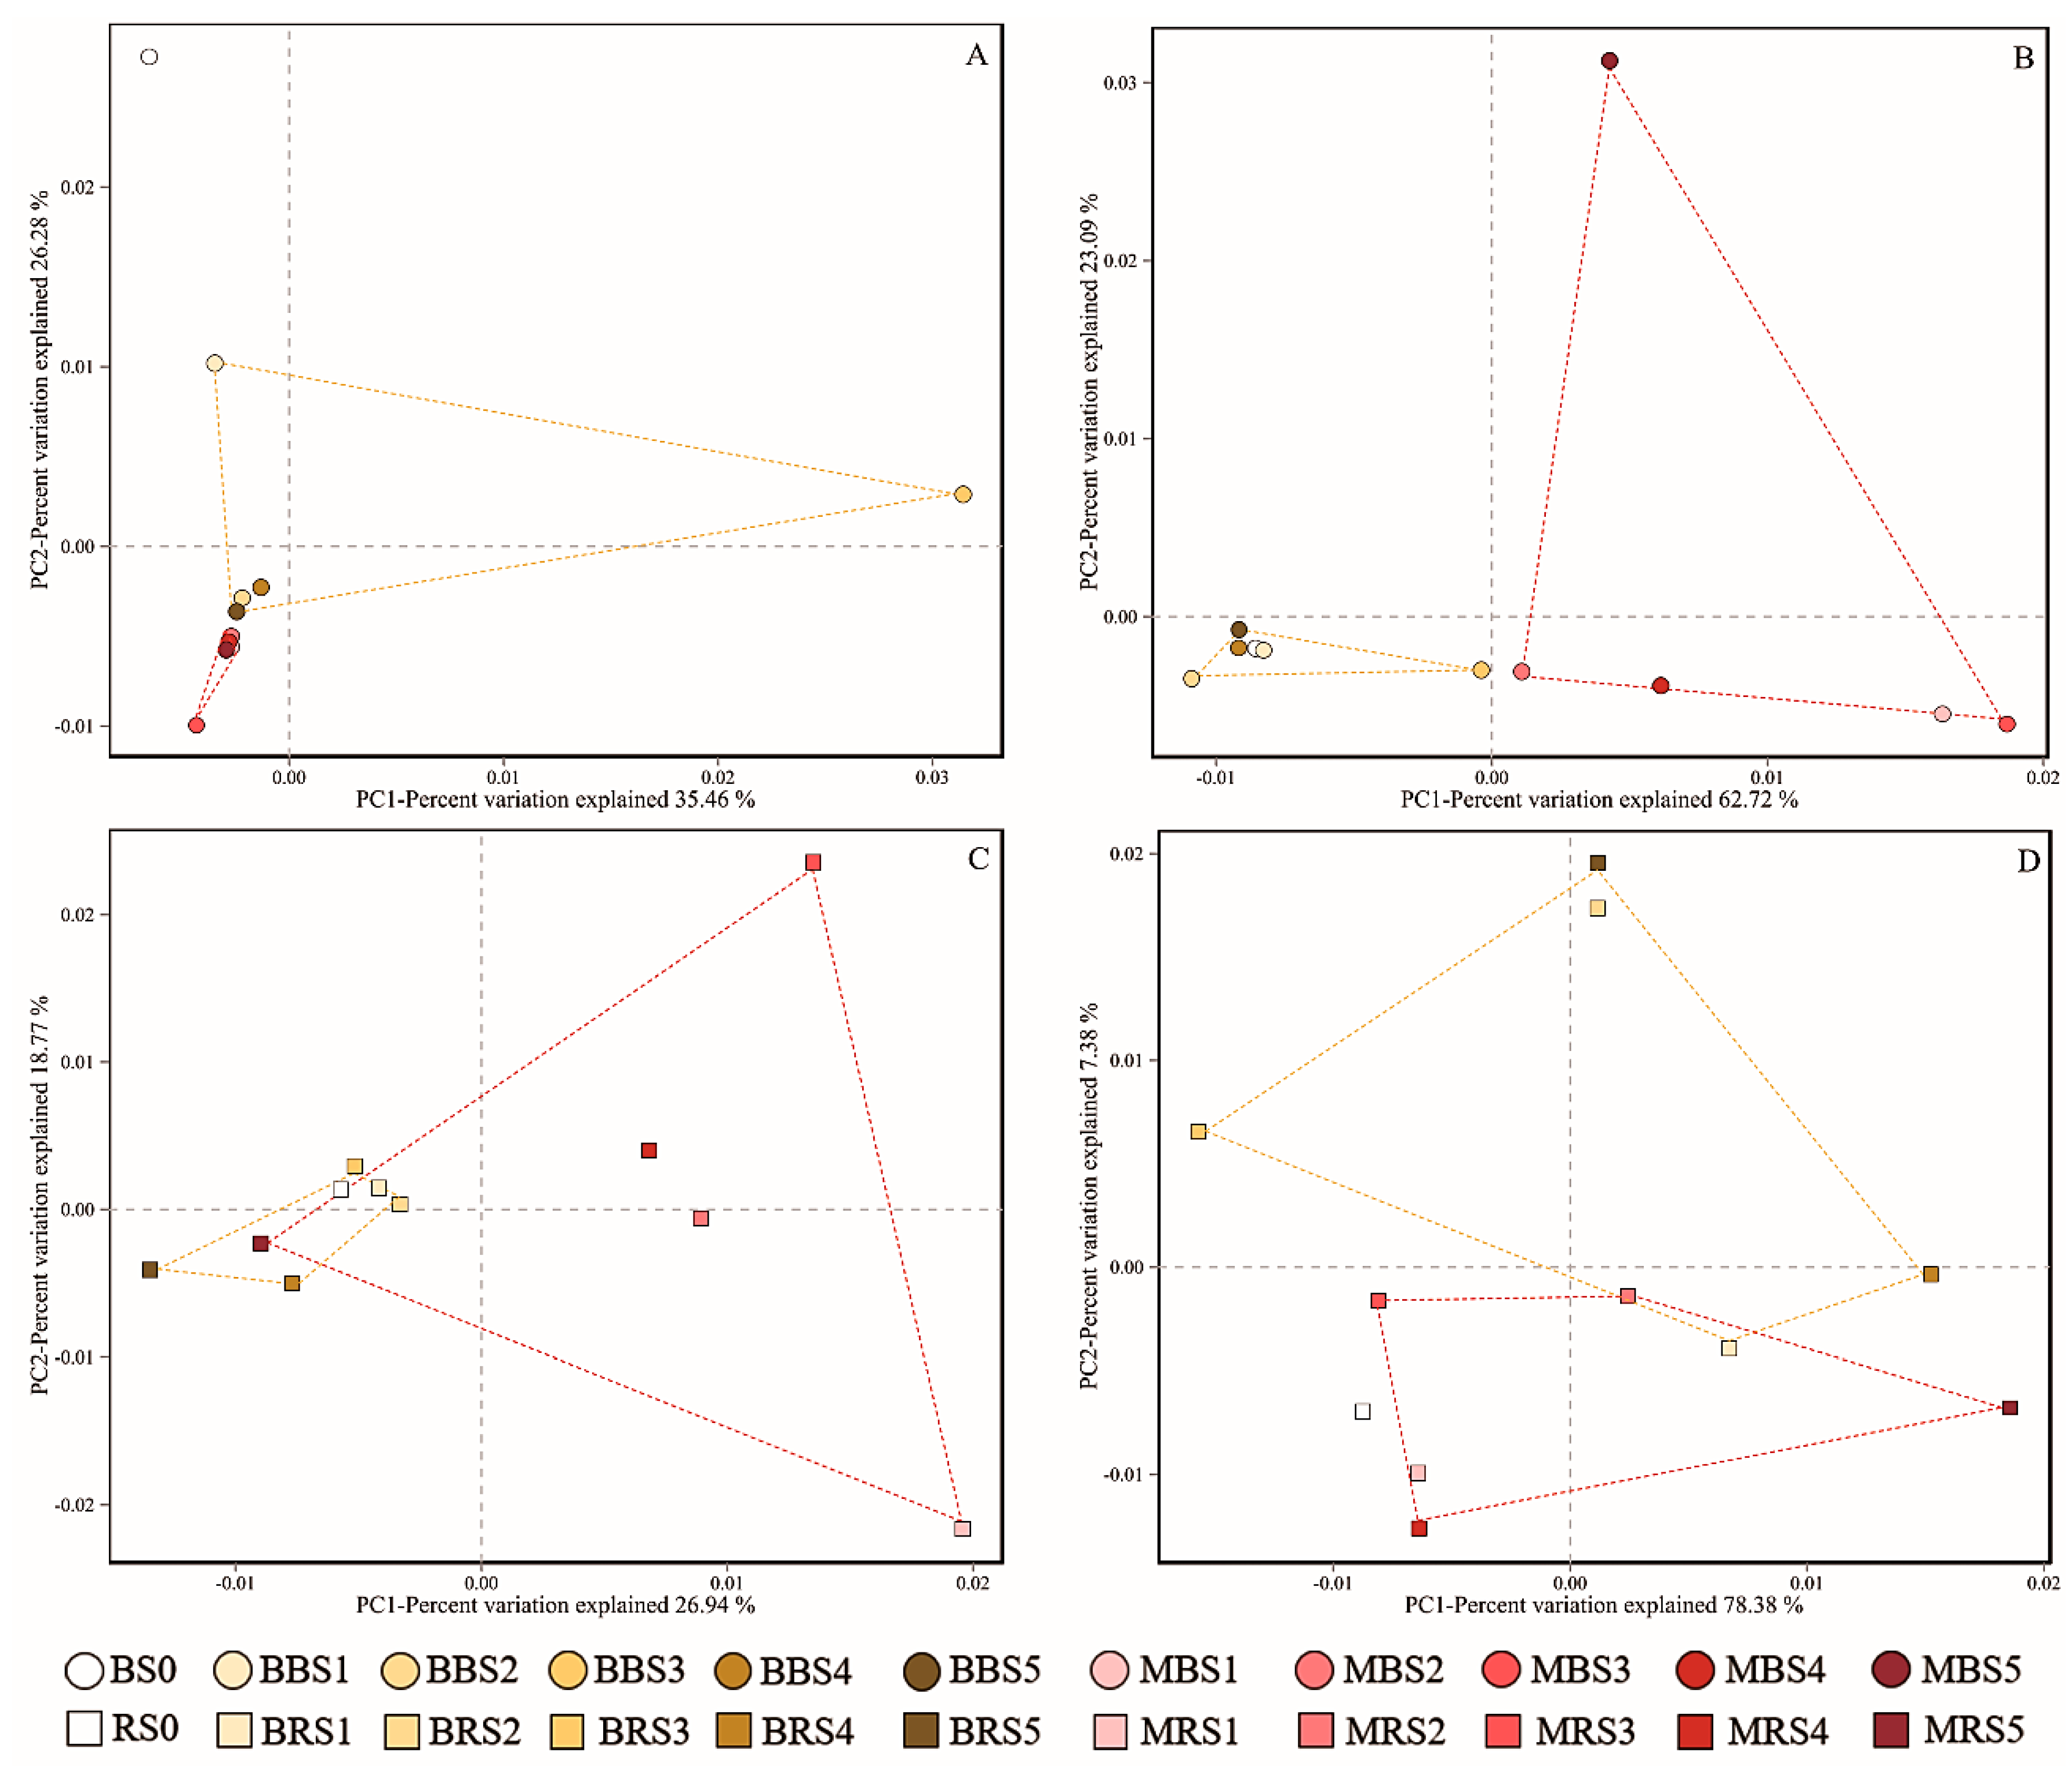
The overall structural changes of the bacteria and fungi were analyzed using PCA at the OTU level. In a PCA, the greater the distance between groups, the greater the difference between them. The results of the PCAs of the fungal and bacterial communities in bulk soil demonstrated that, in the MBS, the effects of the five dosage were significantly different from those of the control. However, in the BBS, the fungal communities of the five treatments were significantly different from those of the control, but there was no significant difference in bacterial communities between the treatments and the control, and applying M had a greater effect on fungal and bacterial communities in bulk soil than applying B (Figure 8A,B). The PCAs of the fungal and bacterial communities in the rhizosphere soil demonstrated that fungal communities of MRS1–MRS4 were significantly different from that of the control, and the bacterial communities of BRS and MRS2 were significantly different from that of the control (Figure 8C,D). Overall, these findings indicated that the effect of biochar addition on soil microbial community was more significant in bulk soil than in rhizosphere soil. The effect of M was more significant on the microbial community in general.
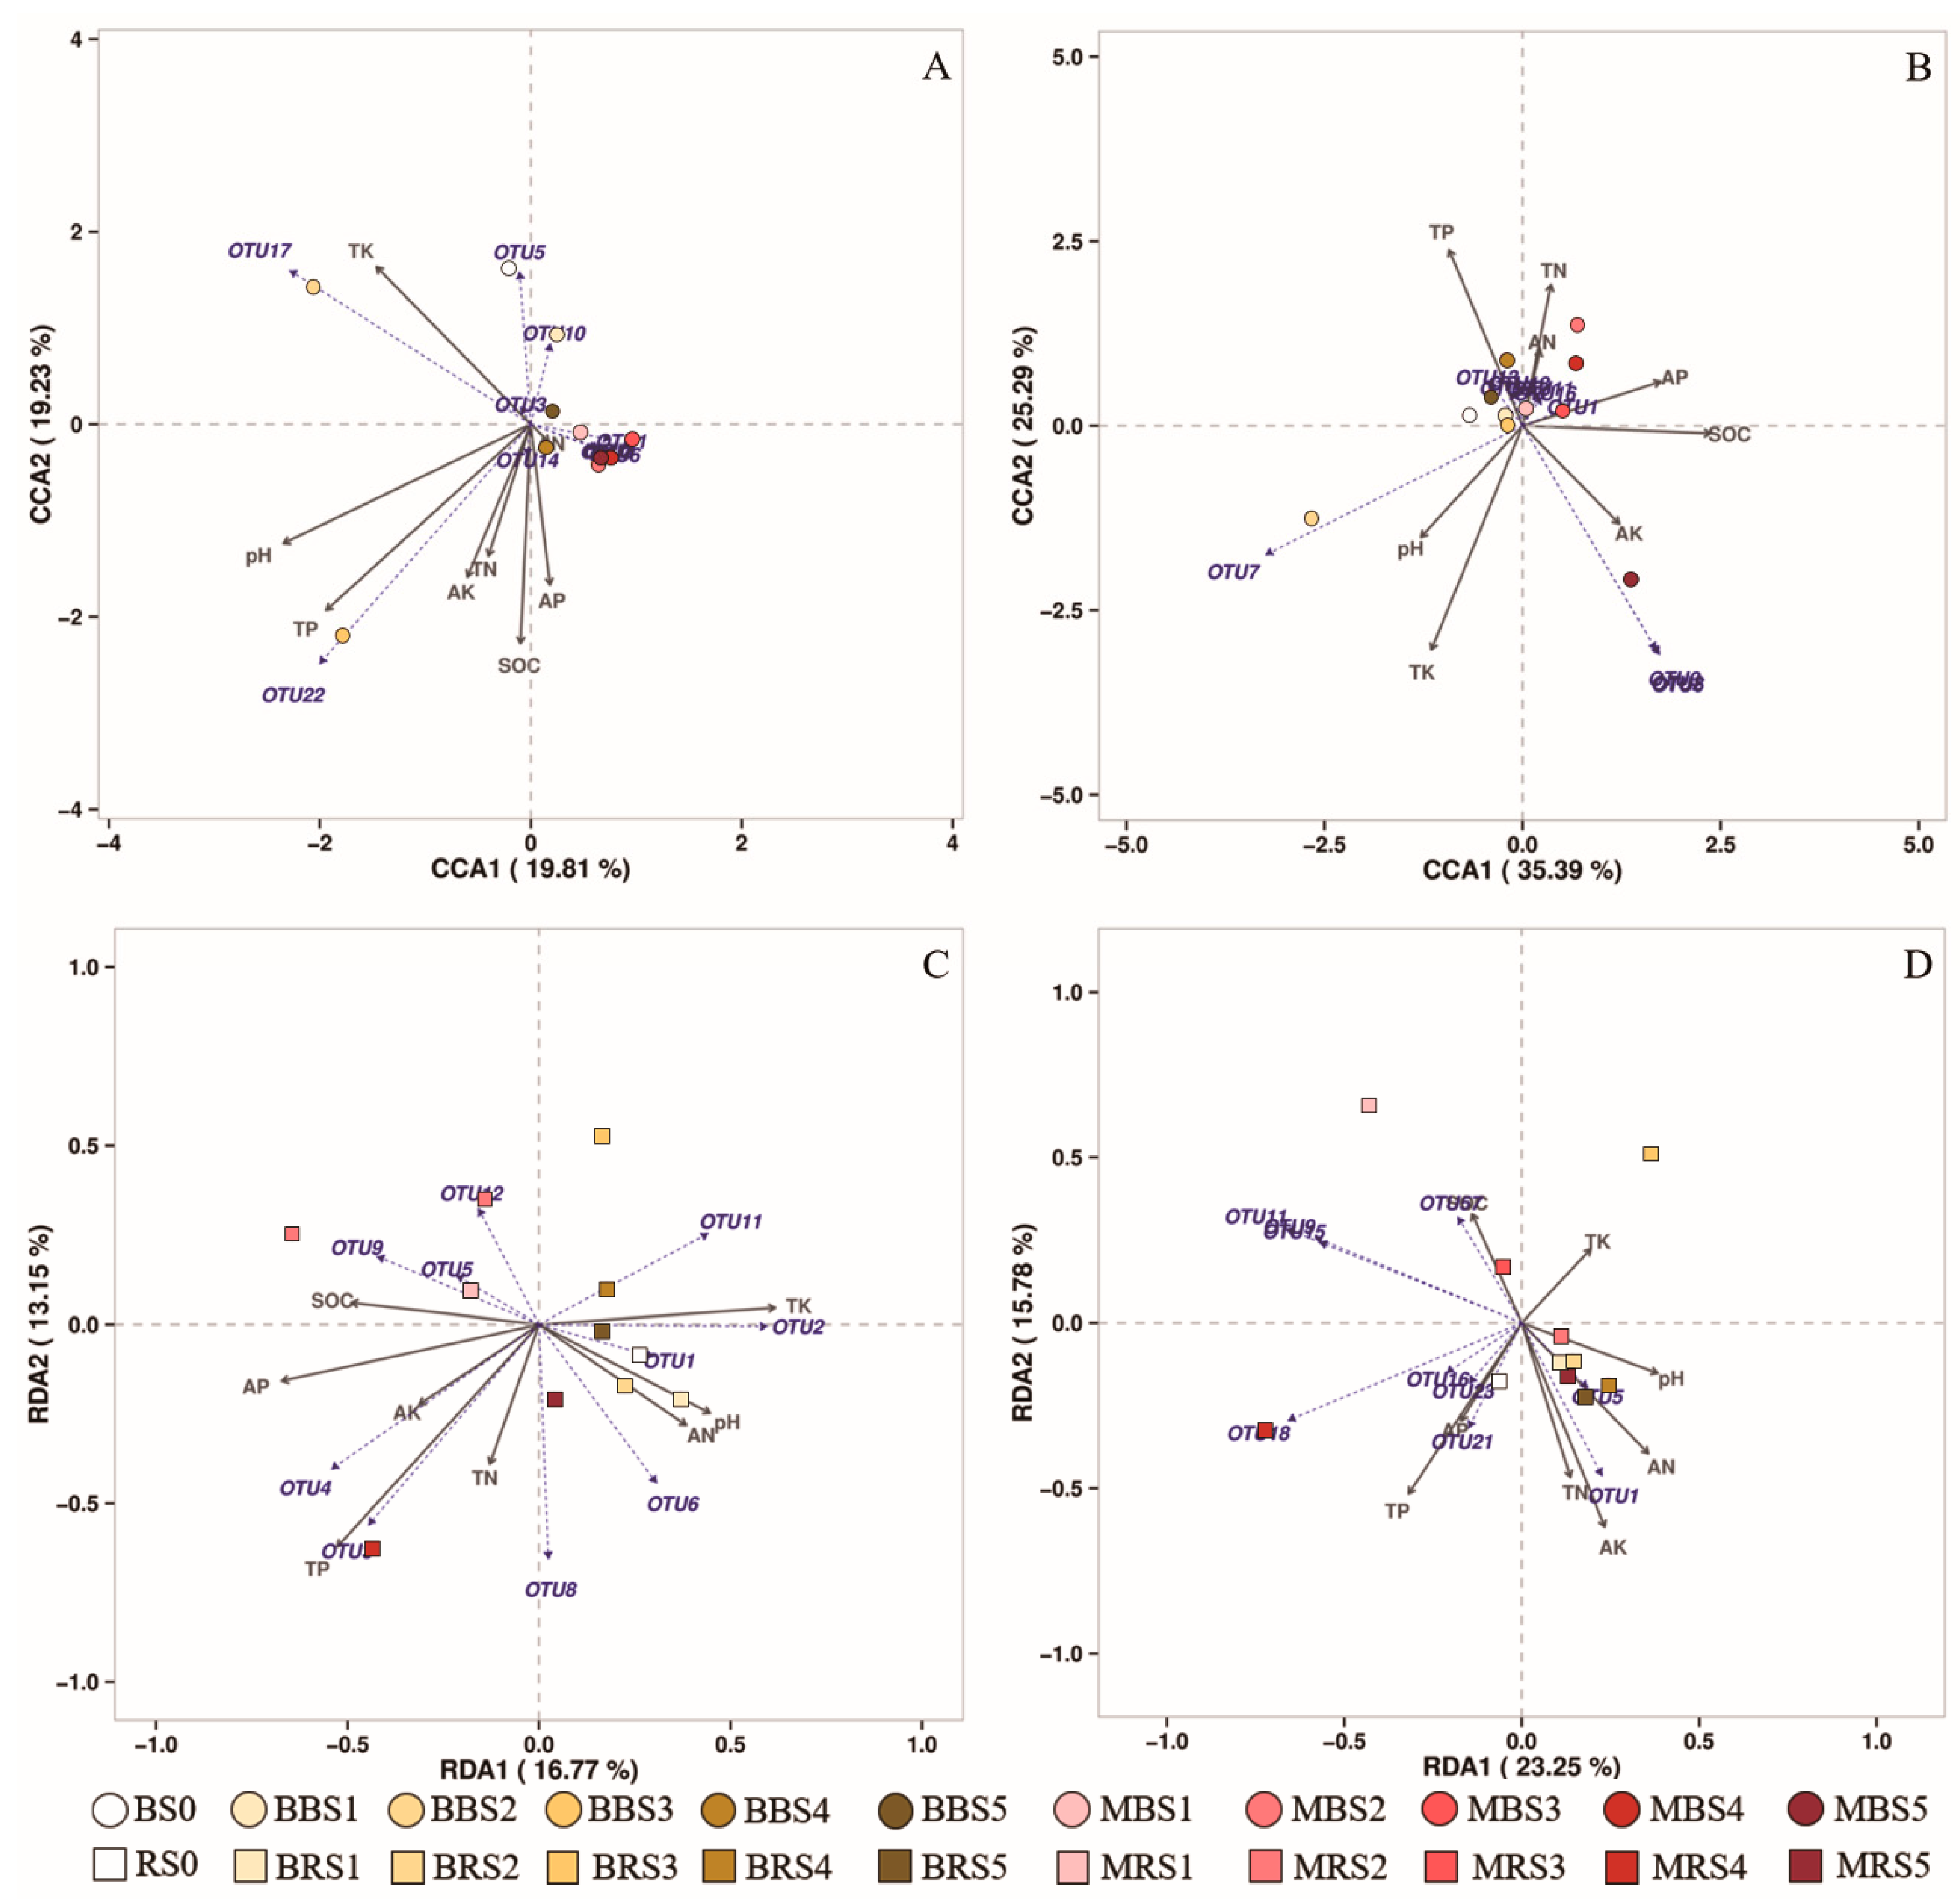
The soil parameters that were significantly correlated with the bulk soil microbial community structures were selected for the CCA (Figure 9A,B). Based on the CCA, we found that AN and TP had significant effects on the bulk soil fungal community. Some fungal communities of the bulk soil, including OTU1, OTU2, OTU3, OTU4, OTU6, and OTU17, were significantly influenced by AN and TK, whereas OTU5, OTU10, OTU14, and OTU22 were significantly influenced by soil OC, TN, TP, AK, AP, and AN (Figure 9A). As for the bacterial community of bulk soil, we found that pH and AP influenced the bacterial community significantly more than the TP or AK. Some bacterial communities, including OTU1, OTU7, OTU11, and OTU16, were significantly influenced by soil pH, TN, AN, and AP; further, OTU2, OTU3, OTU6, OTU13, OTU18, and OTU26 were significantly influenced by soil TP and AK (Figure 9B). The soil parameters that were significantly correlated with rhizosphere soil microbial community structures were selected for the RDA (Figure 9C,D). Based on the RDA, we found that TN had a significant effect on the fungal community. Some fungal communities of the rhizosphere soil, including OTU1, OTU5, OTU6, OTU9, and OTU12, were significantly influenced by soil pH, OC, and AN; on the other hand, OTU5, OTU2, OTU3, OTU4, and OTU11 were significantly influenced by TP, TK, AK, and AP (Figure 9C). As for the bacterial community in the rhizosphere soils, we found that the soil pH, OC, TN, AN, and AK influenced the bacterial community significantly more than the TP, TK, and AP. Some bacterial communities, including OTU1, OTU5, OTU9, OTU11, OTU15, and OTU57, were significantly influenced by the soil pH, OC, TN, AN, and AK; meanwhile, OTU16, OTU18, OTU21, and OTU23 were significantly influenced by TP, TK, and AP (Figure 9B).

4. Discussion

4.1. Effects of Biochar on Plant Growth and Soil Properties

The application of biochar can directly affect the growth of tress, but it can also indirectly affect tree growth by changing soil nutrient availability and transformation, since it is an alkaline material containing various mineral elements and nutrients [6,17,21]. The combined use of biochar as a soil amendment can stimulate plant growth by increasing the utilization of essential nutrients (N, P, K) in the soil and their ultimate absorption by plants [16].
In this study, the addition of biochar for one growing season did not increase soil nutrients significantly (Table 2). This difference in results from other biochar application studies might be due to the application of biochar in the ring furrow in our study; while other studies have applied biochar to the soil surface or have thoroughly mixed it into the soil, we avoided direct contact of plant with biochar in our study [21,49]. Moreover, Lehmann et al. [50] suggested that adsorption sites were enhanced because of biochar application, which contributed to nutrient retention.
Further, the effects of biochar on crop productivity were not consistent with those seen in other studies because of variations in the composition of the feedstock and the conditions under which the biochar was produced, the properties of the soil, the plant species, and the experimental conditions [51]. We found that, compared with the control, there was no significant improvement in plant growth by adding biochar for one growth season (Figure 1). Most studies indicated that biochar has useful effects on the agronomic properties of different crops, while others reported either negative or no impacts on crop productivity [52,53]. Zhao et al. [54] found no effect of biochar on nutrient (N, P, Ca, or Mg) uptake by rice in the first growing season, but nutrient uptake was considerably higher after three growing seasons and two complete rice–wheat rotations. In a 1-year green-house experiment, Kloss et al. [55] found a decline in the yields of barley (Hordeum vulgare L.) and mustard (Sinapis alba L.) following the application of three biochar types (woodchips, wheat straw, and vineyard pruning) in three agricultural soils (Planosol, Cambisol, and Chernozem), but red clover (Trifolium pretense L.) yield remained unaffected. In addition, given the effects biochar can have on nutrient and water availability (as mentioned before), changes in resource supply are likely to play a role in root dynamics [6]; biochar-type materials have been known to stimulate root growth [56,57,58]. In fact, roots may even grow into biochar pores [59,60]. Though not significant, the soil nutrients and the plant growth data in our study showed a gradual increase because of biochar addition (Figure 1). Therefore, we believe that the application of biochar in Chinese fir plantation has the potential to improve soil quality and crop production after a few years of such implementation. However, D’Hose et al. [61] found that, in the long term, a single application of biochar, compost, and biochar-blended compost can increase the carbon content of the topsoil, but only compost and biochar-blended compost have a lasting effect on pH and K content. The biomass, richness, diversity, and community composition of soil microorganisms remained unchanged for 2–4 years after all three corrections were applied in the field. Hence, the long-term effects need to be studied.

4.2. Effects of Biochar on Soil Microbial Diversity

The effect of biochar application on soil microbial community structure is complicated [15]. Previous studies have indicated that biochar amendment differs in its effects on bacterial and fungal diversity [49]. In this study, biochar amendment significantly increased the fungal community diversity and significantly decreased the bacterial community diversity in bulk soil (Figure 2)—contrarily to many earlier observations [26,62,63,64]. This may be related to the changes of chemical properties induced by biochar amendment, as soil properties play more important roles in modifying the bacterial community diversity than fungal community diversity [65]. However, in our research, biochar did not have a significant impact on the soil’s chemical properties (Table 2). A few researchers have stated that biochar could also enhance fungal growth and activity as fungi have the ability to colonize low quality carbon materials, such as char, which has a high proportion of aromatic C compounds [6,66]. Chen et al. [67] found that bamboo biochar increased the fungal/bacterial ratio and fungal PLFA concentrations, and changed microbial community structure in the soils of a bamboo plantation. Further, some wood-decaying fungal species have been known to utilize biochar as a carbon substrate, thus enhancing their growth [68]. Biochar addition was less significant in terms of species richness (Chao1 index) as opposed to species diversity (Shannon index). Only BBS2 had significantly lower bacterial richness (Chao1 index), and BRS3 and MRS1 had significantly higher bacterial richness (Chao1 index) (Figure 2). The increased fungal/bacterial ratio may imply a change in microbial function towards decreased carbon loss because a fungal-dominated microbial community is believed to improve carbon use efficiency [6,63]. We found that the effect of bacteria-loaded biochar on soil microbial diversity is higher than that of regular biochar (Figure 2). At the same time, we found that AN was significantly positively correlated with bulk soil bacterial diversity (Shannon index) and negatively correlated with rhizosphere soil bacterial diversity (Shannon index) (Figure 3).

4.3. Effects of Biochar on Soil Fungal and Bacterial Community Structures

Researchers assume that soil microbial community structure is significantly affected by the application of biochar. However, the influence of biochar on the abundance and diversity patterns of fungi and bacteria do not follow a clear trend [15,21,69]. In our study, both the analysis of the relative abundances of microbes and the PCA confirmed that the fungal and bacterial communities were distinctly modified by biochar addition, and that the effect of M was more significant than that of B. Moreover, the results showed that, compared to the bacterial community, fungal community structures were more sensitive to biochar soil amendment (Figure 8). The presence of Basidiomycota is beneficial to the formation of mycorrhiza, and the presence of Mortierellomycota is conducive to nutrient transformation [70].
Rousk et al. [71] believes that the different responses of bacterial and fungal communities to the application of biochar may be related to their ecological characteristics and functions because bacteria and fungi differ greatly in their nutritional requirements, turnover rate, and stress tolerance. In our study, Ascomycota comprised the largest proportion of fungi in the bulk soil, while the relative abundance of Ascomycota accounted for 96.33% in the control (Figure 4). We found that the abundance of Mortierellomycota and Basidiomycota significantly increased with biochar addition and the abundance of Ascomycota significantly decreased with biochar addition. In addition, we found that the abundance of Ophiocordyceps significantly decreased with biochar addition, and the abundance of other genera including the potentially beneficial fungi Penicillium, Mortierella, and Trichoderma significantly increased with biochar addition (Figure 6). Therefore, adding biochar in Chinese fir plantation soil positively affected the soil fungal community. The relative abundances of Actinobacteria in MBS significantly increased and the relative abundances of Acidobacteria in MBS significantly decreased as compared to the control (Figure 5). There were no significant differences between BBS and the control for bacterial phyla. In BBS2, Firmicutes significantly (p < 0.05) increased in abundance, but Acidobacteria significantly decreased (p < 0.05). There were no significant differences between MRS and the control in regards to the bacterial phyla; the relative abundances of Firmicutes in BRS2–BRS5 significantly increased (p < 0.05), and there were no significant differences between the treatments and control for other phyla. Moreover, the relative abundances of Streptomycetaceae in MBS, BRS, and MRS significantly increased with biochar addition (p < 0.05; Figure 7).
In summary, the positive changes that biochar brings to the soil will also have a positive impact on the abundance and activity of soil microorganisms. For example, the application of biochar will reduce soil bulk density and increase soil porosity. In addition, the specific characteristics of biochar, including its high surface area and high porosity will provide a better environment for microorganisms [6,15].

4.4. Differences Between Rhizosphere and Bulk Soils

Soil properties in the rhizosphere soil were more sensitive to biochar addition than in the bulk soil. This may be due to the characteristics of biochar as the nutrients in biochar (organic C and minerals; Table 1) can be directly utilized by plant roots [16,21,49]; further, we applied the biochar close to the rhizosphere. In addition, it is interesting that both bacterial and fungal community diversity and structure in the bulk soil were more sensitive to biochar addition than those in the rhizosphere soil. This may be because biochar is known to promote fungal reproduction and spread to the surrounding environment instead of indirectly affecting the microbial community through alteration of soil properties [6,66,67]. In summary, this issue is worth further discussion. In addition, the bacteria-loaded biochar increased the relative abundance of Streptomyces in the soil and reduced the relative abundances of other bacteria, indicating that the use of bacteria-loaded biochar has the potential to improve the soil in a targeted manner.

5. Conclusions

Adding regular biochar and bacteria-loaded biochar significantly increased soil fungal diversity, and significantly reduced soil bacterial diversity after one growing season. The impact on fungal diversity and abundance is significantly greater than the impact on bacteria. Compared with regular biochar, the effect of bacteria-loaded biochar on soil microbial diversity was more significant, and the effect of different doses on soil microbial structure was also more consistent. This study shows that the bacteria-loaded biochar has a better effect on the soil quality of Chinese fir plantation.

Author Contributions

Conceptualization, L.S. and Q.S.; methodology, L.S. and Q.S.; software, L.S. and Q.S.; validation, L.S., L.H., Y.Z., Z.L., W.W. and Q.S.; formal analysis, L.S. and Q.S.; investigation, L.S., Y.Z., W.W. and Q.S.; resources, L.S. and Q.S.; data curation, L.S.; writing—original draft preparation, L.S.; writing—review and editing, L.S., L.H., Y.Z. and Q.S.; visualization, L.S.; supervision, Q.S.; project administration, L.S.; funding acquisition, Q.S. All authors have read and agreed to the published version of the manuscript.

Funding

This research was supported by the Fundamental Research Funds for the Central Non-profit Research Institution of CAF (grant number CAFYBB2018ZD002).

Acknowledgments

This work was supported by the Fundamental Research Funds for the Central Non-profit Research Institution of CAF (CAFYBB2018ZD002). We would like to thank the technical staff at the experimental farm in Fenyi, who assisted with the field experiments and have managed the field for the many years of the long-term experiment.

Conflicts of Interest

The authors declare no conflict of interest.

References

  1. Doran, J.W. Soil health and global sustainability: Translating science into practice. Agric. Ecosyst. Environ. 2002, 88, 119–127. [Google Scholar] [CrossRef] [Green Version]
  2. Chang, L.; Wang, B.; Liu, X.; Callaham, M.A.; Feng, G. Recovery of collembola in Pinus tabulaeformis plantations. Pedosphere 2017, 27, 129–137. [Google Scholar] [CrossRef]
  3. Tonks, A.J.; Aplin, P.; Beriro, D.J.; Cooper, H.V.; Evers, S.; Vane, C.H.; Sjogersten, S. Impacts of conversion of tropical peat swamp forest to oil palm plantation on peat organic chemistry, physical properties and carbon stocks. Geoderma 2017, 289, 36–45. [Google Scholar] [CrossRef]
  4. Yang, Z.; Chen, S.; Liu, X.; Xiong, D.; Xu, C.; Arthur, M.A.; Mcculley, R.L.; Shi, S.; Yang, Y. Loss of soil organic carbon following natural forest conversion to Chinese fir plantation. For. Ecol. Manag. 2019, 449, 117476. [Google Scholar] [CrossRef]
  5. Burton, J.M.; Chen, C.; Xu, Z.; Ghadiri, H. Soil microbial biomass, activity and community composition in adjacent native and plantation forests of subtropical Australia. J. Soils Sediments 2010, 10, 1267–1277. [Google Scholar] [CrossRef]
  6. Lehmann, J.; Rillig, M.C.; Thies, J.E.; Masiello, C.A.; Hockaday, W.C.; Crowley, D.E. Biochar effects on soil biota—A review. Soil Biol. Biochem. 2011, 43, 1812–1836. [Google Scholar] [CrossRef]
  7. Wang, C.; Xue, L.; Dong, Y.; Wei, Y.; Jiao, R. Unravelling the functional diversity of the soil microbial community of Chinese fir plantations of different densities. Forests 2018, 9, 532. [Google Scholar] [CrossRef] [Green Version]
  8. Zhang, Y.; Hou, L.; Li, Z.; Zhao, D.; Song, L.; Shao, G.; Ai, J.; Sun, Q. Leguminous supplementation increases the resilience of soil microbial community and nutrients in Chinese fir plantations. Sci. Total Environ. 2020, 703, 134917. [Google Scholar] [CrossRef]
  9. Tang, Y.L.; Zhang, X.; Li, D.; Wang, H.; Chen, F.; Fu, X.; Fang, X.; Sun, X.; Yu, G. Impacts of nitrogen and phosphorus additions on the abundance and community structure of ammonia oxidizers and denitrifying bacteria in Chinese fir plantations. Soil Biol. Biochem. 2016, 103, 284–293. [Google Scholar] [CrossRef]
  10. Ma, X.; Heal, K.; Liu, A.; Jarvis, P.G. Nutrient cycling and distribution in different-aged plantations of Chinese fir in southern China. For. Ecol. Manag. 2007, 243, 61–74. [Google Scholar] [CrossRef]
  11. Gabriel, J.L.; Alonsoayuso, M.; Garciagonzalez, I.; Hontoria, C.; Quemada, M. Nitrogen use efficiency and fertiliser fate in a long-term experiment with winter cover crops. Eur. J. Agron. 2016, 79, 14–22. [Google Scholar] [CrossRef] [Green Version]
  12. Selvaraj, S.; Duraisamy, V.; Huang, Z.; Guo, F.; Ma, X. Influence of long-term successive rotations and stand age of Chinese fir (Cunninghamia lanceolata) plantations on soil properties. Geoderma 2017, 306, 127–134. [Google Scholar] [CrossRef]
  13. Mann, C.; Lynch, D.; Fillmore, S.; Mills, A. Relationships between field management, soil health, and microbial community composition. Appl. Soil Ecol. 2019, 144, 12–21. [Google Scholar] [CrossRef]
  14. Sohi, S.P. Carbon storage with benefits. Science 2012, 338, 1034–1035. [Google Scholar] [CrossRef]
  15. Gul, S.; Whalen, J.K.; Thomas, B.W.; Sachdeva, V.; Deng, H. Physico-chemical properties and microbial responses in biochar-amended soils: Mechanisms and future directions. Agric. Ecosyst. Environ. 2015, 206, 46–59. [Google Scholar] [CrossRef]
  16. Lehmann, J. A handful of carbon. Nature 2017, 447, 143–144. [Google Scholar] [CrossRef]
  17. Luo, Y.; Yu, Z.; Zhang, K.; Xu, J.; Brookes, P.C. The properties and functions of biochars in forest ecosystems. J. Soils Sediments 2016, 16, 2005–2020. [Google Scholar] [CrossRef]
  18. Hussain, M.; Farooq, M.; Nawaz, A.; Alsadi, A.M.; Solaiman, Z.M.; Alghamdi, S.S.; Ammara, U.; Ok, Y.S.; Siddique, K.H.M. Biochar for crop production: Potential benefits and risks. J. Soils Sediments 2017, 17, 685–716. [Google Scholar] [CrossRef]
  19. Liu, L.; Tan, Z.; Gong, H.; Huang, Q. Migration and Transformation Mechanisms of Nutrient Elements (N, P, K) within Biochar in Straw–Biochar–Soil–Plant Systems: A Review. ACS Sustain. Chem. Eng. 2019, 7, 22–32. [Google Scholar] [CrossRef]
  20. Ghysels, S.; Acosta, N.; Estrada, A.; Pala, M.; Rabaey, K. Integrating anaerobic digestion and slow pyrolysis improves the product portfolio of a cocoa waste biorefinery. Sustain. Energy Fuels 2020, 4, 3712–3725. [Google Scholar] [CrossRef]
  21. Li, Y.; Hu, S.; Chen, J.; Muller, K.; Li, Y.; Fu, W.; Lin, Z.; Wang, H. Effects of biochar application in forest ecosystems on soil properties and greenhouse gas emissions: A review. J. Soils Sediments 2018, 18, 546–563. [Google Scholar] [CrossRef]
  22. Clough, T.J.; Condron, L.M.; Kammann, C.; Muller, C. A review of biochar and soil nitrogen dynamics. Agronomy 2013, 3, 275–293. [Google Scholar] [CrossRef] [Green Version]
  23. Jaiswal, A.K.; Frenkel, O.; Elad, Y.; Lew, B.; Graber, E.R. Non-monotonic influence of biochar dose on bean seedling growth and susceptibility to Rhizoctonia solani: The “Shifted Rmax-Effect”. Plant Soil 2015, 395, 125–140. [Google Scholar] [CrossRef]
  24. Ippolito, J.A.; Spokas, K.A.; Novak, J.M.; Lentz, R.D.; Cantrell, K.B. Biochar elemental composition and factors influencing nutrient retention. In Biochar for Envrionmental Management: Science, Technolody and Implementation, 2nd ed.; Lehmann, J., Joseph, S., Eds.; Routledge: Abingdon-on-Thames, UK, 2015; pp. 137–161. ISBN 978-0-415-70415-1. [Google Scholar]
  25. Wang, D.; Jiang, P.; Zhang, H.; Yuan, W. Biochar production and applications in agro and forestry systems: A review. Sci. Total Environ. 2020, 723, 137775. [Google Scholar] [CrossRef] [PubMed]
  26. Mitchell, P.J.; Simpson, A.J.; Soong, R.; Simpson, M.J. Shifts in microbial community and water-extractable organic matter composition with biochar amendment in a temperate forest soil. Soil Biol. Biochem. 2015, 81, 244–254. [Google Scholar] [CrossRef]
  27. Mitchell, P.J.; Simpson, A.J.; Soong, R.; Schurman, J.S.; Thomas, S.C.; Simpson, M.J. Biochar amendment and phosphorus fertilization altered forest soil microbial community and native soil organic matter molecular composition. Biogeochemistry 2016, 130, 227–245. [Google Scholar] [CrossRef]
  28. Noyce, G.L.; Basiliko, N.; Fulthorpe, R.R.; Sackett, T.E.; Thomas, S.C. Soil microbial responses over 2 years following biochar addition to a north temperate forest. Biol. Fertil. Soils 2015, 51, 649–659. [Google Scholar] [CrossRef]
  29. Steinbeiss, S.; Gleixner, G.; Antonietti, M. Effect of biochar amendment on soil carbon balance and soil microbial activity. Soil Biol. Biochem. 2009, 41, 1301–1310. [Google Scholar] [CrossRef]
  30. Wu, B.; Wang, Z.; Zhao, Y.; Gu, Y.; Wang, Y.; Yu, J.; Xu, H. The performance of biochar-microbe multiple biochemical material on bioremediation and soil micro-ecology in the cadmium aged soil. Sci. Total Environ. 2019, 686, 719–728. [Google Scholar] [CrossRef]
  31. Maestrini, B.; Herrmann, A.M.; Nannipieri, P.; Schmidt, M.; Abiven, S. Ryegrass-derived pyrogenic organic matter changes organic carbon and nitrogen mineralization in a temperate forest soil. Soil Biol. Biochem. 2014, 69, 291–301. [Google Scholar] [CrossRef]
  32. Wang, S.; Ai, S.; Nzediegwu, C.; Kwak, J.-H.; Islam, M.S.; Li, Y.; Chang, S.X. Carboxyl and hydroxyl groups enhance ammonium adsorption capacity of iron (III) chloride and hydrochloric acid modified biochars. Bioresour. Technol. 2020, 309, 123390. [Google Scholar] [CrossRef]
  33. Chen, H.; Zhang, J.; Tang, L.; Su, M.; Tian, D.; Zhang, L.; Li, Z.; Hu, S. Enhanced Pb immobilization via the combination of biochar and phosphate solubilizing bacteria. Environ. Int. 2019, 127, 395–401. [Google Scholar] [CrossRef] [PubMed]
  34. Araujo, J.; Diazalcantara, C.; Urbano, B.; Gonzalezandres, F. Inoculation with native Bradyrhizobium strains formulated with biochar as carrier improves the performance of pigeonpea (Cajanus cajan L.). Eur. J. Agron. 2020, 113, 125985. [Google Scholar] [CrossRef]
  35. Scheer, C.; Grace, P.; Rowlings, D.W.; Kimber, S.; van Zwieten, L. Effect of biochar amendment on the soil-atmosphere exchange of greenhouse gases from an intensive subtropical pasture in northern New South Wales, Australia. Plant Soil 2011, 345, 47–58. [Google Scholar] [CrossRef] [Green Version]
  36. Slavich, P.G.; Sinclair, K.; Morris, S.; Kimber, S.; Downie, A.; van Zwieten, L. Contrasting effects of manure and green waste biochars on the properties of an acidic ferralsol and productivity of a subtropical pasture. Plant Soil 2013, 366, 213–227. [Google Scholar] [CrossRef]
  37. Palansooriya, K.N.; Ok, Y.S.; Awad, Y.M.; Lee, S.S.; Sung, J.K.; Koutsospyros, A.; Moon, D.H. Impacts of biochar application on upland agriculture: A review. J. Environ. Manag. 2019, 234, 52–64. [Google Scholar] [CrossRef] [PubMed]
  38. Elmageed, T.A.A.; Rady, M.M.; Taha, R.S.; Azeam, S.A.E.; Simpson, C.R.; Semida, W.M. Effects of integrated use of residual sulfur-enhanced biochar with effective microorganisms on soil properties, plant growth and short-term productivity of Capsicum annuum under salt stress. Sci. Hortic. 2020, 261, 108930. [Google Scholar] [CrossRef]
  39. Lefroy, R.D.; Blair, G.J.; Strong, W.M. Changes in soil organic matter with cropping as measured by organic carbon fractions and 13C natural isotope abundance. Plant Soil 1993, 155, 399–402. [Google Scholar] [CrossRef]
  40. Kjeldahl, J. Neue methode zur bestimmung des stickstoffs in organischen Körpern. Z. Anal. Chem. 1883, 22, 366–382. [Google Scholar] [CrossRef] [Green Version]
  41. Institute of Soil Science, Chinese Academy Science (ISSCAS). Physical and Chemical Analysis Methods of Soils; Shanghai Science Technology Press: Shanghai, China, 1978; pp. 7–59. [Google Scholar]
  42. Wang, C.; Xue, L.; Dong, Y.; Hou, L.; Wei, Y.; Chen, J.; Jiao, R. Contrasting effects of Chinese fir plantations of different stand ages on soil enzyme activities and microbial communities. Forests 2018, 10, 11. [Google Scholar] [CrossRef] [Green Version]
  43. Menšík, L.; Hlisnikovský, L.; Pospíšilová, L.; Kunzová, E. The effect of application of organic manures and mineral fertilizers on the state of soil organic matter and nutrients in the long-term field experiment. J. Soils Sediments 2018, 18, 2813–2822. [Google Scholar] [CrossRef]
  44. Myrvang, M.B.; Hillersoy, M.H.; Heim, M.; Bleken, M.A.; Gjengedal, E. Uptake of macro nutrients, barium, and strontium by vegetation from mineral soils on carbonatite and pyroxenite bedrock at the Lillebukt Alkaline Complex on Stjernøy, Northern Norway. J. Plant Nutr. Soil Sci. 2016, 179, 705–716. [Google Scholar] [CrossRef]
  45. Magoč, T.; Salzberg, S.L. FLASH: Fast length adjustment of short reads to improve genome assemblies. Bioinformatics 2011, 27, 2957–2963. [Google Scholar] [CrossRef]
  46. Caporaso, J.G.; Bittinger, K.; Bushman, F.D.; Desantis, T.Z.; Andersen, G.L.; Knight, R. PyNAST: A flexible tool for aligning sequences to a template alignment. Bioinformatics 2010, 26, 266–267. [Google Scholar] [CrossRef] [PubMed] [Green Version]
  47. Bokulich, N.A.; Subramanian, S.; Faith, J.J.; Gevers, D.; Gordon, J.I.; Knight, R.; Mills, D.A.; Caporaso, J.G. Quality-filtering vastly improves diversity estimates from Illumina amplicon sequencing. Nat. Methods 2013, 10, 57–59. [Google Scholar] [CrossRef] [PubMed]
  48. Edgar, R.C. UPARSE: Highly accurate OTU sequences from microbial amplicon reads. Nat. Methods 2013, 10, 996–998. [Google Scholar] [CrossRef] [PubMed]
  49. Yao, Q.; Liu, J.; Yu, Z.; Li, Y.; Jin, J.; Liu, X.; Wang, G. Three years of biochar amendment alters soil physiochemical properties and fungal community composition in a black soil of northeast China. Soil Biol. Biochem. 2017, 110, 56–67. [Google Scholar] [CrossRef]
  50. Lehmann, J.; Silva Junior, J.; Rondon, M.; Silva, C.; Greenwood, J.; Nehls, T.; Steiner, C.; Glaser, B. Slash and Char: A feasible alternative for soil fertility management in the Central Amazon? In Proceedings of the 17th World Congress of Soil Science, Bangkok, Thailand, 14–21 August 2002; pp. 1–12. [Google Scholar]
  51. Al-Wabel, M.I.; Hussain, Q.; Usman, A.R.A.; Ahmad, M.; Abduljabbar, A.; Sallam, A.S.; Ok, Y.S. Impact of biochar properties on soil conditions and agricultural sustainability: A review. Land Degrad. Dev. 2018, 29, 2124–2161. [Google Scholar] [CrossRef]
  52. Spokas, K.A.; Cantrell, K.B.; Novak, J.M.; Archer, D.W.; Ippolito, J.A.; Collins, H.P.; Boateng, A.A.; Lima, I.M.; Lamb, M.C.; McAloon, A.J.; et al. Biochar: A synthesis of its agronomic impact beyond carbon sequestration. J. Environ. Qual. 2012, 41, 973–989. [Google Scholar] [CrossRef]
  53. Prendergast miller, M.T.; Duvall, M.; Sohi, S. Biochar—Root interactions are mediated by biochar nutrient content and impacts on soil nutrient availability. Eur. J. Soil Sci. 2014, 65, 173–185. [Google Scholar] [CrossRef]
  54. Zhao, X.; Wang, J.; Wang, S.; Xing, G. Successive straw biochar application as a strategy to sequester carbon and improve fertility: A pot experiment with two rice/wheat rotations in paddy soil. Plant Soil 2014, 378, 279–294. [Google Scholar] [CrossRef]
  55. Kloss, S.; Zehetner, F.; Wimmer, B.; Buecker, J.; Rempt, F.; Soja, G. Biochar application to temperate soils: Effects on soil fertility and crop growth under greenhouse conditions. J. Plant Nutr. Soil Sci. 2014, 177, 3–15. [Google Scholar] [CrossRef]
  56. Nutman, P.S. Host factors influencing infection and nodule development in leguminous plants. Proceedings of the Royal Society of London. Ser. B Biol. Sci. 1952, 139, 176–185. [Google Scholar] [CrossRef]
  57. Makoto, K.; Tamai, Y.; Kim, Y.S.; Koike, T. Buried charcoal layer and ectomycorrhizae cooperatively promote the growth of Larix gmelinii seedlings. Plant Soil 2010, 327, 143–152. [Google Scholar] [CrossRef]
  58. Noguera, D.; Rondón, M.; Laossi, K.-R.; Hoyos, V.; Lavelle, P.; Cruz de Carvalho, M.H.; Barot, S. Contrasted effect of biochar and earthworms on rice growth and resource allocation in different soils. Soil Biol. Biochem. 2010, 42, 1017–1027. [Google Scholar] [CrossRef] [Green Version]
  59. Lehmann, J.; da Silva, J.P.; Steiner, C.; Nehls, T.; Zech, W.; Glaser, B. Nutrient availability and leaching in an archaeological Anthrosol and a Ferralsol of the Central Amazon basin: Fertilizer, manure and charcoal amendments. Plant Soil 2003, 249, 343–357. [Google Scholar] [CrossRef]
  60. Joseph, S.D.; Camps-Arbestain, M.; Lin, Y.; Munroe, P.; Chia, C.H.; Hook, J.; van Zwieten, L.; Kimber, S.; Cowie, A.; Singh, B.P.; et al. An investigation into the reactions of biochar in soil. Soil Res. 2010, 48, 501–515. [Google Scholar] [CrossRef]
  61. D’Hose, T.; Debode, J.; Tender, C.; Ruysschaert, G.; Vandecasteele, B. Has compost with biochar applied during the process added value over biochar or compost for increasing soil quality in an arable cropping system? Appl. Soil Ecol. 2020, 156, 103706. [Google Scholar] [CrossRef]
  62. Ameloot, N.; De Neve, S.; Jegajeevagan, K.; Yildiz, G.; Buchan, D.; Funkuin, Y.N.; Prins, W.; Bouckaert, L.; Sleutel, S. Short-term CO2 and N2O emissions and microbial properties of biochar amended sandy loam soils. Soil Biol. Biochem. 2013, 57, 401–410. [Google Scholar] [CrossRef]
  63. Chen, J.; Liu, X.; Zheng, J.; Zhang, B.; Lu, H.; Chi, Z.; Pan, G.; Li, L.; Zheng, J.; Zhang, X. Biochar soil amendment increased bacterial but decreased fungal gene abundance with shifts in community structure in a slightly acid rice paddy from Southwest China. Appl. Soil Ecol. 2013, 71, 33–44. [Google Scholar] [CrossRef]
  64. Lucheta, A.R.; Cannavan, F.d.S.; Roesch, L.F.W.; Tsai, S.M.; Kuramae, E.E. Fungal Community Assembly in the Amazonian Dark Earth. Microb. Ecol. 2016, 71, 962–973. [Google Scholar] [CrossRef] [Green Version]
  65. Wang, W.; Wang, Z.; Yang, K.; Wang, P.; Wang, H.; Guo, L.; Zhu, S.; Zhu, Y.; He, X. Biochar Application Alleviated Negative Plant-Soil Feedback by Modifying Soil Microbiome. Front. Microbiol. 2020, 11, 799. [Google Scholar] [CrossRef]
  66. Li, Y.; Li, Y.; Chang, S.X.; Liang, X.; Qin, H.; Chen, J.; Xu, Q. Linking soil fungal community structure and function to soil organic carbon chemical composition in intensively managed subtropical bamboo forests. Soil Biol. Biochem. 2017, 107, 19–31. [Google Scholar] [CrossRef]
  67. Chen, J.; Li, S.; Liang, C.; Xu, Q.; Li, Y.; Qin, H.; Fuhrmann, J.J. Response of microbial community structure and function to short-term biochar amendment in an intensively managed bamboo (Phyllostachys praecox) plantation soil: Effect of particle size and addition rate. Sci. Total Environ. 2017, 574, 24–33. [Google Scholar] [CrossRef]
  68. Fontaine, S.; Henault, C.; Aamor, A.; Bdioui, N.; Bloor, J.M.G.; Maire, V.; Mary, B.; Revaillot, S.; Maron, P. Fungi mediate long term sequestration of carbon and nitrogen in soil through their priming effect. Soil Biol. Biochem. 2011, 43, 86–96. [Google Scholar] [CrossRef]
  69. Luo, Y.; Lin, Q.; Durenkamp, M.; Dungait, A.J.; Brookes, P.C. Soil priming effects following substrates addition to biochar-treated soils after 431 days of pre-incubation. Biol. Fertil. Soils 2017, 53, 315–326. [Google Scholar] [CrossRef]
  70. Borrell, A.N.; Shi, Y.; Gan, Y.; Bainard, L.D.; Germida, J.J.; Hamel, C. Fungal diversity associated with pulses and its influence on the subsequent wheat crop in the Canadian prairies. Plant Soil 2017, 414, 13–31. [Google Scholar] [CrossRef]
  71. Rousk, J.; Brookes, P.C.; Bååth, E. Contrasting soil pH effects on fungal and bacterial growth suggest functional redundancy in carbon mineralization. Appl. Environ. Microbiol. 2009, 75, 1589–1596. [Google Scholar] [CrossRef] [Green Version]
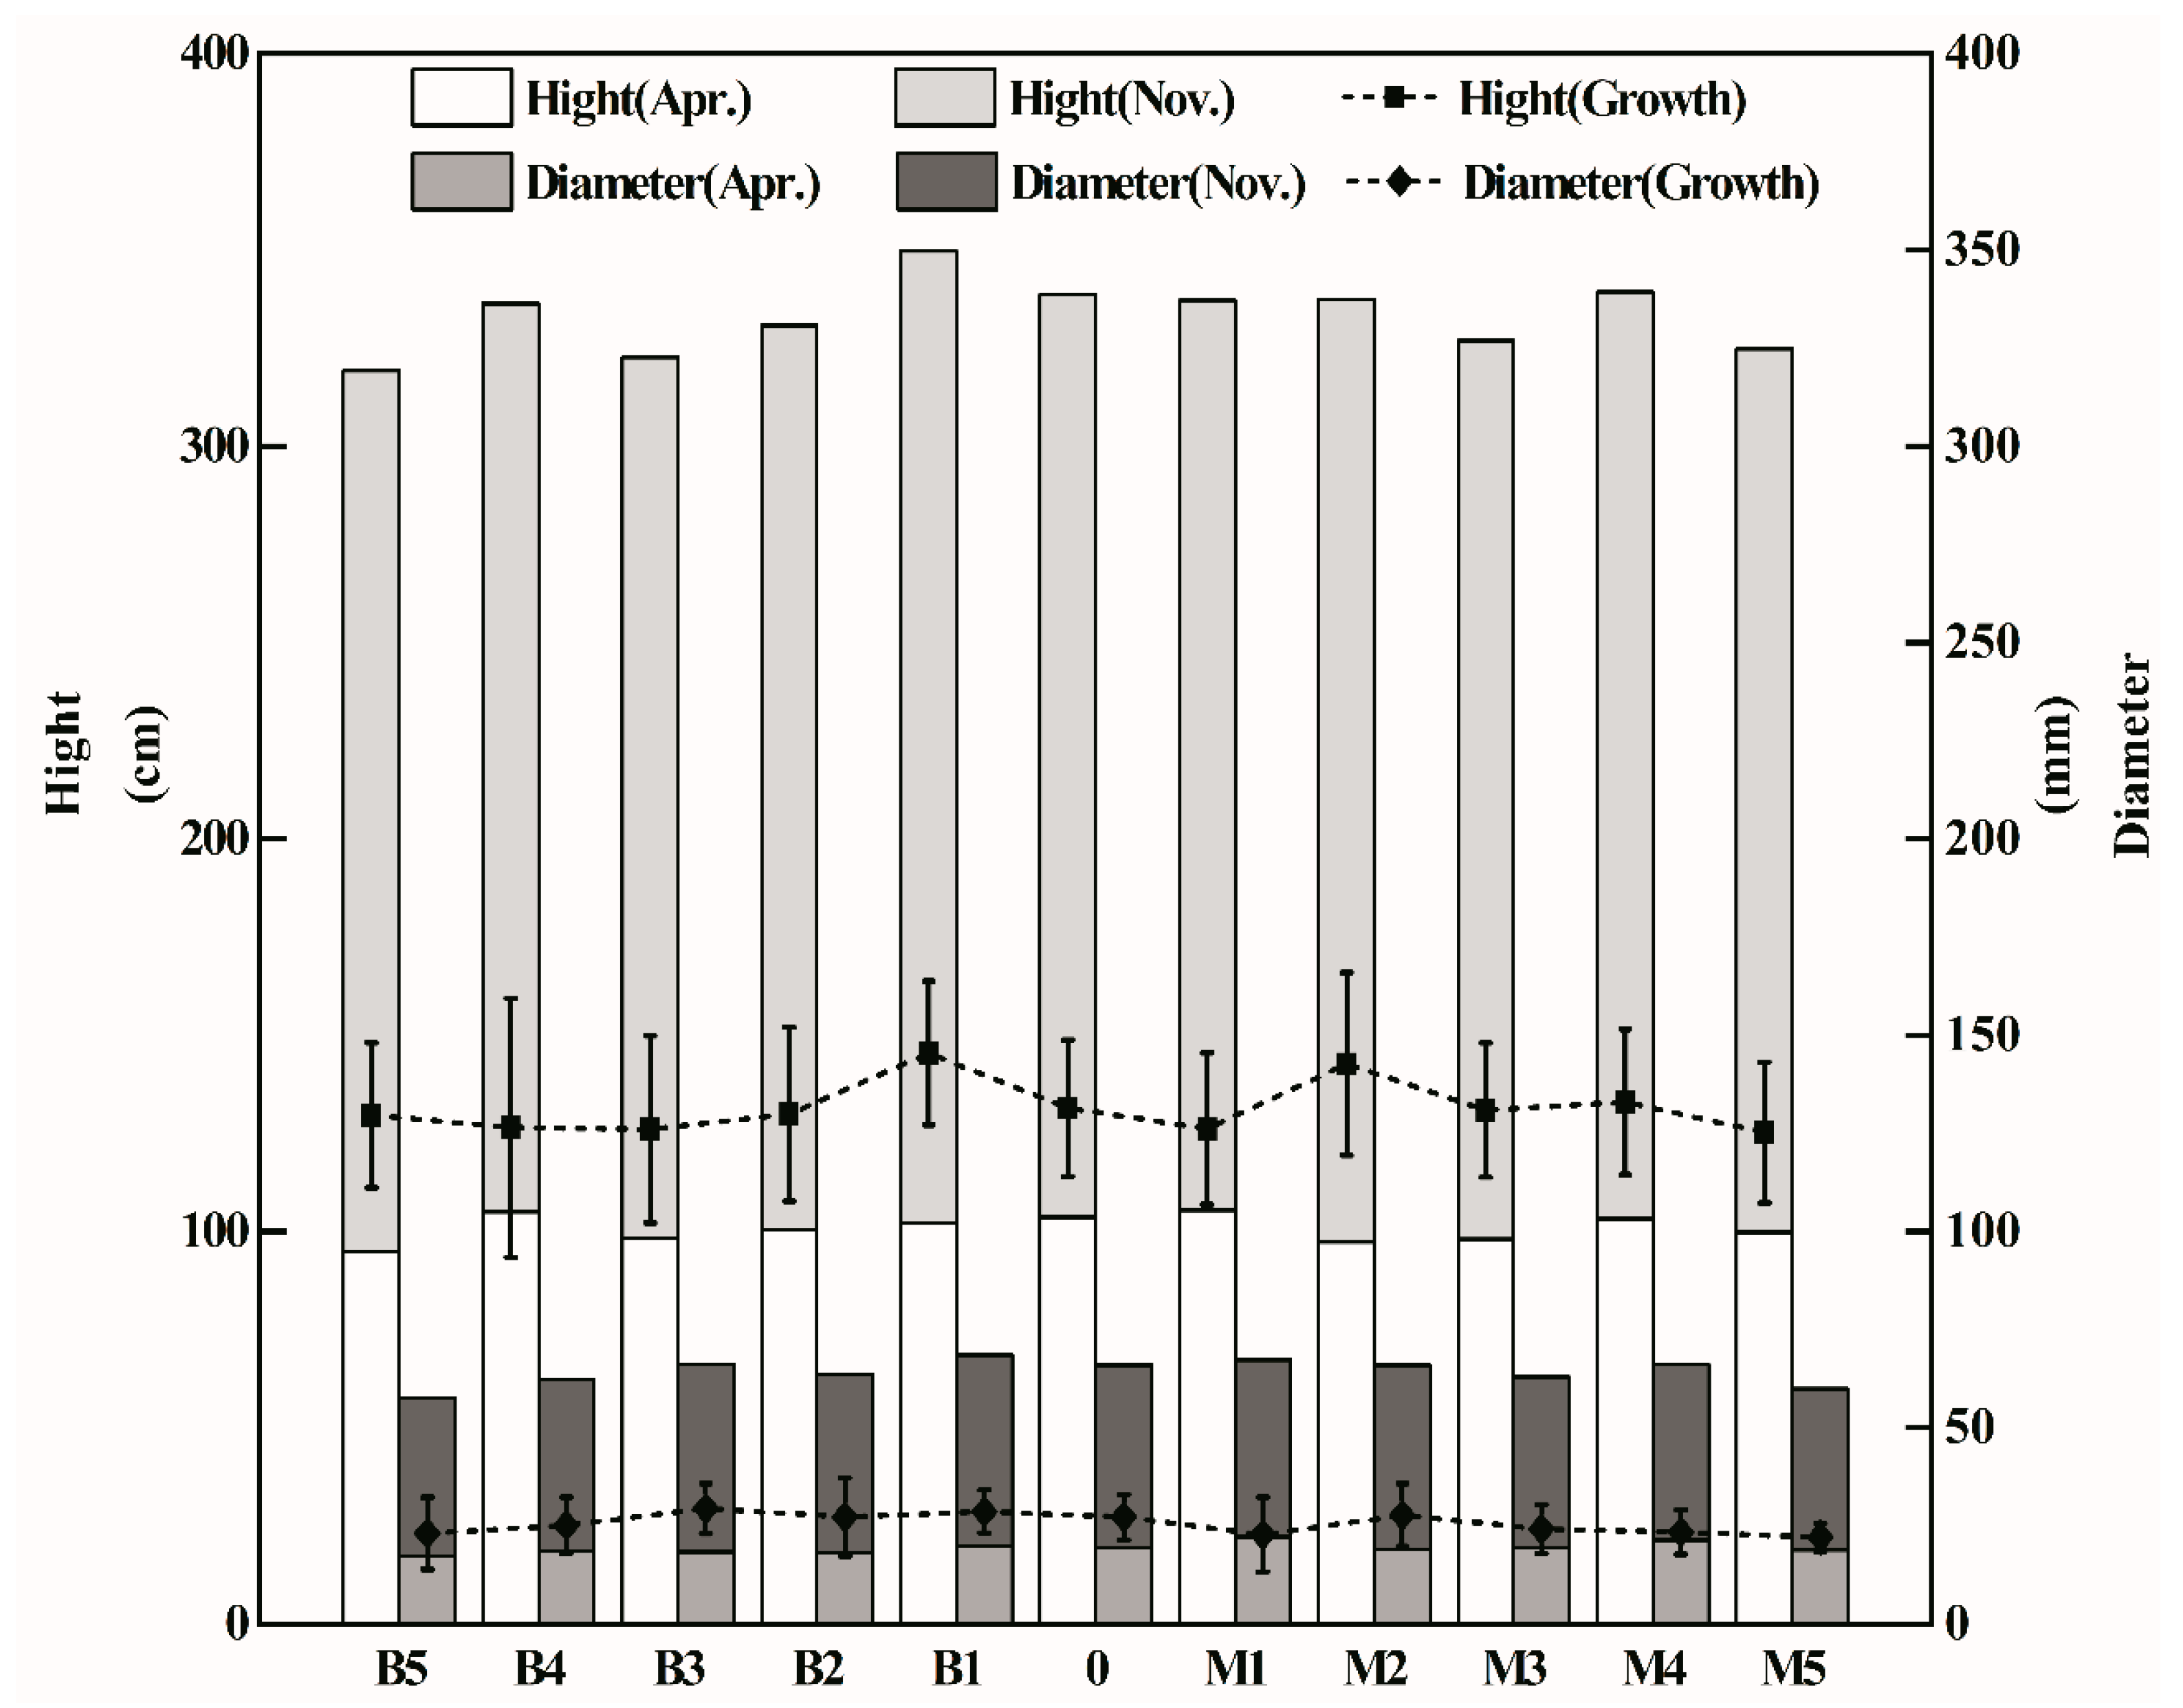
Figure 1. Growth of Chinese fir in a growing season. B and M indicate bamboo biochar and bacteria-inoculated biochar; 0, 1, 2, 3, 4, and 5 indicate control, 2.22 t·ha−1, 4.44 t·ha−1, 6.67 t·ha−1, 8.89 t·ha−1, and 11.11 t·ha−1.
Forests 11 00951 g001
Figure 2. Diversity indices calculated from gene sequencing data based on the operational taxonomic unit (OTU). (A) Fungal Shannon index. (B) Fungal Chao1 index. (C) Bacterial Shannon index. (D) Bacterial Chao1 index. B and M indicate bamboo biochar and bacteria-inoculated biochar; BS and RS indicate bulk soil and rhizosphere soil. 0, 1, 2, 3, 4, and 5 indicate control, 2.22 t·ha−1, 4.44 t·ha−1, 6.67 t·ha−1, 8.89 t·ha−1, and 11.11 t·ha−1. Small letter superscripts depict significance (p < 0.05) in the pairwise Tukey’s HSD test. Error bars represent the standard deviation from the mean (n = 3).
Forests 11 00951 g002
Figure 3. The relationships of microbial alpha diversity and chemical properties of the soil. (A) The relationships of fungal diversity and chemical properties in bulk soil. (B) The relationships of bacterial diversity and chemical properties in bulk soil. (C) The relationships of fungal diversity and chemical properties in rhizosphere soil. (D) The relationships of bacterial diversity and chemical properties in rhizosphere soil. The numbers on the right stand for the relationships between the diversity indexes and chemical properties of the soils based on the Pearson’s correlation analyses. Asterisks denote significant relationships between the microbial diversity indexes and the chemical properties (* p < 0.05).
Forests 11 00951 g003
Figure 4. The levels of relative fungal abundance of each phylum. Taxa with less than 1% of the total number of sequences are depicted in “other.” B and M indicate bamboo biochar and bacteria-inoculated biochar; BS and RS indicate bulk soil and rhizosphere soil. 0, 1, 2, 3, 4, and 5 indicate control, 2.22 t·ha−1, 4.44 t·ha−1, 6.67 t·ha−1, 8.89 t·ha−1, and 11.11 t·ha−1.
Forests 11 00951 g004
Figure 5. The levels of relative bacterial abundance of each phylum. Taxa with less than 1% of the total number of sequences are depicted in “other.” B and M indicate bamboo biochar and bacteria-inoculated biochar; BS and RS indicate bulk soil and rhizosphere soil. 0, 1, 2, 3, 4, and 5 indicate control, 2.22 t·ha−1, 4.44 t·ha−1, 6.67 t·ha−1, 8.89 t·ha−1, and 11.11 t·ha−1.
Forests 11 00951 g005
Figure 6. The relative abundances of top 10 main fungal genera. B and M indicate bamboo biochar and bacteria-inoculated biochar; BS and RS indicate bulk soil and rhizosphere soil. 0, 1, 2, 3, 4, and 5 indicate control, 2.22 t·ha−1, 4.44 t·ha−1, 6.67 t·ha−1, 8.89 t·ha−1, and 11.11 t·ha−1.
Forests 11 00951 g006
Figure 7. The relative abundances of top 10 main bacterial genera. B and M indicate bamboo biochar and bacteria-inoculated biochar; BS and RS indicate bulk soil and rhizosphere soil. 0, 1, 2, 3, 4, and 5 indicate control, 2.22 t·ha−1, 4.44 t·ha−1, 6.67 t·ha−1, 8.89 t·ha−1, and 11.11 t·ha−1.
Forests 11 00951 g007
Figure 8. Principal component analysis (PCA) plot of all soil fungal and bacterial communities. (A,B) The PCAs of the fungal and bacterial communities in bulk soil at OTU level, respectively; (C,D) the PCAs of the fungal and bacterial communities in rhizosphere soil at OTU level, respectively; B and M indicate bamboo biochar and bacteria-inoculated biochar; BS and RS indicate bulk soil and rhizosphere soil; 0, 1, 2, 3, 4, and 5 indicate control, 2.22 t·ha−1, 4.44 t·ha−1, 6.67 t·ha−1, 8.89 t·ha−1, and 11.11 t·ha−1.
Forests 11 00951 g008
Figure 9. Redundancy analysis (RDA)/canonical correlation analysis (CCA) of the soil fungal and bacterial communities at the OTU level. (A) Fungal community in bulk soil. (B) Bacterial community in bulk soil. (C) Fungal community in rhizosphere soil. (D) Bacterial community in rhizosphere soil. B and M indicate bamboo biochar and bacteria-inoculated biochar; BS and RS indicate bulk soil and rhizosphere soil. 0, 1, 2, 3, 4, and 5 indicate control, 2.22 t·ha−1, 4.44 t·ha−1, 6.67 t·ha−1, 8.89 t·ha−1, and 11.11 t·ha−1.
Forests 11 00951 g009
Table 1. Two kinds of biochar chemical properties.
SamplepHTC (%)TN (g·kg−1)TP (g·kg−1)TK (g·kg−1)AN (mg·kg−1)AP (mg·kg−1)AK (mg·kg−1)
B9.69 ± 0.0282.10 ± 1.016.15 ± 0.061.23 ± 0.0014.10 ± 0.010.00 ± 0.00133.13 ± 1.788656.00 ± 11.00
M8.21 ± 0.0178.70 ± 0.269.14 ± 0.183.67 ± 0.0012.72 ± 0.00715.58 ± 5.12108.43 ± 0.125623.33 ± 24.50
B and M indicate bamboo biochar and bacteria-loaded biochar. TC, TN, TP, and TK indicate total carbon, total nitrogen, total phosphorus, and total potassium, respectively. AN, AP, and AK indicate soil available nitrogen, available phosphorus, and available potassium, respectively.
Table 2. Soil chemical properties at different biochar addition dosage in bulk soil and rhizosphere soil.
SamplepHOC (g·kg−1)TN (g·kg−1)TP (g·kg−1)TK (g·kg−1)AN (mg·kg−1)AP (mg·kg−1)AK (mg·kg−1)
B
B
S
04.82 ± 0.35a29.49 ± 9.48a1.75 ± 0.16b0.19 ± 0.01ab20.43 ± 0.93a131.83 ± 41.46a13.72 ± 1.55a153.52 ± 39.48ab
14.71 ± 0.23a33.79 ± 3.75a1.85 ± 0.15ab0.19 ± 0.01ab21.05 ± 1.81a119.00 ± 43.71a13.11 ± 2.95a159.03 ± 25.05ab
24.91 ± 0.30a27.27 ± 3.95a1.57 ± 0.34b0.18 ± 0.02ab20.07 ± 2.63a112.00 ± 29.90a12.18 ± 4.16a168.80 ± 60.90ab
35.14 ± 0.38a36.06 ± 6.91a1.95 ± 0.32ab0.22 ± 0.03a19.22 ± 2.43a122.85 ± 42.14a15.19 ± 7.63a199.07 ± 108.78a
45.24 ± 0.60a35.95 ± 4.63a2.28 ± 0.38a0.20 ± 0.05ab19.63 ± 3.59a157.50 ± 52.96a13.61 ± 5.02a171.13 ± 45.19ab
54.70 ± 0.09a27.90 ± 0.87a1.49 ± 0.05b0.17 ± 0.00b17.78 ± 2.23a127.17 ± 14.57a8.72 ± 1.26a94.03 ± 32.49b
M
B
S
04.82 ± 0.35a29.49 ± 9.48a1.75 ± 0.16a0.19 ± 0.01a20.43 ± 0.93a131.83 ± 41.46a13.72 ± 1.55a153.52 ± 39.48a
14.64 ± 0.23a31.04 ± 7.78a1.74 ± 0.48a0.18 ± 0.04a18.66 ± 1.18a102.67 ± 49.04a15.70 ± 8.31a210.40 ± 111.75a
24.63 ± 0.18a33.94 ± 4.14a1.81 ± 0.30a0.20 ± 0.03a18.56 ± 1.66a114.33 ± 31.76a14.78 ± 4.80a177.99 ± 55.08a
34.73 ± 0.36a29.46 ± 4.15a1.63 ± 0.24a0.17 ± 0.01a17.30 ± 2.20a121.33 ± 10.69a13.24 ± 3.38a172.47 ± 75.62a
44.64 ± 0.31a27.74 ± 3.67a1.63 ± 0.06a0.18 ± 0.00a18.38 ± 2.57a120.17 ± 21.10a14.10 ± 6.02a148.63 ± 25.61a
54.88 ± 0.28a33.52 ± 9.37a1.65 ± 0.43a0.17 ± 0.02a20.29 ± 4.34a122.50 ± 53.88a13.26 ± 1.33a182.23 ± 79.20a
B
R
S
04.70 ± 0.17a24.01 ± 9.80a1.67 ± 0.41a0.18 ± 0.02a19.94 ± 2.47a148.28 ± 62.05a12.63 ± 2.94a138.03 ± 9.23a
15.07 ± 0.23a25.09 ± 10.45a1.54 ± 0.22a0.18 ± 0.02a20.52 ± 1.97a136.50 ± 18.52a10.15 ± 0.58a121.23 ± 19.66a
25.09 ± 0.57a32.59 ± 3.25a1.89 ± 0.40a0.19 ± 0.03a20.89 ± 2.31a183.17 ± 93.02a11.96 ± 2.49a181.88 ± 87.78a
35.02 ± 0.38a33.24 ± 4.66a1.55 ± 0.19a0.17 ± 0.01a20.20 ± 3.05a151.67 ± 40.57a10.48 ± 1.10a132.07 ± 10.10a
45.02 ± 0.32a30.90 ± 1.60a1.63 ± 0.25a0.18 ± 0.02a19.24 ± 3.83a172.67 ± 33.63a11.18 ± 3.48a167.40 ± 50.08a
54.92 ± 0.07a33.16 ± 6.14a1.72 ± 0.16a0.18 ± 0.01a17.60 ± 4.11a161.00 ± 21.29a12.37 ± 2.53a170.43 ± 35.31a
M
R
S
04.70 ± 0.17b24.01 ± 9.80a1.67 ± 0.41a0.18 ± 0.02a19.94 ± 2.47a148.28 ± 62.05a12.63 ± 2.94a138.03 ± 9.23ab
14.84 ± 0.16ab36.77 ± 15.27a1.58 ± 0.25a0.18 ± 0.01a19.19 ± 1.05a138.83 ± 10.69a11.94 ± 0.74a110.50 ± 7.25b
24.80 ± 0.29ab33.91 ± 6.79a1.82 ± 0.25a0.20 ± 0.02a17.85 ± 0.63a138.83 ± 59.64a15.23 ± 2.04a196.57 ± 99.58a
34.71 ± 0.19b28.78 ± 9.78a1.45 ± 0.43a0.17 ± 0.03a18.93 ± 1.45a129.50 ± 71.47a11.55 ± 3.76a132.43 ± 16.49ab
44.91 ± 0.10ab33.21 ± 8.17a1.68 ± 0.45a0.20 ± 0.03a18.49 ± 1.60a149.33 ± 28.07a12.69 ± 2.52a163.50 ± 49.51ab
55.05 ± 0.16a35.74 ± 5.49a1.92 ± 0.52a0.20 ± 0.02a18.20 ± 2.36a175.00 ± 35.52a13.87 ± 0.58a182.83 ± 34.08ab
B and M indicate bamboo biochar and bacteria-inoculated biochar; BS and RS indicate bulk soil and rhizosphere soil. 0, 1, 2, 3, 4, and 5 indicate control, 2.22 t·ha−1, 4.44 t·ha−1, 6.67 t·ha−1, 8.89 t·ha−1, and 11.11 t·ha−1. OC, TN, TP, and TK indicate soil organic carbon, total nitrogen, total phosphorus, and total potassium, respectively. AN, AP, and AK indicate soil available nitrogen, available phosphorus, and available potassium, respectively. Different letters within the same column indicate significant differences between treatments in individual sampling time tested by one-way ANOVA (p < 0.05).