Article

Reduction of Atmospheric Suspended Particulate Matter Concentration and Influencing Factors of Green Space in Urban Forest Park

College of Landscape Architecture and Art, Northwest A&F University, Xianyang 712100, China
*
Author to whom correspondence should be addressed.
These authors contributed equally to this work.
Forests 2020, 11(9), 950; https://doi.org/10.3390/f11090950
Submission received: 8 July 2020 / Revised: 24 August 2020 / Accepted: 27 August 2020 / Published: 30 August 2020

Abstract

:
In the process of urbanization in China, the problem of atmospheric suspended particulate matter pollution is becoming increasingly serious. It has been impossible to completely rely on pollution source control measures to solve this problem for a long time due to the diversity and complexity of pollution sources. Therefore, there is an urgent need to explore alternate solutions to significantly improve air quality through increasing the capacity of green space in cities as these locations can provide multiple ecosystem services. In this study, a three-dimensional classification system was created by utilizing Beijing’s urban forest as a study area. Considering the meteorological factors, change of month and time and the characteristics of the forest itself, the significance and difference of reducing the concentration of atmospheric suspended particulate matter by the forest with different vegetation structures were tested. The results showed that meteorological factors such as wind velocity, temperature, and relative humidity all had a very significant effect on the concentration of atmospheric suspended particulate matter in the conditions of this study. The concentration was highest in winter, followed by spring and autumn, and lowest in summer. The concentration in the morning was the lowest of the day, increasing in the noon and afternoon with time. It was the lowest in the closed single-layered mixed forest, and the highest in the open lawn green space. By comparing the forest with gradient areas of 0.5 ha and 3.0 ha, it was found that with the increase in the area, the green space did not necessarily show a better dust retention effect, and the vegetation structure type of the green space often had more important influence. There was a very significant correlation between vegetation structure and plant diversity (Shannon–Wiener Diversity Index and Simpson Diversity Index). Biodiversity could significantly support and strengthen urban forest ecological service functions that improve air quality. Increasing the plant species diversity could lead to lower particulate matter concentration. The research conclusions could provide theoretical and practical bases for how to select the combination of vegetation structure in the planning and design of urban forest oriented to improve air quality.

1. Introduction

With the acceleration of China’s urbanization process and the rapid development of industry, the problem of atmospheric suspended particulate matter pollution is becoming more serious [1,2]. At present, the sources of atmospheric suspended particulate matter pollution in Chinese cities are numerous and complex, because the sources and proportions of atmospheric suspended particulate matter are affected by many factors in different cities and regions [3,4,5]. Atmospheric suspended particulate matter affected the climate by changing the optical properties of clouds and their distribution, increasing the reflection of solar radiation [6], which was also a major factor in reducing urban atmospheric visibility [7]. It also seriously threatened the health of urban residents, especially posing threats to the human cardiovascular system and respiratory system [8,9]. The toxic and harmful substances carried on the surface could also enter the human body, causing harm [10]. The World Health Organization (WHO) showed that air pollution has become one of the leading causes of premature deaths in the world, causing approximately 7 million deaths each year (WHO 2018).
Faced with such severe atmospheric suspended particulate matter pollution problems, cities across the country had adopted a series of related measures designed to combat the increase in the concentration of atmospheric suspended particulate matter, such as vehicle restriction, coal-fired control, enterprise shutdown, and governance of key polluting enterprises for rectification [11,12]. The results showed that the above measures had the best effect in alleviating the problem of atmospheric suspended particulate matter pollution during the control period. During the two-day meeting of the 2016 Hangzhou G20 Summit, air quality was extremely improved because all the polluting factories were not allowed open [13]. According to the “China Ecological Environment Bulletin” issued by the Ministry of Ecology and Environment, more than 64% of the 338 cities at the prefecture level and above had exceeded the standard of ambient air quality from 2016 to 2018, and the number of days with PM2.5 as the primary pollutant accounted for more than 60% of the days with severe pollution and above, and for PM10 it exceeded 20%, resulting in an overall less than optimistic situation. Thus, it could be concluded that it was unreliable to completely rely on pollution source control measures for solving the problem of atmospheric suspended particulate matter pollution for an extended period of time in the process of urbanization and industrialization in China.
According to China’s “Standard for classification of urban green space (CJJ/T 85-2017)”, urban land with natural or artificial vegetation as the main form was called urban green space, which was an important part of the urban ecosystem and plays an important role in regulating and optimizing the urban ecological environment, especially urban forest. The multiple ecosystem services provided by urban forest were often effectively supported and strengthened through biodiversity, such as mitigating climate change, significantly affecting carbon storage or sequestration [14], and positively affecting human health and well-being such as human physical, psychological, and cognitive functions [15]. Improving air quality was one of the most important ecosystem service functions of urban forest [16], and it was inseparable from the healthy life of urban residents, which was also affected by biodiversity. Few studies had quantified the ability of urban forest to improve air quality from the perspective of biodiversity, which was of great significance for the study of forest ecosystem service functions.
The study of green space and atmospheric suspended particulate matter was divided into different environmental levels: tree level, site level, and city level. From the tree level, the leaf morphological structure of individual plants such as rough leaf surface, thicker waxy layer and leaf hair were more conducive to capturing atmospheric suspended particulate matter [17]. From the site level, studies explored which collocations of arbor and shrubs in a small area of urban green space could effectively reduce the concentration of atmospheric suspended particulate matter. Some scholars believed that the ability of green space to reduce atmospheric suspended particulate matter mainly depended on leaves and trunks, and was positively correlated with canopy density, forest diameter at breast height (DBH), and weakly correlated with herb coverage [18]. Studies on different types of vegetation had found that mixed forest had higher rate of reduction of atmospheric suspended particulate matter than broadleaved forest and coniferous forest, with higher concentration in shrubs and lawns [19]. Others found that broadleaved forest alone was more effective in purifying atmospheric suspended particulate matter [20]. It had also been found that concentration was lower in lawns [21]. From the city level, the ability to remove air pollutants throughout the city or region was assessed by using urban tree coverage data, meteorological data, and air pollution data modeling [22,23]. Different land-use types had different effects on the reduction of atmospheric suspended particulate matter, which was related to the tree coverage [24]. Higher green coverage in the region helped to reduce the concentration of particulate matter in the air and was usually negatively correlated [25]. Studies at different levels had confirmed that green space did improve air quality, but no constructive plan had been proposed for landscape level green space planning and design. There was no uniform standard for dividing the urban forest vegetation structure, and the conclusions obtained cannot be compared horizontally. The forest with different vegetation structures contain rich biodiversity information [26,27], which was also an important missing point in such studies.
In addition, the green area and meteorological environmental factors of the plot would also act together to change the concentration of particulate matter. Large-area green patches and high green coverage areas had advantages in removing air pollution [24,28]. In the case of severe urban forest fragmentation and the current situation of urban land use [29], solutions of how to make limited urban forest resources maximize the ability to reduce atmospheric suspended particulate matter through scientific landscape planning and design is very urgent. Meteorological factors such as wind velocity, temperature, and relative humidity could affect the diffusion and settlement of particulate matter [30,31]. Furthermore, the effect on different particle sizes differed [32]. At present, few studies on the dust-retaining effect of urban forest included meteorological factors in the model analysis, and most of them had been studied separately.
Therefore, this study screened the spatial structure and species component that had a certain basis and could visually represent the urban forest attributes as the vegetation structure factor. The urban forest was divided with the field situation, and a set of urban forest classification systems with unified standards was formed. Based on the consideration of meteorological factors, the effectiveness and differences of urban forest characteristics such as different combinations of vegetation structure, changes in biodiversity information, and differences in green area to reduce the concentration of atmospheric suspended particulate matter were explored. This provided a theoretical basis and practical methods for the design of urban forest and vegetation planting oriented to reduce atmospheric suspended particulate matter concentration.

2. Materials and Methods
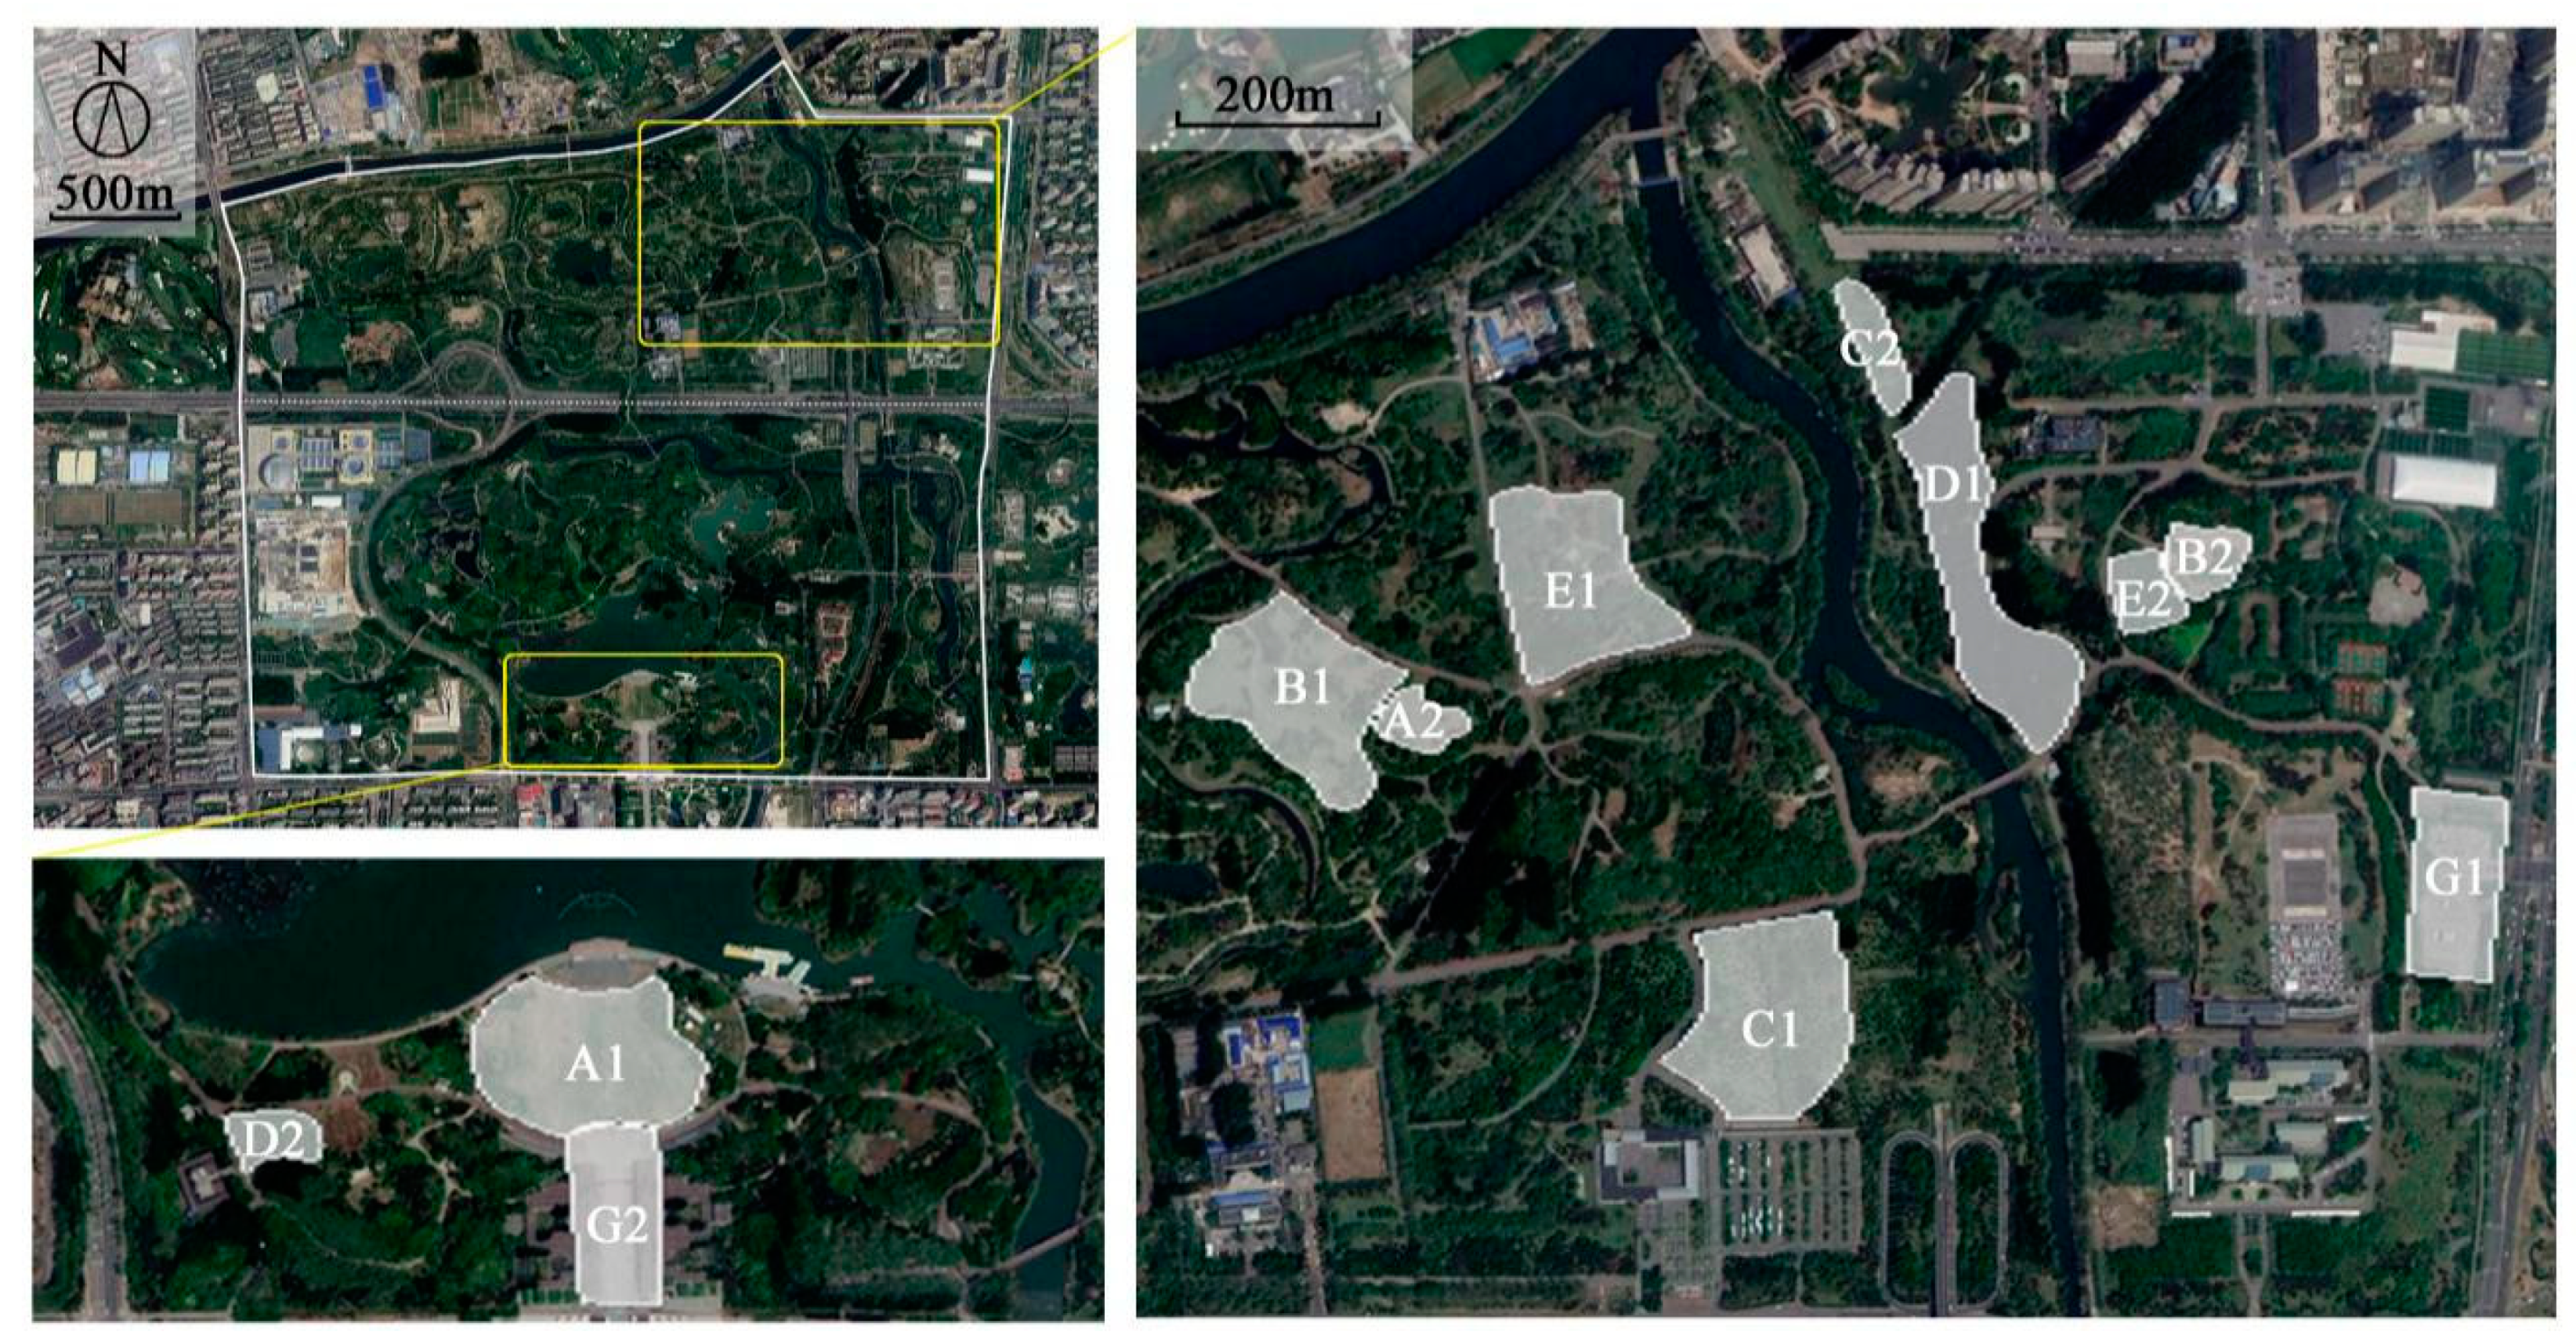
2.1. Study Area

Beijing is located in the northern part of the North China Plain in China between 115.7°–117.4° E and 39.4°–41.6° N. The climate is typical of warm temperate semi-humid continental monsoon climate with four distinct seasons, the longest being cold and dry in winter, followed by high temperatures and rain in summer, and finally a short spring and autumn. The precipitation season is very uneven, with 3/4 of the annual precipitation concentrated in the summer.
The Olympic Forest Park, selected as a study area, is located along Lincui Road, in the Chaoyang District of Beijing. The park covers an area of 680 ha, with a green coverage rate of 95.61%. With the Fifth Ring Road as the boundary, the park is divided into two parts, the South and the North. It is a near-natural forest system composed of various vascular plants according to the design ideas of biodiversity (Figure 1).

2.2. Classification of Urban Forest Green Space

Through Google satellite image interpretation and field research, combined with the characteristics of urban forest in Beijing, a three-dimensional urban forest classification system based on vegetation structures was constructed (Table 1) [26]. The classification began with a dimension based on the horizontal structure, where the canopy cover ratio of trees and shrubs was included. The second dimension was developed including the type of grassland and woodland. According to the species composition, grasslands were divided into two groups—lawn and grass flower, woodlands were divided into three groups—coniferous, broadleaved and mixed. The last dimension emphasized the vertical structure of woodlands, divided into single-layered and multi-layered. In this study, we considered that single-layered only contains the arbor layer; multi-layered could be any combination of shrub layer and arbor layer.

2.3. Plot Determination and Information Recording

Through the classification and field investigation of the characteristics and on-site environmental of forests in the Beijing Olympic Forest Park, five common types were selected as research sites, including open lawn green space (A), semi-open lawn green space (B), semi-closed single-layered broadleaved forest (C), closed single-layered broadleaved forest (D), and closed single-layered mixed forest (E). The distance between the plot and the park boundary was similar, and the central area of the park had not been selected, which also considered that the existence of terrain changes such as mountains may have an impact and ensured the similar effect of road pollution sources. The area of different types of green spaces in the park was evaluated, and two sizes of area gradients were selected for comparison (0.4–0.5 ha; 2.7–3.0 ha), and each type was repeated twice. In addition, two gray spaces (G) were selected as the control group including the entrance plaza in the south part of the forest and the parking lot in the east gate of the north part. They were close to the road and could be compared with green space as road pollution data (Figure 1 and Figure 2).
The biological and ecological information of the selected plots were investigated and recorded including plot area, vegetation coverage, plant species list and frequency, etc. The general range of the selected plot was drawn in the Google satellite map, and then a hand-held GPS receiver (Garmin GPS map 629sc) was used to obtain the latitude and longitude around the plots and to calculate the area accurately.
The collection of plant diversity information in the plots used the sample strip measurement method. Three 60 m long and graduated sample strips were set evenly and in parallel in each plot, with each strip covering as many plants as possible (for 0.4–0.5 ha plots, remove the 5 m edge distance to place the sample strip, and for 2.7–3.0 ha plots, remove the 15 m edge distance to place the sample strips). Plants that were exposed to the sample strip or that were perpendicularly projected to the sample strip were recorded on a 2 m sample strip every 4 m. The plant species and frequency that came into contact with the sample strips were recorded as well. Each time a plant touched a sample strip, the frequency was recorded as “1”, with the total frequency equating to the sum of the frequency of the plant species on the three sample strips. The plant species within the site but not touching the sample strip were recorded as often as possible, and the frequency value of the plant species was recorded as “1”.

2.4. Field Monitoring

During the experiment, the wind direction in Beijing was dominated by southwesterly winds, with slight changes in spring and autumn, alternating with northwest, northeast or southwesterly winds. In order to weaken the influence of meteorological factors on the experimental results and highlight the effect of forest characteristics, this study chose fine weather with sunny, breeze or windless conditions and no precipitation occurring in the 3 days before the monitoring to conduct the experiment, while monitoring the changes of meteorological factors (wind velocity, temperature, relative humidity). The meteorological factors were monitored through the use of a hand-held weather station (Kestrel 5500) and atmospheric suspended particulate matter concentration (TSP, PM10, PM2.5, PM1.0) was monitored using a hand-held particle counter (Aerocet 831) in the selected plots. The accuracy of both instruments was 0.1, and all instruments were zero-calibrated under the same conditions before each experiment. The height of the monitoring was about 1.5 m, which was the average height at which human breathing occurred. Four locations were uniformly selected as the sampling points in a grid pattern in each plot to represent the typical vegetation structure type. Each sample point lasted for one minute at a time. Data were collected during 3 time periods of a single day, namely: 07:00–10:00, 11:00–14:00, 15:00–18:00, 2 days a month, for 12 months from October 2018 to September 2019 for continuous monitoring. During the same period of time, all sampling points and all plots were monitored in the same sequence.

2.5. Statistical Analysis

Using Microsoft Office Excel 2007 for data collection, the Shannon–Wiener Diversity Index (SHDI) and Simpson Diversity Index (SIDI) were used for calculating the plant diversity of each plot.
SHDI   =   i = 1 m ( A i A ) × ln ( A i A )
SIDI   =   1 i = 1 m ( A i A ) 2
where Ai represents the frequency value of the plant species i; A represents the frequency values of the total plant species in a certain sample plot; m is the total number of all plant species in a particular sample plot; and higher value indicates higher degree of diversity.
The correlation between meteorological factors, month, time, vegetation structure, green area, plant diversity index and atmospheric suspended particulate matter concentration and its significance were tested using the general linear model and linear regression model with the mathematical statistical software Minitab 17. Data were transformed into an optimal λ value to fit the model appropriately if necessary. The Tukey method was used to perform multiple comparisons of means. The accepted significance level was at p < 0.05. According to the results of statistical analysis, the value of urban forest based on green space characteristics and meteorological factors in reducing the concentration of suspended particulate matter was determined.

3. Results

3.1. Influence of Meteorological Factors

Although sunny and windless weather was chosen to minimize the influence of meteorological factors in this experiment, it was still found that meteorological factors such as wind velocity, temperature and relative humidity had an extremely significant effect on the concentration of atmospheric suspended particulate matter through linear regression analysis (p < 0.01) (Table 2). The range of wind velocity varied from 0 to 6.7 m/s, in which the concentration of particulate matter decreased with increasing wind velocity. The temperature varied from −9.6 °C to 40.9 °C and the concentration of particulate matter decreased with increasing temperature. The relative humidity varied from 7.9 to 95.6%, and the concentration of particulate matter increased with the increase in relative humidity (Figure 3).

3.2. Influence of Month and Time

General linear models of the month, time and atmospheric suspended particulate matter concentration were established, and meteorological factors were included in the analysis. The results showed that month and time both had a very significant effect on particulate matter concentration (p < 0.01) (Table 3).
The concentration of atmospheric suspended particulate matter was highest in winter, followed by spring and autumn, with some fluctuations, and it was lowest and most stable in summer. For the four kinds of particles, the trend in concentration change was consistent with the change of the month (Figure 4).
The concentrations of TSP and PM10 with larger particle sizes showed a nearly linear upward trend in one day. There was a significant difference in concentration in the three time periods, with the lowest in the morning, the middle at noon, and the highest in the afternoon. However, the concentrations of PM2.5 and PM1.0 with smaller particle sizes in the morning were significantly different from those in the noon and afternoon, that is, the lowest concentrations were shown in the morning, and the concentrations in the noon and afternoon were higher and similar (Figure 5).

3.3. Influence of Vegetation Structure

A general linear model of the concentration of atmospheric suspended particulate matter in the five vegetation structures selected in this study and the gray space was considered, taking into account the effects of meteorological factors. The results showed that the forest containing different vegetation structures had extremely significant effects in the reduction of four kinds of atmospheric suspended particulate matter (p < 0.01) (Table 4). Grouping information for multiple comparisons of means indicated that there was a significant difference in the concentration in the gray space, the open lawn green space and the closed single-layered mixed forest. The closed single-layered mixed forest had the best reduction effect, which was consistent for the four different particle sizes. In addition, the concentration of PM2.5 also significantly differed in the gray space and closed single-layered broadleaved forest. For PM1.0, its concentration was significantly reduced in semi-closed and closed single-layered broadleaved forest (Figure 6). Overall, vegetation structure had varying effects on the particles of different sizes. As the complexity of vegetation structure increased, the ability of reducing particulate matter increased, with the reduction of particles with smaller particle size increasing as well.

3.4. Influence of Green Area

In this study, two area gradients were selected to classify each vegetation structure green space and the influence of meteorological factors was also considered. It was found through the general linear model analysis that these gradients had an extremely significant effect (p < 0.01) (Table 5). For the open lawn green space, semi-open lawn green space and semi-closed single-layered broadleaved forest, the concentration of atmospheric suspended particulate matter in the 2.7–3.0 ha gradient was higher, especially for open lawn green space. However, for closed single-layered broadleaved and mixed forest, the concentration of atmospheric suspended particulate matter in the 2.7–3.0 ha gradient was lower. Especially for closed single-layered mixed forest, as such the vegetation structure type of forests had a strong ability to reduce the concentration of atmospheric suspended particulate matter even in two kinds of area gradients in this study (Figure 7).

3.5. Influence of Plant Diversity

The main plant species appearing in each research plot were recorded and the relative plant diversity index was also calculated (Table 6).
The analysis of general linear models found that the SHDI and SIDI values had extremely significant effects on the green spaces with different vegetation structures (p < 0.01) (Table 7), and its change trend was consistent with the change of the vegetation structure of the green space. The values of semi-closed single-layered broadleaved forest and closed single-layered mixed forest were the highest, followed by semi-open lawn green space and open lawn green space, with the lowest being the closed single-layered broadleaved forest (Figure 8).
Linear regression analysis was performed on the SHDI and SIDI values and the concentration of atmospheric suspended particulate matter, with the influence of meteorological factors taken into consideration. The SHDI values had extremely significant effects on TSP and PM10 concentrations (p < 0.01) and significant effects on PM2.5 and PM1.0 concentrations (p < 0.05). The SIDI values only had an extremely significant effect on TSP and PM10 concentrations (p < 0.01) (Table 8). With the increase in SHDI and SIDI values, the concentration of atmospheric suspended particulate matter showed a linear downward trend (Figure 9).

4. Discussion

4.1. Effects of Meteorological and Time Factors on Atmospheric Suspended Particulate Matter Concentration

The concentration of atmospheric suspended particulate matter differed with varying meteorological factors. There were differences in the effects of varying wind velocity on the concentration of particulate matter. Existing research showed that wind velocity may increase or decrease the concentration of particulate matter, which may be related to the value of wind velocity and the surrounding pollution conditions, affecting the diffusion or deposition of particulate matter. For the definition of the critical value of wind velocity change, existing research conclusions were not completely consistent [30,33]. In addition, the suspension of particulate matter was also affected by the characteristics of the leaf surface. When the wind velocity was low, the stomatal density and leaf hair density had a significant effect on the suspension of particulate matter, which had a negative correlation. When the wind velocity was high, the effect of the blade surface structure on the suspension of particulate matter became less critical [31]. This experiment was conducted in windless or breezy weather. The vegetation could fully play the role of retention, and there may also be the diffusion of particulate matter, which made the concentration of particulate matter lower. Moreover, there was no obvious pollution source around; the influence of the particles from the source region could be regarded as very small.
When the temperature was high, the convective atmosphere made the vertical turbulent movement strong, which was conducive to the diffusion of particulate matter, thus accelerating the transport of particulate matter and reducing the concentration of particulate matter in the forest. As the temperature decreased, the low-level atmospheric convective motion and vertical turbulent motion were weak, resulting in greater difficulties of transferring the particulate matter. Thus, the concentration of particulate matter in the forest was highest when the temperature decreased, resulting in an inverse relationship between temperature and particulate matter concentration [18].
Relative humidity was an important factor affecting the concentration of atmospheric suspended particulate matter and it played an important role in the deposition and condensation of particulate matter [34]. In a certain relative humidity range, particulate matter was more likely to agglomerate as condensation nuclei and increase in concentration. When the relative humidity increased to a certain extent, the amount of wet deposition increased, and the concentration of particulate matter decreased [30]. However, during the relative humidity change in this study, only a positive correlation between particulate matter concentration and relative humidity was shown. Since this study was conducted in the urban forest, the increase in wettability and relative humidity would trigger some emission mechanisms of biological particles, and may also increase the concentration of particulate matter around plants to a certain extent [35].
Considering that the meteorological factors had a considerable impact on the concentration of atmospheric suspended particulate matter, the meteorological factors were used as covariates when analyzing the effects of other variables. The analytical model showed a high degree of fit and credibility.
Due to the influence of meteorological factors, physiological characteristics of vegetation, and human activities, the concentration of atmospheric suspended particulate matter varied with the month and time. Due to the negative correlation between wind velocity and particulate matter concentration, the monsoon phenomenon in spring and autumn might cause the concentration to fluctuate up and down. The temperature in winter was low and the concentration of particulate matter was high. The high temperature in summer could accelerate the movement of particulate matter and reduce its concentration. Beijing received a high amount of summer precipitation, which had a significant effect on particulate removal [30]. Vegetation could control particulate matter in the air most effectively at the stage of full leaf development, and had the weakest dust-holding effect in the leafless period in winter [21]. In addition, coal-fired heating in the winter in the north also had a certain promotion effect on the increase in atmospheric suspended particulate matter concentration [3]. During the day, the particulate matter concentration was the lowest in the morning, as the forest condensed the water vapor at night resulting in increased humidity, which was conducive to the wet sedimentation of the particulate matter. With frequent airflow exchanged at noon and in the afternoon, the particulate matter diffuses and remains in the air, so its concentration increases [18]. The number and density of small particles such as PM2.5 and PM1.0 adsorbed on the leaf surface were significantly higher [17], while larger particles such as TSP and PM10 were more suspended in the atmosphere, which might be an important reason for the different trends in the concentration of particles of different sizes at noon and afternoon.

4.2. Difference of Atmospheric Suspended Particulate Matter Concentration in Urban Forest with Different Vegetation Structures

The concentration of atmospheric suspended particulate matter was highest in the gray space, with the concentration in the open lawn green space being slightly lower than that in the gray space, but there was no significant difference between the two types. The effect of semi-open lawn green space, semi-closed and closed single-layered broadleaved forests on the reduction of atmospheric suspended particulate matter was moderate, and the closed single-layered mixed forest had the strongest reduction effect.
The open lawn had a low coverage of arbor, contained only herbs and ground cover plants, and lacked trees and shrubs that could played a major role in dust retention. The microscopic structure of the leaves of the trees and shrubs, such as the rough surface of the epidermis, the leaf hair, and the waxy layer, made it capable of capturing and retaining particles of various sizes [17]. Coniferous trees such as Pinus tabuliformis have higher stomata density, deeper wavy texture, and secrete more oil, which make them able to hold more particles. The average retention of coniferous leaves was higher than that of cypress, followed by broadleaved trees [36]. Other broadleaved trees such as Ginkgo biloba, Populus tomentosa, Fraxinus chinensis, and Ailanthus altissima have rough leaf surfaces with protrusions or groove-like structures, waxy, and polyglandular hairs which are also conducive to the retention of particulate matter [37,38]. When the air stream carrying atmospheric suspended particles passed through the green space of the multi-layer structure, the particles could be blocked and rubbed by the branches and leaves of the trees and shrubs, thereby accelerating the sedimentation process. Among them, the low shrubs were mainly interspersed with leaves, and the tall and leafy trees could display their strong dust-holding ability by using their complex canopy and high leaf density [39]. Others found that the ability of forests to reduce particulate matter concentration was significantly positively correlated with canopy density, leaf area index and DBH, but weakly correlated with herb height and herb cover [18]. Therefore, the ability of forests to reduce particulate matter mainly depended on leaves and trunks. The abundant vegetation in the closed forests and the high coverage of the shrubs greatly assisted its reduction of particulate matter. Compared with broadleaved trees, conifers had a clustered coniferous structure that was more resistant to airflow than broadleaved trees and more prone to turbulence, thus accelerating the dry deposition of particulate matter and allowing more particulate matter to settle onto the surface of the needle [40]. At the same time, the surface roughness of the conifer leaves was higher than that of the broadleaved trees, and thus it was easier to capture the particles in the air. The viscous substances secreted by the leaves were more likely to stick to the air particles, making them less likely to fall off and return to the air [33]. As a result, mixed forests had a better ability to reduce the concentration of atmospheric suspended particulate matter compared with broadleaved forests.
The gray space contained almost no vegetation, and the various characteristics and structures of vegetation could not be used to purify the air. As the gray space was located on the edges of the forest park, traffic pollution and human activities may lead to higher concentrations of particulate matter to a certain extent [41].
There were differences in the adsorption of plants on different particle sizes, and fine particles were more easily adsorbed by plants such as leaf surface structures [17]. For the larger particle sizes, TSP and PM10, the closed single-layered mixed forest possessed the best ability to reduce particle concentration. With the reduction of particle sizes such as PM2.5 and PM1.0, the closed single-layered broadleaved forest could also play a role, even the semi-closed single-layered broadleaved forest.

4.3. Difference of Atmospheric Suspended Particulate Matter Concentration in Urban Forest with Different Areas

Varying areas of the urban forest impacted its ability to reduce the concentration of atmospheric suspended particulate matter. At present, more research has found that increasing vegetation coverage could significantly reduce the concentration of particulate matter [24]. However, this study found that greater reduction of particulate matter concentration was affected by the vegetation structure. Forest patches with dense canopies and larger areas were more capable of reducing the concentration of suspended particulate matter, such as can be seen in the closed single-layered broadleaved and mixed forests. Some studies have found that the area of forest patch had an autocorrelation relationship with the total leaf area [42]. Combined with the effect of green space vegetation characteristics on the concentration of particulate matter, as the area increased from 0.5 ha to 3.0 ha in this study, the rich vegetation could adsorb or retain more particulate matter, thus reducing its concentration. For open lawn green space with weak dust retention effect, the vegetation structure containing only the ground cover had a limited effect on reducing the concentration of particulate matter as the area increased, so its concentration increased.

4.4. Difference of Atmospheric Suspended Particulate Matter Concentration in Urban Forest with Different Plant Diversity

The change of plant diversity in urban forest with different vegetation structure was most likely related to the horizontal structure, vertical structure, and forest type of the vegetation. These were also the three dimensions utilized for dividing the type of vegetation structure in this study. The horizontal structure of the vegetation included the canopy cover as it affected the light conditions of the forest. Higher plant diversity was observed in semi-open/closed forests than in the closed forest, as semi-open/closed forests support both light-adapted and shade-adapted species [43]. The forest type indicated differences in species composition. Plant diversity was slightly higher in broadleaved forests than in coniferous forests, and mixed forests had significantly higher plant diversity [44,45]. The vertical structure showed the complexity of the forest level, and the plant diversity was higher in multi-layered forests than in single-layered forests [26]. The five most commonly used planting types in the urban forest were selected in this study. Based on a combination of three parameters, forests with semi-open/closed canopies had higher plant diversity. While forests with closed canopies could also increase plant diversity, particularly if they were mixed broadleaved and coniferous. In contrast, forests with open/closed canopies had lower plant diversity, especially for pure broadleaved.
Plant diversity was not only closely related to the vegetation structure of the forest, but also supported the ecological service function of urban forests to improve air quality. The concentration of atmospheric suspended particulate matter decreased with the increase in plant diversity. Particles of different sizes showed the same trend in reduction. The ability of a forest with relatively rich plant species to reduce particulate matter was stronger, even if it had the same vegetation structure [46]. Therefore, the richness of plants should be increased as much as possible to achieve a better dust retention effect and improve air pollution while considering the vegetation structure in the urban greening construction.

5. Conclusions

This study established a three-dimensional classification system of urban forest that incorporated vegetation structural factors. Based on the coordinated consideration of meteorological factors and the attributes of the green space itself such as area and plant diversity, the ability of urban forest to reduce the concentration of atmospheric suspended particulate matter under different vegetation structure factor combinations was quantified. This study aimed to provide an intuitive and easy-to-understand vegetation planting model for future urban forest planning and design. The study found that closed green space planted with mixed forest had strong dust retention capabilities, followed by closed green space containing only broadleaved forest. At the same time, increasing the plant diversity and expanding the area could increase the dust retention effect of the green space. On the contrary, open lawn green space had the worst dust retention ability, followed by semi-open lawn green space, and the concentration of particulate matter in larger green space could be even higher. Increasing plant diversity could produce a certain degree of mitigation of particulate matter concentration. The vegetation structure, area and plant diversity can be parametrically designed according to different green space utilization attributes. While satisfying the beautification and use functions of urban green space, it also improves the quality of green space ecological services. In the future, a quantitative assessment of the dust removal ability of the vegetation itself can be carried out. Because it may also cause pollen pollution and increase the concentration of particulate matter, how to distinguish pollen pollution from man-made pollution deserves further exploration. In addition, the role of meteorological factors can be refined, such as increasing the study of the dispersion of particles by wind direction.

Author Contributions

Conceptualization, F.L., L.Q. and T.G.; methodology, F.L., Y.W., S.M., L.Q. and T.G.; software, F.L., L.Q. and T.G.; validation, F.L., L.Q. and T.G.; formal analysis, F.L., L.Q. and T.G.; investigation, F.L., Y.W., S.M., L.Q. and T.G.; resources, L.Q. and T.G.; data curation, F.L., Y.W., S.M., L.Q. and T.G.; writing—original draft preparation, F.L.; writing—review and editing, F.L., L.Q. and T.G.; visualization, F.L., L.Q. and T.G.; supervision, L.Q. and T.G.; project administration, L.Q. and T.G.; funding acquisition, L.Q. and T.G. All authors have read and agreed to the published version of the manuscript.

Funding

This research was funded by the National Natural Science Foundation of China (grant numbers 31971722, 31971720), the Research Fund for Advanced Talents of Northwest A&F University [grant numbers Z111021501] and the Talent Support of Shaanxi Province (grant numbers A279021715 and A 279021830).

Acknowledgments

We are grateful to Katie Oswalt at Mississippi State University for modifying the language of this article.

Conflicts of Interest

The authors declare no conflict of interest.

References

  1. Rohde, R.A.; Muller, R.A. Air pollution in China: Mapping of concentrations and sources. PLoS ONE 2015, 10, e0135749. [Google Scholar] [CrossRef] [PubMed]
  2. Song, C.B.; Wu, L.; Xie, Y.C.; He, J.J.; Chen, X.; Wang, T.; Lin, Y.C.; Jin, T.S.; Wang, A.X.; Liu, Y.; et al. Air pollution in China: Status and spatiotemporal variations. Environ. Pollut. 2017, 227, 334–347. [Google Scholar] [CrossRef] [PubMed]
  3. Pui, D.Y.H.; Chen, S.C.; Zuo, Z.L. PM2.5 in China: Measurements, sources, visibility and health effects, and mitigation. Particuology 2014, 13, 1–26. [Google Scholar] [CrossRef]
  4. Kang, B.R.; Liu, L.Z.; Liu, H.W.; Li, Y.Y.; Ai, S.S.; Cao, N.; Lei, Y. Pollution characteristics and sources of carbonaceous components in PM2.5 in the Guanzhong area. Huanjing Kexue 2019, 40, 3431–3437. [Google Scholar] [CrossRef]
  5. Liu, Z.; Liu, L.; Yang, Y.B.; Li, X.; Shi, J.P.; Wang, Q.; Xu, D.Q. Characteristics and sources analysis of element in ambient PM2.5 in Taiyuan city. Spectrosc. Spectr. Anal. 2019, 39, 1593–1598. [Google Scholar] [CrossRef]
  6. Ramanathan, V.; Feng, Y. Air pollution, greenhouse gases and climate change: Global and regional perspectives. Atmos. Environ. 2009, 43, 37–50. [Google Scholar] [CrossRef]
  7. Lee, J.Y.; Jo, W.K.; Chun, H.H. Characteristics of atmospheric visibility and its relationship with air pollution in Korea. J. Environ. Qual. 2014, 43, 1519–1526. [Google Scholar] [CrossRef]
  8. Song, C.B.; He, J.J.; Wu, L.; Jin, T.S.; Chen, X.; Li, R.P.; Ren, P.P.; Zhang, L.; Mao, H.J. Health burden attributable to ambient PM2.5 in China. Environ. Pollut. 2017, 223, 575–586. [Google Scholar] [CrossRef]
  9. Zhang, C.Y.; Zhang, A. Climate and air pollution alter incidence of tuberculosis in Beijing, China. Ann. Epidemiol. 2019, 37, 71–76. [Google Scholar] [CrossRef]
  10. Wu, Y.J.; Li, G.Y.; Yang, Y.; An, T.C. Pollution evaluation and health risk assessment of airborne toxic metals in both indoors and outdoors of the Pearl River Delta, China. Environ. Res. 2019, 179, 1–9. [Google Scholar] [CrossRef]
  11. Cheng, N.L.; Cheng, B.F.; Li, S.S.; Ning, T.Z. Effects of meteorology and emission reduction measures on air pollution in Beijing during heating seasons. Atmos. Pollut. Res. 2019, 10, 971–979. [Google Scholar] [CrossRef]
  12. Yu, M.F.; Zhu, Y.; Lin, C.J.; Wang, S.X.; Xing, J.; Jang, C.; Huang, J.Z.; Huang, J.Y.; Jin, J.B.; Yu, L. Effects of air pollution control measures on air quality improvement in Guangzhou, China. J. Environ. Manag. 2019, 244, 127–137. [Google Scholar] [CrossRef] [PubMed]
  13. Mao, M.J.; Hu, D.Y. Evaluation of the air pollution control over Zhejiang province during the G20 Summit in Hangzhou. Res. Environ. Sci. 2017, 30, 1822–1831. [Google Scholar] [CrossRef]
  14. van der Sande, M.T.; Poorter, L.; Balvanera, P.; Kooistra, L.; Thonicke, K.; Boit, A.; Dutrieux, L.P.; Equihua, J.; Gerard, F.; Herold, M.; et al. The integration of empirical, remote sensing and modelling approaches enhances insight in the role of biodiversity in climate change mitigation by tropical forests. Curr. Opin. Environ. Sustain. 2017, 26–27, 69–76. [Google Scholar] [CrossRef] [Green Version]
  15. Sandifer, P.A.; Sutton-Grier, A.E.; Ward, B.P. Exploring connections among nature, biodiversity, ecosystem services, and human health and well-being: Opportunities to enhance health and biodiversity conservation. Ecosyst. Serv. 2015, 12, 1–15. [Google Scholar] [CrossRef] [Green Version]
  16. Matos, P.; Vieira, J.; Rocha, B.; Branquinho, C.; Pinho, P. Modeling the provision of air-quality regulation ecosystem service provided by urban green spaces using lichens as ecological indicators. Sci. Total Environ. 2019, 665, 521–530. [Google Scholar] [CrossRef]
  17. Weerakkody, U.; Dover, J.W.; Mitchell, P.; Reiling, K. Evaluating the impact of individual leaf traits on atmospheric particulate matter accumulation using natural and synthetic leaves. Urban For. Urban Green. 2018, 30, 98–107. [Google Scholar] [CrossRef]
  18. Liu, X.H.; Yu, X.X.; Zhang, Z.M. PM2.5 concentration differences between various forest types and its correlation with forest structure. Atmosphere 2015, 6, 1801–1815. [Google Scholar] [CrossRef] [Green Version]
  19. Gao, G.J.; Sun, F.B.; Thao, N.T.T.; Lun, X.X.; Yu, X.X. Different concentrations of TSP, PM10, PM2.5, and PM1 of several urban forest types in different seasons. Pol. J. Environ. Stud. 2015, 24, 2387–2395. [Google Scholar] [CrossRef]
  20. Deng, S.X.; Ma, J.; Zhang, L.L.; Jia, Z.K.; Ma, L.Y. Microclimate simulation and model optimization of the effect of roadway green space on atmospheric particulate matter. Environ. Pollut. 2019, 246, 932–944. [Google Scholar] [CrossRef]
  21. Nguyen, T.; Yu, X.X.; Zhang, Z.M.; Liu, M.M.; Liu, X.H. Relationship between types of urban forest and PM2.5 capture at three growth stages of leaves. J. Environ. Sci. 2015, 27, 33–41. [Google Scholar] [CrossRef] [PubMed]
  22. Bottalico, F.; Travaglini, D.; Chirici, G.; Garfi, V.; Giannetti, F.; De Marco, A.; Fares, S.; Marchetti, M.; Nocentini, S.; Paoletti, E.; et al. A spatially-explicit method to assess the dry deposition of air pollution by urban forests in the city of Florence, Italy. Urban For. Urban Green. 2017, 27, 221–234. [Google Scholar] [CrossRef]
  23. Kim, G.; Coseo, P. Urban park systems to support sustainability: The role of urban park systems in hot arid urban climates. Forests 2018, 9, 439. [Google Scholar] [CrossRef] [Green Version]
  24. Selmi, W.; Weber, C.; Riviere, E.; Blond, N.; Mehdi, L.; Nowak, D. Air pollution removal by trees in public green spaces in Strasbourg city, France. Urban For. Urban Green. 2016, 17, 192–201. [Google Scholar] [CrossRef] [Green Version]
  25. Irga, P.J.; Burchett, M.D.; Torpy, F.R. Does urban forestry have a quantitative effect on ambient air quality in an urban environment? Atmos. Environ. 2015, 120, 173–181. [Google Scholar] [CrossRef] [Green Version]
  26. Gao, T.; Hedblom, M.; Emilsson, T.; Nielsen, A.B. The role of forest stand structure as biodiversity indicator. For. Ecol. Manag. 2014, 330, 82–93. [Google Scholar] [CrossRef]
  27. Nielsen, A.B.; van den Bosch, M.; Maruthaveeran, S.; van den Bosch, C.K. Species richness in urban parks and its drivers: A review of empirical evidence. Urban Ecosyst. 2014, 17, 305–327. [Google Scholar] [CrossRef]
  28. Qiu, L.; Liu, F.; Zhang, X.; Gao, T. Difference of airborne particulate matter concentration in urban space with different green coverage rates in Baoji, China. Int. J. Environ. Res. Public Health 2019, 16, 1465. [Google Scholar] [CrossRef] [Green Version]
  29. Li, F.Z.; Zheng, W.; Wang, Y.; Liang, J.H.; Xie, S.; Guo, S.Y.; Li, X.; Yu, C.M. Urban green space fragmentation and urbanization: A spatiotemporal perspective. Forests 2019, 10, 333. [Google Scholar] [CrossRef] [Green Version]
  30. Li, L.; Wang, X.F.; Zuo, Z. Monthly and seasonal variation of PM10 concentration and its relationships with meteorological factors in Shapoutou of Ningxia. Shengtaixue Zazhi 2019, 38, 1175–1181. [Google Scholar] [CrossRef]
  31. Zheng, G.L.; Li, P. Resuspension of settled atmospheric particulate matter on plant leaves determined by wind and leaf surface characteristics. Environ. Sci. Pollut. Res. 2019, 26, 19606–19614. [Google Scholar] [CrossRef] [PubMed]
  32. Zhang, B.E.; Jiao, L.M.; Xu, G.; Zhao, S.L.; Tang, X.; Zhou, Y.; Gong, C. Influences of wind and precipitation on different-sized particulate matter concentrations (PM2.5, PM10, PM2.5–10). Meteorol. Atmos. Phys. 2018, 130, 383–392. [Google Scholar] [CrossRef]
  33. Beckett, K.P.; Freer-Smith, P.H.; Taylor, G. Particulate pollution capture by urban trees: Effect of species and windspeed. Glob. Chang. Biol. 2000, 6, 995–1003. [Google Scholar] [CrossRef]
  34. Wang, Y.F.; Chen, L.; Chen, R.; Tian, G.L.; Li, D.X.; Chen, C.Y.; Ge, X.J.; Ge, G.L. Effect of relative humidity on the deposition and coagulation of aerosolized SiO2 nanoparticles. Atmos. Res. 2017, 194, 100–108. [Google Scholar] [CrossRef]
  35. Huffman, J.A.; Prenni, A.J.; DeMott, P.J.; Poehlker, C.; Mason, R.H.; Robinson, N.H.; Froehlich-Nowoisky, J.; Tobo, Y.; Despres, V.R.; Garcia, E.; et al. High concentrations of biological aerosol particles and ice nuclei during and after rain. Atmos. Chem. Phys. 2013, 13, 6151–6164. [Google Scholar] [CrossRef] [Green Version]
  36. Zhang, W.K.; Wang, B.; Niu, X. The leaf microstructure of different trees and its impact on air particles-capturing ability. Chin. J. Ecol. 2017, 36, 2507–2513. [Google Scholar] [CrossRef]
  37. Yang, J.; Wang, H.X.; Xie, B.Z.; Shi, H.; Wang, Y.H. Accumulation of particulate matter on leaves of nine urban greening plant species with different micromorphological structures in Beijing. Res. Environ. Sci. 2015, 28, 384–392. [Google Scholar] [CrossRef]
  38. Zhao, S.T.; Li, X.Y.; Li, Y.M. Fine particle-retaining capability of twenty-nine landscape plant species in Beijing. Ecol. Environ. Sci. 2015, 24, 1004–1012. [Google Scholar] [CrossRef]
  39. Fan, S.X.; Yan, H.; Qi, S.M.Y.; Bai, W.L.; Pi, D.J.; Li, X.; Dong, L. Dust capturing capacities of twenty-six deciduous broad-leaved trees in Beijing. Chin. J. Plant Ecol. 2015, 39, 736–745. [Google Scholar] [CrossRef]
  40. Janhall, S. Review on urban vegetation and particle air pollution—Deposition and dispersion. Atmos. Environ. 2015, 105, 130–137. [Google Scholar] [CrossRef]
  41. Leonard, R.J.; McArthur, C.; Hochuli, D.F. Particulate matter deposition on roadside plants and the importance of leaf trait combinations. Urban For. Urban Green. 2016, 20, 249–253. [Google Scholar] [CrossRef]
  42. Su, W.; Liu, W.Q.; Lai, S.N.; Gu, X.R.; Liu, Q.; Gong, P. Subduction of PM2.5 mass concentration by canopy characteristics of urban forest patches. Acta Sci. Circumstantiae 2018, 38, 2902–2908. [Google Scholar] [CrossRef]
  43. Sagar, R.; Singh, A.; Singh, J.S. Differential effect of woody plant canopies on species composition and diversity of ground vegetation: A case study. Trop. Ecol. 2008, 49, 189–197. [Google Scholar] [CrossRef]
  44. Cavard, X.; Macdonald, S.E.; Bergeron, Y.; Chen, H.Y.H. Importance of mixedwoods for biodiversity conservation: Evidence for understory plants, songbirds, soil fauna, and ectomycorrhizae in northern forests. Environ. Rev. 2011, 19, 142–161. [Google Scholar] [CrossRef]
  45. Zhang, J.Y.; Cheng, K.W.; Zang, R.G.; Ding, Y. Changes in floristic composition, community structure and species diversity across a tropical coniferous-broadleaved forest ecotone. Trop. Conserv. Sci. 2014, 7, 126–144. [Google Scholar] [CrossRef] [Green Version]
  46. Sun, X.D.; Li, H.M.; Liu, X.; Xu, M. Subduction ability of different green space structure on atmospheric particulate matter. Huanjing Huaxue Environ. Chem. 2017, 36, 289–295. [Google Scholar] [CrossRef]
Figure 1. Study area. “A–E” represent forests of five different vegetation structure types. “G” represents gray space. “1” represents forests of 0.4–0.5 ha. “2” represents forests of 2.7–3.0 ha.
Forests 11 00950 g001
Figure 2. Panoramas of five different vegetation structure green spaces and gray spaces.
Forests 11 00950 g002
Figure 3. Relationship between meteorological factors and atmospheric suspended particulate matter concentration.
Forests 11 00950 g003
Figure 4. Differences of atmospheric suspended particulate matter concentration in different months. The lower-case letters in the figure represent the grouping information obtained by multiple comparisons of means using the Tukey method.
Forests 11 00950 g004
Figure 5. Differences of atmospheric suspended particulate matter concentration over different time periods. The lower-case letters in the figure represent the grouping information obtained by multiple comparisons of means using the Tukey method.
Forests 11 00950 g005
Figure 6. Differences of atmospheric suspended particulate matter concentration in green space with different vegetation structures. “A” represents open lawn green space, “B” represents semi-open lawn green space, “C” represents semi-closed single-layered broadleaved forest, “D” represents closed single-layered broadleaved forest, “E” represents closed single-layered mixed forest, “G” represents gray space. The lower-case letters in the figure represent the grouping information obtained by multiple comparisons of means using the Tukey method.
Forests 11 00950 g006
Figure 7. Differences of atmospheric suspended particulate matter concentration under different area gradients. “A” represents open lawn green space, “B” represents semi-open lawn green space, “C” represents semi-closed single-layered broadleaved forest, “D” represents closed single-layered broadleaved forest, “E” represents closed single-layered mixed forest. The lower-case letters in the figure represent the grouping information obtained by multiple comparisons of means using the Tukey method.
Forests 11 00950 g007
Figure 8. Differences of plant diversity index in green space with different vegetation structures. “A” represents open lawn green space, “B” represents semi-open lawn green space, “C” represents semi-closed single-layered broadleaved forest, “D” represents closed single-layered broadleaved forest, “E” represents closed single-layered mixed forest. The lower-case letters in the figure represent the grouping information obtained by multiple comparisons of means using the Tukey method.
Forests 11 00950 g008
Figure 9. Relationship between plant diversity index and atmospheric suspended particulate matter concentration.
Forests 11 00950 g009
Table 1. Classification with three dimensions of urban forest in Beijing.
First DimensionSecond DimensionThird Dimension
Open green space (<10% canopy cover of trees/shrubs)Lawn
Grass flower
--
Semi-open green space (10%–30% canopy cover of trees/shrubs)
Semi-closed green space (30%–70% canopy cover of trees/shrubs)Coniferous
Broadleaved
Mixed
Single-layered
Multi-layered
Closed green space (>70% canopy cover of trees/shrubs)
Table 2. Linear regression analysis of meteorological factors and atmospheric suspended particulate matter concentration.
PMSourceDFAdj SSAdj MSF-Valuep-ValueSR-sq
TSPWind velocity13.283.2829.370.0000.33430.59%
Temperature113.5413.54121.440.000
Relative humidity1143.68143.681288.480.000
PM10Wind velocity11.661.6642.900.0000.19738.20%
Temperature15.615.61144.470.000
Relative humidity169.4169.411788.980.000
PM2.5Wind velocity10.030.0359.370.0000.02157.34%
Temperature10.080.08191.390.000
Relative humidity11.681.683880.630.000
PM1.0Wind velocity10.080.0856.170.0000.03756.28%
Temperature10.100.1075.330.000
Relative humidity14.804.803564.770.000
Table 3. General linear analysis of month, time and atmospheric suspended particulate matter concentration.
SourcePMDFAdj SSAdj MSF-Valuep-ValueSR-sq
MonthTSP114.590.42438.120.0000.03170.49%
PM1011878.5679.87442.620.0000.42573.63%
PM2.511743.7567.61226.700.0000.54675.54%
PM1.0116.180.56183.270.0000.05572.73%
TimeTSP23.431.7115.150.0000.33631.20%
PM1021.430.7116.650.0000.20738.85%
PM2.5268.5734.2969.520.0000.70259.45%
PM1.020.620.3177.580.0000.06358.55%
Table 4. General linear analysis of vegetation structure and atmospheric suspended particulate matter concentration.
PMDFAdj SSAdj MSF-Valuep-ValueSR-sq
TSP51.830.373.270.0060.33530.92%
PM1050.670.133.440.0040.19738.51%
PM2.550.010.005.940.0000.02157.68%
PM1.050.030.015.520.0000.03556.60%
Table 5. General linear analysis of area and atmospheric suspended particulate matter concentration.
PMDFAdj SSAdj MSF-Valuep-ValueSR-sq
TSP96.020.673.640.0000.42933.69%
PM1091.850.213.170.0010.25541.02%
PM2.590.010.003.510.0000.02059.19%
PM1.090.040.003.100.0010.03857.89%
Table 6. Plant species information for each plot.
Plot NumberTotal Number of all Plant SpeciesFrequency Values of the Total Plant SpeciesMain Plants Identified
A113126Poa annua, Lolium perenne, Setaria glauca, Digitaria sanguinalis
A225118Chloris virgata, Digitaria sanguinalis, Potentilla chinensis, Vicia sepium
B133135Chloris virgata, Viola philippica, Digitaria sanguinalis, Potentilla chinensis
B224119Eleusine indica, Digitaria sanguinalis, Plantago depressa, Lolium perenne
C136207Ginkgo biloba, Salix babylonica, Lagopsis supina, Eleusine indica
C241180Ginkgo biloba, Lagopsis supina, Youngia japonica
D128113Populus tomentosa, Viola philippica, Oxalis corniculata
D23086Fraxinus chinensis, Centella asiatica
E132111Ailanthus altissima, Eucommia ulmoides, Juniperus formosana, Centella asiatica, Youngia japonica
E23385Ginkgo biloba, Fraxinus chinensis, Pinus tabuliformis, Viola philippica
Table 7. General linear analysis of vegetation structure and plant diversity index.
Plant Diversity IndexDFAdj SSAdj MSF-Valuep-ValueSR-sq
SHDI4234.3058.581860.570.0000.17772.13%
SIDI44.141.032823.730.0000.01979.71%
Table 8. Linear regression analysis of plant diversity index and atmospheric suspended particulate matter concentration.
Plant Diversity IndexPMDFAdj SSAdj MSF-Valuep-ValueSR-sq
SHDITSP12.322.3212.680.0000.42733.22%
PM1010.610.619.330.0020.25540.62%
PM2.510.000.005.320.0210.02058.82%
PM1.010.010.015.830.0160.03957.57%
SIDITSP11.991.9910.860.0010.42833.18%
PM1010.440.446.810.0090.25540.57%
PM2.510.000.001.270.2590.02058.77%
PM1.010.000.001.230.2680.04057.51%

