Abstract
Low temperature is one of the common abiotic stresses that adversely affect the growth and development of plants. In this study, we used RNA-Seq to identify low-temperature-responsive genes in birch and further analyzed the underlying molecular mechanism. Birch seedlings were treated by the low temperature (6 °C) for 0, 1, 1.5, 2, 2.5, and 3 h, respectively. A total of 3491 genes were differentially expressed after low-temperature stress. Gene Ontology (GO) and Kyoto Encyclopedia of Gene and Genomes (KEGG) functional enrichment analysis were performed for the differentially expressed genes (DEGs). GO analysis indicated that 3491 DEGs were distributed into 1002 categories, and these DEGs were enriched in “cell process”, “metabolic process”, and “stimulus response”, under the “biological process” category; in “organelles” and “cell components”, under the “cell component” category; and in “catalytic activity” and “adhesion”, under the “molecular function” category. The KEGG enrichment indicated that 119 DEGs were involved in Ca2+ and plant hormone signal transduction; 205 DEGs were involved in secondary metabolic processes, such as lipid metabolism and phenylpropanoid biosynthesis pathway; and 20 DEGs were involved in photosynthesis. In addition, a total of 362 transcription factors (TFs) were differentially expressed under low-temperature stress, including AP2/ERF, C2H2, MYB-HB-like, WRKY, bHLH, WD40-like, and GRAS families. Gene Bpev01.c0480.g0081 (calmodulin-like CML38), Bpev01.c1074.g0005 (calmodulin-like CML25), Bpev01.c1074.g0001 (Calcium-binding EF-hand family protein), Bpev01.c2029.g0005 (calmodulin-like protein), Bpev01.c0154.g0008 (POD), Bpev01.c0015.g0143 (N-acetyl-1-glutamate synthase), and Bpev01.c0148.g0010 (branched chain amino acid transferase) were up-regulated at a high level, under low-temperature stress.
1. Introduction
Low temperature is one of the adverse environmental stresses which affects the growth, development, and geographical distribution of plants. Plants have evolved sophisticated molecular mechanisms to deal with low-temperature stress [1], such as synthesis of cryoprotectants [2], scavenging of reactive oxygen species [3], and cold acclimation [1].
The cell membranes of plants first recognize the low-temperature signal and transmit it into intracellular parts [4]. Low-temperature stress changes the cell membrane from the liquid state to the gel state. This leads to a decreased fluidity, increased permeability, and changes in the structure of membrane proteins, which in turn cause metabolic disorders of plant cells [4]. For example, the Ca2+ channel on the cell membrane is opened under low temperature, and the Ca2+ concentration in the membrane is rapidly increased [5]. Calmodulin (CaM) transmits the Ca2+ flow signals and subsequently affects the expression of downstream genes and actives the MAPK pathway, as well [6]. At the same time, low-temperature stress destroys the membrane structure of plastid and affects photosynthetic electron transfer and energy metabolism [7,8]. The disorder of photosystem II (PSII) system leads to the accumulation of reactive oxygen species (ROS) in the plastid [9]. The excessive ROS will result in oxidative damage to biomolecules, including cell membranes, proteins, and DNA [6]. Meanwhile, low temperature will induce the accumulation of protective proteins, including heat-shock proteins (HSPs) [10], cold-regulatory proteins (COR), dehydrated proteins, cold-protected proteins [1], and various metabolites [11].
The key expression regulators of low-temperature-responsive genes in plants have been reported. C-repeat/dehydration-responsive element binding factors (CBFs) are the first identified transcription factors that regulate the expression of low-temperature-responsive genes in plants [12]. CBFs bind to the C-repeat/dehydration-responsive elements in promoters of cold-responsive genes [12,13]. Inducer of CBF expression 1 (ICE1) is an MYC-type bHLH transcription factor, which activates the expression of CBF genes by directly binding to their promoters [14]. ICE1 can interact with SNOW1, which activates CBF3 to adjust the tolerance of plants under low temperature [15]. A R2R3-MYB protein encoded by MYB15 can bind to promoters of CBF, to prevent their expression [16]. Ethylene insensitive 3 (EIN3) is a key transcription factor involved in transduction of ethylene signaling, which inhibits the expression of CBFs and is a negative regulator of low-temperature resistance [17].
In recent years, with the rapid development of sequencing technology, a large number of experiments have been carried out to study the mechanism of plants under low temperature, using high-throughput sequencing [18,19,20,21,22,23]. The RNA-Seq studies found that genes related to transcription factors [24], Ca2+ signaling [25], plant-hormone signaling [26], phenylalanine biosynthesis [27], starch and sucrose metabolism [28], and protein metabolism pathways may play important roles in the response to low-temperature stress. Birch is one of the most common tree species in the northern hemisphere [29]. In this study, we used RNA-Seq to identify the low-temperature-responsive genes in birch within a short time frame and analyze the responsive mechanism of birch exposed to low-temperature stress.
2. Materials and Methods
2.1. Plant-Material Treatment and RNA Isolation
Two-month-old birch (Betula platyphylla Sukaczev) were grown and maintained in the greenhouse, under a 16 h light/8 h dark photoperiod, at 25 °C, at Northeast Forestry University. For low-temperature stress treatment, plant materials were transferred to 6 °C and harvested after 1, 1.5, 2, 2.5, or 3 h treatment, for RNA sequencing. Plants grown at normal condition (0 h time point) were used as controls. Two biological replicates were performed for each time point, except for 1.5 h, and each biological replicate included at least ten individual plants. For 1.5 h, three cDNA libraries were qualified for RNA sequencing. Before RNA isolation, all the samples were cleaned with sterile water. Total RNAs of all the samples were extracted, using the CTAB [30] method. The quality and concentration of RNA were examined by NanoDrop 2000. The integrity of the RNA samples was examined with an Agilent 2100. The cDNA library was constructed at Beijing Biomarker Technology and sequenced on Illumina platform, with a 150 bp paired-end read length. The transcriptome data obtained in this study were submitted to the NCBI SRA database which is a database for storing the original data of second-generation sequencing. (NCBI accession number: PRJNA532995).
2.2. Transcriptome Analysis
Clean reads were obtained by filtration of low-quality reads, using fastp [31]. All the clean reads were mapped to the birch genome (v1.4c) [32], using HISAT2, with default parameters [33]. Differentially expressed genes (DEGs) between the control group and each treatment group were identified, using DEG discovery pipeline HTSFilter [34] and edgeR, with thresholds of false discovery rate (FDR) < 0.05 and |log2 of fold change| > 1 [35]. The genes expression abundance was normalized by FPKM (number of fragments per kilobase of transcript per million map reads) method. The hypergeometric test was used for GO (Gene Ontology) enrichment analysis. The Bonferroni method was used to correct the p-value. KOBAS2.0 [36] software was used to detect the significantly enriched Kyoto Encyclopedia of Gene and Genomes (KEGG) pathways. BLASTx (E-value < 1.0 × 10⁻⁵) [37] was used for functional annotation of birch genome, using RefSeq non-redundant proteins (NR) [38], Swiss-Prot [39], and Kyoto Encyclopedia of Genes and Genomes (KEGG) [40] as databases. The transcription factors (TFs) were annotated, using a plant TFs database (http://plntfdb.bio.uni-potsdam.de/v3.0/).
2.3. Quantitative RT-PCR Analysis
The HiFiScript cDNA Synthesis Kit was used to reverse transcribe the extracted RNA samples for fluorescence quantitative detection [41]. Applied Biosystems 7500 Real-Time PCR System was used to perform qRT-PCR. A total of 12 DEGs were selected to validate the RNA-Seq results. The 18S of birch was used as an internal reference gene. All the primers were designed by using primer 3 software. The primer sequences are listed in Table A1.
3. Results
3.1. Statistics of Transcriptome Sequencing Data
A time series RNA-Seq experiment was carried out to reveal the transcriptomic response of birch to low-temperature stress, within a short time. Young leaves of birch exposed to 4 °C for 0, 1, 1.5, 2, 2.5, and 3 h were harvested for RNA sequencing on Illumina platform. After the filtration of low-quality reads, an average of 25,120,872 reads was obtained for each sample. The detailed information of the sequencing of reads is shown in Table A2. The results indicated that the obtained sequencing reads are qualified for subsequent analysis.
3.2. Analysis of Differentially Expressed Genes (DEGs)
In order to obtain low-temperature-responsive genes in birch, we first used HISAT2 [33] to align the sequencing reads to the birch reference genome. DEGs in the treatment groups relative to the control group were identified by using edgeR [42], with thresholds of FDR ≤ 0.05 and absolute value of log2(fold-change) > 1. The results showed that 3197 (1656 up-regulated and 1541 down-regulated), 881 (494 up-regulated and 387 down-regulated), 79 (67 up-regulated and 12 down-regulated), 859 (470 up-regulated and 389 down-regulated), and 451 (378 up-regulated and 73 genes down-regulated) genes were differentially expressed after 1, 1.5, 2, 2.5, and 3 h exposure to low temperature, respectively (Table 1). In total, 3491 genes were differentially expressed in at least one time point.

Table 1.
Differentially expressed genes (DEGs) under different low-temperature stress time points.
3.3. Gene Ontology (GO) and KEGG Enrichment of the DEGs
In order to reveal the biological processes underlying the DEGs, we performed GO enrichment analysis for the 3491 DEGs. Using FDR values ≤ 0.05 as a threshold, a total of 1002 GOs of cellular component, molecular function, and biological process were identified as enriched GO terms (Figure 1).
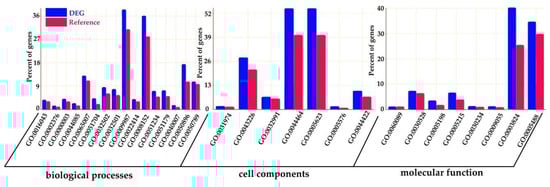
Figure 1.
Function annotation of the DEGs in Gene Ontology. The x-axis is the Gene Ontology (GO) terms, and the y-axis is the percent of genes in each GO term. The blue columns represent the percentage of DEGs in each GO term, and the red columns represent the percentage of reference in each GO term. This figure shows the enrichment of DEGs and reference.
In the category of biological process, a total of 610 GOs were enriched. GOs such as GO:0009987 (cell process), GO:0008152 (metabolic process), and GO:0050896 (response to stimulus) were significantly enriched (Figure 1). The results indicate that genes involved in these biological processes may play an important role in the response to low-temperature stress. Biological processes such as GO:0008152 (metabolic process), GO:0044237 (cell metabolic process), GO:0006793 (phosphorus metabolic process), GO:0006796 (phosphate metabolic process), GO:0016310 (phosphorylation), and GO:0006468 (protein Amino acid phosphorylation) were enriched as well (Figure A1). In the category of cell components, a total of 131 GOs were enriched. GOs including GO:0044464 (cell component) and GO:0043226 (organelle) were enriched (Figure 1 and Figure A2). In the category of molecular function, a total of 261 GOs were enriched. Among them, GOs such as GO:0003824 (catalytic activity) and GO:0005488 (binding activity) were enriched (Figure 1). In addition, GO:0016740 (transferase activity), GO:0016772 (transferase activity, transfer phosphorus-containing groups), GO:0016301 (kinase activity), GO:0004672 (protein kinase activity), and GO:0004674 (protein serine/threonine kinase activity) were significantly enriched (Figure A3).
KEGG pathway enrichment analysis of the DEGs was performed by KOBAS 3.0. All DEGs were allocated to 121 metabolic pathways, 47 of which were significantly enriched (p ≤ 0.05) (Table A3). The results indicated that the DEGs were mainly enriched in metabolic pathways, biosynthesis of secondary metabolites, ribosomes, amino acid biosynthesis, carbon metabolism, phenylpropanoid biosynthesis, plant hormone signal transduction, plant pathogenic bacteria interaction, and starch and sucrose metabolism. These enriched pathways may play important roles in the process of birch in response to low-temperature stress (Figure 2).
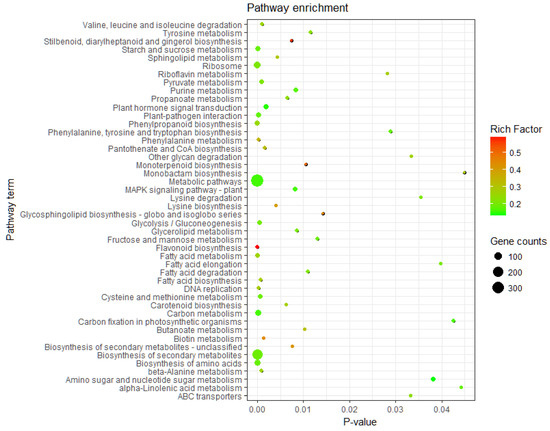
Figure 2.
Pathway assignment of DEGs based on Kyoto Encyclopedia of Gene and Genomes (KEGG).
3.4. Analysis of DEGs Related to Calcium Signal Transduction Pathway
The calcium signal transduction pathway plays a vital role in perceiving the low-temperature stress of plants. In this study, a total of 50 DEGs related to calcium signal transduction were identified, of which 40 were up-regulated. The up-regulated genes include four calcium-dependent protein kinase (CDPK) genes, nine calmodulin-like protein (CML) genes, three calmodulin-binding protein-like genes, and four CBL-interacting protein kinase (CIPK) genes. The expression levels of these genes were significantly up-regulated after low-temperature treatment (Table A4). In addition, six EF-hand calcium-binding proteins (calcium-binding EF-hand family protein) were differentially expressed, of which five were up-regulated. Of the eight calcium-dependent lipid-binding (CaLB domain) family proteins, seven were up-regulated. All the results indicated that genes in the calcium signal transduction pathway of birch respond positively to low-temperature stress.
3.5. Analysis of Hormone and Signal Transduction Pathways-Related DEGs
Under low-temperature stress, the expression of genes related to plant hormone biosynthesis or signal transduction were significantly affected (Table A5). According to the KEGG results, we found that 23 genes related to abscisic acid (ABA) biosynthesis were differentially expressed, of which 15 were up-regulated. Bpev01.c0268.g0003, encoding a 9-cis-epoxy carotenoid dioxygenase, which is an important enzyme in ABA biosynthesis, was up-regulated under low-temperature stress. In addition, we identified 15 DEGs encoding protein phosphatase 2C (PP2C), and 11 of them were up-regulated. Studies have shown that PP2C in plants may play a role in the activation of signaling pathways by environmental stresses, such as cold damage [43]. An ABA 8′-hydroxylase encoding gene (Bpev01.c0870.g0008) was up-regulated by 4.01 times. Bpev01.c0015.g0010, encoding ABA1, which converts zeaxanthin to antheraxanthin and violaxanthin through the epoxidation, was up-regulated under the low-temperature stress.
Most ethylene-signal-related genes in birch were up-regulated under low-temperature stress. We identified a total of 12 ethylene-signal-transduction-related genes, including one ethylene synthase encoding gene (Bpev01.c0299.g0032), one ethylene insensitive 3 gene (EIN3, Bpev01.c0523.g0001), and ten ethylene response transcription factors (BpERFs). In addition, five DEGs related to the gibberellin signaling pathway were identified. Table A5 shows that the differential expression of the five genes (Bpev01.c0118.g0033, Bpev01.c0094.g0034, Bpev01.c1673.g0004, Bpev01.c0411.g0004, and Bpev01.c1170.g0013) may cause a decrease in gibberellin content.
3.6. Identification of DEGs Related to Starch and Sucrose Metabolic Pathways
When exposed to low-temperature stress, many metabolic processes of plants were affected. The enrichment analysis of GO and KEGG indicated that genes related to metabolism and biosynthesis were significantly differentially expressed. A total of 29 DEGs related to the “starch and sucrose metabolism” (Ko00500) pathway were identified, of which 15 were up-regulated and 14 were down-regulated (Table A6). These DEGs include five glucosidase genes, of which four were up-regulated and two up-regulated amylase genes. The pfkB-like carbohydrate kinase genes Bpev01.c0080.g0100 and Bpev01.c0762.g0008 were up-regulated by 4.58 times and down-regulated by 1.29 times, respectively. However, the reason for this remains to be further studied. The eight glycosyl hydrolase genes were significantly down-regulated, and one DEGs encoded to trehalose-6-phosphate synthase were up-regulated. Let us notice that the sugar contents in plants under low-temperature stress may increase, in this case.
3.7. Identification of DEGs Related to Lipid Metabolism
A total of 109 DEGs related to lipid metabolism were identified in this study, most of which were related to oxidation of lipids, biosynthesis, and metabolic processes of lipids and fatty acids (Table A7). The Bpev01.c0190.g0079 gene encodes UDP-sulfoquinolone and participates in the biosynthesis of sulfide lipid, the Bpev01.c1135.g0005 gene encodes a long-chain acyl-CoA synthetase, and the Bpev01.c0364.g0019 gene encodes monogalactosyldiacylglycerol (MGDG) synthase; and these three genes were up-regulated in birch, under low-temperature stress. In addition, a total of 20 GDSL-like esterases/lipases were identified, including one up-regulated and 19 down-regulated DEGs, and the most expression level for down-regulated was up to 4.92 times of the control group. GDSL lipase is a multifunctional family of hydrolases that can hydrolyze a variety of substrates, such as thioesters, aryl esters, phospholipids, and amino acids [43]. In addition, the Bpev01.c0569.g0008 gene encodes a plant ene desaturase, and it was also up-regulated. A total of three genes (Bpev01.c1627.g0007, Bpev01.c2716.g0001, and Bpev01.c2716.g0001) encode terpene synthase and were down-regulated.
3.8. Identification of DEGs Related to Amino Acid Biosynthetic Pathway
Low-temperature response of amino acids to plants is also important, such as the “amino acid biosynthesis” pathway (ko01230). A total of 40 DEGs were found in this pathway, including 17 up-regulated, such as the gene Bpev01.c0015.g0143, which encodes the N-acetyl-l-glutamic acid synthase and was up-regulated by 9.63 times (Table A8). In addition, six gene were also up-regulated, including one encoding pyridoxal-5′-phosphate-dependent enzyme (Bpev01.c0112.g0007), two encoding aldolase (Bpev01.c0511.g0007 and Bpev01.c0115.g0053), one encoding ATP phosphotransferase (Bpev01.c0274.g0001), one encoding branch-chain amino acid transferase (Bpev01.c0148.g0010), and one encoding cysteine synthase (Bpev01.c0137.g0017) (Table A8). Gene Bpev01.c3196.g0001 and Bpev01.c0652.g0026 were down-regulated which encodes the dihydropyridine carboxylic acid reductase and shikimate kinase, respectively (Table A8).
3.9. Identification of DEGs Related to Photosynthesis
A total of 21 DEGs related to photosynthesis were identified, including 13 up-regulated and eight down-regulated (Table A9). Among this, genes (Bpev01.c1891.g0002 and Bpev01.c1891.g0006) that encoded photosystem II reaction centers A and C were up-regulated by 4.02 and 3.49 times, respectively. The gene (Bpev01.c1891.g0007) encoded photosystem I PsaA/PsaB protein was up-regulated by 3.05 times. The gene (Bpev01.c0154.g0066) encoded ferritin 1 was up-regulated by 4.19 times. Genes encoded phosphoenolpyruvate carboxykinase (Bpev01.c1286.g0001), photosystem II subunit R (Bpev01.c1275.g0002), and chloroplast-sensing kinase (Bpev01.c0038.g0100) were also up-regulated. Six genes were down-regulated, including one encoding chlorophyll A/B binding protein (Bpev01.c0615.g0010), one encoding ferredoxin 3 (Bpev01.c0536.g0012), one encoding tubulin FtsZ (Bpev01.c0327.g0054), one encoding membrane localization protein MinD (Bpev01.c0298. g0026), and two encoding the PsbP family proteins of the photosystem II reaction center (Bpev01.c0118.g0021 and Bpev01.c0142.g0012).
3.10. Transcription Factors Involved in Low-Temperature Response
Transcription factors (TFs) play important roles in transcriptional regulation of plants under abiotic stress. TFs are also the core nodes that initiate downstream genes. In this study, a total of 362 TFs were found to be classified into 58 families, including the AP2/EREBP, C2H2, MYB-HB-like, WRKY, bHLH, bZIP, WD40-like, and GRAS families (Table 2). In the 1 h sample, 276 TFs that were classified into 51 TFs families were differentially expressed; among all the families, the C2H2 family contained the maximum DEGs, adding up to 53 TFs. It was followed by the AP2-EREBP family (29 TFs), MYB-HB-like families (21 TFs), NAM families (18 TFs), and WD40-like families (16 TFs). In the 1.5 h sample, 112 TFs belonged to 31 TFs families, including the AP2-EREBP family (25 TFs), Hap3/NF-YB family (13 TFs), and C2H2 families (11 TFs), MYB-HB-like family (7 TFs), Znf-B family (6 TFs), and NAM family (5 TFs). In the 2 h sample, 25 TFs belonged to seven TFs families; among them, the AP2-EREBP family has 14 TFs, the C2H2 family has six TFs, and the C3H, PHD, RAV, AUX-IAA, and Bromo-domain families have one TF, respectively. In the 2.5 h sample, 120 TFs belonged to 35 TFs families, including 24 AP2-EREBP, 16 C2H2, 10 Hap3/NF-YB, seven MYB-HB-like, six NAM, five GRAS, and five WRKY transcription factor genes. In the 3 h sample, 78 TFs belonged to 20 TFs families, including 24 AP2-EREBP, 14 C2H2, six MYB-HB-like, five WRKY, four Znf-B, three GRAS, and three NAM transcription factor genes.
Table 2.
Differentially expressed transcription factors (TFs) under different low-temperature stress time points.
Although the C2H2TFs family had the most DEGs (53) at the 1 h sample, the AP2/ERF family contained the most DEGs at the other four samples. Interestingly, 13 AP2/ERF family genes were up-regulated in all samples, which are the most among all the TFs families (Table A10).
3.11. Validation of RNA-Seq Based DEGs Results by qRT-PCR
To verify the accuracy of the RNA-Seq data, we analyzed the transcript abundance of the 12 randomly selected DEGs, using qRT-PCR. All 12 up-regulated genes were significantly induced by the low-temperature stress, which was consistent with the results of RNA-Seq data (Figure 3 and Figure 4). This result confirmed the reliability of RNA-Seq analysis.
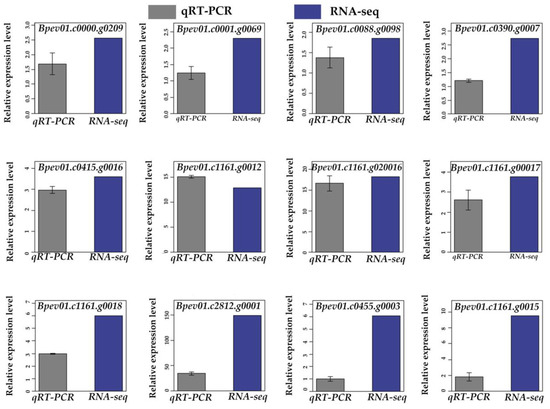
Figure 3.
Validation of the RNA-Seq results by qRT-PCR. A total of 12 DEGs were selected for the validation.
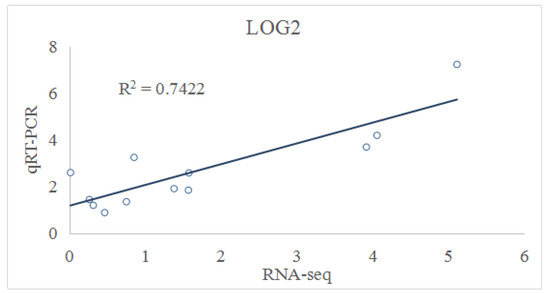
Figure 4.
Expression analysis of selected DEGs, using qRT-PCR.
4. Discussion
The research led us to find that, in the biological process under low temperatures, DEGs were abundantly enriched in the protein phosphorylation pathway downstream of the metabolic pathway. Protein phosphorylation pathways can regulate and control protein activity and function in order to better play the role of protein under low-temperature stress.
4.1. Ca2+ Signal Transduction under Low Temperature
Ca2+ is the second messenger in plant cells which plays an important role in many signaling pathways. Fluctuations in calcium levels can be monitored by calcium sensor proteins, including calmodulin-like (CML), calcineurin B-like protein (CBL), and calcium-dependent protein kinases (CDPK); they transmit signals and trigger downstream reactions [44]. In this study, 50 DEGs related to calcium signal transduction pathways were identified, including nine CMLs, four CDPKs, three CML binding protein, and four CBL interacting protein kinases (CIPK). Compared with the control group, they were all increased. In addition, six EF-hand proteins were identified, including five that were up-regulated. In plants, EF-hand proteins include calmodulin (CaMs), Ca2+-dependent protein kinases (CDPKs), and calmodulin B-like protein (CBL); they are all Ca2+ receptors. Among them, CaMs and CMLs are important, and they have an important role in sensing and transmission of Ca2+ signals [45]. CIPK7 may be combined with the CBL, and thus participate in the low-temperature response of plants [46]. This study found that four CDPK, nine CMLs, and four CIPK protein kinases were up-regulated, indicating that Ca2+-mediated signaling pathways play an important role in the response of low-temperature stress in birch.
4.2. Plant Hormone-Dependent Pathways under Low Temperature
ABA is considered to be a necessary messenger for plants to adapt to abiotic stress. Studies have shown that, under abiotic stress, genes involved in ABA synthesis and signal transduction are mostly differentially expressed, such as homologous genes of PYR/PYL and homologous genes of PP2C [47,48]. This study found that, under low-temperature stress, birch has 23 DEGs related to the ABA pathway, including 15 up-regulated and eight down-regulated. The birch Bpev01.c0294.g0006 and Bpev01.c0268.g0003 genes encode 9-cis-epoxy carotenoid dioxygenase (NCED), which is a key enzyme in ABA biosynthesis, up-regulated 3.66 times and 1.44 times under low-temperature stress, respectively. This indicates that ABA content may increase in birch, under low-temperature stress. Fifteen DEGs encoded protein phosphatase 2C (PP2C) were also detected, and among them, 11 were up-regulated and four down-regulated. PP2C is also a key component of the ABA signaling pathway. These DEGs indicate that ABA-mediated signal transduction is involved in the birch response to low-temperature stress.
Many researches have proved that ethylene may play a different role in different plants under low-temperature stress. For example, it plays an active role in rice, tomato and Arabidopsis, but it plays a negative regulatory role in safflower and magnolia [49]. Studies have shown that EIN3 can regulate the expression of ERF TFs [50], and EFE is a very important enzyme in the process of ethylene production [51,52]. In our study, a total of 12 DEGs related to ethylene signal transduction were identified, including 1 EFE (Bpev01.c0299.g0032) and 1 EIN3 (Bpev01.c0523.g0001) and 10 ERF1, 2, 3, 5. Interestingly, these DEGs were up-regulated and indicating that ethylene plays an positive role in the response of birch under low-temperature stress.
In addition, this study also detected 4, 5, and 11 DEGs related to the jasmonic acid signaling pathway, the gibberellin signaling pathway, and the salicylic acid signaling pathway, respectively. It indicated that these hormones may also be involved in the response of birch to low-temperature stress.
4.3. Low-Temperature Stress Signal Induces Cell Protection Process
When plants are subjected to low temperatures, plant cells will quickly accumulate compatible solutes (osmoprotectants), including sugar, amino acids, and fatty acids. These osmoprotectants can help re-establish the cell’s osmotic balance and thus play a key role in protecting organelles, proteins, and membranes. Some studies have confirmed that sugars can be used as ROS scavengers to protect plants from oxidative damage caused by low temperature [53]. In this study, 30 DEGs were found in the starch and sucrose metabolic pathways, including eight genes encoded in the glycosyl hydrolases which were significantly down-regulated. It may be indicated that decomposition of sugar was reduced under low-temperature stress. Moreover, the gene encoded of trehalose-6-phosphate synthase was up-regulated, and a study in 2011 had confirmed that the accumulation of trehalose can be used for oxidative detoxification under abiotic stress [54]. In addition, a total of three genes that encoded amylase were up-regulated; we speculate that birch resists low temperature by breaking down starch into soluble sugars, under low-temperature stress.
In this study, a total of 109 DEGs related to lipid metabolism were identified in birch, under low temperature. Among them, the gene Bpev01.c0190.g0079 encodes UDP-sulfoquinolone and is involved in the biosynthesis of sulfurized lipids, the gene Bpev01.c1135.g0005 encodes long acyl-CoA synthetase, and the gene Bpev01.c0364.g0019 encodes monogalactoside diacylglycerol synthase. These three genes were up-regulated and involved in the synthesis of lipids.
According to reports, amino acids are important osmotic protectants, and their accumulation is positively correlated with cold resistance [55]. In this study, genes encoded N-acetyl-l-glutamate synthase, L-lysine-α-aminotransferase, branched-chain amino acid transferase, aldolase, and cysteine synthase were up-regulated. These enzymes were involved in amino acid synthesis, and thus we speculated that the content of amino acids might increase under low-temperature stress. In addition, a total of eight DEGs which encoded phenylalanine ammonia-lyase (PAL) and peroxidase were all significantly up-regulated. PAL is one of the most relevant enzymes in the biosynthetic pathway of phenylpropane [50], peroxidase can oxidize phenols and remove reactive oxygen [51]. Based on this, we believe that the synthesis of phenylpropane and peroxidase was increased under low-temperature stress.
4.4. Transcription Factors Involved in Response to Cold Stress
The regulation of TFs is a key part of plant response to low-temperature stress, and TFs can regulate their expression through interaction with stress genes. Many TFs families are connected with adversity stress, such as AP2/EREBP, bHLH, WRKY, MYB, NAC, MYC, HSF, bZIP, and GRAS families [56,57,58]. In this study, a total of 362 TFs had differentially expressed and clustered into 58 TFs families, under low-temperature stress; among them, the AP2/ERF family had the most DEGs. It is worth noting that a total of 13 genes in the AP2/ERF family were up-regulated in all the samples treated at low-temperature, which was much higher than other TFs families. This indicates that the AP2/ERF family plays a more important role in birch response to low-temperature stress. In addition, we also noticed that low temperatures lead to TFs having differential expression in the C2H2, MYB-HB-like, WRKY, bHLH, bZIP, WD40-like, and GRAS families. Based on this, we speculated that these TFs families also play an indispensable role in response to birch cold stress.
4.5. Effects of Low-Temperature Stress on Photosynthesis
Chloroplasts are distinct organelles in plant cells and provide most of the energy through photosynthesis. When plants are under low-temperature stress, the expression of genes related to chlorophyll biosynthesis is suppressed, and it will cause the destruction of the thylakoid function and the inhibition of photosynthesis. In this study, we identified a total of 21 DEGs (13 up-regulated and eight down-regulated) that were related to photosynthesis; among them, genes encoded chlorophyll A/B binding protein, photosystem II reaction-center (PsbP) protein, ferredoxin 3, and diaphragm locating protein (MinD) were all down-regulated. Chlorophyll a/b binding protein and chlorophyll–protein complexes are mainly responsible for collecting light energy and transferring it into the photochemical reaction center. Foreign protein PsbP of the photosystem II is necessary for oxygen metabolism in photosynthesis. [52]. Ferredoxin of the photosystem I regulates the direction of electron transfer in photosynthetic electron transport, to affect plant photosynthesis [59], and the tubulin FtsZ is the key protein of chloroplast division [60,61]. The genes that encoded these proteins were down-regulated, and we can speculate that low-temperature stress inhibits the processes of light energy conversion and chloroplast division in birch photosynthesis, to a certain extent. However, we noticed that the genes that encoded the ferredoxin 1, the PsaA/PsaB protein, and the phosphoenolpyruvate carboxylase (PEPC) were all significantly up-regulated. The differential expression of these genes indicated that, although the photosynthesis of birch was inhibited under low-temperature stress, it could also be promoted by increasing the expression of some genes. We identified 30 genes that were significantly up-regulated under low-temperature stress, which were related to calcium signal pathway, plant hormone, starch and sucrose metabolism, amino acids biosynthesis, and photosynthesis, respectively (Table 3).
Table 3.
Thirty significantly up-regulated DEGs of birch under low-temperature stress.
5. Conclusions
In this study, the birch transcriptome dataset was generated by high-throughput sequencing and uploaded to the NCBI SRA database. In addition, the dynamic changes of gene expression under low-temperature treatment were observed, and a large number of low-temperature response genes were discovered. These genes are connected with plant hormones, Ca2+ transduction pathways, phenylpropanoids, lipids, starch and sucrose, amino acids, photosynthesis, and enzymes related to the synthesis of protective metabolites. When studied we the changes in TFs under low-temperature stress, we observed that the contribution of AP2/ERF family genes was particularly prominent. Transcriptome and expression-level analysis of birch leaves provide valuable resources for the functional annotation of low-temperature-response genes.
Author Contributions
Conceptualization, S.C. (Su Chen); software, S.C. (Song Chen); validation, D.Z. and S.Y.; investigation, D.Z.; resources, S.C. (Su Chen); writing—original draft preparation, S.Y. and D.Z.; writing—review and editing, S.C. (Su Chen); supervision, S.C. (Su Chen); funding acquisition, S.C. (Su Chen). All authors have read and agreed to the published version of the manuscript.
Funding
This research was funded by the National Natural Science Foundation of China, grant number 31870659; the Fundamental Research Funds for the Central Universities, grant number 2572019CG08; Heilongjiang Touyan Innovation Team Program (Tree Genetics and Breeding Innovation Team); and the 111 Project (B16010).
Acknowledgments
We thank the reviewers and editors who provided constructive comments on our manuscript.
Conflicts of Interest
The authors declare no conflict of interest.
Appendix A
Table A1.
The genes and primers used for qRT-PCR analysis.
Table A1.
The genes and primers used for qRT-PCR analysis.
| Gene | Primer | Primer Sequence |
|---|---|---|
| 18S RNA | 18S-R | GCAGGTTAGCGAAATGCGATAC |
| 18S RNA | 18S-F | GAGGTAGCTTCGGGCGCAACT |
| Bpev01.c1851.g0002 | BP001R | CGAAGGTTGTTCCTATTGGAGGT |
| Bpev01.c1851.g0002 | BP001F | CATCTCCAATCTCAACCTCTGTTCC |
| Bpev01.c1851.g0001 | BP002R | CAGCTTCTTGTTGAGCCAATCTC |
| Bpev01.c1851.g0001 | BP002F | GCGGTCTCTTCCCTTGCTTAAATG |
| Bpev01.c1189.g0015 | BP003R | GAGATCCTGTTGCCTTCCAGTAC |
| Bpev01.c1189.g0015 | BP003F | AGCTTGATGGGAAGAGACCAG |
| Bpev01.c1161.g0015 | BP004R | GTCGGTCGATTGCGAGGTTG |
| Bpev01.c1161.g0015 | BP004F | GACCTCTGCATCCCACTCTG |
| Bpev01.c1161.g0014 | BP005R | GTCGGTCGATTGCGAGGTTG |
| Bpev01.c1161.g0014 | BP005F | GACCTCTGCATCCCACTCTCTG |
| Bpev01.c0455.g0003 | BP006R | GCTGCCATGCTTCCTGTCTC |
| Bpev01.c0455.g0003 | BP006F | ACTTCCGGGATTTCGTTTCCAC |
| Bpev01.c0390.g0007 | BP007R | CTTTCCAATGGGCTTGTCCG |
| Bpev01.c0390.g0007 | BP007F | CGGACGAGGAGTTGGTGAATC |
| Bpev01.c0357.g0068 | BP008R | GCTTTCCAATACCCAGACACCG |
| Bpev01.c0357.g0068 | BP008F | TCGATTCCACCCAACTGATGAG |
| Bpev01.c0210.g0037 | BP009R | CCATTCGGGTACTTCCGGTC |
| Bpev01.c0210.g0037 | BP009F | CCTGTGTTGTCGTTGGCTTC |
| Bpev01.c0162.g0012 | BP010R | GTCTAGCTCCGTTCGGGTAC |
| Bpev01.c0162.g0012 | BP010F | ACTTATCCACCGGCTTGAACC |
| Bpev01.c0073.g0013 | BP011R | CTCTGAATATCCTTCGCCGTCCC |
| Bpev01.c0073.g0013 | BP011F | CCGGGAGGACGAAGTTCAAG |
| Bpev01.c0001.g0070 | BP012R | CAAGGCCAAAGATGCTTCAAGACAC |
| Bpev01.c0001.g0070 | BP012F | TACTTGTCTCAAGATGCTCCTCTG |
| Bpev01.c0001.g0069 | BP013R | CCTTGGTCGCCCTGTTAGTC |
| Bpev01.c0001.g0069 | BP013F | GCAGGACAGGAGTGGGATAC |
| Bpev01.c0000.g0209 | BP014R | GTTGCTGTTGGAGTTGAATTTCGG |
| Bpev01.c0000.g0209 | BP014F | CCTTTGCATCTTACCCTTCTTGCTC |
Table A2.
Statistics of sequencing data.
Table A2.
Statistics of sequencing data.
| Sample | Raw Date | Clean Date | Base Number | Q20% | Q30% | GC Content 1 | Mapped Ratio |
|---|---|---|---|---|---|---|---|
| CK_rep1 | 25,672,243 | 25,670,448 | 7.68 Gb | 97.63% | 93.76% | 47.07% | 96.07% |
| CK_rep2 | 28,604,148 | 28,602,122 | 8.56 Gb | 97.69% | 93.93% | 47.16% | 96.34% |
| 1h_rep1 | 28,418,115 | 22,838,434 | 6.83 Gb | 97.77% | 94.08% | 47.14% | 96.64% |
| 1h_rep2 | 27,638,049 | 27,255,820 | 8.16 Gb | 97.56% | 93.60% | 46.90% | 96.52% |
| 1.5h_rep1 | 22,409,000 | 23,396,121 | 7.00 Gb | 97.68% | 93.92% | 47.33% | 96.42% |
| 1.5h_rep2 | 23,397,739 | 23,729,617 | 7.10 Gb | 97.58% | 93.71% | 47.05% | 96.43% |
| 1.5h_rep3 | 23,731,305 | 24,169,972 | 7.23 Gb | 97.64% | 93.82% | 46.63% | 96.46% |
| 2h_rep1 | 24,171,686 | 22,157,427 | 6.63 Gb | 97.58% | 93.67% | 47.48% | 96.16% |
| 2h_rep2 | 22,840,004 | 23,331,820 | 6.98 Gb | 97.65% | 93.85% | 47.10% | 96.29% |
| 2.5h_rep1 | 27,257,640 | 24,693,732 | 7.39 Gb | 97.56% | 93.63% | 47.09% | 96.30% |
| 2.5h_rep2 | 24,695,387 | 24,822,662 | 7.43 Gb | 97.76% | 94.02% | 48.47% | 96.33% |
| 3h_rep1 | 24,824,310 | 28,740,756 | 8.60 Gb | 97.67% | 93.85% | 47.46% | 96.24% |
| 3h_rep2 | 22,158,962 | 27,162,399 | 8.13 Gb | 97.90% | 94.35% | 47.73% | 96.47% |
| Average | 25,062,968 | 25,120,872 | 7.52 Gb | 97.50% | 93.60% | 47.28% | 96.36% |
1 GC content: the ratio of guanine and cytosine among the four bases of DNA.
Table A3.
Pathway enrichment analysis in DEGs (p-value ≤ 0.05).
Table A3.
Pathway enrichment analysis in DEGs (p-value ≤ 0.05).
| Items | ID | DEGs | All | p-Value |
|---|---|---|---|---|
| Metabolic pathways | ko01100 | 349 | 2246 | 6.39 × 10⁻²⁶ |
| Biosynthesis of secondary metabolites | ko01110 | 210 | 1107 | 1.87 × 10⁻²⁴ |
| Ribosome | ko03010 | 76 | 364 | 2.58 × 10⁻¹¹ |
| Biosynthesis of amino acids | ko01230 | 46 | 251 | 4.57 × 10⁻⁶ |
| Carbon metabolism | ko01200 | 43 | 273 | 0.0002 |
| Phenylpropanoid biosynthesis | ko00940 | 41 | 166 | 1.89 × 10⁻⁸ |
| Plant hormone signal transduction | ko04075 | 39 | 273 | 0.00195 |
| Plant-pathogen interaction | ko04626 | 30 | 170 | 0.00034 |
| Starch and sucrose metabolism | ko00500 | 30 | 165 | 0.000218 |
| Cysteine and methionine metabolism | ko00270 | 23 | 121 | 0.00066 |
| Glycolysis/gluconeogenesis | ko00010 | 23 | 116 | 0.000396 |
| MAPK signaling pathway-plant | ko04016 | 21 | 134 | 0.00812 |
| Amino sugar and nucleotide sugar metabolism | ko00520 | 18 | 131 | 0.0382 |
| Pyruvate metabolism | ko00620 | 18 | 86 | 0.000949 |
| Fatty acid metabolism | ko01212 | 18 | 69 | 9.62 × 10⁻⁵ |
| Purine metabolism | ko00230 | 17 | 100 | 0.00828 |
| DNA replication | ko03030 | 14 | 50 | 0.000304 |
| Valine, leucine, and isoleucine degradation | ko00280 | 13 | 51 | 0.00104 |
| beta-Alanine metabolism | ko00410 | 13 | 50 | 0.000887 |
| Flavonoid biosynthesis | ko00941 | 13 | 22 | 9.57 × 10⁻⁷ |
| Fructose and mannose metabolism | ko00051 | 12 | 64 | 0.0131 |
| Glycerolipid metabolism | ko00561 | 12 | 60 | 0.00858 |
| Fatty acid biosynthesis | ko00061 | 12 | 43 | 0.000823 |
| Carbon fixation in photosynthetic organisms | ko00710 | 11 | 69 | 0.0426 |
| Phenylalanine metabolism | ko00360 | 11 | 32 | 0.000316 |
| Phenylalanine, tyrosine and tryptophan biosynthesis | ko00400 | 10 | 56 | 0.0289 |
| Fatty acid degradation | ko00071 | 10 | 47 | 0.0111 |
| Propanoate metabolism | ko00640 | 10 | 43 | 0.0066 |
| Tyrosine metabolism | ko00350 | 9 | 40 | 0.0116 |
| Pantothenate and CoA biosynthesis | ko00770 | 9 | 28 | 0.00161 |
| alpha-Linolenic acid metabolism | ko00592 | 8 | 44 | 0.0442 |
| Carotenoid biosynthesis | ko00906 | 8 | 29 | 0.00627 |
| Sphingolipid metabolism | ko00600 | 8 | 27 | 0.00439 |
| Fatty acid elongation | ko00062 | 7 | 35 | 0.0398 |
| Lysine degradation | ko00310 | 7 | 34 | 0.0355 |
| Biotin metabolism | ko00780 | 7 | 16 | 0.0013 |
| ABC transporters | ko02010 | 6 | 26 | 0.0332 |
| Butanoate metabolism | ko00650 | 6 | 19 | 0.0103 |
| Lysine biosynthesis | ko00300 | 6 | 15 | 0.0041 |
| Other glycan degradation | ko00511 | 5 | 19 | 0.0334 |
| Riboflavin metabolism | ko00740 | 5 | 18 | 0.0282 |
| Biosynthesis of secondary metabolites-unclassified | ko00999 | 5 | 12 | 0.00762 |
| Monobactam biosynthesis | ko00261 | 4 | 14 | 0.0449 |
| Glycosphingolipid biosynthesis-globo and isoglobo series | ko00603 | 4 | 9 | 0.0143 |
| Monoterpenoid biosynthesis | ko00902 | 4 | 8 | 0.0105 |
| Stilbenoid, diarylheptanoid, and gingerol biosynthesis | ko00945 | 4 | 7 | 0.00746 |
Table A4.
DEGs were annotated for calcium signal pathway under low temperature stress in birch.
Table A4.
DEGs were annotated for calcium signal pathway under low temperature stress in birch.
| Gene_ID | Time | logFC | Function |
|---|---|---|---|
| Bpev01.c0480.g0081 | 2 h | 4.57 | Calmodulin-like, CML38 |
| Bpev01.c1074.g0005 | 2.5 h | 4.66 | Calmodulin-like, CML25 |
| Bpev01.c1074.g0006 | 3 h | 4.48 | Calcium-binding EF-hand family protein |
| Bpev01.c1074.g0007 | 2.5 h | 3.94 | Calcium-binding EF-hand family protein |
| Bpev01.c0147.g0007 | 1 h | 3.4 | Calcium-dependent lipid-binding (CaLB domain) family protein |
| Bpev01.c0274.g0041 | 1 h | 3.6 | Calcium-binding EF-hand family protein |
| Bpev01.c0445.g0003 | 1 h | 2.48 | Calcium-dependent lipid-binding (CaLB domain) family protein |
| Bpev01.c0420.g0021 | 1 h | 2.43 | Calmodulin binding protein-like |
| Bpev01.c0027.g0187 | 2.5 h | 2.94 | Ca2+-dependent modulator of ICR1, CMI1 |
| Bpev01.c0088.g0124 | 1 h | 3.79 | Ca2+-dependent modulator of ICR1, CMI1 |
| Bpev01.c2029.g0005 | 1 h | 3.38 | Calmodulin binding protein-like |
| Bpev01.c0180.g0001 | 1 h | 3.08 | Ca2+-dependent modulator of ICR1, CMI1 |
| Bpev01.c0281.g0075 | 2.5 h | 2.7 | Calmodulin-like, CML30 |
| Bpev01.c0011.g0001 | 1 h | 2.52 | EF hand calcium-binding protein family |
| Bpev01.c0328.g0033 | 1 h | 2.05 | Calmodulin-like, CML46 |
| Bpev01.c0821.g0019 | 1 h | 1.96 | IQ calmodulin-binding motif family protein |
| Bpev01.c0145.g0021 | 1 h | 1.91 | Calcium-dependent lipid-binding (CaLB domain) family protein |
| Bpev01.c0088.g0130 | 1 h | 2.96 | Calmodulin-like, CML30 |
| Bpev01.c2409.g0002 | 1 h | 1.68 | Calcium-dependent protein kinase 1 |
| Bpev01.c0511.g0002 | 1 h | 1.56 | CBL-interacting protein kinase 5 |
| Bpev01.c0022.g0034 | 1 h | 1.54 | Calcium-dependent protein kinase 28 |
| Bpev01.c1700.g0004 | 1 h | 2.06 | Calcium-dependent protein kinase family protein |
| Bpev01.c0159.g0009 | 1 h | 1.44 | Copine (calcium-dependent phospholipid-binding protein) family |
| Bpev01.c0324.g0014 | 3 h | 1.49 | CBL-interacting protein kinase 7 |
| Bpev01.c1519.g0006 | 1 h | 1.4 | Calmodulin binding protein-like |
| Bpev01.c0052.g0090 | 1 h | 2.12 | Calmodulin-binding transcription activator protein with CG-1 and Ankyrin domains |
| Bpev01.c0570.g0019 | 1 h | 1.37 | Calmodulin-like, CML30 |
| Bpev01.c0318.g0004 | 3 h | 1.36 | Calmodulin-like, CML5 |
| Bpev01.c0126.g0019 | 2.5 h | 1.55 | Calmodulin-like, CML5 |
| Bpev01.c0029.g0091 | 1 h | 1.35 | Calcium-dependent protein kinase 19 |
| Bpev01.c0044.g0059 | 1 h | 1.32 | CBL-interacting protein kinase 25 |
| Bpev01.c0147.g0003 | 1 h | 1.9 | Calcium-dependent lipid-binding (CaLB domain) family protein |
| Bpev01.c1106.g0007 | 3 h | 1.17 | CBL-interacting protein kinase 20 |
| Bpev01.c2470.g0003 | 1 h | 1.17 | Calcium-dependent lipid-binding (CaLB domain) family protein |
| Bpev01.c1002.g0005 | 1 h | 1.11 | Calcium-dependent lipid-binding (CaLB domain) family protein |
| Bpev01.c0298.g0010 | 3 h | 1.4 | Calcium-dependent lipid-binding (CaLB domain) family protein |
| Bpev01.c0763.g0002 | 2.5 h | 1.74 | Calmodulin-like, CML30 |
| Bpev01.c0145.g0018 | 2.5 h | 1.97 | Calcium-binding EF-hand family protein |
| Bpev01.c0022.g0125 | 1 h | 1.01 | Calcium-dependent phosphotriesterase superfamily protein |
| Bpev01.c0036.g0009 | 1 h | 1 | Plant calmodulin-binding protein |
| Bpev01.c0135.g0041 | 1 h | −1.1 | Calmodulin-binding protein |
| Bpev01.c0523.g0005 | 1 h | −1.1 | Calcium-dependent lipid-binding (CaLB domain) plant phosphoribosyltransferase family protein |
| Bpev01.c3512.g0001 | 1 h | −1.14 | Calcium-binding EF-hand family protein |
| Bpev01.c1359.g0001 | 1 h | −1.38 | Na+/Ca2+ exchanger, NCL |
| Bpev01.c2062.g0001 | 1 h | −1.44 | Na+/Ca2+ exchanger, NCL |
| Bpev01.c2002.g0003 | 1 h | −1.71 | C2 calcium/lipid-binding plant phosphoribosyltransferase family protein |
| Bpev01.c1295.g0001 | 1 h | −1.88 | C2 calcium/lipid-binding plant phosphoribosyltransferase family protein |
| Bpev01.c2062.g0002 | 1 h | −1.94 | Na+/Ca2+ exchanger, NCL |
| Bpev01.c0442.g0045 | 1 h | −1.99 | C2 calcium/lipid-binding plant phosphoribosyltransferase family protein |
| Bpev01.c0127.g0096 | 2.5 h | −3.34 | Calmodulin binding protein |
Table A5.
Hormone-related DEGs under low temperature stress in birch.
Table A5.
Hormone-related DEGs under low temperature stress in birch.
| Gene_ID | Time | logFC | Function |
|---|---|---|---|
| ABA | |||
| Bpev01.c0870.g0008 | 2.5 h | 4.01 | ABA 8′-hydroxylase, polypeptide 1 |
| Bpev01.c0352.g0006 | 1 h | 3.75 | Protein phosphatase 2C family protein |
| Bpev01.c0294.g0006 | 2.5 h | 3.66 | Nine-cis-epoxycarotenoid dioxygenase 3 |
| Bpev01.c0115.g0107 | 1 h | 3.92 | Protein phosphatase 2C family protein |
| Bpev01.c0129.g0031 | 2.5 h | 2.04 | Protein phosphatase 2C family protein |
| Bpev01.c1183.g0023 | 1 h | 1.9 | Protein phosphatase 2C family protein |
| Bpev01.c0455.g0029 | 1 h | 1.81 | Protein phosphatase 2C family protein, PP2CG1 |
| Bpev01.c0015.g0093 | 3 h | 1.57 | Protein phosphatase 2C family protein, APD5 |
| Bpev01.c0268.g0003 | 1 h | 2.42 | Nine-cis-epoxycarotenoid dioxygenase 4 |
| Bpev01.c0279.g0011 | 3 h | 1.26 | Protein phosphatase 2C family protein, AP2C1 |
| Bpev01.c0015.g0010 | 1 h | 1.25 | ABA deficient 1, ABA1 |
| Bpev01.c0500.g0004 | 1 h | 1.24 | Protein phosphatase 2C family protein |
| Bpev01.c0265.g0015 | 1 h | 1.18 | Protein phosphatase 2C family protein, CIPP1 |
| Bpev01.c0280.g0015 | 2.5 h | 1.67 | Protein phosphatase 2C family protein |
| Bpev01.c1081.g0001 | 1 h | 1.03 | Protein phosphatase 2C family protein |
| Bpev01.c0298.g0028 | 1 h | −1.26 | Beta-hydroxylase 1 |
| Bpev01.c0142.g0059 | 1 h | −1.4 | Protein phosphatase 2C family protein |
| Bpev01.c0467.g0019 | 1 h | −1.61 | Protein phosphatase 2C family protein, PP2C.D3 |
| Bpev01.c0328.g0025 | 2.5 h | −2.79 | ABA 8′-hydroxylase, polypeptide 4 |
| Bpev01.c1475.g0010 | 3 h | −1.91 | Protein phosphatase 2C family protein, PP2C62 |
| Bpev01.c0245.g0042 | 1 h | −1.91 | ABA 8′-hydroxylase, polypeptide 2 |
| Bpev01.c0038.g0101 | 1 h | −2.39 | Protein phosphatase 2C family protein |
| Bpev01.c1272.g0023 | 2.5 h | −3.53 | ABA deficient 2, ABA2 |
| Ethylene | |||
| Bpev01.c1161.g0016 | 2.5 h | 5.23 | Ethylene responsive element binding factor 5 |
| Bpev01.c1161.g0018 | 2.5 h | 3.67 | Ethylene responsive element binding factor 1 |
| Bpev01.c1161.g0014 | 2.5 h | 4.63 | Ethylene responsive element binding factor 5 |
| Bpev01.c1161.g0017 | 2.5 h | 3.12 | Ethylene responsive element binding factor 1 |
| Bpev01.c1161.g0012 | 2.5 h | 4.68 | Ethylene responsive element binding factor 5 |
| Bpev01.c1161.g0013 | 2.5 h | 4.62 | Ethylene responsive element binding factor 5 |
| Bpev01.c0764.g0013 | 1 h | 2.86 | Ethylene response factor 1 |
| Bpev01.c0343.g0032 | 1 h | 2.78 | Ethylene response factor 1 |
| Bpev01.c1851.g0001 | 2.5 h | 3.7 | Ethylene responsive element binding factor 2 |
| Bpev01.c1161.g0015 | 2.5 h | 4.43 | Ethylene responsive element binding factor 5 |
| Bpev01.c0299.g0032 | 2.5 h | 1.95 | Ethylene-forming enzyme |
| Bpev01.c0523.g0001 | 2.5 h | 1.41 | Ethylene-insensitive3-like 3 |
| JA | |||
| Bpev01.c0052.g0052 | 2.5 h | −2.92 | Jasmonate-zim-domain protein 10, Jaz 10 |
| Bpev01.c0136.g0009 | 1 h | −1.62 | N-MYC down-regulated-like 1 |
| Bpev01.c0423.g0007 | 1 h | −1.98 | 4-coumarate: CoA ligase 3 |
| Bpev01.c0161.g0057 | 2.5 h | −2.5 | Jasmonic acid carboxyl methyltransferase |
| GA | |||
| Bpev01.c0118.g0033 | 2.5 h | 3.05 | Gibberellin 3-oxidase 1 |
| Bpev01.c0094.g0034 | 1 h | −1.09 | Gibberellin-regulated family protein |
| Bpev01.c1673.g0004 | 1 h | −1.25 | Gibberellin-regulated family protein |
| Bpev01.c0411.g0004 | 1 h | −2.18 | Gibberellin-regulated family protein |
| Bpev01.c1170.g0013 | 1 h | −5 | Gibberellin-regulated family protein |
| SA | |||
| Bpev01.c0343.g0021 | 1 h | 7.67 | Pathogenesis-related gene 1 |
| Bpev01.c0154.g0058 | 1 h | 2.58 | Pathogenesis-related thaumatin superfamily protein |
| Bpev01.c1477.g0007 | 1 h | 1.97 | Pathogenesis-related family protein |
| Bpev01.c0889.g0015 | 1 h | 1.46 | Pathogenesis-related thaumatin superfamily protein |
| Bpev01.c0022.g0043 | 1 h | 1.89 | Pathogenesis-related thaumatin superfamily protein |
| Bpev01.c0082.g0060 | 1 h | −2.32 | Pathogenesis-related thaumatin superfamily protein |
| Bpev01.c1688.g0003 | 1.5 h | −2.26 | Pathogenesis-related family protein |
| Bpev01.c1525.g0004 | 2.5 h | −2.88 | Pathogenesis-related thaumatin superfamily protein |
| Bpev01.c0889.g0016 | 1 h | −2.42 | Pathogenesis-related thaumatin superfamily protein |
| Bpev01.c1688.g0002 | 3 h | −3.46 | Pathogenesis-related family protein |
| Bpev01.c0030.g0023 | 1 h | −2.64 | Pathogenesis-related thaumatin superfamily protein |
Table A6.
Starch and sucrose metabolism-related DEGs under low-temperature stress in birch.
Table A6.
Starch and sucrose metabolism-related DEGs under low-temperature stress in birch.
| Gene_ID | Time | logFC | Function |
|---|---|---|---|
| Bpev01.c0162.g0017 | 1 h | 5.07 | Beta-glucosidase 45 |
| Bpev01.c0080.g0100 | 1 h | 4.58 | PfkB-like carbohydrate kinase family protein |
| Bpev01.c0283.g0018 | 1 h | 3.15 | Beta-amylase 5 |
| Bpev01.c0092.g0014 | 1 h | 2.77 | Beta glucosidase 41 |
| Bpev01.c0275.g0002 | 1 h | 2.59 | Sucrose-phosphate synthase family protein |
| Bpev01.c1949.g0001 | 1 h | 2.07 | Chloroplast beta-amylase |
| Bpev01.c0000.g0208 | 1 h | 1.76 | Haloacid dehalogenase-like hydrolase (HAD) superfamily protein |
| Bpev01.c0842.g0013 | 1 h | 1.54 | Trehalose-6-phosphate synthase |
| Bpev01.c0053.g0012 | 1 h | 1.42 | Beta glucosidase 11 |
| Bpev01.c0016.g0107 | 1 h | 1.58 | Sucrose phosphate synthase 3F |
| Bpev01.c0264.g0007 | 1 h | 1.26 | Glycosyl hydrolases family 31 protein |
| Bpev01.c1918.g0005 | 1 h | 1.32 | Glycosyl hydrolase family protein |
| Bpev01.c2037.g0001 | 3 h | 1.14 | Haloacid dehalogenase-like hydrolase (HAD) superfamily protein |
| Bpev01.c0294.g0013 | 1 h | 1.19 | Sucrose synthase 3 |
| Bpev01.c0478.g0015 | 1 h | 1.01 | Starch branching enzyme 2.2 |
| Bpev01.c0727.g0009 | 1 h | −1.24 | Sucrose synthase 6 |
| Bpev01.c0762.g0008 | 1 h | −1.29 | PfkB-like carbohydrate kinase family protein |
| Bpev01.c0145.g0042 | 1 h | −1.95 | O-Glycosyl hydrolases family 17 protein |
| Bpev01.c0051.g0185 | 1 h | −1.51 | Sucrose synthase 4 |
| Bpev01.c0127.g0110 | 1 h | −1.53 | Beta-glucosidase 47 |
| Bpev01.c2368.g0004 | 1 h | −1.57 | O-Glycosyl hydrolases family 17 protein |
| Bpev01.c0141.g0019 | 1 h | −1.58 | Glycosyl hydrolase 9C2 |
| Bpev01.c0263.g0003 | 1 h | −2.55 | O-Glycosyl hydrolases family 17 protein |
| Bpev01.c0717.g0033 | 1 h | −1.77 | Nudix hydrolase homolog 14 |
| Bpev01.c1136.g0002 | 1 h | −1.84 | Glycosyl hydrolase 9B18 |
| Bpev01.c0127.g0064 | 1 h | −1.91 | O-Glycosyl hydrolases family 17 protein |
| Bpev01.c1526.g0006 | 1 h | −2.06 | Glycosyl hydrolase 9B1 |
| Bpev01.c1187.g0006 | 1 h | −2.68 | Glycosyl hydrolases family 32 protein |
| Bpev01.c0470.g0030 | 2.5 h | −4.96 | Beta glucosidase 17 |
Table A7.
DEGs related to lipid metabolism pathway under low-temperature stress in birch.
Table A7.
DEGs related to lipid metabolism pathway under low-temperature stress in birch.
| Gene_ID | 1 h | 1.5 h | 2 h | 2.5 h | 3 h |
|---|---|---|---|---|---|
| Bpev01.c0552.g0011 | 8.94 | - | - | - | 8.66 |
| Bpev01.c0062.g0066 | 5.1 | - | - | - | - |
| Bpev01.c0870.g0008 | - | - | - | 4.01 | 3.62 |
| Bpev01.c0294.g0006 | - | - | - | 3.66 | 3.02 |
| Bpev01.c1114.g0003 | 3.53 | - | - | - | - |
| Bpev01.c1092.g0004 | 5.29 | 3.41 | - | 3.17 | 3.55 |
| Bpev01.c1153.g0001 | 3.32 | - | - | - | - |
| Bpev01.c0118.g0033 | - | - | - | 3.05 | - |
| Bpev01.c0517.g0001 | 2.94 | - | - | - | - |
| Bpev01.c0574.g0036 | 2.39 | - | - | - | - |
| Bpev01.c0094.g0036 | 2.77 | 2.19 | - | - | - |
| Bpev01.c1335.g0003 | 2.08 | - | - | - | - |
| Bpev01.c0940.g0001 | 3.97 | 1.97 | - | 3.03 | - |
| Bpev01.c0364.g0019 | 1.95 | - | - | - | - |
| Bpev01.c0050.g0029 | 2.82 | 1.86 | - | 1.83 | - |
| Bpev01.c0261.g0045 | 1.83 | - | - | - | - |
| Bpev01.c0020.g0005 | 1.72 | - | - | - | - |
| Bpev01.c1100.g0005 | - | - | - | 1.69 | - |
| Bpev01.c0374.g0017 | 1.64 | - | - | - | - |
| Bpev01.c0569.g0008 | 1.53 | - | - | 1.32 | 1.24 |
| Bpev01.c0901.g0021 | 1.99 | 1.48 | - | 2.03 | 1.41 |
| Bpev01.c0015.g0012 | 1.41 | 1.42 | - | - | - |
| Bpev01.c0480.g0025 | 1.4 | - | - | - | - |
| Bpev01.c0841.g0011 | 1.34 | - | - | - | - |
| Bpev01.c0401.g0013 | 1.33 | - | - | - | - |
| Bpev01.c0063.g0018 | 1.29 | - | - | - | - |
| Bpev01.c1135.g0005 | 1.26 | - | - | - | - |
| Bpev01.c0015.g0010 | 1.25 | - | - | - | - |
| Bpev01.c0018.g0112 | 1.22 | - | - | - | - |
| Bpev01.c0275.g0035 | 1.81 | 1.21 | - | - | - |
| Bpev01.c0473.g0025 | 1.1 | - | - | - | - |
| Bpev01.c0190.g0079 | 1.04 | - | - | - | - |
| Bpev01.c1060.g0006 | −1 | - | - | - | - |
| Bpev01.c0575.g0024 | −1.01 | - | - | - | - |
| Bpev01.c0038.g0134 | −1.03 | - | - | - | - |
| Bpev01.c1828.g0001 | −1.04 | - | - | - | - |
| Bpev01.c0850.g0003 | −2.16 | −1.04 | - | - | - |
| Bpev01.c0821.g0002 | −1.04 | - | - | - | - |
| Bpev01.c0892.g0002 | −1.06 | - | - | - | - |
| Bpev01.c0496.g0022 | −1.08 | - | - | - | - |
| Bpev01.c0147.g0001 | −1.96 | −1.09 | - | −2.91 | −2 |
| Bpev01.c0052.g0167 | −1.11 | - | - | - | - |
| Bpev01.c0717.g0003 | −1.19 | −1.11 | - | - | - |
| Bpev01.c0425.g0035 | −1.19 | −1.16 | - | −1.55 | - |
| Bpev01.c0038.g0045 | −1.43 | −1.17 | - | - | - |
| Bpev01.c0854.g0013 | −1.22 | - | - | - | - |
| Bpev01.c0555.g0007 | −1.25 | - | - | - | - |
| Bpev01.c0166.g0013 | −1.26 | - | - | - | - |
| Bpev01.c0298.g0028 | −1.26 | - | - | - | - |
| Bpev01.c0027.g0082 | −1.26 | - | - | - | - |
| Bpev01.c2636.g0002 | −1.29 | - | - | - | - |
| Bpev01.c0652.g0023 | −1.31 | - | - | - | - |
| Bpev01.c0449.g0049 | −1.33 | - | - | - | - |
| Bpev01.c1534.g0010 | −2.15 | −1.34 | - | - | −1.38 |
| Bpev01.c1475.g0006 | −2.23 | −1.36 | - | - | - |
| Bpev01.c0045.g0058 | −1.37 | - | - | - | - |
| Bpev01.c1170.g0009 | −1.39 | - | - | - | - |
| Bpev01.c0506.g0024 | −2.39 | −1.43 | - | - | - |
| Bpev01.c1484.g0012 | - | −1.44 | - | - | - |
| Bpev01.c0645.g0001 | −1.44 | - | - | - | - |
| Bpev01.c0275.g0066 | −1.44 | - | - | - | - |
| Bpev01.c0842.g0018 | −1.5 | - | - | - | - |
| Bpev01.c0163.g0009 | −1.78 | −1.52 | - | −1.43 | - |
| Bpev01.c0052.g0192 | −1.53 | - | - | - | - |
| Bpev01.c0531.g0014 | −1.54 | - | - | - | - |
| Bpev01.c1714.g0001 | −1.54 | - | - | - | - |
| Bpev01.c0327.g0073 | −1.55 | - | - | - | - |
| Bpev01.c1382.g0026 | −1.58 | - | - | - | - |
| Bpev01.c1080.g0002 | −1.52 | −1.58 | - | −1.79 | - |
| Bpev01.c0458.g0015 | −2.9 | −1.6 | - | - | - |
| Bpev01.c0190.g0038 | −1.6 | - | - | - | - |
| Bpev01.c0114.g0058 | −2.25 | −1.64 | - | −1.76 | - |
| Bpev01.c0052.g0046 | −1.67 | - | - | - | - |
| Bpev01.c0213.g0061 | - | −1.67 | - | - | - |
| Bpev01.c1044.g0004 | −1.68 | - | - | - | - |
| Bpev01.c0135.g0028 | −1.69 | - | - | - | - |
| Bpev01.c1627.g0007 | −2.7 | −1.73 | - | −3.79 | - |
| Bpev01.c0052.g0017 | −1.78 | - | - | - | - |
| Bpev01.c0237.g0054 | −1.8 | - | - | - | - |
| Bpev01.c0169.g0048 | −2.9 | −1.81 | - | - | - |
| Bpev01.c1414.g0002 | −2.4 | −1.82 | - | - | - |
| Bpev01.c1006.g0017 | −1.88 | - | - | - | - |
| Bpev01.c0473.g0007 | −1.9 | - | - | - | - |
| Bpev01.c0245.g0042 | −1.91 | - | - | - | - |
| Bpev01.c0253.g0008 | −1.95 | - | - | - | - |
| Bpev01.c0027.g0080 | −2.11 | - | - | - | - |
| Bpev01.c0053.g0009 | −2.12 | - | - | - | - |
| Bpev01.c1312.g0005 | −2.53 | −2.15 | - | - | - |
| Bpev01.c0523.g0003 | −2.2 | - | - | - | - |
| Bpev01.c2716.g0001 | −2.28 | - | - | −3.31 | - |
| Bpev01.c0000.g0055 | −2.49 | −2.28 | - | −2.21 | −1.75 |
| Bpev01.c0457.g0037 | −2.3 | - | - | - | - |
| Bpev01.c0680.g0004 | −2.33 | - | - | - | - |
| Bpev01.c0224.g0002 | −2.49 | - | - | - | −1.19 |
| Bpev01.c0161.g0057 | - | - | - | −2.5 | - |
| Bpev01.c0038.g0153 | −2.26 | −2.56 | - | - | - |
| Bpev01.c1529.g0009 | −2.64 | - | - | - | - |
| Bpev01.c1272.g0023 | −2.8 | - | - | −3.53 | - |
| Bpev01.c0275.g0067 | −2.82 | - | - | - | - |
| Bpev01.c1836.g0006 | −2.87 | - | - | - | - |
| Bpev01.c0939.g0009 | −3.05 | - | - | - | - |
| Bpev01.c0046.g0006 | −2.76 | −3.16 | −1.95 | −3.68 | - |
| Bpev01.c0217.g0001 | −3.17 | - | - | −2.85 | - |
| Bpev01.c1574.g0002 | −3.49 | - | - | −6.21 | - |
| Bpev01.c0312.g0012 | - | - | - | −3.66 | - |
| Bpev01.c0261.g0078 | - | −3.81 | - | −5.58 | - |
| Bpev01.c0565.g0007 | - | −3.92 | - | −4.55 | - |
| Bpev01.c0594.g0020 | - | - | - | −4.92 | - |
| Bpev01.c0227.g0002 | −2.41 | −8.16 | - | −4.96 | - |
Table A8.
Amino acids biosynthesis-related DEGs under low-temperature stress in birch.
Table A8.
Amino acids biosynthesis-related DEGs under low-temperature stress in birch.
| Gene_ID | Time | logFC | Funchtion |
|---|---|---|---|
| Bpev01.c0015.g0143 | 1 h | 9.63 | N-acetyl-l-glutamate synthase 2 |
| Bpev01.c0112.g0007 | 3 h | 8.44 | Pyridoxal-5′-phosphate-dependent enzyme family protein |
| Bpev01.c0511.g0007 | 3 h | 7.44 | Aldolase superfamily protein |
| Bpev01.c0115.g0053 | 1 h | 4.03 | Aldolase superfamily protein |
| Bpev01.c0274.g0001 | 1 h | 2.69 | ATP phosphoribosyl transferase 2 |
| Bpev01.c0148.g0010 | 1 h | 4.59 | Branched-chain amino acid transaminase 2 |
| Bpev01.c0462.g0003 | 1 h | 2.08 | 3-deoxy-d-arabino-heptulosonate 7-phosphate synthase |
| Bpev01.c0082.g0091 | 2.5 h | 2.37 | HOPW1-1-interacting 1 |
| Bpev01.c0083.g0021 | 1 h | 1.85 | Phosphofructokinase 2 |
| Bpev01.c0137.g0017 | 1 h | 2.58 | Cysteine synthase D1 |
| Bpev01.c0425.g0050 | 1 h | 1.31 | Aldolase superfamily protein |
| Bpev01.c2707.g0004 | 1 h | 1.26 | Cytosolic NADP+-dependent isocitrate dehydrogenase |
| Bpev01.c0929.g0016 | 1 h | 1.2 | O-acetylserine (thiol) lyase (OAS-TL) isoform A1 |
| Bpev01.c0146.g0019 | 1 h | 1.16 | D-aminoacid aminotransferase-like PLP-dependent enzymes superfamily protein |
| Bpev01.c0145.g0054 | 1 h | 1.57 | Glutamine synthase clone R1 |
| Bpev01.c0517.g0019 | 1 h | 1.04 | D-ribulose-5-phosphate-3-epimerase |
| Bpev01.c0112.g0020 | 1 h | 1 | Serine acetyltransferase 2;2 |
| Bpev01.c0000.g0226 | 1.5 h | −1.02 | Aspartate aminotransferase |
| Bpev01.c0198.g0001 | 1 h | −1.59 | Enolase 1 |
| Bpev01.c0169.g0035 | 1 h | −1.1 | Pyruvate kinase family protein |
| Bpev01.c0192.g0016 | 1 h | −1.24 | Arginase |
| Bpev01.c1518.g0002 | 1 h | −1.12 | Ketol-acid reductoisomerase |
| Bpev01.c0120.g0017 | 1 h | −1.12 | D-3-phosphoglycerate dehydrogenase |
| Bpev01.c0874.g0032 | 1 h | −1.13 | Dihydrodipicolinate synthase |
| Bpev01.c0146.g0013 | 1 h | −1.14 | Pyridoxal phosphate (PLP)-dependent transferases superfamily protein |
| Bpev01.c2230.g0005 | 1 h | −1.15 | Pyruvate kinase family protein |
| Bpev01.c0192.g0009 | 1 h | −1.24 | RNA 3′-terminal phosphate cyclase/enolpyruvate transferase, alpha/beta |
| Bpev01.c1356.g0002 | 1 h | −1.28 | Dehydroquinate dehydratase, putative / shikimate dehydrogenase, putative |
| Bpev01.c2160.g0012 | 2.5 h | −1.31 | Glyceraldehyde-3-phosphate dehydrogenase of plastid 2 |
| Bpev01.c1534.g0010 | 1 h | −2.15 | Plastidic pyruvate kinase beta subunit 1 |
| Bpev01.c0275.g0025 | 1 h | −1.35 | Aspartate kinase-homoserine dehydrogenase ii |
| Bpev01.c0683.g0005 | 1 h | −1.49 | Methionine adenosyltransferase 3 |
| Bpev01.c1040.g0016 | 1 h | −1.5 | Glyceraldehyde-3-phosphate dehydrogenase C2 |
| Bpev01.c1115.g0006 | 1 h | −1.78 | Pyridoxal-5′-phosphate-dependent enzyme family protein |
| Bpev01.c0000.g0150 | 1 h | −2.03 | 3-deoxy-D-arabino-heptulosonate 7-phosphate synthase 1 |
| Bpev01.c0449.g0055 | 1 h | −1.83 | Semialdehyde dehydrogenase family protein |
| Bpev01.c3196.g0001 | 1 h | −2.32 | Dihydrodipicolinate reductase |
| Bpev01.c0652.g0026 | 1 h | −2.34 | Shikimate kinase 1 |
| Bpev01.c0279.g0010 | 1 h | −2.53 | Glutamine-dependent asparagine synthase 1 |
| Bpev01.c0167.g0024 | 1.5 h | −2.65 | Tyrosine transaminase family protein |
Table A9.
Photosynthesis-related DEGs under low-temperature stress in birch.
Table A9.
Photosynthesis-related DEGs under low-temperature stress in birch.
| Gene_ID | Time | logFC | Function |
|---|---|---|---|
| Bpev01.c0154.g0066 | 1.5 h | 4.19 | Ferretin 1 |
| Bpev01.c1891.g0002 | 1.5 h | 4.02 | Photosystem II reaction center protein A |
| Bpev01.c1891.g0006 | 1.5 h | 3.49 | Photosystem II reaction center protein C |
| Bpev01.c1891.g0007 | 1.5 h | 3.05 | Photosystem I, PsaA/PsaB protein |
| Bpev01.c1286.g0001 | 2.5 h | 1.7 | Phosphoenolpyruvate carboxykinase 1 |
| Bpev01.c0088.g0023 | 1 h | 1.43 | STT7 homolog STN7 |
| Bpev01.c0299.g0030 | 1 h | 1.37 | Fibrillin |
| Bpev01.c0245.g0079 | 1 h | 1.76 | Ferric reduction oxidase 7 |
| Bpev01.c1657.g0013 | 1 h | 1.16 | J-domain protein required for chloroplast accumulation response 1 |
| Bpev01.c0088.g0011 | 1 h | 1.46 | Hydroxyproline-rich glycoprotein family protein |
| Bpev01.c1275.g0002 | 1 h | 1.05 | Photosystem II subunit R |
| Bpev01.c0062.g0077 | 1 h | 1.04 | DegP protease 1 |
| Bpev01.c0038.g0100 | 1 h | 1.01 | Chloroplast sensor kinase |
| Bpev01.c0536.g0012 | 1.5 h | −1.05 | Ferredoxin 3 |
| Bpev01.c0142.g0012 | 1 h | −1.14 | Photosystem II reaction center PsbP family protein |
| Bpev01.c0118.g0021 | 1 h | −1.23 | Mog1/PsbP/DUF1795-like photosystem II reaction center PsbP family protein |
| Bpev01.c0005.g0002 | 1 h | −1.24 | Translocon at the outer envelope membrane of chloroplasts 75-III |
| Bpev01.c1024.g0015 | 1 h | −1.34 | S-adenosylmethionine carrier 1 |
| Bpev01.c0298.g0026 | 1 h | −1.39 | Septum site-determining protein (MIND) |
| Bpev01.c0327.g0054 | 1 h | −1.52 | Tubulin/FtsZ family protein |
| Bpev01.c0615.g0010 | 1 h | −2.68 | Chlorophyll A-B binding family protein |
Table A10.
Differentially expressed TFs under different low-temperature stress time points.
Table A10.
Differentially expressed TFs under different low-temperature stress time points.
| TF Family | Total | 1 h | 1.5 h | 2 h | 2.5 h | 3 h |
|---|---|---|---|---|---|---|
| C2H2 | 58 | 53 | 11 | 6 | 16 | 14 |
| AP2-EREBP | 42 | 29 | 25 | 14 | 24 | 24 |
| MYB-HB-like | 27 | 21 | 7 | 0 | 7 | 6 |
| NAM | 20 | 18 | 5 | 0 | 6 | 3 |
| WD40-like | 20 | 16 | 5 | 0 | 4 | 0 |
| WRKY | 16 | 15 | 2 | 0 | 5 | 5 |
| bHLH | 15 | 12 | 1 | 0 | 2 | 1 |
| Hap3/NF-YB | 15 | 1 | 13 | 0 | 10 | 0 |
| PHD | 14 | 10 | 2 | 1 | 0 | 0 |
| Homobox-WOX | 10 | 10 | 3 | 0 | 1 | 2 |
| bZIP | 8 | 8 | 0 | 0 | 0 | 0 |
| GRAS | 8 | 7 | 4 | 0 | 5 | 3 |
| Znf-B | 7 | 5 | 6 | 0 | 4 | 4 |
| C2C2-Dof | 6 | 4 | 1 | 0 | 2 | 2 |
| C2C2-GATA | 6 | 4 | 1 | 0 | 2 | 2 |
| BTB-POZ | 5 | 4 | 1 | 0 | 2 | 0 |
| C3H | 5 | 4 | 2 | 1 | 3 | 2 |
| C3H-WRC/GRF | 5 | 2 | 3 | 0 | 3 | 0 |
| HSF-type-DNA-binding | 5 | 4 | 3 | 0 | 3 | 2 |
| A20-like | 4 | 4 | 1 | 0 | 2 | 0 |
| HD-ZIP | 4 | 2 | 2 | 0 | 2 | 1 |

Figure A1.
Biological process pathway.
Figure A1.
Biological process pathway.


Figure A2.
Cellular component pathway.
Figure A2.
Cellular component pathway.


Figure A3.
Molecular function pathway.
Figure A3.
Molecular function pathway.

References
- Thomashow, M.F. PLANT COLD ACCLIMATION: Freezing Tolerance Genes and Regulatory Mechanisms. Annu. Rev. Plant Boil. 1999, 50, 571–599. [Google Scholar] [CrossRef]
- Wang, X.; Zhao, Q.; Ma, C.-L.; Zhang, Z.H.; Cao, H.-L.; Kong, Y.-M.; Yue, C.; Hao, X.-Y.; Chen, L.; Ma, J.-Q.; et al. Global transcriptome profiles of Camellia sinensis during cold acclimation. BMC Genom. 2013, 14, 1–15. [Google Scholar] [CrossRef]
- Mittler, R. Oxidative stress, antioxidants and stress tolerance. Trends Plant Sci. 2002, 7, 405–410. [Google Scholar] [CrossRef]
- Uemura, M.; Yoshida, S. Studies on Freezing Injury in Plant Cells. Plant Physiol. 1986, 80, 187–195. [Google Scholar] [CrossRef]
- Dodd, A.N.; Jakobsen, M.K.; Baker, A.J.; Telzerow, A.; Hou, S.-W.; Laplaze, L.; Barrot, L.; Poethig, R.S.; Haseloff, J.; Webb, A.A. Time of day modulates low-temperature Ca2+signals in Arabidopsis. Plant J. 2006, 48, 962–973. [Google Scholar] [CrossRef]
- Qi, J.; Song, C.P.; Wang, B.; Zhou, J.; Kangasjärvi, J.; Zhu, J.K.; Gong, Z. Reactive oxygen species signaling and stomatal movement in plant responses to drought stress and pathogen attack J. J. Integr. Plant Biol. 2018, 60, 805–826. [Google Scholar] [CrossRef]
- Mathur, S.; Agrawal, D.; Jajoo, A. Photosynthesis: Response to high temperature stress. J. Photochem. Photobiol. B Boil. 2014, 137, 116–126. [Google Scholar] [CrossRef]
- Wu, G.; Xianlong, T.; Deguang, Y.; Crops, X.J.J. Research Progress on Physiology of Plant Cold Hardiness. Crops 2008, 3, S311. [Google Scholar]
- Jeong, S.W.; Choi, S.M.; Lee, D.S.; Ahn, S.N.; Hur, Y.; Chow, W.S.; Park, Y.-I. Differential susceptibility of photosynthesis to light-chilling stress in rice (Oryza sativa L.) depends on the capacity for photochemical dissipation of light. Mol. Cells 2002, 13, 419–428. [Google Scholar]
- Jan, W.; András, O.; Ravi, A.; Wu, C.J.N.A.R. The C-Terminal Region of Drosophila Heat Shock Factor (HSF) Contains a Constitutively Functional Transactivation Domain. Nucl. Acids Res. 1996, 24, 367–374. [Google Scholar]
- Krause, E.; Dathe, M.; Wieprecht, T.; Bienert, M. Noncovalent immobilized artificial membrane chromatography, an improved method for describing peptide-lipid bilayer interactions. J. Chromatogr. A 1999, 849, 125–133. [Google Scholar] [CrossRef]
- Medina, J.; Catala, R.; Salinas, J. The CBFs: Three arabidopsis transcription factors to cold acclimate. Plant Sci. 2011, 180, 3–11. [Google Scholar] [CrossRef]
- Nakashima, K.; Ito, Y.; Yamaguchi-Shinozaki, K. Transcriptional Regulatory Networks in Response to Abiotic Stresses in Arabidopsis and Grasses. Plant Physiol. 2009, 149, 88–95. [Google Scholar] [CrossRef]
- Zhu, J.K.; Chinnusamy, V.; Ohta, M.; Kanrar, S.; Lee, B.H.; Agarwal, M. ICE1, a regulator of cold induced transcriptome and freezing tolerance in plants. Genes Dev. 2003, 17, 1043–1054. [Google Scholar]
- Zhu, J.K.; Agarwal, M.; Kapoor, A. Snow1: Interacts with Ice1 and regulates CBF expression and freezing tolerance in Arabidopsis. U.S. Patent No. 7,378,573, 27 May 2008. [Google Scholar]
- Agarwal, M.; Hao, Y.; Kapoor, A.; Dong, C.-H.; Fujii, H.; Zheng, X.; Zhu, J.-K. A R2R3 Type MYB Transcription Factor Is Involved in the Cold Regulation of CBF Genes and in Acquired Freezing Tolerance. J. Boil. Chem. 2006, 281, 37636–37645. [Google Scholar] [CrossRef]
- Shi, Y.; Tian, S.; Hou, L.; Huang, X.; Zhang, X.; Guo, H.; Yang, S. Ethylene Signaling Negatively Regulates Freezing Tolerance by Repressing Expression of CBF and Type-A ARR Genes in Arabidopsis. Plant Cell 2012, 24, 2578–2595. [Google Scholar] [CrossRef]
- Sharma, R.; Singh, G.; Bhattacharya, S.; Singh, A. Comparative transcriptome meta-analysis of Arabidopsis thaliana under drought and cold stress. PLoS ONE 2018, 13, e203266. [Google Scholar] [CrossRef]
- Yun, M.; Dai, X.; Xu, Y.; Wei, L.; Zheng, X.; Zeng, D.; Pan, Y.; Lin, X.; Liu, H.; Zhang, D.J.C. COLD1 confers chilling tolerance in rice. Cell 2015, 6, 1209–1221. [Google Scholar]
- Gu, H.; Hagberg, P.; Zhou, W. Cold pretreatment enhances microspore embryogenesis in oilseed rape (Brassica napus L.). Plant Growth Regul. 2004, 42, 137–143. [Google Scholar] [CrossRef]
- Ito, Y.; Katsura, K.; Maruyama, K.; Taji, T.; Kobayashi, M.; Seki, M. Functional analysis of rice dreb1/cbf-type transcription factors involved in cold-responsive gene expression in transgenic rice. Plant Cell Physiol. 2006, 47, 141–153. [Google Scholar] [CrossRef]
- Winfield, M.O.; Lu, C.; Wilson, I.D.; Coghill, J.A.; Edwards, K.J. Plant responses to cold: Transcriptome analysis of wheat. Plant Biotechnol. J. 2010, 8, 749–771. [Google Scholar] [CrossRef] [PubMed]
- Lu, J.; Du, Z.-X.; Kong, J.; Chen, L.-N.; Qiu, Y.-H.; Li, G.-F.; Meng, X.-H.; Zhu, S.-F. Transcriptome Analysis of Nicotiana tabacum Infected by Cucumber mosaic virus during Systemic Symptom Development. PLoS ONE 2012, 7, e43447. [Google Scholar] [CrossRef]
- Hu, H.; You, J.; Fang, Y.; Zhu, X.; Qi, Z.; Xiong, L.J.P.M.B. Erratum to: Characterization of transcription factor geneSNAC2conferring cold and salt tolerance in rice. Plant Mol. Biol. 2010, 72, 567–568. [Google Scholar] [CrossRef]
- Huang, G.-T.; Ma, S.-L.; Bai, L.-P.; Zhang, L.; Ma, H.; Jia, P.; Liu, J.; Zhong, M.; Guo, Z.-F. Signal transduction during cold, salt, and drought stresses in plants. Mol. Boil. Rep. 2011, 39, 969–987. [Google Scholar] [CrossRef] [PubMed]
- Kurepin, L.V.; Dahal, K.P.; Savitch, L.V.; Singh, J.; Bode, R.; Ivanov, A.G.; Hurry, V.M.; Hüner, N.P.A. Role of CBFs as Integrators of Chloroplast Redox, Phytochrome and Plant Hormone Signaling during Cold Acclimation. Int. J. Mol. Sci. 2013, 14, 12729–12763. [Google Scholar] [CrossRef]
- Dong, C.-J.; Li, L.; Cao, N.; Shang, Q.M.; Zhang, Z.-G. Roles of phenylalanine ammonia-lyase in low temperature tolerance in cucumber seedlings. Chin. J. Appl. Ecol. 2015, 26, 2041–2049. [Google Scholar]
- Savitch, L.V.; Harney, T.; Hüner, N.P.A. Sucrose metabolism in spring and winter wheat in response to high irradiance, cold stress and cold acclimation. Physiol. Plant. 2000, 108, 270–278. [Google Scholar] [CrossRef]
- Christenhusz, M.J.; Byng, J.W. The number of known plants species in the world and its annual increase. Phytotaxa 2016, 261, 201. [Google Scholar] [CrossRef]
- Doyle, J. CTAB Total DNA Isolation. Mol. Tech. Taxon. 1991, 57, 283–293. [Google Scholar]
- Chen, S.; Zhou, Y.; Chen, Y.; Gu, J. Fastp: An ultra-fast all-in-one FASTQ preprocessor. Bioinformatrics 2018, 34, i884–i890. [Google Scholar] [CrossRef]
- Salojärvi, J.; Smolander, O.-P.; Nieminen, K.; Rajaraman, S.; Safronov, O.; Safdari, P.; Lamminmaki, A.; Immanen, J.; Lan, T.; Tanskanen, J.; et al. Genome sequencing and population genomic analyses provide insights into the adaptive landscape of silver birch. Nat. Genet. 2017, 49, 904–912. [Google Scholar] [CrossRef] [PubMed]
- Kim, D.; Langmead, B.; Salzberg, S.L. HISAT: A fast spliced aligner with low memory requirements. Nat. Methods 2015, 12, 357–360. [Google Scholar] [CrossRef] [PubMed]
- Rau, A.; Gallopin, M.; Celeux, G.; Jaffrézic, F. Data-based filtering for replicated high-throughput transcriptome sequencing experiments. Bioinformatrics 2013, 29, 2146–2152. [Google Scholar] [CrossRef]
- Robinson, M.D.; McCarthy, D.J.; Smyth, G.K. edgeR: A Bioconductor package for differential expression analysis of digital gene expression data. Bioinformatrics 2009, 26, 139–140. [Google Scholar] [CrossRef] [PubMed]
- Xie, C.; Mao, X.; Huang, J.; Ding, Y.; Wu, J.; Dong, S.; Kong, L.; Gao, G.; Li, C.; Wei, L. KOBAS 2.0: A web server for annotation and identification of enriched pathways and diseases. Nucleic Acids Res. 2011, 39, W316–W322. [Google Scholar] [CrossRef]
- Altschul, S.F.; Madden, T.L.; Schäffer, A.A.; Zhang, J.; Zhang, Z.; Miller, W.; Lipman, D.J. Gapped BLAST and PSI-BLAST: A new generation of protein database search programs. Nucleic Acids Res. 1997, 25, 3389–3402. [Google Scholar] [CrossRef]
- Pruitt, K.D.; Tatusova, T.; Maglott, N.R. NCBI Reference Sequence (RefSeq): A curated non-redundant sequence database of genomes, transcripts and proteins. Nucleic Acids Res. 2004, 33, D501–D504. [Google Scholar] [CrossRef]
- Amos, B.; Rolf, A. The SWISS-PROT protein sequence data bank and its supplement TrEMBL in 1999. Nucleic Acids Res. 1999, 27, 49–54. [Google Scholar]
- Minoru, K.; Susumu, G. KEGG: Kyoto Encyclopedia of Genes and Genomes. Nucleic Acids Res. 2000, 28, 27–30. [Google Scholar]
- Chen, J.; Xia, X.; Yin, W. A poplar DRE-binding protein gene, PeDREB2L, is involved in regulation of defense response against abiotic stress. Gene 2011, 483, 36–42. [Google Scholar] [CrossRef]
- Dai, Z.; Sheridan, J.M.; Gearing, L.J.; Moore, D.L.; Su, S.; Wormald, S.; Wilcox, S.; O’Connor, L.; Dickins, R.A.; Blewitt, M.E.; et al. edgeR: A versatile tool for the analysis of shRNA-seq and CRISPR-Cas9 genetic screens. F1000Research 2014, 3. [Google Scholar] [CrossRef] [PubMed]
- Huang, L.M.; Lai, C.P.; Chen, L.F.O.; Chan, M.T.; Shaw, J.F. Arabidopsis SFAR4 is a novel GDSL-type esterase involved in fatty acid degradation and glucose tolerance. Bot. Stud. 2015, 56, 33. [Google Scholar] [CrossRef] [PubMed]
- Valmonte, G.R.; Arthur, K.; Higgins, C.M.; MacDiarmid, R.M. Calcium-Dependent Protein Kinases in Plants: Evolution, Expression and Function. Plant Cell Physiol. 2014, 55, 551–569. [Google Scholar] [CrossRef]
- Ma, W.; Berkowitz, G.A. Ca2+ conduction by plant cyclic nucleotide gated channels and associated signaling components in pathogen defense signal transduction cascades. New Phytol. 2010, 190, 566–572. [Google Scholar] [CrossRef]
- Huang, C.; Ding, S.; Zhang, H.; Du, H.; An, L. CIPK7 is involved in cold response by interacting with CBL1 in Arabidopsis thaliana. Plant Sci. 2011, 181, 57–64. [Google Scholar] [CrossRef] [PubMed]
- Fu, J.; Miao, Y.; Shao, L.; Hu, T.; Yang, P. De novo transcriptome sequencing and gene expression profiling of Elymus nutans under cold stress. BMC Genom. 2016, 17, 1–19. [Google Scholar] [CrossRef]
- Chen, C.; Zhang, Y.; Xu, Z.; Luan, A.; Mao, Q.; Feng, J.; Xie, T.; Gong, X.; Wang, X.; Chen, H.; et al. Transcriptome Profiling of the Pineapple under Low Temperature to Facilitate Its Breeding for Cold Tolerance. PLoS ONE 2016, 11, e163315. [Google Scholar] [CrossRef]
- Wang, Z.; Gerstein, M.; Snyder, M. RNA-Seq: A revolutionary tool for transcriptomics. Nat. Rev. Genet. 2009, 10, 57–63. [Google Scholar] [CrossRef]
- Rivero, R.M.; Ruiz, J.M.; García, P.C.; Lopez-Lefebre, L.R.; Sánchez, E.; Romero, L. Resistance to cold and heat stress: Accumulation of phenolic compounds in tomato and watermelon plants. Plant Sci. 2001, 160, 315–321. [Google Scholar] [CrossRef]
- Michalak, A. Phenolic Compounds and Their Antioxidant Activity in Plants Growing under Heavy Metal Stress. J. Environ. Stud. 2006, 15, 523–530. [Google Scholar]
- Asada, M.; Nishimura, T.; Ifuku, K.; Mino, H. Location of the extrinsic subunit PsbP in photosystem II studied by pulsed electron-electron double resonance. Biochim. Biophys. Acta (BBA) Bioenerg. 2018, 1859, 394–399. [Google Scholar] [CrossRef] [PubMed]
- Abeynayake, S.W.; Etzerodt, T.P.; Jonavičienė, K.; Byrne, S.; Asp, T.; Boelt, B. Fructan metabolism and changes in fructan composition during cold acclimation in perennial ryegrass. J. Front. Plant Sci. 2015, 6, 329. [Google Scholar] [CrossRef] [PubMed]
- Li, H.-W.; Zang, B.-S.; Deng, X.-W.; Wang, X.-P. Overexpression of the trehalose-6-phosphate synthase gene OsTPS1 enhances abiotic stress tolerance in rice. Planta 2011, 234, 1007–1018. [Google Scholar] [CrossRef] [PubMed]
- Dionne, J.; Rochefort, S.; Huff, D.R.; Desjardins, Y.; Bertrand, A.; Castonguay, Y. Variability for Freezing Tolerance among 42 Ecotypes of Green-Type Annual Bluegrass. Crop. Sci. 2010, 50, 321–336. [Google Scholar] [CrossRef]
- Chen, S.; Lin, X.; Zhang, D.; Li, Q.; Zhao, X.; Chen, S. Genome-Wide Analysis of NAC Gene Family in Betula pendula. Forests 2019, 10, 741. [Google Scholar] [CrossRef]
- Ritonga, F.N.; Chen, S. Physiological and Molecular Mechanism Involved in Cold Stress Tolerance in Plants. Plants 2020, 9, 560. [Google Scholar] [CrossRef]
- Wang, F.; Chen, S.; Liang, D.; Qu, G.-Z.; Chen, S.; Zhao, X.-Y. Transcriptomic analyses of Pinus koraiensis under different cold stresses. BMC Genom. 2020, 21, 10–14. [Google Scholar] [CrossRef]
- Caspy, I.; Nelson, N. Structure of the plant photosystem I. Biochem. Soc. Trans. 2018, 46, 285–294. [Google Scholar] [CrossRef]
- Pyke, K. The genetic control of plastid division in higher plants. Am. J. Bot. 1997, 84, 1017–1027. [Google Scholar] [CrossRef]
- Ishikita, H.; Stehlik, D.; Golbeck, J.H.; Knapp, E.-W. Electrostatic Influence of PsaC Protein Binding to the PsaA/PsaB Heterodimer in Photosystem I. Biophys. J. 2005, 90, 1081–1089. [Google Scholar] [CrossRef]


© 2020 by the authors. Licensee MDPI, Basel, Switzerland. This article is an open access article distributed under the terms and conditions of the Creative Commons Attribution (CC BY) license (http://creativecommons.org/licenses/by/4.0/).