Article

Discrimination and Determination of Extractive Content of Ebony (Diospyros celebica Bakh.) from Celebes Island by Near-Infrared Spectroscopy

1
Department of Forest Products, Faculty of Forestry and Environment, IPB University (Bogor Agricultural University), Kampus IPB Darmaga, Bogor 16680, Indonesia
2
Department of Mechanical and Biosystem Engineering, Faculty of Agricultural Engineering and Technology, IPB University (Bogor Agricultural University), Kampus IPB Darmaga, Bogor 16680, Indonesia
3
Molecular Science Research Group, Advanced Research Laboratory, IPB University (Bogor Agricultural University), Kampus IPB Darmaga, Bogor 16680, Indonesia
4
Department of Silviculture, Faculty of Forestry and Environment, IPB University (Bogor Agricultural University), Kampus IPB Darmaga, Bogor 16680, Indonesia
5
Department of Chemistry, Faculty of Mathematics and Natural Science, IPB University (Bogor Agricultural University), Kampus IPB Darmaga, Bogor 16680, Indonesia
6
Forest Products Research and Development Center, Research, Development and Innovation Agency, Ministry of Environment and Forestry Republic of Indonesia, Jl. Gunung Batu No 5, Bogor 16119, Indonesia
7
Department of Biology, Faculty of Mathematics and Natural Science, Syiah Kuala University, Jln. Teuku Nyak Arief Darussalam, Banda Aceh 23111, Aceh, Indonesia
*
Authors to whom correspondence should be addressed.
Forests 2021, 12(1), 6; https://doi.org/10.3390/f12010006
Submission received: 25 October 2020 / Revised: 3 December 2020 / Accepted: 21 December 2020 / Published: 22 December 2020
(This article belongs to the Section Wood Science and Forest Products)

Abstract

:
Ebony (Diospyros celebica Bakh.) is an endemic plant on Celebes (Sulawesi) island. Extractive compounds within ebony wood cause it to have durability, strength, and beautiful patterns. In this study, we used near-infrared (NIR) spectroscopy to discriminate between ebony wood samples, based on their origins at different growth sites on Celebes island, and to develop quantitative models to predict the extractive content of ebony wood. A total of 45 wood meal samples from 11 sites located in West, Central, and South Celebes were collected in this study. NIR spectral data were acquired from hot water and ethanol–benzene soluble extracts from ebony wood in this study. The extractive content of the ebony was 10.408% and 10.774% based on hot water solubility and treatment with ethanol–benzene solvent, respectively. Multivariate analysis based on principal component analysis–discriminant analysis revealed that ebony wood from West Celebes differed from most of the wood from South Celebes; however, it was only slightly different from ebony wood from Central Celebes based on NIR spectra data. These findings were in line with the extractive contents obtained. Partial least square regression models based on wood meal spectra could potentially be used to estimate the hot water and ethanol–benzene extractive contents from ebony wood.

1. Introduction

The genus Diospyros includes about 500 species of trees and shrubs that grow in tropical to temperate regions. Some Diospyros species in tropical Africa, India, and Southeast Asia have dark-black heartwood with black spots or stripes, which is often called black wood or ebony wood. This unique wood has a high value [1]. An endemic ebony species on Celebes (Sulawesi), an island in the Central-East part of Indonesia, is Diospyros celebica Bakh. [2]. The wood of this species has been characterized as luxury sawn timber since the 18th century [3], and it was the first of the fancy wood group categorized in Indonesia. Like ebony from other species, the wood of D. celebica has a unique appearance, with the presence of black wood with stripes of reddish-brown, gray, or greenish-brown, especially in the heartwood part [4,5]. According to [6], ebony wood is durable and strong; the specific gravity of ebony is between 1.01 and 1.27, and it is therefore categorized as class I for both strength and durability. Ebony wood is used for construction as well as other purposes, such as luxury furniture, carving, decorative tools, and musical instruments. The great demand and high price of ebony wood have led to increased logging in natural forests and accelerated illegal logging activities. The International Union for Conservation of Nature (IUCN) Red List categorized ebony as vulnerable [7], and limitations on logging and trading have therefore been instituted.
Extractives play an important role in the natural durability of wood. These chemical compounds are produced by plant secondary metabolism. With regard to ebony, research by [1,8] found that the black portion of heartwood was resistant to fungal and termite attack. According to [9], Diospyros species contain extractives such as naphthoquinone, naphthalene, and derivatives of naphthol. In particular, the heartwood of D. celebica contains diomelquinone, o-naphthoquinone, celebaquinone, isocelebaquinone, and diosindigo [10]. Determining the total content of extractives by conventional means requires solvents with different polarities. Consequently, determining extractive content is costly; however, it is also important because it can lead to timber identification. In addition, the rapid assessment of extractive content can provide a quick, indirect assessment of durability. Such assessments enable the evaluation of heartwood quality for genetic breeding, which benefits from having a large number of individual tree samples [11].
Near-infrared spectroscopy (NIRS) paired with multivariate analyses is an analytical methodology that provides information on the high-weight chemical groups present in cellulose, hemicellulose, lignin, and extractive molecules (resin, gums, etc.) in wood [12]. It can be used to identify and rapidly predict a specific wood’s properties [13], such as its physical and mechanical properties [14,15,16,17] and chemical components [18,19,20,21,22], and to discriminate wood samples based on site origin and timber identification [23,24,25,26,27]. The current study tested the use of NIRS for discriminating ebony wood based on growth sites on Sulawesi, and developed feasibility in the quantitative prediction of the extractive content of its wood.

2. Materials and Methods

2.1. Sample Preparation

Ebony trees from 11 different sites on Celebes island were chosen. Three sites were in West Celebes (Batu Ampa Village, Gandang Dewata National Park, and Sondoang Village), four sites in Central Celebes (Wawopada Seed Stand, Sausu Seed Stand, Pangi Binangga Nature Reserve, and North Poso Pesisir Secondary Forest), and four sites in South Celebes (Belabori Protection Forest, Tanatoro Protection Forest, Cani Sirenreng Nature Reserve, and Coppo Seed Stand), as shown in Figure 1. Trees of unknown age with a diameter of about 30 cm were chosen, and samples were taken from these trees using a Pickering Punch® tool (Agroislab, Welburn, UK) at a height of approximately 100 cm from the ground (Figure 2). The samples were cylindrical in shape and approximately 10 to 15 cm in length, with a diameter of 2 cm (Figure 2a). These samples were then cut into smaller pieces for various analyses (Figure 2b), and some samples were milled to produce wood meal with a particle size of 40–60 mesh (Figure 2c). A total of 45 composited samples were obtained from West Celebes (15 samples), from Central Celebes (17 samples), and from South Celebes (13 samples). For laboratory testing, the wood meal samples were prepared in accordance with Technical Association of the Pulp and Paper Industry (TAPPI) standard T257 cm-85 [28]. Wood meal samples were also used for acquiring NIRS data.

2.2. NIR Spectra Acquisition

The NIR spectra of 45 wood meal samples were collected using a Buchi® NIRFlex N-500 spectrometer equipped with a fiber-optic probe instrument, and operated using the software NIRWare 1.2 (Buchi Labortechnik AG, Flawil, Switzerland). The spectral range was measured between 1000 and 2500 nm (10,000 to 4000 cm−1) at 4 cm−1 spectral resolution. Approximately 15 g of the wood meal was placed in a petri dish for NIRFlex. Calibration of the device was necessary for the initial acquisition process. All samples underwent reflectance spectroscopy scanning for approximately 30 s in a laboratory environment at 20 °C to 23 °C. Three spectra were collected for each of the samples for a total of 135 spectra. All reflectance spectra (R) were obtained as original or raw spectra, which were then converted to absorbance (A) spectra in the data processing.

2.3. Wet Chemical Laboratory Methods

The moisture content and the hot water and ethanol–benzene solubility of the extractives were gravimetrically determined according to the TAPPI standard test methods T 264 cm-97 [29], T204 cm-97 [30], and T207 cm-99 [31], respectively. The ethanol–benzene mixture was used in this study to obtain the highest level of extractives, which was enabled by the additional dissolution of low molecular weight carbohydrates and polyphenols. For determining the extractive content by hot water solubility, approximately 2.0 ± 0.1 g of wood meal was transferred to an Erlenmeyer flask, 100 mL of distilled water was added, and the flask was placed in a boiling water bath for 3 h. The flask contents were transferred to a filtering crucible, which had been previously dried to a constant weight. Finally, the sample was washed with 200 mL of hot distilled water. Extractive content was also determined with ethanol–benzene (1:2, v/v) solvent using a Soxhlet flask. A wood meal sample of 2.0 ± 0.1 g in a extraction thimble was extracted via a solvent cycle for at least 24 extractions. The thimble was washed with small amounts of fresh solvent, then the contents were dried in an oven at 102 ± 3 °C to a constant weight.

2.4. Data Analysis

The 135 NIR spectra were divided into two groups: (1) Test sets (2/3 data or 90 spectra) or calibration data set, and (2) cross-validation (1/3 data or 45 spectra) or validation data set. Data analysis and spectral processing were carried out using Unscrambles® X (ver. 10.1 from CAMO software USA). To obtain an optimal model, and to choose the number of latent variables and exclude outliers, data were preprocessed using Savitzky–Golay first and second derivatives, multiplicative scatter correction (MSC), smoothing, or standard normal variate (SNV) to eliminate or minimize variations related to the baseline shifts caused by additive and multiplicative scattering. This step was necessary because the near spectrum contained overlapping information in terms of raw spectra data, and could not provide a satisfactory model.
Multivariate statistical analytical techniques must be used to decipher the complicated information conveyed by such spectra [14,21]. In this study, for the discrimination and identification of wood samples, NIRS data were evaluated by using principal components analysis–discriminant analysis (PCA–DA) and a partial least square regression model (PLSR), which are statistical methods for the classification of data and calculation of models for quantitative analysis, respectively [18,19,27,32]. PCA-DA was used to recognize the distribution of the spectra, which can indirectly lead to discrimination of ebony wood based on growth site differences. The PLSR was developed to find the best correlation function between NIR spectral data and extractive content. This method is typically used to identify and quantify chemical components in wood based on NIR spectra, and it provides better predictive diagnostics than other methods (e.g., principal components regression) in wood chemistry [21,33,34].
The statistical summary generated was used to select the predictive model to estimate the extractive content. The accuracy of each calibration model can be evaluated using the coefficient of determination (R2), root mean square error of calibration and prediction (RMSEC and RMSEP), and the ratio of performance to deviation (RPD). Reference [18,19] explained that an R2 value between 0.50 and 0.65 indicates that high and low concentrations can be discriminated. A value for R2 between 0.66 and 0.81 indicates approximate quantitative predictions, whereas an R2 value between 0.82 and 0.90 reveals good predictions. For a reliable model, the R2 value should be high, while the RMSE value for both calibration and validation should be low. RPD is a measurement of the ability of an NIRS model to predict a constituent. An RPD value below 2.0 cannot yield a relevant prediction, while a value of 2.0–3.0 is adequate for rough screening. Reference [35] reported that an RPD value between 1.5 and 2.5 is sufficient for estimating wood properties. A value above 3.0 is satisfactory for screening (e.g., in plant breeding), values of 5.0 or more are suitable for quality control analysis, and values above 8.0 are excellent, and can be used in any analytical situation.

3. Results

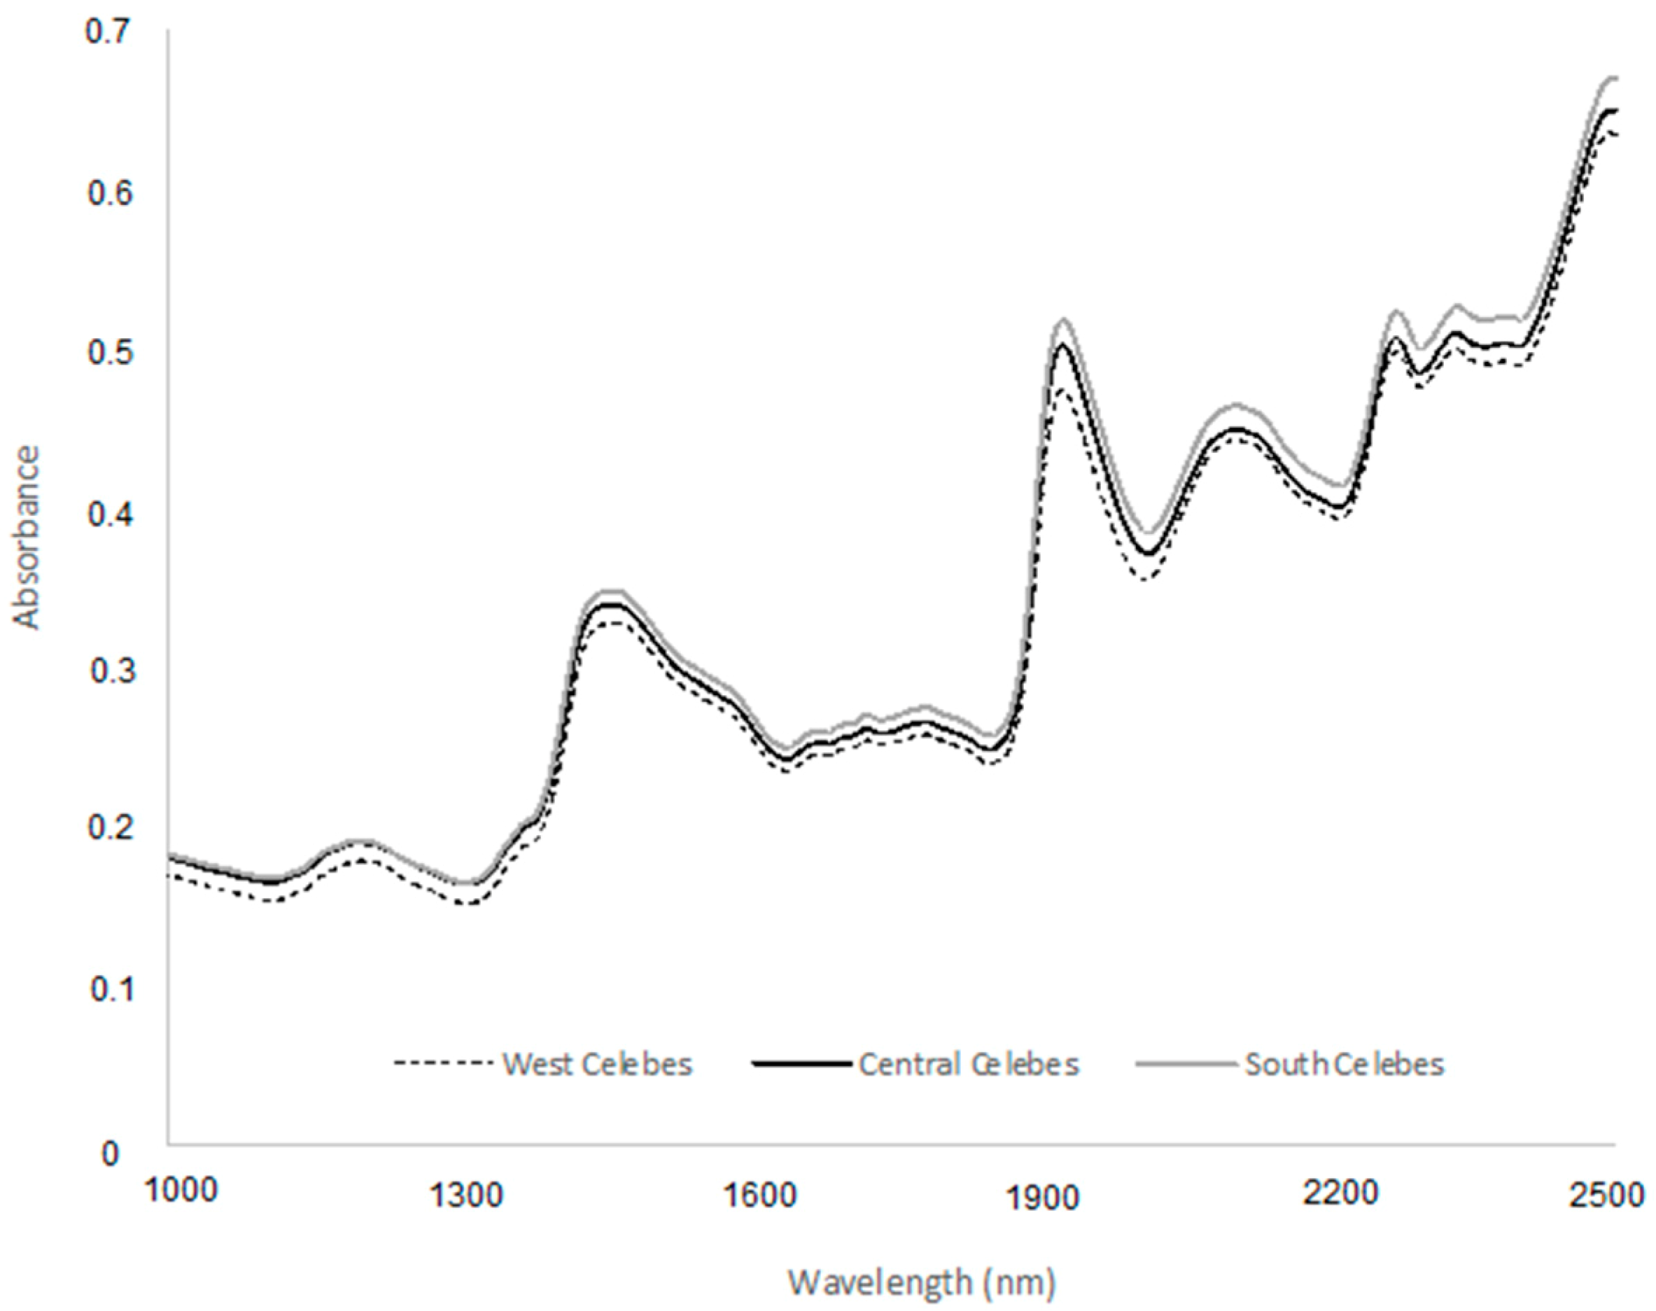
3.1. Spectroscopic Characterization

NIR spectra obtained using the Buchi® NIRFlex had an absorbance range between 0.070 and 0.701 (Figure 3). Peaks and valleys in spectra were due to different light absorptions by the wood meal, and they indicated the existence of various chemical compounds in ebony wood. Original spectral data patterns, as shown in Figure 3, are a common pattern in wood, with subtle differences between wood species in many places within individual spectra, and variation based on the growth sites of ebony wood. A distinct absorbance pattern produced by preprocessing spectral data of the second derivative, and MSC of absorbance spectra shown at 1413, 1901, and 2250 nm is shown in Figure 4.

3.2. Wet Chemical Analysis

At a mean moisture content of about 7.84%, the average extractive content using hot water and ethanol–benzene solvent was 10.408% and 10.774%, respectively (Table 1). Extractive content for both hot water and ethanol–benzene solubility was highest for the ebony wood from West Celebes, followed by Central Celebes, and the lowest was from ebony wood from South Celebes. Statistical analysis revealed that site origin was not associated with a significant difference in extractive content based on hot water solubility. Meanwhile, for ethanol–benzene solubility, no significant difference was found between West and Central Celebes samples, whereas the extractive content of samples was significantly different between West and South Celebes (Table 1). The solubility in ethanol–benzene enabled successful discrimination of extractive contents based on site origin, especially between West Celebes and South Celebes. The higher standard deviation values for hot water and ethanol–benzene solubility of 2.225% and 2.116%, respectively, were found for ebony wood from South Celebes. The results from paired sample t-tests showed that the extractive content based on hot water and ethanol–benzene solubility was not significantly different at α = 0.5.

3.3. Chemometric Analysis

In the first step of model building in the current study, calibration and validation data sets were subjected to PCA. PCA-DA was used because the single PCA from NIR spectral data could not clearly discriminate the growth sites of the ebony wood. Discriminant analysis was carried out using seven principal components (PCs) obtained from the PCA, and it showed two values of the discriminant function (DF) that were successful for discriminating the site origin of ebony wood in Celebes. Ebony wood from West Celebes differed the most from wood from South Celebes, while it slightly differed from ebony wood from Central Celebes (Figure 5).
The multivariate analytical method of PLSR was used to calibrate and validate the spectra, based on reference values from laboratory testing, to develop a regression model. The parameters used to develop the models for extractive content based on hot water and ethanol–benzene solubility are summarized in Table 2. The best preprocessing method was obtained by using raw spectra and combining the second derivative and MSC of the NIR spectra to determine hot water and ethanol–benzene soluble extractives, respectively. The coefficients of determination of R2cal = 0.684 and R2val = 0.598 were obtained for hot water soluble extractives (Figure 6a). For determining the ethanol–benzene soluble extractives, R2cal = 0.609 and R2val = 0.704 were obtained (Figure 6b). The RMSE values represent the average error of the method. In a comparison of the RMSEC and RMSEP, the RMSE values for hot water and ethanol–benzene extractive solubility were still high. The RMSEC and RMSEP were over 1.003 and 0.788 for hot water extractive solubility, and 1.109 and 0.973 for ethanol–benzene extractive solubility. Meanwhile, the model had a RPD = 3.627 and a RPD = 3.569 for hot water and ethanol–benzene solubility, respectively.

4. Discussion

NIR spectra reveal organic and inorganic compounds. Each compound is associated with a distinct absorbance, and the presence of extractives, as well as differences in the moisture content, lead to variations in the spectral data [14,36]. Distinguishing the spectra from one another through visual comparison was difficult in this study because they did not all reveal obvious differences. According to [37], the wavelength at 1900 nm indicates a vibration bond on O–H stretching + 2 × C–O stretching, which is the structure of starch; C=O stretching produces the second overtone, which is a structure of –CO2OH; and the wavelength at 2280 nm reveals C–H stretching + C–H deformation, which indicate the structure of –CH3. In the reviews by [38,39], the NIR band assignments of the chemical components were reported mostly at 1410 nm, 1447 nm, 1668 nm, and 2136 nm. In the literature about prediction based on hot water solubility, [19] reported that the bands at 7042 cm−1 (1420 nm), 5263 cm−1 (1900 nm), and 4380 cm−1 (2283.1 nm) indicated the existence of a phenolic ring, C=O stretching of –CO2H, and C–H stretching + C–H deformation, respectively. In another study about ethanol–benzene solubility by [18], the band at 5200 cm−1 (1923 nm) was attributed to hydroxyl (–OH) and carbonyl (–C=O) groups, whereas the band at 7000 cm−1 (1428.5 nm) was attributable to hydroxyl (–OH) groups. Reference [20] reported that the bands at 1410 and 1900 nm became larger in relation to the extractive and phenolic content with extraction by hot water, and significant spectral differences were found at 2084 and 2036 nm for mahogany (Swietenia macrophylla King). While [39] reported that the vibration at about 2200 nm could be attributed to the extractive content, which coincided with lignin at the absorbance peak.
In our study, the bands at 1900 nm, 2260 nm, and 2440 nm seemed significant, which indicated that the ebony wood was quite predominated by extractive content, about 10%. Generally, the extractive content of samples from West Celebes was higher than that of samples from Central and South Celebes, for both hot water and ethanol–benzene solubility. Extractive content from West Celebes showed a significance difference compared with South Celebes. Previous research on the extractive content of ebony wood was reported by [5], who found that the average extractive content of ebony wood from South Celebes was 9.710% for ethanol–toluene solubility, and 13.540% for hot water solubility, with standard deviations of 2.970% and 1.430%, respectively. The difference in extractive content was presumably related to the site origin quality, which affected the quality of the wood chemical components.
NIR spectral data are rich in information. A NIR spectrum consists of many bands that are usually highly overlapping, due to overtone and combination modes [39]. If the NIR spectra only contained overtone bands, their interpretation would be easier; however, the NIR region also contains groups of combination bands with lower intensity [40]. The results of discriminant analyses in this study were successful in discriminating site origin based on NIR spectral data. The results seemed to be in line with the results from chemical testing, which showed that the extractive content of wood from West Celebes was quite different from wood from South Sulawesi, but had no significant difference from wood from Central Celebes. This initial information was useful in relation to the site origin of ebony wood from Celebes.
A regression model used to develop the models for extractive content based on hot water and ethanol–benzene solubility found that the R2 and RMSE were over 0.6 and 0.9, which indicated that the developed model still needs to be improved for any application. However, the RPD values were over 3.5, which indicated that the model was quite satisfactory for screening purposes. For this reason, the model should be further validated with a wider range of samples prior to implementation.

5. Conclusions

NIR spectral data acquisition, as well as a determination of the extractive content of D. celebica, was carried out on wood meal samples. The samples were collected from 11 sites within West Celebes, Central Celebes, and South Celebes. PCA-DA successfully discriminated NIR spectra based on the growth site of the ebony wood. Samples from West Celebes had different trends compared with those from other parts in Celebes. It seemed that NIRS differences were in line with results on soluble extractives. The NIR spectra could be used to predict the existence of extractive compounds in ebony wood. NIRS may serve an important role in discriminating wood origin, as well as predicting wood properties.

Author Contributions

Conceptualization, methodology, writing—review and editing—L.K.; Data curation, writing-original draft preparation—N.; Validation—Y.A.P. and M.R.; Resources—M.M., R.D., E.H.; Resources, project administration—F.G.D.; Conceptualization, supervision—I.Z.S. All authors have read and agreed to the published version of the manuscript.

Funding

This research was funded by the World Resources Institute’s (WRI) Forest Program grant (Project Code: 04682, period 1 March 2019, to 30 September 2020) titled “Timber Tracking Project IPB-WRI: Collection of physical timber reference material and setting up a reference data building pipeline for DNA of commercial timber species (Diospyros celebica. Bakh)” provided by Norwegian International Climate & Forest Initiative (NICFI).

Acknowledgments

The authors thank (i) West Sulawesi Investment and One-stop Integrated Services (DPMPTSP) for providing a research permit in Batu Ampa Protection Forest, and Sondoang Village, (ii) South Sulawesi Natural Resources Conservation Agency (BKSDA) for providing research permission, providing a permit for domestic transport of research material (SAT-DN), and assisting during sample collection in Mappu-Gandang Dewata National Park, and Cani Sirenreng Nature Park, (iii) South Sulawesi Investment and One-stop Integrated Services (DPMPTSP) for providing research permission in Coppo Village, Bellabori Secondary Forest, and Tana Toro Protection Forest, (iv) Central Sulawesi Natural Resources Conservation Agency (BKSDA) for providing research permission and a permit for domestic transport of research material (SAT-DN) in Pangi Binangga Nature Reserve, and (v) Central Sulawesi Investment and One-stop Integrated Services (DPMPTSP) for providing research permission in North Poso Pesisir Secondary Forest, Wawopada Village, and Sausu Village.

Conflicts of Interest

The authors declare no conflict of interest.

References

  1. Noda, E.; Aoki, T.; Minato, K. Physical and chemical characteristics of the blackened portion of Japanese persimmon (Diospyros kaki). J. Wood Sci. 2002, 48, 245–249. [Google Scholar] [CrossRef]
  2. Whitmore, T.C.; Tantra, I.G.M.; Sutisna, U. Tree Flora of Indonesia: Check List for Sulawesi; Ministry of Forestry, Agency for Forestry Research and Development: Jakarta, Indonesia; Forest Research and Development Centre: Jakarta, Indonesia, 1989. [Google Scholar]
  3. Lemmens, R.H.M.J.; Soerianegara, I.; Wong, W.C. (Eds.) Plant Resources of South-East Asia. No. 5(2): Timber Trees: Minor Commercial Timbers; Backhuys: Leiden, The Netherlands, 1995; ISBN 978-90-73348-44-8. [Google Scholar]
  4. Martawijaya, A.; Kartasujana, I.; Kadir, K.; Prawira, S.A. Atlas Kayu Indonesia Jilid I; Pusat Penelitian dan Pengembangan Hasil Hutan: Bogor, Indonesia, 2015. [Google Scholar]
  5. Asdar, M.; Prayitno, T.A.; Lukmandaru, G.; Faridah, E. Chemical properties of Diospyros celebica Bakh. in different streaks pattern and radial direction. J. Ilmu Teknol. Kayu Tropis 2016, 14, 165–174. [Google Scholar]
  6. Prajadinata, S.; Murniati; Effendi, R. Review of Management and Conservation Status of Ulin (Eusideroxylon Zwageri Teijsm & Binn.), Ebony (Diospyros celebica Bakh.), and Cempaka (Michelia champaca Linn.) in Indonesia; ITTO Project PD 539/09 Rev. 1 (F) in Cooperation with Center for Conservation and Rehabilitation Research and Development, Forestry Research and Development Agency; Ministry of Forestry: Bogor, Indonesia, 2011; ISBN 978-602-8964-18-0.
  7. Centre, W.C.M. IUCN Red List of Threatened Species: Diospyros celebica. Available online: https://www.iucnredlist.org/en (accessed on 2 December 2020).
  8. Rahayu, Y.C. Radial Variation Durability of Eboni (Diospyros celebica Bakh.) Wood against Drywood Termites and Fungal Decay Schizophyllum commune. Bachelor’s Thesis, Institut Pertanian Bogor (IPB University), Bogor, Indonesia, 2018. [Google Scholar]
  9. Sharma, V. Brief review on the genus Diospyros: A rich source of Naphthoquinones. Asian J. Adv. Basic Sci. 2017, 5, 34–53. [Google Scholar]
  10. Maiti, B.C.; Musgrave, O.C. Ebenaceae extractives. Part 9. New naphthoquinones and binaphthylquinones from macassar ebony. J. Chem. Soc. Perkin Trans. 1986, 1, 675–681. [Google Scholar] [CrossRef]
  11. Li, Y.; Altaner, C.M. Effects of variable selection and processing of NIR and ATR-IR spectra on the prediction of extractive content in Eucalyptus bosistoana heartwood. Spectrochim. Acta Part A Mol. Biomol. Spectrosc. 2019, 213, 111–117. [Google Scholar] [CrossRef] [Green Version]
  12. Snel, F.A.; Braga, J.W.B.; da Silva, D.; Wiedenhoeft, A.C.; Costa, A.; Soares, R.; Coradin, V.T.R.; Pastore, T.C.M. Potential field-deployable NIRS identification of seven Dalbergia species listed by CITES. Wood Sci. Technol. 2018, 52, 1411–1427. [Google Scholar] [CrossRef] [Green Version]
  13. Tsuchikawa, S.; Kobori, H. A review of recent application of near infrared spectroscopy to wood science and technology. J. Wood Sci. 2015, 61, 213–220. [Google Scholar] [CrossRef] [Green Version]
  14. Kludt, K.D. Use of Near Infrared Spectroscopy Technology for Predicting Bending Properties of Clear Wood Specimens. Master’s Thesis, Washington State University, Washington, DC, USA, 2003. [Google Scholar]
  15. Karlinasari, L.; Sabed, M.; Wistara, I.N.J.; Wijayanto, H.; Purwanto, Y.A. Near infrared (NIR) spectroscopy to predict physical properties of acacia mangium at three different age classes. J. Indones. Wood Res. Soc. 2013, 4, 7–12. [Google Scholar]
  16. Sandak, A.; Sandak, J.; Riggio, M. Assessment of wood structural members degradation by means of infrared spectroscopy: An overview. Struct. Control Health Monit. 2016, 23, 396–408. [Google Scholar] [CrossRef]
  17. Schimleck, L.R.; Matos, J.L.M.; Trianoski, R.; Prata, J.G. Comparison of methods for estimating mechanical properties of wood by NIR spectroscopy. J. Spectrosc. 2018, 2018, 4823285. [Google Scholar] [CrossRef] [Green Version]
  18. He, W.; Hu, H. Prediction of hot-water-soluble extractive, pentosan and cellulose content of various wood species using FT-NIR spectroscopy. Bioresour. Technol. 2013, 140, 299–305. [Google Scholar] [CrossRef] [PubMed]
  19. He, W.; Hu, H. Rapid prediction of different wood species extractives and lignin content using near infrared spectroscopy. J. Wood Chem. Technol. 2013, 33, 52–64. [Google Scholar] [CrossRef]
  20. Da Silva, A.R.; Pastore, T.C.M.; Braga, J.W.B.; Davrieux, F.; Okino, E.Y.A.; Coradin, V.T.R.; Camargos, J.A.A.; do Prado, A.G.S. Assessment of total phenols and extractives of mahogany wood by near infrared spectroscopy (NIRS). Holzforschung 2013, 67, 1–8. [Google Scholar] [CrossRef]
  21. Karlinasari, L.; Sabed, M.; Wistara, I.N.J.; Purwanto, Y.A. Near infrared (NIR) spectroscopy for estimating the chemical composition of (Acacia mangium Willd.) wood. J. Indian Acad. Wood Sci. 2014, 11, 162–167. [Google Scholar] [CrossRef]
  22. Zhou, C.; Jiang, W.; Via, B.K.; Fasina, O.; Han, G. Prediction of mixed hardwood lignin and carbohydrate content using ATR-FTIR and FT-NIR. Carbohydr. Polym. 2015, 121, 336–341. [Google Scholar] [CrossRef] [Green Version]
  23. Bergo, M.C.J.; Pastore, T.C.M.; Coradin, V.T.R.; Wiedenhoeft, A.C.; Braga, J.W.B. NIRS identification of Swietenia macrophylla is robust across specimens from 27 countries. IAWA J. 2016, 37, 420–430. [Google Scholar] [CrossRef] [Green Version]
  24. Sierra, V.; de Luque, M.; Millán, Á.-S.; Pérez, S.; García, E.; Luque, L. NIRWOOD: An EU innovation project to determine species and geographical origin of timber using NIR spectrometry. In Proceedings of the 28th International Conference on Wood Science and Technology, Zagreb, Croatia, 7–8 December 2017. [Google Scholar]
  25. Silva, D.C.; Pastore, T.C.M.; Soares, L.F.; de Barros, F.A.S.; Bergo, M.C.J.; Coradin, V.T.H.; Gontijo, A.B.; Sosa, M.H.; Chacón, C.B.; Braga, J.W.B. Determination of the country of origin of true mahogany (Swietenia macrophylla King) wood in five Latin American countries using handheld NIR devices and multivariate data analysis. Holzforschung 2018, 72, 521–530. [Google Scholar] [CrossRef]
  26. Dormontt, E.E.; Boner, M.; Braun, B.; Breulmann, G.; Degen, B.; Espinoza, E.; Gardner, S.; Guillery, P.; Hermanson, J.C.; Koch, G.; et al. Forensic timber identification: It’s time to integrate disciplines to combat illegal logging. Biol. Conserv. 2015, 191, 790–798. [Google Scholar] [CrossRef]
  27. Beeckman, H.; Blanc-Jolivet, C.; Boeschoten, L.E.; Braga, J.W.B.; Cabezas, J.A.; Chaix, G.; Crameri, S.; Degen, B.; Deklerck, V.; Dormontt, E.; et al. Overview of Current Practices in Data Analysis for Wood Identification. A Guide for the Different Timber Tracking Methods; Schmitz, N., Ed.; Global Timber Tracking Network: Grosshansdorf, Germany; European Forest Institute: Joensuu, Finland; Thünen Institute: Grosshansdorf, Germany, 2020. [Google Scholar]
  28. Technical Association of the Pulp and Paper Industry (TAPPI). Sampling and Preparing Wood for Analysis; T 257 cm-85; Technical Association of the Pulp and Paper Industry (TAPPI): Atlanta, GA, USA, 1996. [Google Scholar]
  29. Technical Association of the Pulp and Paper Industry (TAPPI). Preparation of Wood for Chemical Analysis; T 264 cm-97; Technical Association of the Pulp and Paper Industry (TAPPI): Atlanta, GA, USA, 1997; p. 3. [Google Scholar]
  30. Technical Association of the Pulp and Paper Industry (TAPPI). Solvent Extractives of Wood and Pulp; T 204 cm-97; Technical Association of the Pulp and Paper Industry (TAPPI): Atlanta, GA, USA, 1997; p. 4. [Google Scholar]
  31. Technical Association of the Pulp and Paper Industry (TAPPI). Water Solubility of Wood and Pulp; T 207 cm-99; Technical Association of the Pulp and Paper Industry (TAPPI): Atlanta, GA, USA, 1999; p. 3. [Google Scholar]
  32. Santos, J.; Vieira, H.; Silva, E.; Muñiz, G.I.B.; Soffiatti, P.; Nisgoski, S. Near infrared spectroscopy for separation of tauari wood in Brazilian amazon native forest. JTFS 2020, 32, 227–236. [Google Scholar] [CrossRef]
  33. Rodrigues, J.; Alves, A.; Pereira, H.; Perez, D.d.S.; Chantre, G.; Schwanninger, M. NIR PLSR results obtained by calibration with noisy, low-precision reference values: Are the results acceptable? Holzforschung 2006, 60, 402–408. [Google Scholar] [CrossRef]
  34. Via, B.K.; Zhou, C.; Acquah, G.; Jiang, W.; Eckhardt, L. Near Infrared spectroscopy calibration for wood chemistry: Which chemometric technique is best for prediction and interpretation? Sensors 2014, 14, 13532–13547. [Google Scholar] [CrossRef] [PubMed] [Green Version]
  35. Baillères, H.; Davrieux, F.; Ham-Pichavant, F. Near infrared analysis as a tool for rapid screening of some major wood characteristics in a eucalyptus breeding program. Ann. For. Sci. 2002, 59, 479–490. [Google Scholar] [CrossRef] [Green Version]
  36. Bokobza, L. Near infrared spectroscopy. J. Near Infrared Spectrosc. 2017, 6, 3–17. [Google Scholar] [CrossRef]
  37. Osborne, B.G.; Fearn, T.; Hindle, P.H.; Hindle, P.T. Practical NIR Spectroscopy with Applications in Food and Beverage Analysis; Longman Scientific & Technical: London, UK, 1993; ISBN 978-0-582-09946-3. [Google Scholar]
  38. Workman, J., Jr.; Weyer, L. Practical Guide to Interpretive Near-Infrared Spectroscopy; CRC Press: Boca Raton, FL, USA, 2007; ISBN 978-1-4200-1831-8. [Google Scholar]
  39. Schwanninger, M.; Rodrigues, J.C.; Fackler, K. A Review of band assignments in near infrared spectra of wood and wood components. J. Near Infrared Spectrosc. 2011, 19, 287–308. [Google Scholar] [CrossRef]
  40. Weyer, L.G.; Lo, S.-C. Spectra-structure correlations in the Near-Infrared. In Handbook of Vibrational Spectroscopy; Chalmers, J.M., Griffiths, P.R., Eds.; John Wiley & Sons: Chichester, UK, 2002; Volume 3, pp. 1–21. ISBN 978-0-470-02732-5. [Google Scholar]
Figure 1. Distribution of the 11 sites where ebony wood samples were collected on Celebes, or Sulawesi, island (Sulsel or South Celebes, Sulbar or West Celebes, and Sulteng or Central Celebes).
Forests 12 00006 g001
Figure 2. (a) Samples of ebony wood sample were taken from the trees using a Pickering Punch® tool (Agroislab, Welburn, UK); (b) cylindrical wood sample, (c) wood chip samples, (d) wood meal samples (40–60 mesh).
Forests 12 00006 g002
Figure 3. Representative average of original near-infrared (NIR) spectra of ebony wood samples were collected from South Celebes, West Celebes, and Central Celebes.
Forests 12 00006 g003
Figure 4. Example of second derivative and multiplicative scatter correction (MSC) of absorbance of extractive content in ethanol–benzene solubility for ebony wood.
Forests 12 00006 g004
Figure 5. Discrimination ebony wood based on site origin using NIR spectra data processed by principal components analysis–discriminant analysis (PCA–DA).
Forests 12 00006 g005
Figure 6. Linear regression models of predicted and laboratory values of (a) hot water soluble extractives, and (b) ethanol–benzene soluble extractives of ebony wood.
Forests 12 00006 g006
Table 1. Extractive content in different solvent on ebony wood from South Celebes, West Celebes, and Central Celebes.
SitenMC (%)Hot Water Solubility (%)Ethanol-Benzene Solubility
MaxMinMeanS.DevMaxMinMeanS.Dev
West Celebes157.14
(0.65)
13.8408.32010.846 a1.50513.6397.94111.395 a1.687
Central Celebes178.14
(1.23)
12.4848.79810.540 a1.12614.0588.23010.879 ab1.468
South Celebes138.33
(1.42)
13.0956.1449.720 a2.22513.7176.4179.920 b2.116
Total457.8413.8406.14410.4081.65514.0586.41710.7741.806
Notes: n, number of samples. Numbers in parentheses indicate standard deviation. Different superscripted letters in the same column denote significance at α = 0.5.
Table 2. Calibration and validation model for extractive content of ebony wood.
PreprocessingLVCalibrationValidationRPD
NR2calRMSECNR2valRMSEP
Hot water-soluble extractive
Raw spectra7900.6841.003420.5980.7883.627
Ethanol-benzene soluble extractive
2ndDvt21pts, MSC2900.6091.109450.7040.9733.569
LV, latent variables; R2cal coefficient of determination of calibration; RMSEC, root mean square error calibration; R2val coefficient of determination of prediction; RMSEP, root mean square error prediction; RPD, ratio prediction to deviation.
Publisher’s Note: MDPI stays neutral with regard to jurisdictional claims in published maps and institutional affiliations.

