
Major Forest Changes in Subtropical China since the Last Ice Age

 , ,
, ,  and
and 
Abstract
:1. Introduction
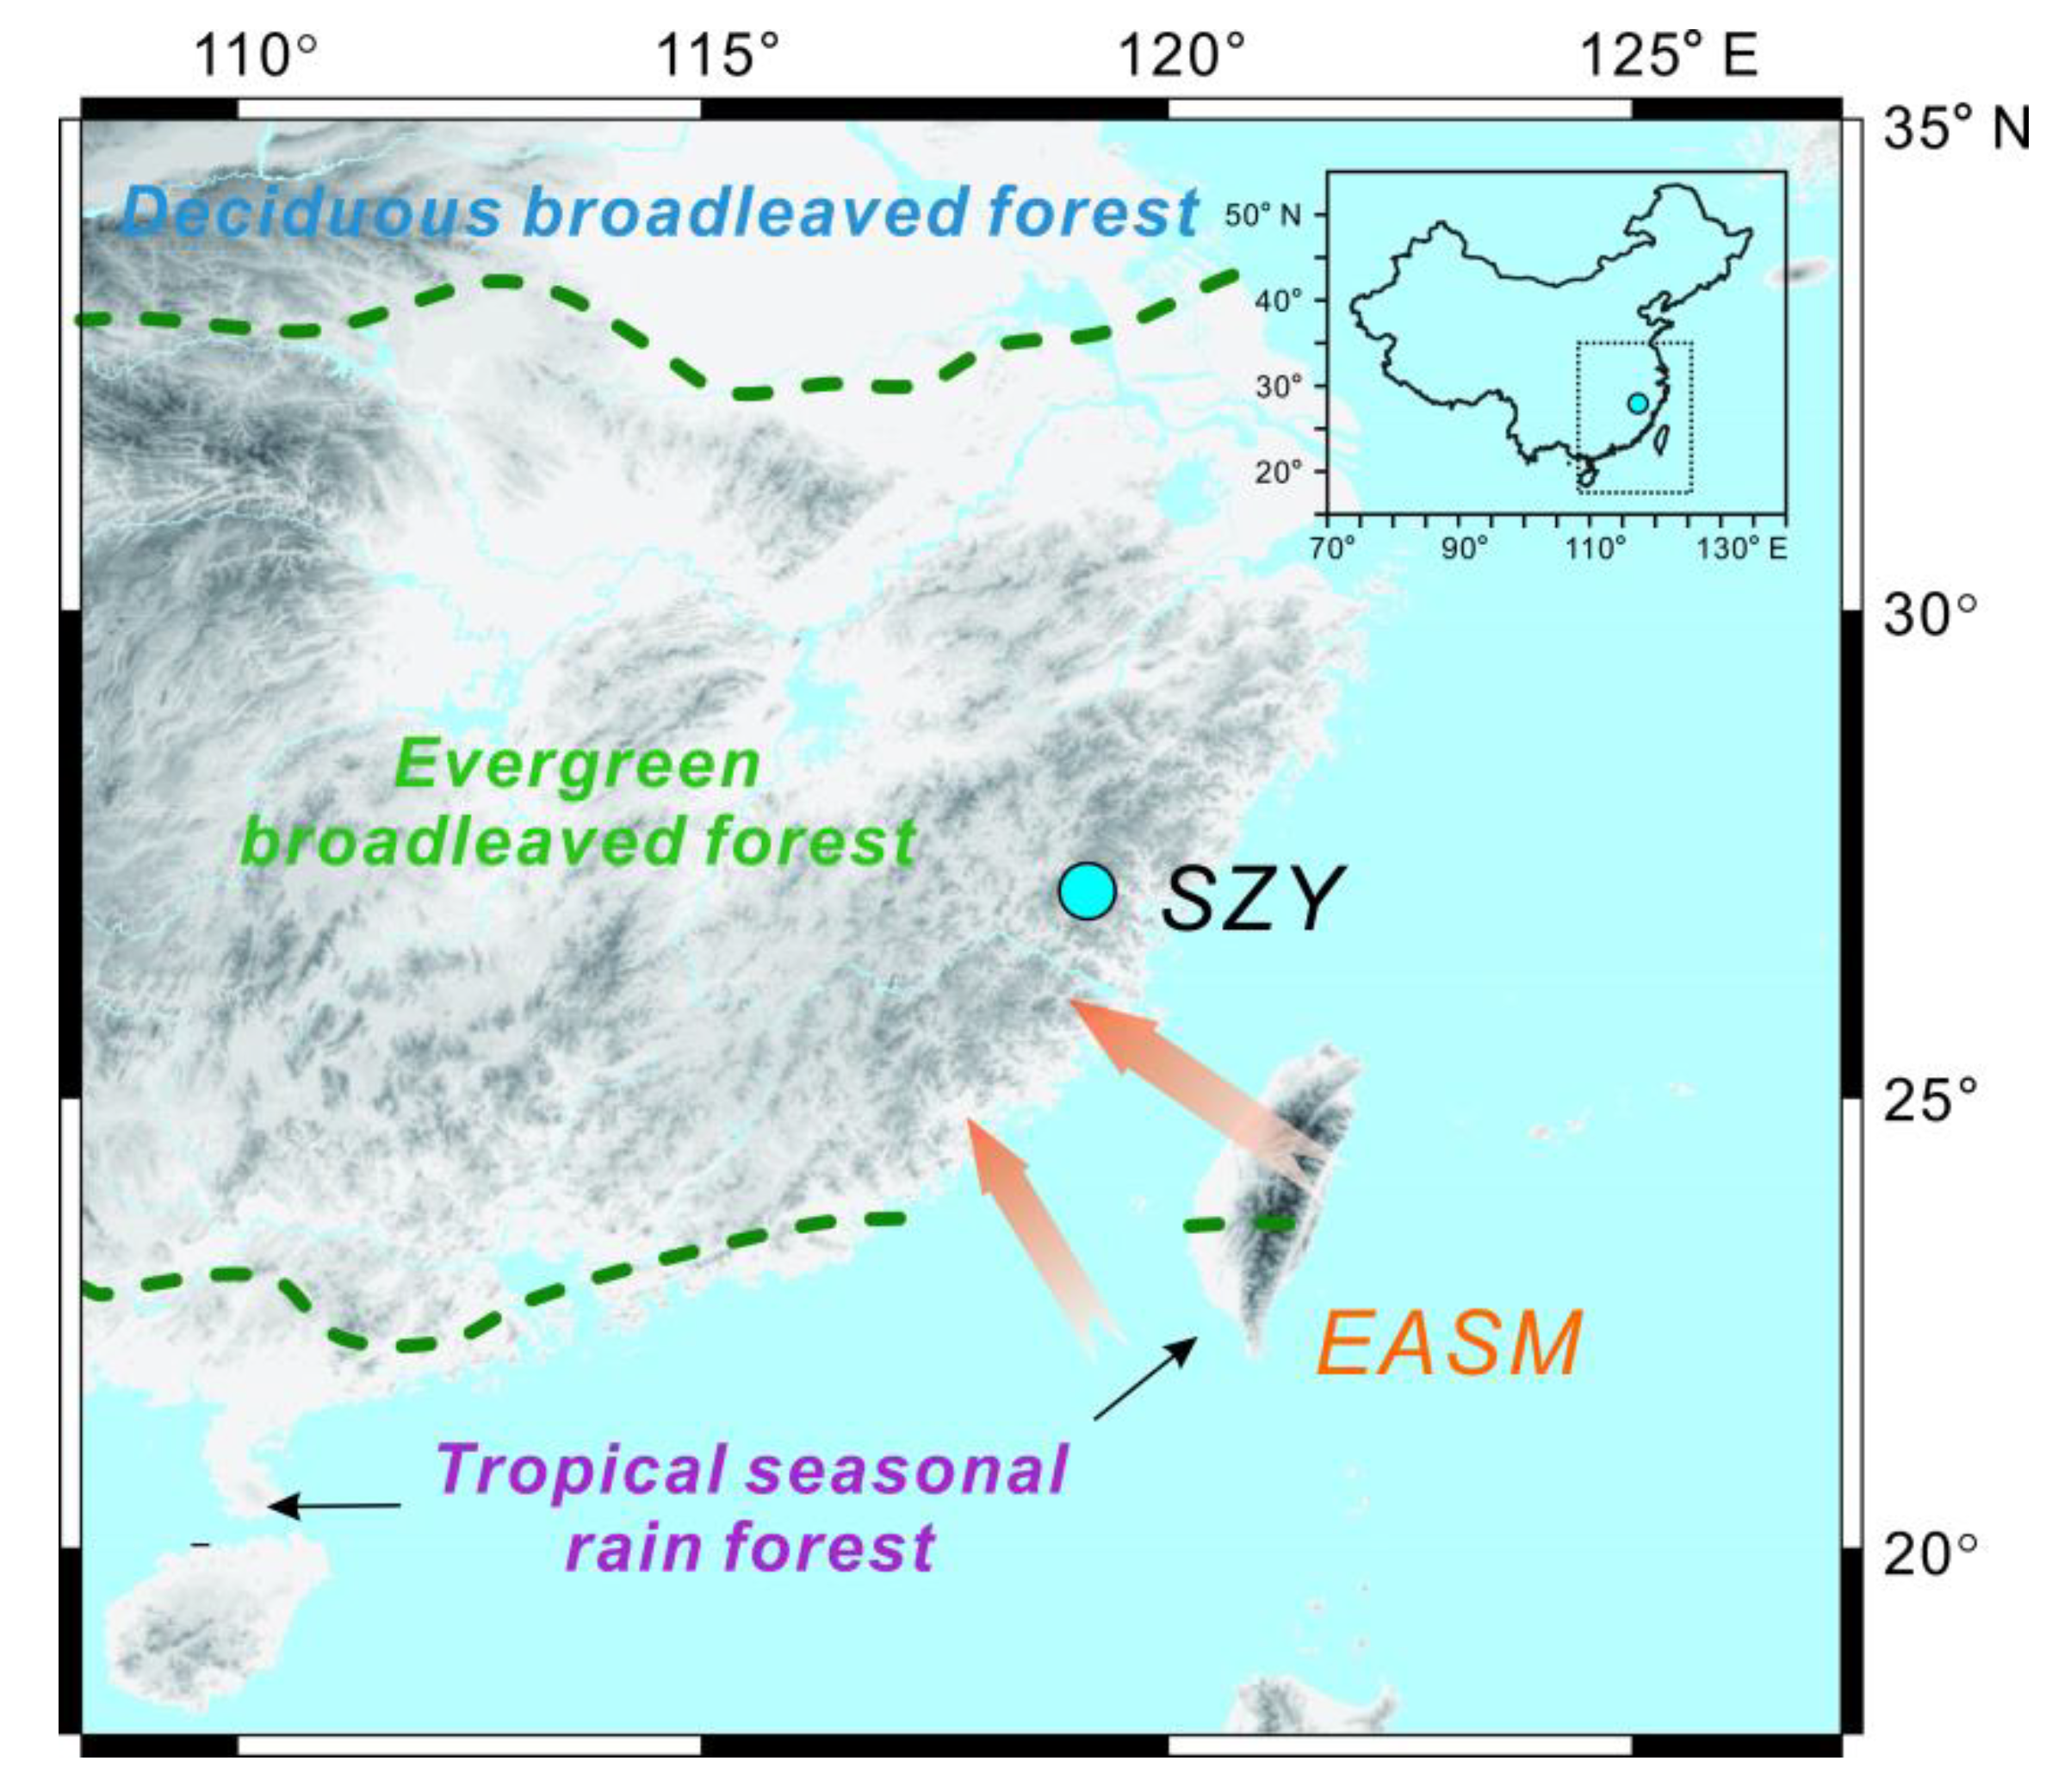
2. Regional Setting
3. Materials and Methods
3.1. Coring, Sampling and Chronology
3.2. Pollen Analysis
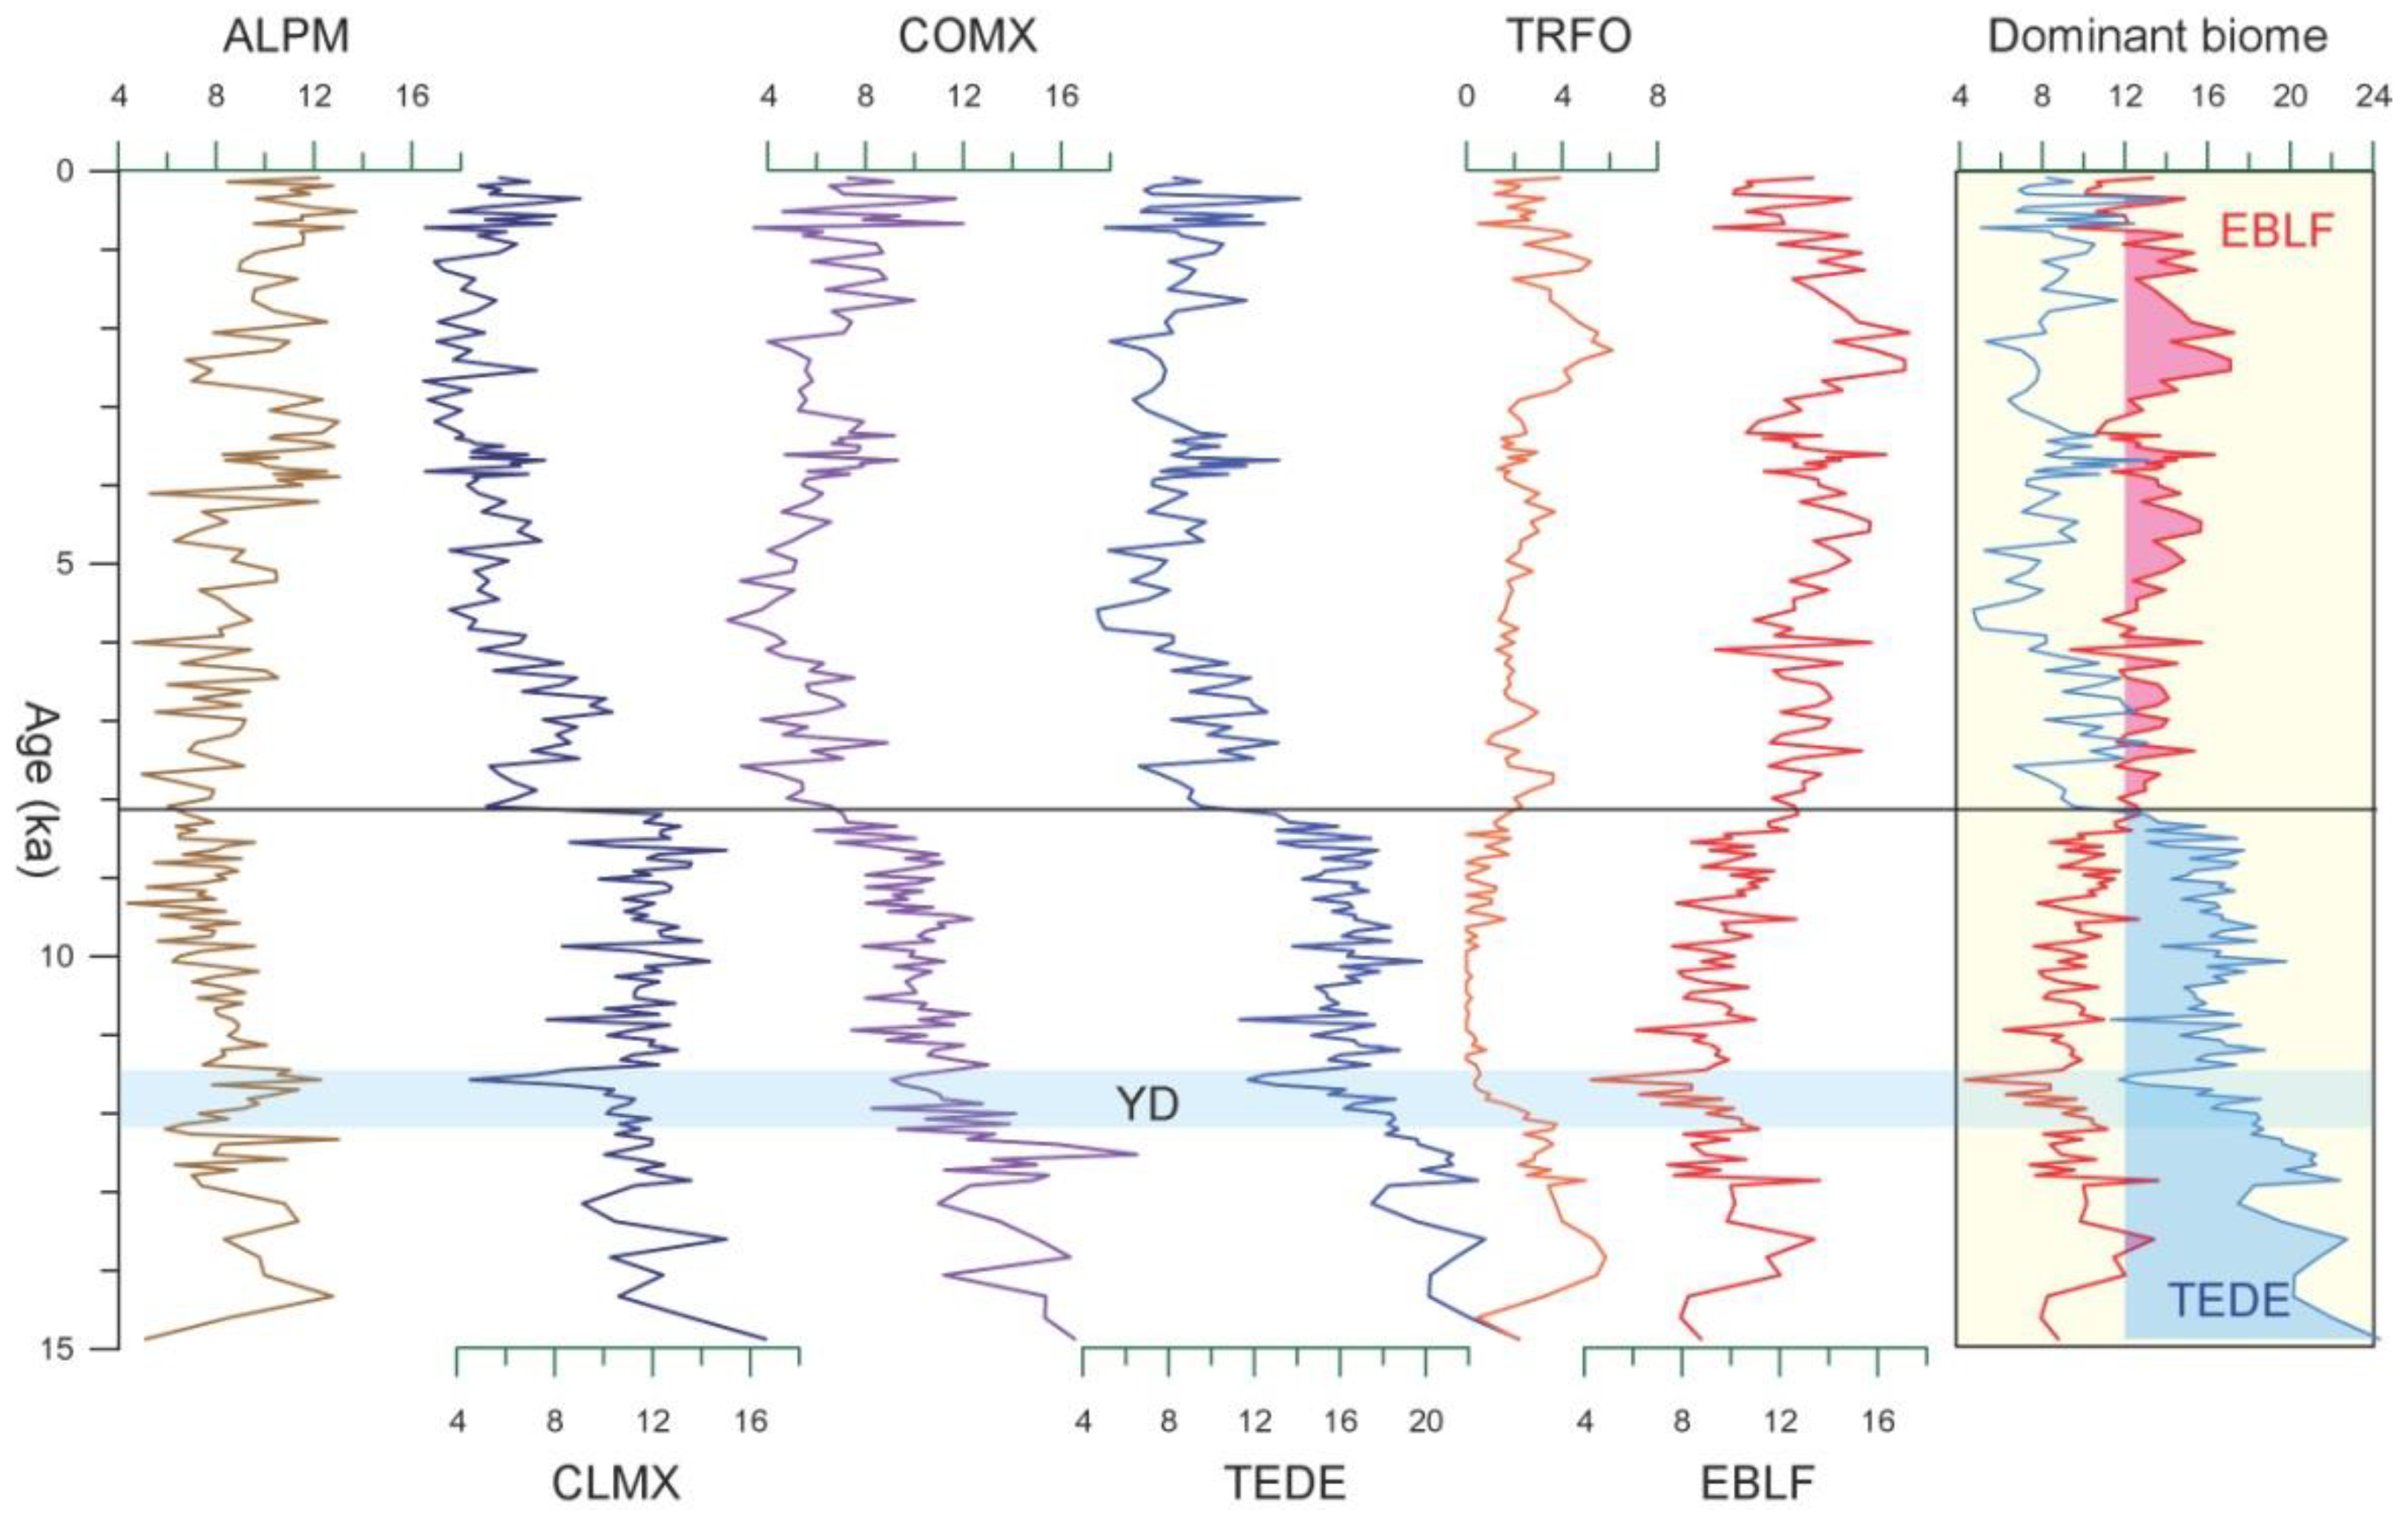
3.3. Biomization
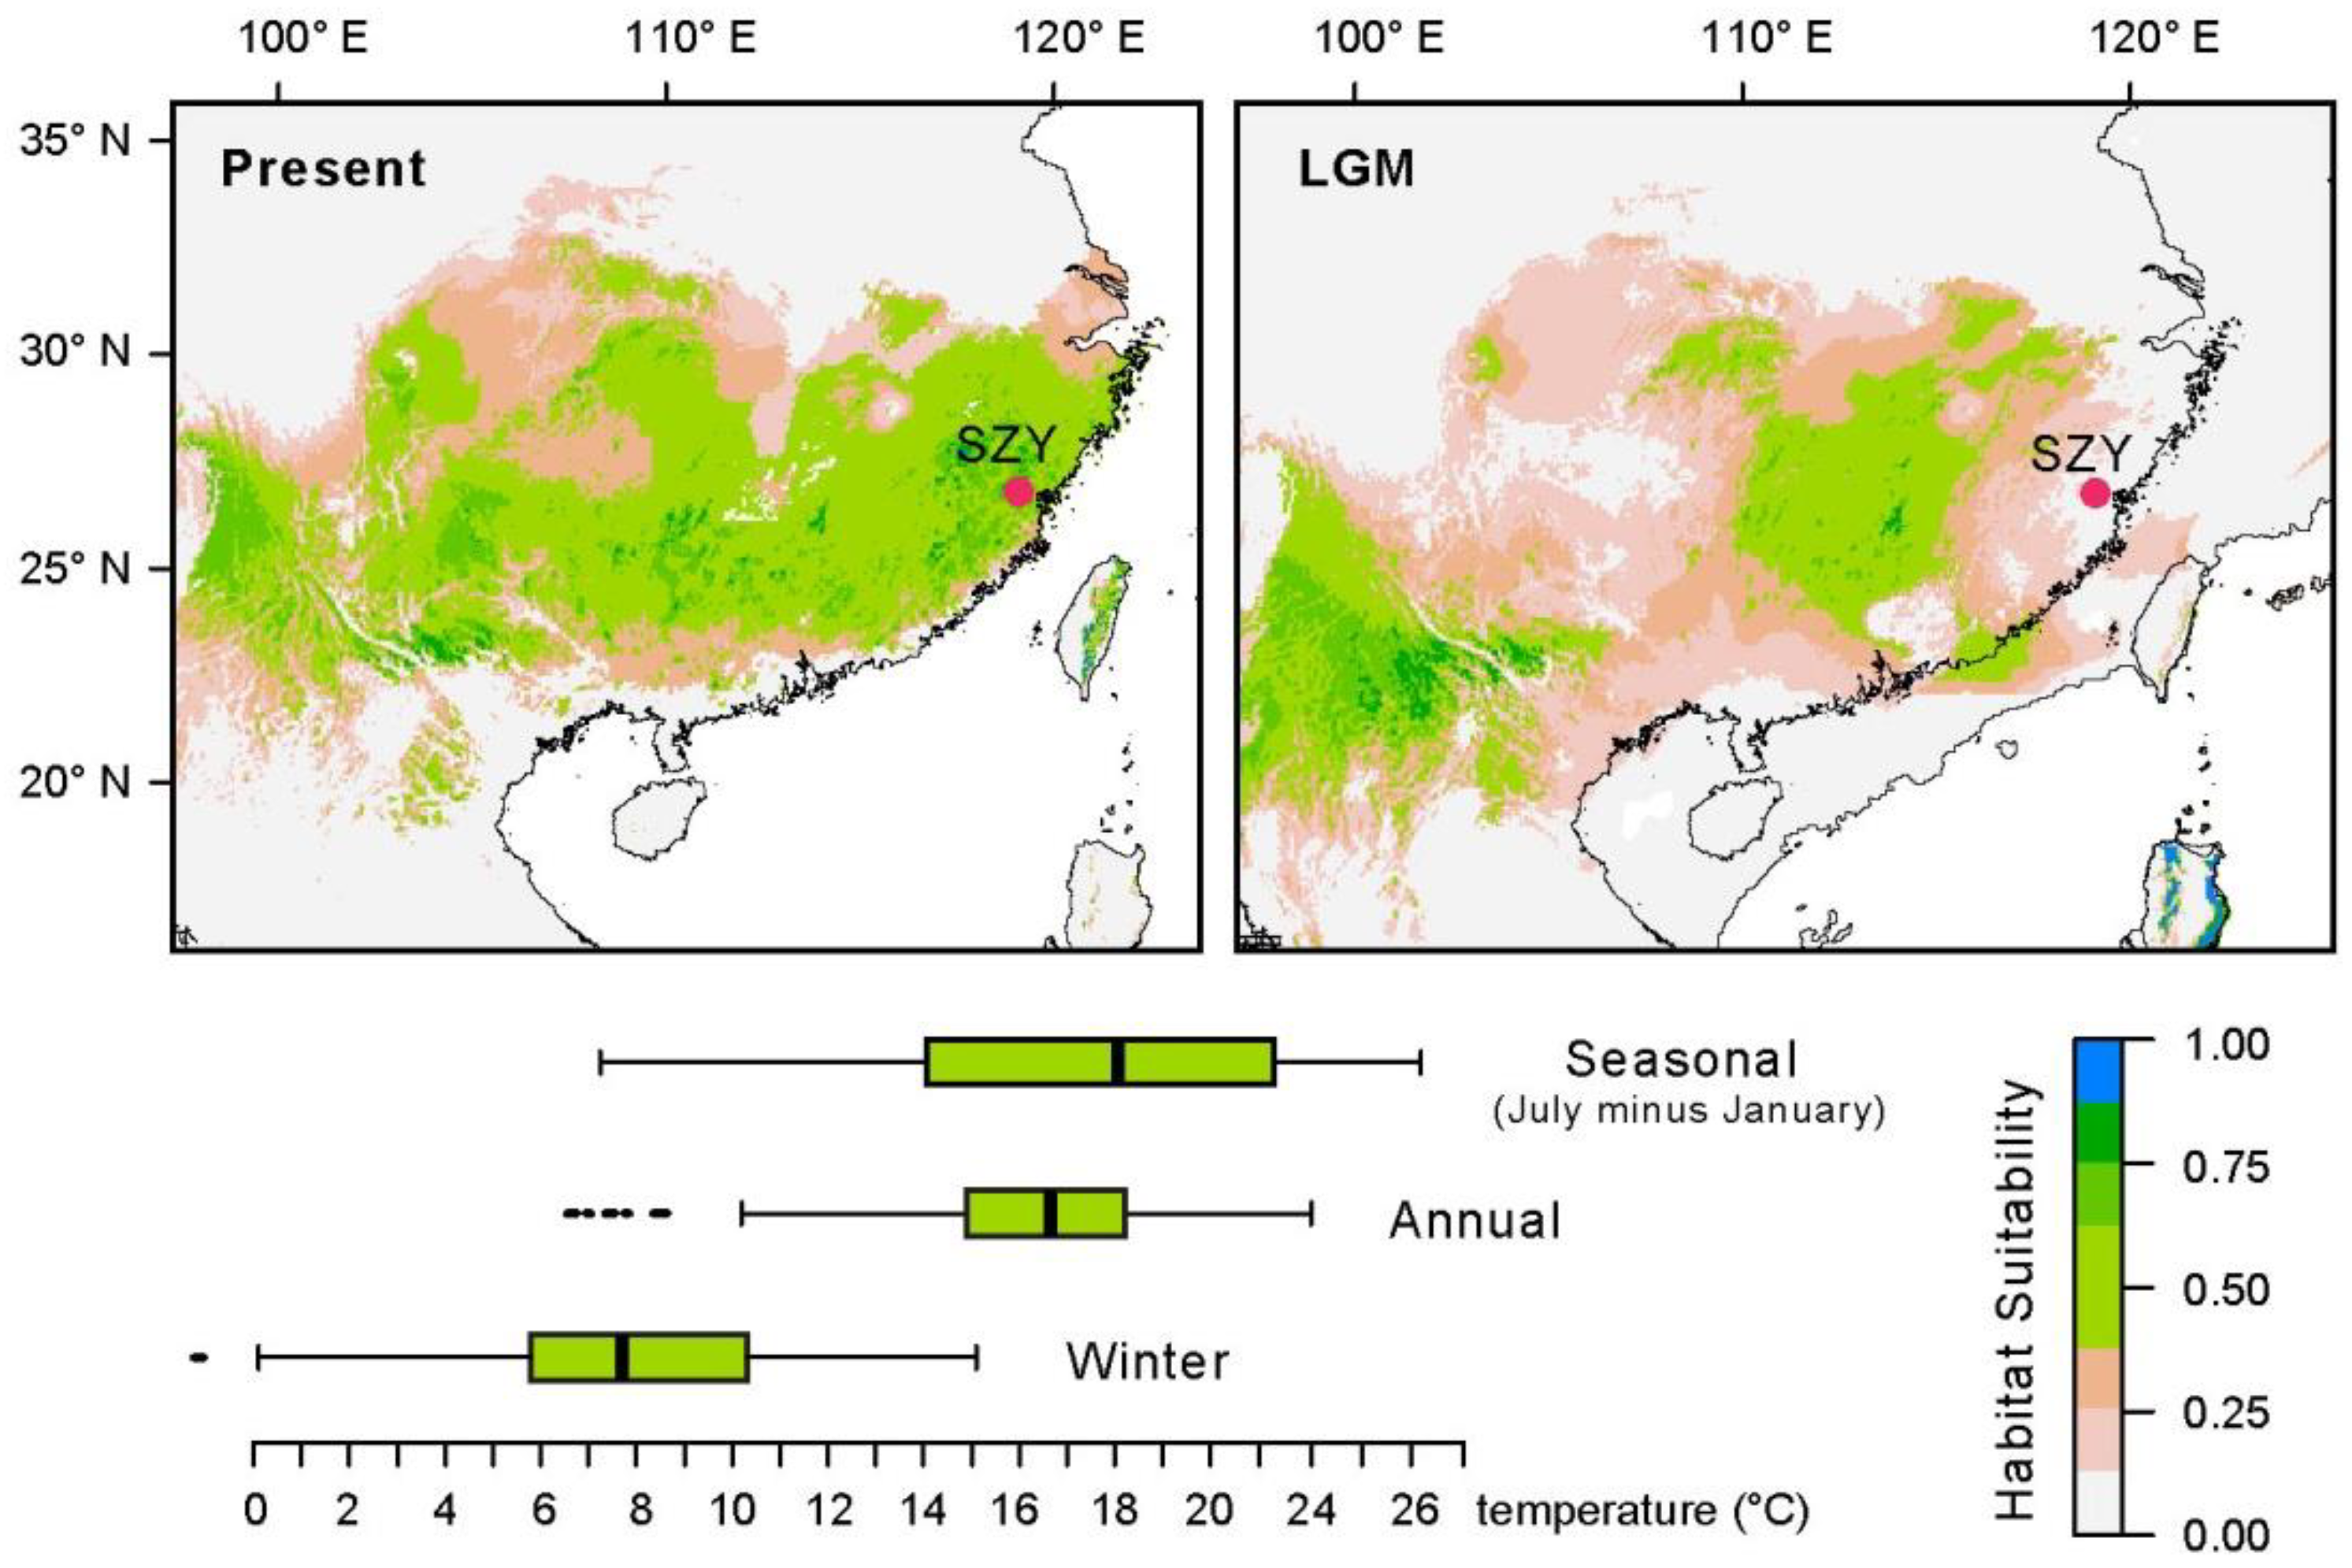
3.4. Species Distribution Modelling
3.5. Transient Data Analysis
4. Results
5. Discussion
5.1. Substantial Forest Transformation during the Holocene
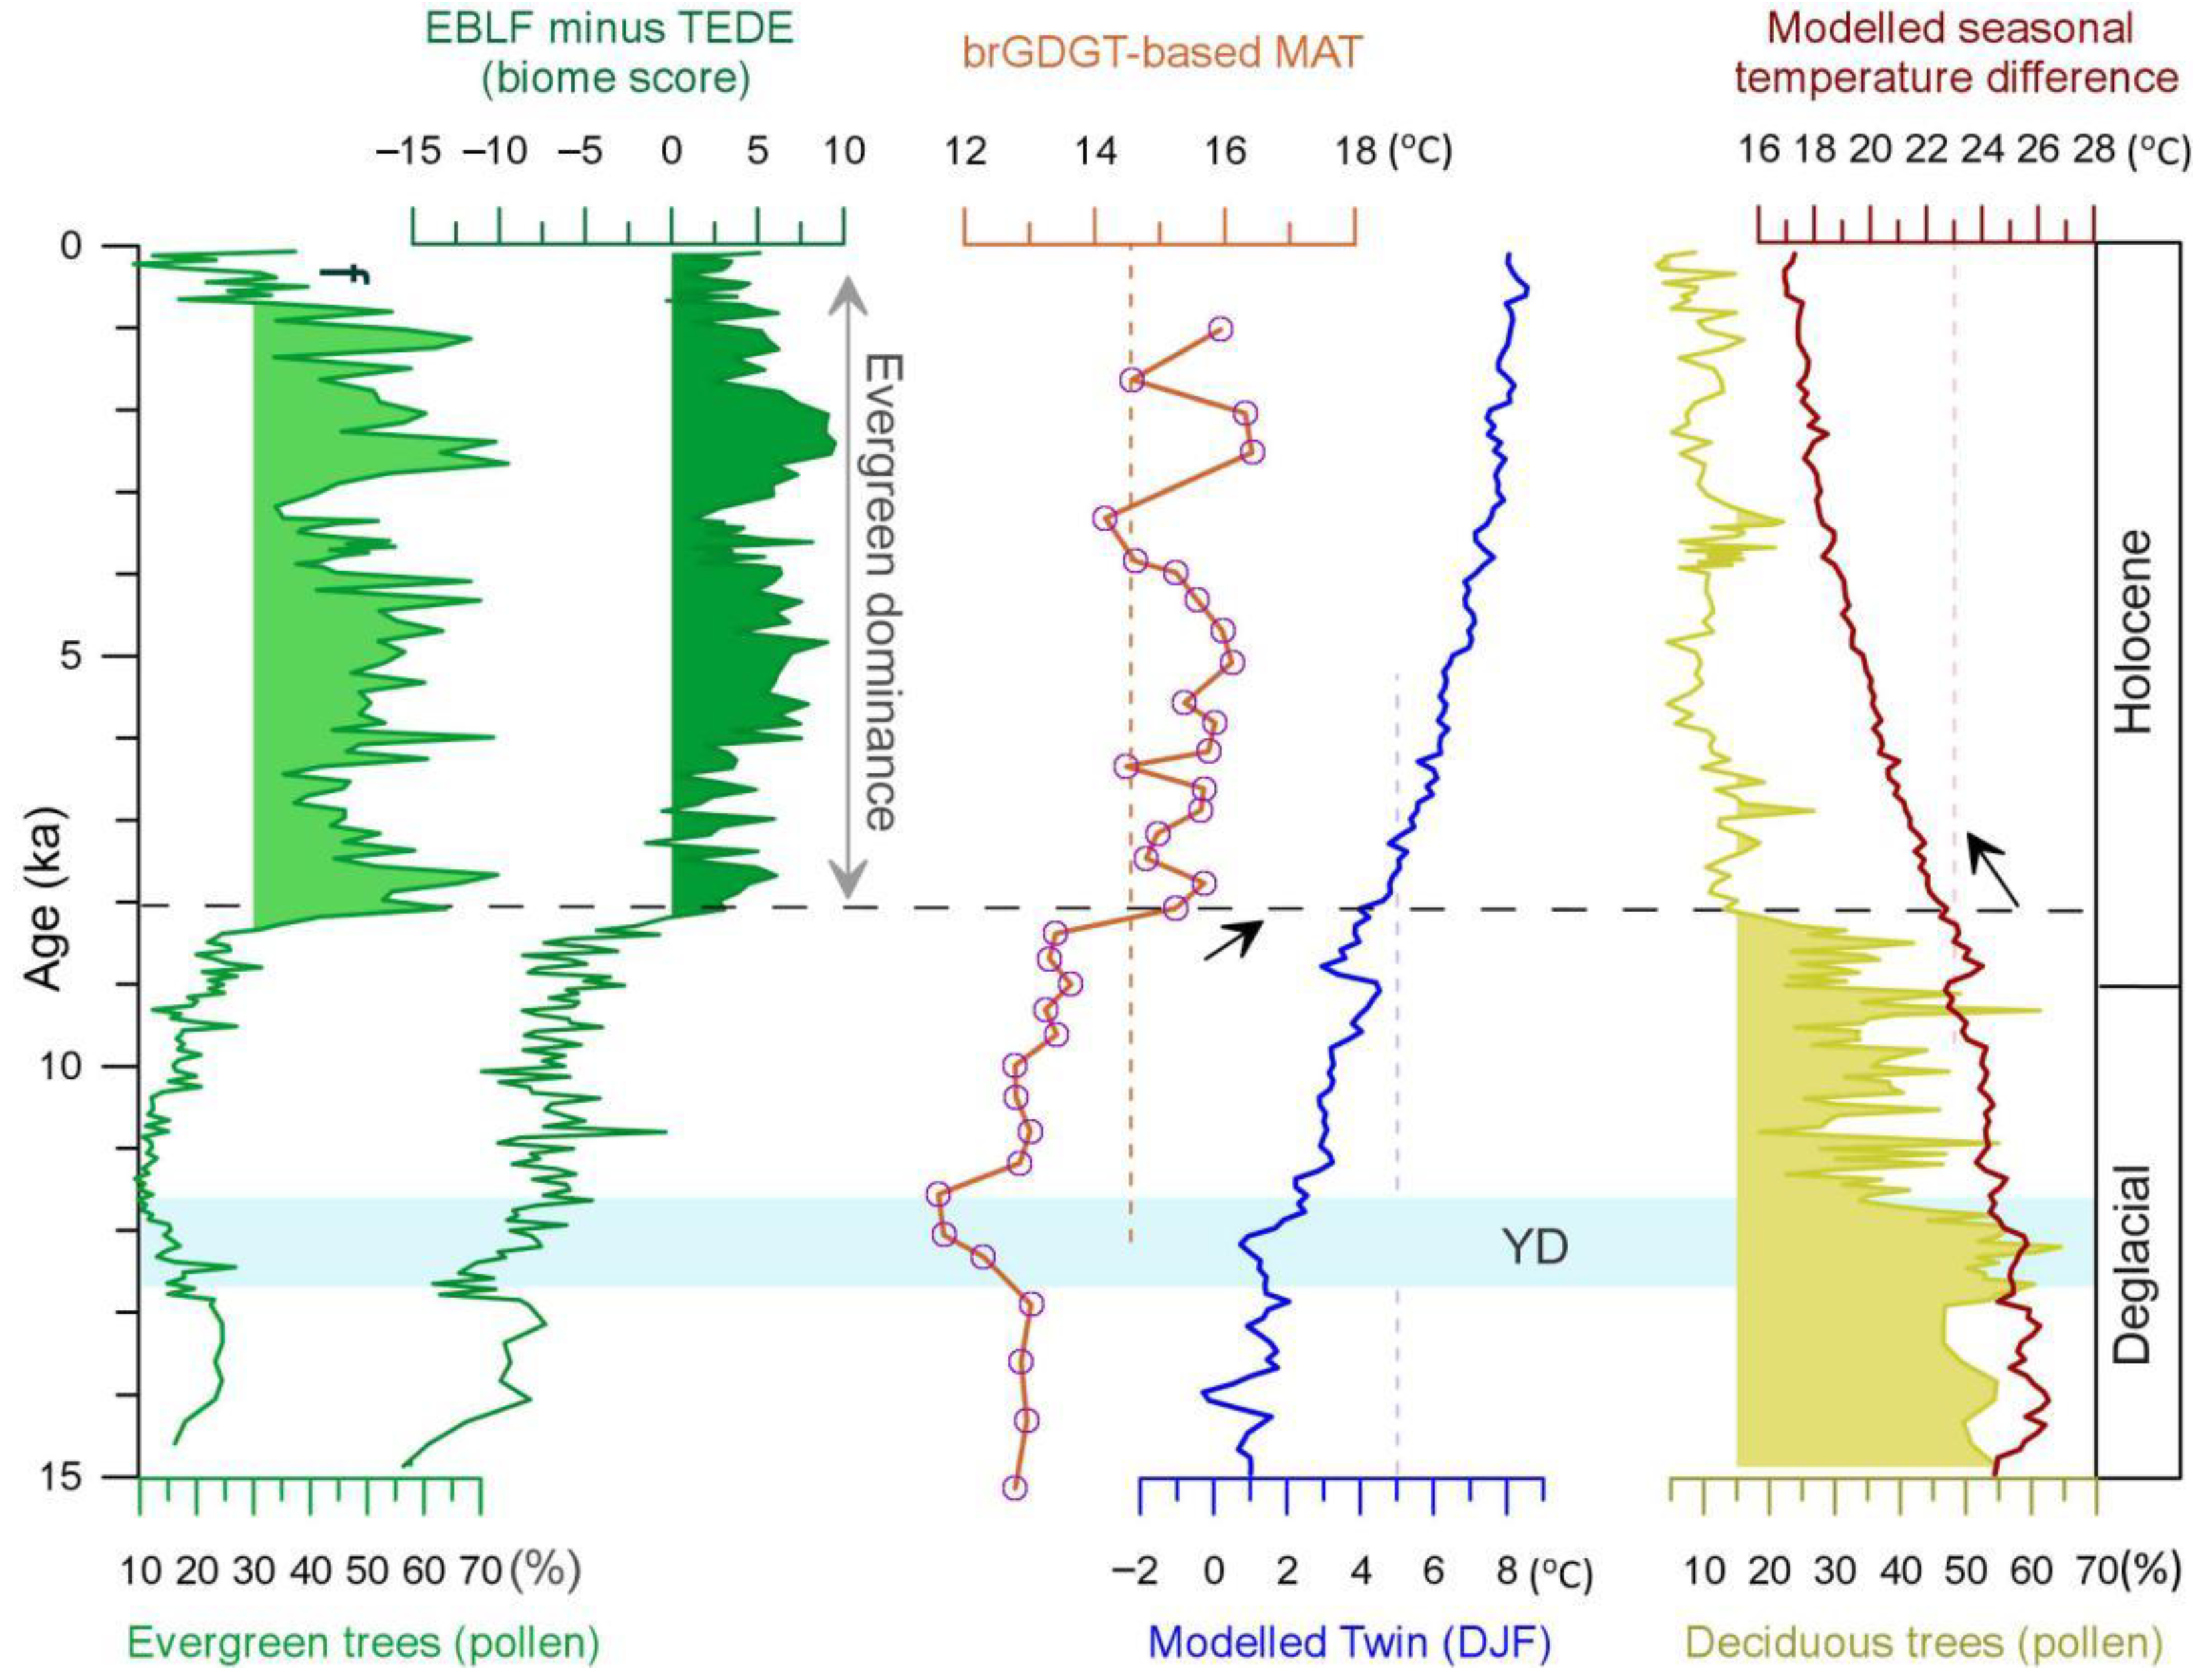
5.2. Holocene Climatic Changes as a Cause of Subtropical Forest Transformation
6. Conclusions
Supplementary Materials
Author Contributions
Funding
Data Availability Statement
Conflicts of Interest
References
- Song, Y.-C.; Chen, X.-Y.; Wang, X.-H. Studies on evergreen broad-leaved forests of china: A retrospect and prospect. J. East China Norm. Univ. 2005, 1, 1–8. [Google Scholar]
- Wu, Z.Y. Vegetation of China; Science Press: Beijing, China, 1980. [Google Scholar]
- Fang, J.Y.; Wang, Z.H.; Tang, Z.Y. Atlas of Woody Plants in China: Distribution and Climate; Higher Education Press: Beijing, China, 2011. [Google Scholar]
- Lee, C.-Y.; Liew, P.-M. Late quaternary vegetation and climate changes inferred from a pollen record of Dongyuan Lake in southern Taiwan. Palaeogeogr. Palaeoclimatol. Palaeoecol. 2010, 287, 58–66. [Google Scholar] [CrossRef]
- Yue, Y.; Zheng, Z.; Huang, K.; Chevalier, M.; Chase, B.M.; Carré, M.; Ledru, M.-P.; Cheddadi, R. A continuous record of vegetation and climate change over the past 50,000 years in the Fujian province of eastern subtropical China. Palaeogeogr. Palaeoclimatol. Palaeoecol. 2012, 365, 115–123. [Google Scholar] [CrossRef]
- Ni, J.; Yu, G.; Harrison, S.P.; Prentice, I.C. Palaeovegetation in China during the late quaternary: Biome reconstructions based on a global scheme of plant functional types. Palaeogeogr. Palaeoclimatol. Palaeoecol. 2010, 289, 44–61. [Google Scholar] [CrossRef] [Green Version]
- Yu, G.; Chen, X.; Ni, J.; Cheddadi, R.; Guiot, J.; Han, H.; Harrison, S.P.; Huang, C.; Ke, M.; Kong, Z.; et al. Palaeovegetation of china a pollen data-based synthesis for the mid-holocene and last glacial maximum. J. Biogeogr. 2000, 27, 635–664. [Google Scholar] [CrossRef] [Green Version]
- Zheng, Z.; Yuan, B.; Nicole, P.-M. Paleoenvironments in China during the last glacial maximum and the holocene optimum. Episodes 1998, 21, 152–158. [Google Scholar]
- Ni, J.; Cao, X.; Jeltsch, F.; Herzschuh, U. Biome distribution over the last 22,000yr in China. Palaeogeogr. Palaeoclimatol. Palaeoecol. 2014, 409, 33–47. [Google Scholar] [CrossRef] [Green Version]
- Wang, X.; Yao, Y.-F.; Wortley, A.H.; Qiao, H.-J.; Blackmore, S.; Wang, Y.-F.; Li, C.-S. Vegetation responses to the warming at the younger dryas-holocene transition in the hengduan mountains, southwestern china. Quat. Sci. Rev. 2018, 192, 236–248. [Google Scholar] [CrossRef]
- Zhou, X.; Sun, L.; Zhan, T.; Huang, W.; Zhou, X.; Hao, Q.; Wang, Y.; He, X.; Zhao, C.; Zhang, J.; et al. Time-transgressive onset of the Holocene Optimum in the East Asian monsoon region. Earth Planet. Sci. Lett. 2016, 456, 39–46. [Google Scholar] [CrossRef] [Green Version]
- Liu, Z.; Zhu, J.; Rosenthal, Y.; Zhang, X.; Otto-Bliesner, B.L.; Timmermann, A.; Smith, R.S.; Lohmann, G.; Zheng, W.; Elison Timm, O. The holocene temperature conundrum. Proc. Natl. Acad. Sci. USA 2014, 111, E3501–E3505. [Google Scholar] [CrossRef] [Green Version]
- Cheng, Y.; Liu, H.; Wang, H.; Hao, Q. Differentiated climate-driven Holocene biome migration in western and eastern China as mediated by topography. Earth-Sci. Rev. 2018, 182, 174–185. [Google Scholar] [CrossRef]
- Faegri, K.; Iversen, J. Textbook of Pollen Analysis; Wiley: New York, NY, USA, 1989. [Google Scholar]
- Nakagawa, T. A trial of density pollen fractionation from sediment core samples for the purpose of pollen ams dating: Evaluation and perspectives. Summ. Res. Using AMS Nagoya Univ. 1998, 9, 244–252. [Google Scholar]
- Phillips, S.J.; Anderson, R.P.; Schapire, R.E. Maximum entropy modeling of species geographic distributions. Ecol. Model. 2006, 190, 231–259. [Google Scholar] [CrossRef] [Green Version]
- Hijmans, R.J.; Cameron, S.E.; Parra, J.L.; Jones, P.G.; Jarvis, A. Very high resolution interpolated climate surfaces for global land areas. Int. J. Climatol. 2005, 25, 1965–1978. [Google Scholar] [CrossRef]
- Liu, Z.; Otto-Bliesner, B.L.; He, F.; Brady, E.C.; Tomas, R.; Clark, P.U.; Carlson, A.E.; Lynch-Stieglitz, J.; Curry, W.; Brook, E.; et al. Transient simulation of last deglaciation with a new mechanism for bolling-allerod warming. Science 2009, 325, 310–314. [Google Scholar] [CrossRef] [PubMed] [Green Version]
- Zheng, Z.; Deng, Y.; Zhang, H.; Yu, R.; Chen, Z. Holocene environmental changes in the tropical and subtropical areas of the south china and the relation to human activities. Quat. Sci. 2004, 24, 387–393. [Google Scholar]
- Sugita, S. Pollen representation of vegetation in quaternary sediments: Theory and method in patchy vegetation. J. Ecol. 1994, 82, 881–897. [Google Scholar] [CrossRef]
- Fan, D.; Hu, W.; Li, B.; Morris, A.B.; Zheng, M.; Soltis, D.E.; Soltis, P.S.; Zhang, Z. Idiosyncratic responses of evergreen broad-leaved forest constituents in china to the late quaternary climate changes. Sci. Rep. 2016, 6, 31044. [Google Scholar] [CrossRef] [Green Version]
- Loomis, S.E.; Russell, J.M.; Verschuren, D.; Morrill, C.; Cort, G.D.; Damsté, J.S.S.; Olago, D.; Eggermont, H.; Street-Perrot, F.A.; Kelly, M.A. The tropical lapse rate steepened during the last glacial maximum. Sci. Adv. 2017, 3, e1600815. [Google Scholar] [CrossRef] [Green Version]
- Wan, Q.; Zheng, Z.; Huang, K.; Guichoux, E.; Petit, R.J. Genetic divergence within the monotypic tree genus platycarya (juglandaceae) and its implications for species’ past dynamics in subtropical china. Tree Genet. Genomes 2017, 13, 73. [Google Scholar] [CrossRef]
- Fang, J.; Yoda, K. Climate and vegetation in china v. Effect of climatic factors on the upper limit of distribution of evergreen broadleaf forest. Ecol. Res. 1991, 6, 113–125. [Google Scholar] [CrossRef]
- Song, Y. Perspective of the vegetation zonation of forest region in eastern China. Acta Bot. Sin. 1999, 41, 541–552. [Google Scholar]
- Wang, Y.J.; Cheng, H.; Edwards, R.L.; An, Z.S.; Wu, J.Y.; Shen, C.-C.; Dorale, J.A. A high-resolution absolute-dated late pleistocene monsoon record from hulu cave, china. Science 2001, 294, 2345–2348. [Google Scholar] [CrossRef] [PubMed] [Green Version]
- Cheng, J.; Wu, H.; Liu, Z.; Gu, P.; Wang, J.; Zhao, C.; Li, Q.; Chen, H.; Lu, H.; Hu, H.; et al. Vegetation feedback causes delayed ecosystem response to east asian summer monsoon rainfall during the holocene. Nat. Commun. 2021, 12, 1843. [Google Scholar] [CrossRef]
- Wang, M.; Zheng, Z.; Man, M.; Hu, J.; Gao, Q. Branched gdgt-based paleotemperature reconstruction of the last 30,000 years in humid monsoon region of southeast china. Chem. Geol. 2017, 463, 94–102. [Google Scholar] [CrossRef]
- Wang, L.; Li, J.; Lu, H.; Gu, Z.; Rioual, P.; Hao, Q.; Mackay, A.W.; Jiang, W.; Cai, B.; Xu, B.; et al. The east asian winter monsoon over the last 15,000 years: Its links to high-latitudes and tropical climate systems and complex correlation to the summer monsoon. Quat. Sci. Rev. 2012, 32, 131–142. [Google Scholar] [CrossRef]
- DiNezio, P.N.; Tierney, J.E. The effect of sea level on glacial indo-pacific climate. Nat. Geosci. 2013, 6, 485–491. [Google Scholar] [CrossRef]
- Loarie, S.R.; Duffy, P.B.; Hamilton, H.; Asner, G.P.; Field, C.B.; Ackerly, D.D. The velocity of climate change. Nature 2009, 462, 1052–1055. [Google Scholar] [CrossRef] [PubMed]
- Lenoir, J.; Gégout, J.C.; Marquet, P.A.; Ruffray, P.D.; Brisse, H. A significant upward shift in plant species optimum elevation during the 20th century. Sci. Adv. 2008, 320, 1768–1771. [Google Scholar] [CrossRef]
- Bertrand, R.; Lenoir, J.; Piedallu, C.; Riofrio-Dillon, G.; de Ruffray, P.; Vidal, C.; Pierrat, J.C.; Gegout, J.C. Changes in plant community composition lag behind climate warming in lowland forests. Nature 2011, 479, 517–520. [Google Scholar] [CrossRef] [PubMed]
- International Union for Conservation of Nature. The IUCN Red List of Threatened Species; Version 2021-1. 2021. Available online: https://www.iucnredlist.org (accessed on 24 August 2021).

Publisher’s Note: MDPI stays neutral with regard to jurisdictional claims in published maps and institutional affiliations. |
© 2021 by the authors. Licensee MDPI, Basel, Switzerland. This article is an open access article distributed under the terms and conditions of the Creative Commons Attribution (CC BY) license (https://creativecommons.org/licenses/by/4.0/).
Share and Cite
Wan, Q.; Zhang, X.; Zhang, Y.; Yue, Y.; Huang, K.; Cheddadi, R.; Zheng, Z. Major Forest Changes in Subtropical China since the Last Ice Age. Forests 2021, 12, 1314. https://doi.org/10.3390/f12101314
Wan Q, Zhang X, Zhang Y, Yue Y, Huang K, Cheddadi R, Zheng Z. Major Forest Changes in Subtropical China since the Last Ice Age. Forests. 2021; 12(10):1314. https://doi.org/10.3390/f12101314
Chicago/Turabian StyleWan, Qiuchi, Xiao Zhang, Yaze Zhang, Yuanfu Yue, Kangyou Huang, Rachid Cheddadi, and Zhuo Zheng. 2021. "Major Forest Changes in Subtropical China since the Last Ice Age" Forests 12, no. 10: 1314. https://doi.org/10.3390/f12101314
APA StyleWan, Q., Zhang, X., Zhang, Y., Yue, Y., Huang, K., Cheddadi, R., & Zheng, Z. (2021). Major Forest Changes in Subtropical China since the Last Ice Age. Forests, 12(10), 1314. https://doi.org/10.3390/f12101314