Abstract
Current climate change constitutes a challenge for the survival of several drought-sensitive forests. The study of the genetic basis of adaptation offers a suitable way to understand how tree species may respond to future climatic conditions, as well as to design suitable conservation and management strategies. Here, we focus on selected genetic signatures of the drought-sensitive relict fir, Abies pinsapo Boiss. Field sampling of 156 individuals was performed in two elevation ecotones, characterized by widespread A. pinsapo decline and mortality. The DNA from dead trees was investigated and compared to living individuals, accounting for different ages and elevations. We studied the genes gated outwardly-rectifying K+ (GORK) channel and Plasma membrane Intrinsic Protein (PIP1) aquaporin, previously related to drought response in plant model species, to test whether drought was the main abiotic factor driving the decline of A. pinsapo forests. A combination of linear regression and factor models were used to test these selection signatures, as well as a fixation index (Fst), used here to analyze the genetic structure. The results were consistent among these approaches, supporting a statistically significant association of the GORK gene with survival in one of the A. pinsapo populations. These results provide preliminary evidence for the potential role of the GORK gene in the resilience to drought of A. pinsapo.
1. Introduction
Changes in the environment occur so fast that species’ adaptive capacities may be overcome [1,2,3]. The pace of observed climate warming, particularly in relict tree species, implies that environmental conditions are changing faster than plant populations can adapt, acclimate or migrate [3]. This issue is expected to destabilize ecosystems by decreasing productivity, while increasing mortality and susceptibility to insect attacks and diseases [1,2,3]. As several tree species have limited migration chances, understanding their adaptive potential would provide insight on their future perspectives under a changing climate [4]. Tree species are long-life organisms with slow evolutionary rates [3,5]. In particular, conifers have shown a slower evolutionary rate compared to angiosperms [6,7]. However, they maintain high levels of genetic diversity and may display fast local adaptation [5]. Thus, the examination of the selection of the adaptive genetic variations will help understand the adaptive potential and the fates of endangered tree species [8]. Furthermore, these insights might guide the design of suitable conservation and management policies, for instance, via assisted genetic migration or genotype selection [8]. In this sense, landscape genomics and genome-wide association studies are attempting to identify genetic variants that correlate with environmental factors [9,10,11] and/or sound phenotypic traits [12].
Climate relicts are usually restricted to small and isolated areas with benign but suboptimal environmental conditions [13,14]. Although most relict species have suffered significant genetic bottlenecks throughout their evolutionary history, and a related decrease in their genetic diversity, they often do not have lower fitness compared their non-relict counterparts [15,16]. Hence, it has been hypothesized that they might retain genetic variants for some ecologically relevant traits [17]. Thus, relict tree species may be ideal models to investigate evolutionary responses to rapid climate change [18]. Abies pinsapo Boiss., is a relict, endangered, and drought-sensitive conifer that biogeographically represents the southernmost European fir [13,19]. Previous studies pointed to long-term drought stress as the main factor regarding A. pinsapo population decline [20]. Furthermore, altitudinal range shifts have been recently observed, mainly at the lower elevation ecotones, suggesting worse drought effects on growth and mortality [21]. Selective mortality might rely on differences in drought sensitivity, offering a suitable framework to investigate its genetic basis [4,22].
The large size of conifer genomes and the small number of reference genomes available may limit the finding of significantly correlated genetic differences [23], causing them to be understudied at the genomic level, despite their worldwide ecological and economic significance [7]. Specifically, the genome of just one fir species has been sequenced, Silver fir (Abies alba Mill.) [24]. A way to cope, at least partially, with this shortcoming might be to investigate genes that have been previously related to climate adaptations [4,25,26,27]. Thus, it is possible to focus on genes whose alleles may control a portion of the adaptive phenotypic variation [23,25]. Although this approach limits the ability to identify additional loci, it ensures that potentially adaptive genes are gauged [28].
Here, we used a candidate gene approach to provide preliminary insights on the adaptive genetic diversity to drought of A. pinsapo. Thus, we investigated SNPs from candidate genes related to drought tolerance, validated in other model plant species: the outward potassium channel GORK and PIP1 aquaporin [29], previously assembled and validated from the transcriptome of A. pinsapo [30]. To this end, 156 individuals from two A. pinsapo populations were sampled and analyzed.
Although the A. pinsapo neutral genetic diversity was previously studied [19,31,32,33], this is the first study that investigates its adaptive genetic diversity. This is relevant and timely, since conservation actions are generally based on adaptive genetic variation, which often did not match a neutral molecular variation. Furthermore, considering adaptive genetic variation might reduce species’ range loss projections under a climate change scenario [34].
GORK potassium channels participate in stomatal closure and are sensitive to the phytohormone abscisic acid (ABA) [35]. Isohydric conifers, such as A. pinsapo, close stomata to maintain water potential [36], using increasing ABA concentrations as a signal [28]. Thus, genes involved in stomata closure regulated by ABA, such as the GORK gene [37], are expected to play a key role in A. pinsapo drought response. In fact, ABA pathway-related genes are well represented during the early drought response in conifers [24,38,39,40,41,42]. Aside from these, the PIP1 gene belongs to the aquaporin family [43,44,45]. Aquaporins are important in regulating water transport in many plants’ physiological and developmental processes, including stomatal regulation and stress responses [46,47]. In conifers, aquaporins were found to be upregulated during drought stress in Pinus taeda L. [41] and A. alba [38]. Furthermore, a QTL study in Pinus pinaster Aiton found genes related to stomatal regulation, ABA signaling, and aquaporins as drought tolerance candidate genes [48].
Since climate-change-induced mortality is a relatively recent process, we hypothesized that climate-change-related selection signatures on these candidate genes (GORK and PIP1) should vary among age cohorts [21]. Thus, an association between genetic variants and age cohorts is expected. Secondly, given that the drought stress increases at the lower elevation ecotone [20,21], further selective pressure is expected in this altitudinal belt. Consequently, we also expect a gene–elevation association. Hence, we hypothesized that these genes play a role in A. pinsapo drought resistance, while an association between genetic variants and contrasting mortality, especially at the lower elevation ecotone, should be expected.
2. Materials and Methods
2.1. Sampling Design and Plant Material
Two populations from Sierra de las Nieves National Park, Cañada del Saucillo (S, thereafter) (Latitude: 36°42′43″–36°43′33″ N, longitude: 4°57′55″–4°59′16″ W) and Cañada del Caucon (C, thereafter) (Latitude: 36°42′15″–36°42′45″ N, longitude: 4°57′50″–4°58′5″ W), were analyzed, as this mountain range hosted the wider A. pinsapo forest surface (Figure 1). We focused on the lower elevation ecotone, where widespread symptoms of A. pinsapo declined and mortality was observed [21]. Old individuals (needles) and their closest dead (wood), mature, and juvenile sapling trees (needles) were sampled to investigate a potential selective pressure under a demographic perspective, in particular, related to altitude, age, and survival cohorts. The age of the trees was estimated in a randomly selected subset of 10 trees covering the wide range of diameters sampled for this study. Two radial increment cores were extracted using a Pressler borer, perpendicularly at breast height (1.30 m). Increment cores were mounted on wooden supports and sanded until tree ring boundaries were clearly visible and later measured using a LINTAB measuring table [49] with an accuracy of 0.01 mm. This dataset was pooled with previous dendrochronological data, accounting for about four hundred A. pinsapo trees sampled from these populations, to obtain a regression between the diameter and the age of the trees.
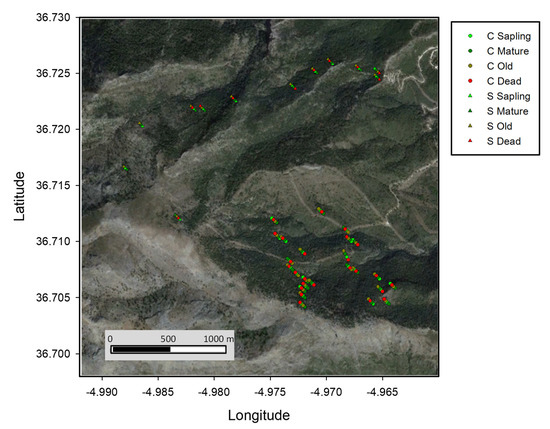
Figure 1.
Sampling location of the Abies pinsapo individuals analyzed in this study. Age/survival individual groups are represented by different colours for Saucillo (S, triangles) and Caucon (C, circles) populations. Background satellite image was obtained from Landsat (July 2018).
Focal old trees were sampled randomly at distance intervals of about 50 m to keep sampled areas to a minimum. Individuals were grouped by elevation belts (meters at sea level, m thereafter) (low, 1110–1249 m; middle, 1249–1349 m; high > 1350 m), age (sapling, 1–39 years old; mature, 40–67 years old; and old, >68 years old) and survival (alive and dead). Dead individuals were sampled at the low elevation belt, where symptoms of decline and mortality were observed, and ranged between 40–67 years old (thus belonging to the mature class).
Although forest decline and mortality were complex processes [21], previous research supported that mortality patterns observed in S and C populations showed a high spatial variability. In particular, the mortality likelihood increased along with the total basal area. These results, together with the observed sizes stand structure (Figure 2), pointed out that observed mortality did not necessarily fit within a standard self-thinning process, based on the differential mortality of smaller size classes or within the older trees group [21]. Here, dead trees were selected based on the observed mortality pattern, among the sizes with the highest mortality frequency (Figure 2). In the S population (Figure 2a), mean ages were 49 ± 7 years in alive trees (n = 12), and 47 ± 6 years in dead trees (n = 10), respectively. In the C population (Figure 2b), mean ages were 65 ± 9 years in alive trees (n = 25), and 64 ± 14 years in dead trees (n = 25), respectively. A total of 121 needle samples (alive individuals) and 35 wood samples (dead individuals) of A. pinsapo were collected and stored at −80 °C before DNA extraction.
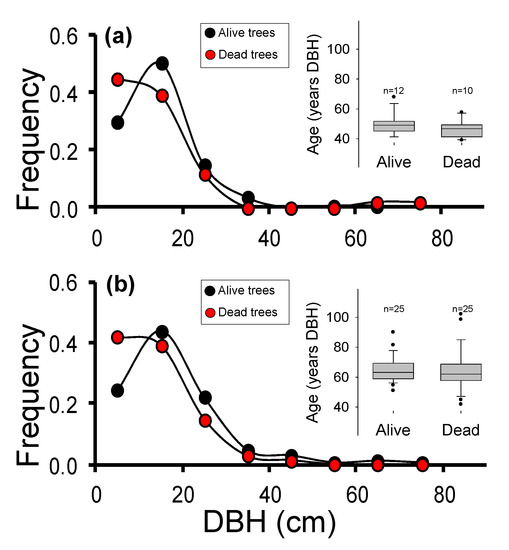
Figure 2.
Frequency of size classes (diameter at breast height, DBH) observed in the live (black) and dead (red) trees in Saucillo population (a) and Caucon population (b). The insets show the age at DBH estimated on sampled live and dead trees, based on previous dendrochronological studies. In S population (a), mean ages were 49 ± 7 years in alive trees (n = 12), and 47 ± 6 years in dead trees (n = 10), respectively. In C population (b), mean ages were 65 ± 9 years in alive trees (n = 25), and 64 ± 14 years in dead trees (n = 25), respectively. In the box-plot figure, error bars represent the 5th/95th percentiles; boxes stand for the standard error; solid lines represent the median, and dots are outliers.
2.2. DNA Extraction
QIAGEN DNeasy plant mini kit was used for the extraction and purification of total genomic DNA from 100 mg of needles per sample, according to the manufacturer’s protocol. DNA from wood samples was extracted from 100 mg of wood powder using the CTAB protocol for ancient DNA extraction from plants [50]. The quality and quantity of DNA were checked using 1% agarose gel and Nanodrop, respectively.
2.3. Candidate Genes Selection and Amplification
The GORK and PIP1 drought-resistance candidate genes [29], previously detected and validated from the A. pinsapo transcriptome [30], were amplified by PCR, using the specifically designed primers from Pérez-González et al. [30]. For needle samples, the PCR for both genes was performed as described in Pérez-González et al. [30]. Thus, the final PCR mix contained 5 μL of DNA AmpliTools Master Mix 2× (Biotools), 1 μL of each primer (5 mM), 1 microlitres of template DNA (30 ng), and 2 μL of autoclaved miliQ purified water, to give a total volume of 10 μL per sample. The thermal cycling consisted of an initial denaturation step at 94 °C for 5 min, 3-step cycling repeated 35 times and consisting of denaturation at 94° for 1 min, annealing at 60° for 1 min in GORK gene and at 62 °C, also for 1 min, in PIP1 gene, extension at 72° for 2 min, and a final extension step at 72° for 5 min. For wood samples, we performed the PCR in a total volume of 25 μL with the proportional quantities of all the reagents, using the same thermal cycling as in needles. All PCR products were visualized in a 1.5% agarose gel electrophoresis to confirm that the target fragments of the expected length were amplified. One SNP for each gene, coincident with restriction enzyme cut sites (Bsu36I for SNPGORK and CspCI for SNPPIP1, New England Biolabs), was proven to be informative for population genetic analysis in A. pinsapo [30]. Thus, both restriction enzymes were used for genotyping, digesting the GORK and PIP1 PCR products according to the manufacturer’s protocol, and visualizing the digestion products in a 1.5% agarose gel electrophoresis. A negative control without DNA was run simultaneously with each PCR to ensure the trustworthiness of the PCR results.
2.4. Detection of Selection Signatures and Genetic Structure Related to Altitude, Age, and Survival
Allelic frequencies for each altitude, age, and survival group were calculated using GeneAlEx [51]. Two approaches were used to test a possible altitude, age, and/or survival-related selection: (i) genotype–phenotype/environment association analyses, combining logistic regression (Poisson regression) in R and factor models (latent factor mixed model LFMM) using lfmm R package (https://cran.r-project.org/web/packages/lfmm/index.html, accessed on 13 February 2020), since using classical regression models alone could lead to a high rate of false positives when there was a genetic structure effect [52]. In both analyses each SNP was associated with each environmental/phenotypic predictor (altitude, age, or survival). In the case of survival, alive individuals were selected among the mature trees in lower altitudes to ensure that they had experienced similar environmental pressures to dead individuals.
LFMM was a hierarchical Bayesian mixed model, which corrected the underlying population structure, which was introduced into the model via the number of expected clusters (K). Previous population genetic work using microsatellite markers found no evidence of genetic structure in both S and C populations [19]. Thus, K was set to one. For each genotype–environment/phenotype correlation, |Z| scores (which were equal to the |log p value|) were computed using 10,000 sweeps and 1000 sweeps for burn-in. The significance was assessed based on the standard Gaussian distribution. Results were confirmed by repeating the analyses ten times. Significant p values were calibrated by using the genomic inflation factor (gif). Poisson regressions were calculated using the function ‘glm’ in R. Significance was estimated with likelihood ratio tests using the drop1 function. Unlike LFMM, GLM does not use a logistic link function and would be equivalent to a linear regression if K was set to 0 [52].
In both analysis, age and altitude were used as continuous variables (years old and m.a.s.l). Survival was used as a dichotomous variable (alive and dead). Thus, to perform LFMM analysis, the association testing was carried out with a GLM (family Poisson), after fitting the LFMM with 1 latent factor (K = 1). Hierarchical AMOVA was applied using GeneAlEx to investigate genetic structure related to altitude, age, and/or survival, and complemented the information from the association analyses. Fst were calculated by performing 9999 random permutations for significance testing [51]. Given the unequal distribution of alive and dead individuals (see Results and Discussion), the gene–survival association and AMOVA analyses were also conducted iteratively with eight random samples, consisting of four randomly selected alive individuals and the only four dead individuals, in the case of S, and five randomly selected alive individuals and the only five dead individuals, in the case of C.
The p values were corrected by False Discovery Rate (FDR) using the function ‘p.adjust’ in R and the method of Benjamini & Hochberg [53], since multiple association analyses were run using the same data. These corrections were not performed in the 8 iterations, since they only consisted of 8 runs per statistical analysis and group of individuals. In addition, to minimize false positive association results [54], we considered only associations that were significant in at least two of the three approaches in all analysis (both using all individuals and the 8 iterations).
Finally, the potential degradation and low quantity of the DNA extracted from wood could result in allelic dropout [55]. Allelic dropout could cause the mistaken assignment of heterozygous genotypes as homozygotes, leading to an underestimation of the observed heterozygosity and an overestimation of the inbreeding coefficient [56,57]. Consequently, it reduced the number of heterozygotes successfully genotyped by the PCR. Repeated genotyping constituted a general strategy for correcting allelic dropout, especially in the case of apparent homozygotes [58,59,60]. In practice, however, replicate genotyping was costly and often uninformative or impossible, due to insufficient DNA or logistical constraints, especially for natural populations with limited DNA samples [56,57,61]. This was the case for our wood samples, given that the insufficient DNA quantity/quality and the high content of phenolic compounds from wood made the DNA extraction difficult and inhibited the PCR reaction, preventing us from repeated genotyping. Therefore, we used a maximum-likelihood (ML) approach that allowed us to estimate the allelic dropout rate without using replicate genotypes in our nine wood samples (four individuals from S and five individuals from C), running MicroDrop program [57]. This program was designed to calculate allelic dropout rates from nonreplicated microsatellite genotype data, using an allele frequency model with or without Hardy–Weinberg equilibrium (HWE). Although this program was designed for microsatellites, since SNPs were also co-dominant markers and the program handled the absence of HWE, it was suitable for our SNP data, which were co-dominant markers potentially subjected to selective pressures [57].
2.5. Protein Translation and Modeling
ORFfinder from the National Center of Biotechnology (NCBI) [62] was used to search for open reading frames (ORFs) in the GORK gene sequence, since it showed evidence of selection related to survival (see Results and Discussion). The identified ORF was also translated into protein to identify non-synonymous mutations between the two SNPGORK alleles, A and T. To test their potential impact on the protein structure, a protein model prediction was performed using Phyre2 [63].
3. Results
We successfully amplified, by means of PCR, the GORK gene in 35 alive trees, plus four wood samples in the S population; and 68 alive trees, plus five wood samples in C population (Table 1). However, the PIP1 gene PCR amplification was successful in the alive samples (35 individuals from S and 68 individuals from C), but not in dead trees from both populations. Thus, survival-related analyses were only based on the GORK gene (Table 1 and Table 2, and Table S1).

Table 1.
Allele frequencies by altitude, age and survival, and results of logistic regression and LFMM analysis (GEA analysis) and Fst (AMOVA) based on two SNPs in GORK and PIP1 gene for Saucillo and Caucon populations. Saucillo—Low: N = 15, Middle: N = 14, High: N = 6, Young: N = 11, Mature: N = 12, Old: N = 12; Alive (mature and low): N = 11, Dead (mature and low): N = 4. Caucon—Low: N = 16, Middle: N = 38, High: N = 14; Sapling: N = 22; Mature: N = 22, Old: N = 24; Alive (mature and low): N = 19, Dead (mature and low): N = 5. Significant results are highlighted in bold. FDR: False Discovery Rate.
Table 2.
Iteratively gene–phenotype AMOVA analysis results in randomly selected mature and low individuals (4 alive individuals vs. the 4 dead individuals in Saucillo, and 5 alive individuals vs. the 5 dead individuals in Caucon). Significant results are highlighted in bold.
Statistically significant results in both GORK gene-survival association analyses were obtained in C population (logistic regression FDR = 0.02, LFMM FDR = 0.02) using all individuals (19 mature and low alive, and five mature and low dead) (Table 1). Regarding the eight iteratively conducted gene-survival association analyses, six out of the eight randomly subset samples showed statistically significant results in the C population in the logistic regression (p value = 0.048) (Table 2).
Since AMOVA analysis informed the genetic divergence related to neutral components such as demography, it was worth comparing the results of this work with those obtained in a previous study using neutral markers (SSR) in the same individuals [19]. In that study, the Fst values in S and C ranged between −0.051 and 0.020, similar to those obtained here, with the exception of C by survival in SNPGORK, which showed a high and statistically significant Fst value in this work, using all individuals (Fst = 0.267, FDR = 0.03) (Table 1 and Supplementary Material Table S1), and in six out of the eight alive/dead balanced subsets (Fst = 0.397, p value = 0.021) (Table 2). Contrastingly, Fst based on SSR for survival, using all individuals, was low and non-statistically significant (Fst = 0.020, p value > 0.05, unpublished results). Regarding family structure, which might have had a confounding effect leading to false positives, this previous study showed low inbreeding coefficient in C (FIS = 0.08, [19]). Thus, there was no evidence that our statistically significant results in C were false positives caused by family structure acting as a confounding effect.
The allelic dropout rate calculation run in the MicroDrop program [57] showed a very low dropout rate for the GORK gene in the nine dead individuals (dropout rate = 0.000009). Thus, we did not find evidence of allelic dropout in our wood samples.
4. Discussion
The genetic basis of local adaptation may be explained by conditional neutrality, wherein an allele shows a fitness advantage in one environment, but is neutral in another environment [64,65,66]. Hence, our results suggest that the possible local adaptation observed in C would be related to conditional neutrality in the GORK gene, which would be advantageous in A. pinsapo populations subjected to severe drought. This potential conditional neutrality might be explained because C population represents a rear edge of this species, regarding its elevation range [2,14]. Therefore, A. pinsapo trees from this population are subjected to limiting climatic conditions and they show severe decline and mortality [21]. Thus, it is biologically meaningful that drought-related selection processes might be acting on the GORK gene in C. The lack of statistically significant results related to altitude and age in both analyzed populations, both markers, and for all three statistical analyses (logistic regression, LFMM and AMOVA) (Table 1 and Table S1) would point to a lack of association between the analyzed SNPs and these variables. However, it could also be a consequence of the limited sample size, which might not be enough to show slight genetic differences among the studied cohorts [67].
Previous studies analyzing SNPs of candidate genes in the phylogenetically related species Abies alba reported evidence of selective pressure related to abiotic stress, including drought, causing local adaptation across heterogeneous environments [68,69]. Nevertheless, the results of the present work should be interpreted carefully, given the limited number of wood samples. Furthermore, despite not finding evidence of allelic dropout in our wood samples, based on the MicroDrop program [57], possible DNA degradation should be taken into account in further studies, including studies of dead trees [50]. Another aspect to consider is the limitations in explaining the full drought response of A. pinsapo using two genes, since several functional pathways and genes are involved in conifer drought response [28,38,70].
ORFfinder results showed that SNPGORK is non-synonymous. The two protein variants showed a change in a lysine amino acid (allele T), which is basic, by a methionine (allele A), which is non-polar. The polarity of the amino acids can affect the overall structure of the protein. To test its potential impact on the protein structure, a protein model prediction is performed using Phyre2 [64]. The top model proteins for both alleles show structural differences in protein folding (Figure 3a,b), which is essential to protein function. Incorrect protein folding can produce insoluble aggregates or result in inactive proteins [64]. Moreover, both top model proteins belong to the ankyrin protein–protein interaction domain, which may contribute to GORK channel ABA interaction [65]. Thus, it is advisable to test a possible SNPGORK effect on the functionality of this potential potassium channel, specifically related to its ABA interaction to regulate stomatal closure under drought stress.
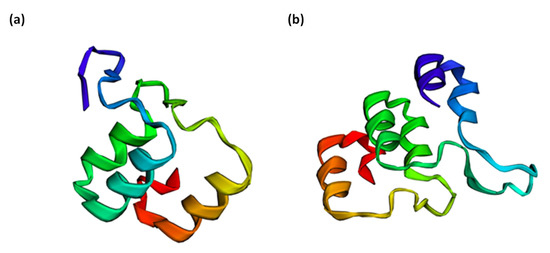
Figure 3.
(a) Top model for the protein structure of the allele T (GORK gene), which belongs to a part of the ankyrin repeat domain, whose codon gives rise to the basic amino acid, lysine. Sixty-four residues (63% of the sequence) were modelled with 99.8% confidence by the single highest scoring template. (b) Top model for the protein structure of the allele A (GORK gene), which belongs to a part of the ankyrin repeat domain, whose codon gives rise to the non-polar amino acid methionine. Eighty residues (78% of the sequence) were modelled with 99.8% confidence by the single highest scoring template.
The S population seems to not be subjected to selective pressure related to survival, given the lack of consistency between the three analyses (Table 1 and Table 2, and Table S1). Furthermore, the most frequent allele among dead individuals is different between the S and C populations (A in C and T in S, Table 1). These differences might be because the C population has a lower elevation limit at 1100 m (the S population is at 1200 m). Therefore, trees from C could be subjected to more limiting climatic conditions. Indeed, an extensive field survey performed over the entire range of A. pinsapo found the highest mortality values in C [21].
The reduced number of individuals used in this study, together with the low number of markers analyzed, constitute a weakness to obtain distinct conclusions. Nevertheless, it is worth taking into consideration the small number of scattered populations of A. pinsapo within its current range, as well as the low number of individuals per population. Hence, our sampling size is low, which makes both the estimates and correlations likely less robust than in the case of a species with a wider distribution range deriving from a higher sampling survey. Thus, further research based on higher sample size which uses gene-targeted high-throughput sequencing techniques, such as exome capture, would be advisable. Recent studies in conifers have successfully used exome capture-based approaches to detect the genetic basis of local adaptation. For instance, Lu et al. [71] identified 611 SNPs associated with climate and geographic variables and adaptive phenotypic traits in P. taeda. Several loci contributing to local adaptation were also identified by Tyrmi et al. [72] in Pinus sylvestris, using targeted capture techniques.
The investigation of wood samples obtained from dead trees poses an additional challenge to our study [50]. The potential degradation and low quantity of the DNA extracted from wood might result in allelic dropout [55], which to some extent reduces the reliability of the differences among dead and alive individuals. Repeated genotyping is frequently performed to correct this allelic dropout [58,59,60]. However, the insufficient DNA quantity/quality and the high content of phenolic compounds from the dry wood prevents us from repeated genotyping.
In spite of these limitations, our results did not find evidence of allelic dropout in the wood samples according to the MicroDrop program and pointed to a possible role of the GORK gene in the drought survival of A. pinsapo, showing preliminary evidence of local adaptation in C population, which would be caused by conditional neutrality at this locus. This evidence is also supported by a non-synonymous mutation caused by the SNPGORK, which most likely affects the resulting protein folding. In particular, SNPGORK may affect the ankyrin protein–protein interaction domain, which may contribute to GORK channel and ABA interaction [65,73], regulating stomatal closure under drought stress. Isohydric conifers, such as A. pinsapo, close stomata to maintain water potential [36], using increasing ABA concentrations as a signal [28]. Thus, it is biologically meaningful that the SNPGORK might play a role in A. pinsapo drought resistance [73]. Therefore, we believe that these preliminary results must be shared with the scientific community, since they may help guide further research following the same research line, that is, the adaptive genetic diversity to drought in conifers, which is key to help conserve the ecologically valuable forests in the context of a changing climate.
5. Conclusions
The results obtained from this work provide insights into the climate-change-related adaptive genetic diversity in A. pinsapo, offering preliminary evidence of a possible role of the GORK gene on its resilience to drought. Despite the aforementioned limitations, such as the reduced sample size, low number of markers, and allelic dropout likelihood, our preliminary results can serve to guide future research lines about the adaptive genetic diversity to drought of several conifer species. We consider that this is a pioneer study, whose approach and the results are valuable, mostly in the case of a drought-sensitive species, such as A. pinsapo, for which we lack advanced genetic information. Although several functional pathways and genes are involved in conifer drought responses, the potential role of the GORK gene in the drought resilience of the conifer might be taken into account. If fully proved, the GORK gene could be used to guide management policies aiming to reduce the future extinction risk for those endemic and endangered conifers, such as marker-assisted selection to be used in plant breeding and reforestation. Furthermore, it will provide a better understanding of trees’ abilities to adapt to rapid climate changes, such as the recently reported increase in extreme drought events.
Supplementary Materials
The following are available online at https://www.mdpi.com/article/10.3390/f12091220/s1, Table S1: Summary AMOVA table carried out on subpopulations sorted by altitude, age, and survival in both Saucillo and Caucon populations and in both studied genes (SNPGORK and SNPPIP1). df, degrees of freedom; SS, sum of squares; MS, Mean squares; Est. Var, Estimated variance (%). Significant results are highlighted in bold.
Author Contributions
I.C.-S. performed the lab work, carried out the data analyses, wrote the main manuscript text, and prepared the tables and figures; B.M.-C. performed the lab work; F.J.G. carried out the sampling design, and supervised and guided the lab work; J.C.L. and J.I.S. carried out the sampling design and collected the plant material; J.W. discussed the data analyses and results. All authors have read and agreed to the published version of the manuscript.
Funding
Irene Cobo-Simón was supported by a Predoctoral grant (BES-2014-070379), Spanish Ministry of Economy. Belén Méndez-Cea, was supported by a Predoctoral grant from Complutense University of Madrid. This study was supported by project CGL2013-48843-C2-2-R, Spanish Ministry of Economy.
Institutional Review Board Statement
Not applicable.
Informed Consent Statement
Not applicable.
Data Availability Statement
GORK and PIP1 gene sequences are available in NCBI with the accession numbers MN509429, MW303985-MW303990 for the GORK gene and MW303991-MW303997 for the PIP1 gene. Genotypic, phenotypic and environmental data from this work are available in TreeGenes database with the accession number TGDR382.
Conflicts of Interest
The authors declare no conflict of interest.
References
- Davis, M.B.; Shaw, R.G. Range shifts and adaptive responses to Quaternary climate change. Science 2001, 292, 673–679. [Google Scholar] [CrossRef]
- Jump, A.S.; Peñuelas, J. Running to stand still: Adaptation and the response of plants to rapid climate change. Ecol. Lett. 2005, 8, 1010–1020. [Google Scholar] [CrossRef]
- Aitken, S.N.; Yeaman, S.; Holliday, J.A.; Wang, T.L.; Curtis-McLane, S. Adaptation, migration or extirpation: Climate change outcomes for tree populations. Evol. Appl. 2008, 1, 95–111. [Google Scholar] [CrossRef]
- Alberto, F.J.; Aitken, S.N.; Alia, R.; Gonzalez-Martinez, S.C.; Hanninen, H.; Kremer, A.; Lefevre, F.; Lenormand, T.; Yeaman, S.; Whetten, R.; et al. Potential for evolutionary responses to climate change evidence from tree populations. Glob. Chang. Biol. 2013, 19, 1645–1661. [Google Scholar] [CrossRef]
- Petit, J.; Hampe, A. Some Evolutionary Consequences of Being a Tree. Annu. Rev. Ecol. Evol. Syst. 2006, 37, 187–214. [Google Scholar] [CrossRef]
- Buschiazzo, E.; Ritland, C.; Bohlmann, J.; Ritland, K. Slow but not low: Genomic comparisons reveal slower evolutionary rate and higher dN/dS in conifers compared to angiosperms. BMC Evol. Biol. 2012, 12, 8. [Google Scholar] [CrossRef]
- Prunier, J.; Verta, J.P.; MacKay, J.J. Conifer genomics and adaptation: At the crossroads of genetic diversity and genome function. New Phytol. 2016, 209, 44–62. [Google Scholar] [CrossRef]
- Prunier, J.; Laroche, J.; Beaulieu, J.; Bousquet, J. Scanning the genome for gene SNPs related to climate adaptation and estimating selection at the molecular level in boreal black spruce. Mol. Ecol. 2011, 20, 1702–1716. [Google Scholar] [CrossRef]
- Joost, S.; Bonin, A.; Bruford, M.W.; Després, L.; Conord, C.; Erhardt, G.; Taberlet, P. A spatial analysis method (SAM) to detect candidate loci for selection: Towards a landscape genomics approach to adaptation. Mol. Ecol. 2007, 16, 3955–3969. [Google Scholar] [CrossRef]
- Coop, G.; Witonsky, D.; Di Rienzo, A.; Pritchard, J.K. Using environmental correlations to identify loci underlying local adaptation. Genetics 2011, 185, 1411–1423. [Google Scholar] [CrossRef]
- Poncet, B.N.; Herrman, D.; Gugerli, F.; Taberlet, P.; Holderegger, R.; Gielly, L.; Rioux, D.; Thuiller, W.; Aubert, S.; Manel, S. Tracking genes of ecological relevance using a genome scan in two independent regional population samples of Arabis alpina. Mol. Ecol. 2010, 19, 2896–2907. [Google Scholar] [CrossRef]
- Khan, M.A.; Korban, S.S. Association mapping in forest trees and fruit crops. J. Exp. Bot. 2012, 63, 4045–4060. [Google Scholar] [CrossRef]
- Linares, J.C. Biogeography and evolution of Abies (Pinaceae) in the Mediterranean Basin. The roles of long-term climatic changes and glacial refugia. J. Biogeogr. 2011, 38, 619–630. [Google Scholar] [CrossRef]
- Hampe, A.; Jump, A.S. Climate relicts: Past, present and future. Annu. Rev. Ecol. Evol. Syst. 2011, 42, 313–333. [Google Scholar] [CrossRef]
- Hampe, A.; Petit, R.J. Conserving biodiversity under climate change: The rear edge matters. Ecol. Lett. 2005, 8, 461–467. [Google Scholar] [CrossRef] [PubMed]
- Pulido, F.; Valladares, F.; Calleja, J.A.; Moreno, G.; González-Bornay, G. Tertiary relict trees in a Mediterranean climate: Abiotic constraints on the persistence of Prunus lusitanica at the eroding edge of its range. J. Biogeogr. 2008, 35, 1425–1435. [Google Scholar] [CrossRef]
- Kawecki, T.J. Adaptation to marginal habitats. Annu. Rev. Ecol. Evol. Syst. 2008, 39, 321–342. [Google Scholar] [CrossRef]
- Woolbright, S.A.; Whitham, T.G.; Gehring, C.A.; Allan, G.J.; Bailey, J.K. Climate relicts and their associated communities as natural ecology and evolution laboratories. Trends Ecol. Evol. 2014, 29, 406–416. [Google Scholar] [CrossRef]
- Cobo-Simón, I.; Méndez-Cea, B.; Jump, A.S.; Seco, J.I.; Gallego, F.J.; Linares, J.C. Understanding genetic diversity of relict forests. Linking long-term isolation legacies and current habitat fragmentation in Abies pinsapo Boiss. For. Ecol. Manag. 2020, 461, 117947. [Google Scholar] [CrossRef]
- Linares, J.C.; Camarero, J.J.; Carreira, J.A. Competition modulates the adaptation capacity of forests to climatic stress: Insights from recent growth decline and death in relict stands of the Mediterranean fir Abies pinsapo. J. Ecol. 2010, 98, 592–603. [Google Scholar] [CrossRef]
- Linares, J.C.; Camarero, J.J.; Carreira, J.A. Interacting effects of climate and forest-cover changes on mortality and growth of the southernmost European fir forests. Glob. Chang. Biol. 2009, 18, 485–497. [Google Scholar] [CrossRef]
- Kuparinen, A.; Savolainen, O.; Schurr, F.M. Increased mortality can promote evolutionary adaptation of forest trees to climate change. For. Ecol. Manag. 2010, 259, 1003–1008. [Google Scholar] [CrossRef]
- Neale, D.B.; Savolainen, O. Association genetics of complex traits in conifers. Trends Plant Sci. 2004, 9, 325–330. [Google Scholar] [CrossRef] [PubMed]
- Mosca, E.; Cruz, F.; Gómez-Garrido, J.; Bianco, L.; Rellstab, C.; Brodbeck, S.; Csillery, K.; Fady, B.; Fladung, M.; Fussi, B.; et al. A reference genome sequence for the European silver fir (Abies alba Mill.): A community-generated genomic resource. G3 2019, 9, 2039–2049. [Google Scholar] [CrossRef] [PubMed]
- González-Martínez, S.C.; Ersoz, E.; Brown, G.R.; Wheeler, N.C.; Neale, D.B. DNA sequence variation and selection of tag single-nucleotide polymorphisms at candidate genes for drought-stress response in Pinus taeda L. Genetics 2006, 172, 1915–1926. [Google Scholar] [CrossRef] [PubMed]
- Eckert, A.J.; van Heerwaarden, J.; Wegrzyn, J.L. Patterns of population structure and environmental associations to aridity across the range of loblolly pine (Pinus taeda L., Pinaceae). Genetics 2010, 185, 969–982. [Google Scholar] [CrossRef] [PubMed]
- Holliday, J.A.; Ritland, K.; Aitken, S.N. Widespread, ecologically relevant genetic markers developed from association mapping of climate-related traits in Sitka spruce (Picea sitchensis). New Phytol. 2010, 188, 501–514. [Google Scholar] [CrossRef]
- Moran, E.; Lauder, J.; Musser, C.; Stathos, A.; Shu, M. The genetics of drought tolerance in conifers. New Phytol. 2017, 216, 1034–1048. [Google Scholar] [CrossRef]
- Alter, S.; Bader, K.C.; Spannagl, M.; Wang, Y.; Bauer, E.; Schön, S.C.; Mayer, K.F. DroughtDB: An expert-curated compilation of plant drought stress genes and their homologs in nine species. Database 2015, 2015, bav046. [Google Scholar] [CrossRef]
- Pérez-González, A.; Marconi, M.; Cobo-Simón, I.; Méndez-Cea, B.; Perdiguero, P.; Linacero, R.; Linares, J.C.; Gallego, F.J. Abies pinsapo Boiss. Transcriptome Sequencing and Molecular Marker Detection: A Novel Genetic Resources for a Relict Mediterranean Fir. For. Sci. 2018, 64, 609–617. [Google Scholar] [CrossRef]
- Terrab, A.; Talavera, S.; Arista, M.; Paun, O.; Stuessy, T.F.; Tremetsberger, K. Genetic diversity and geographic structure at chloroplast microsatellites (cpSSRs) in endangered west Mediterranean firs (Abies spp., Pinaceae). Taxon 2007, 56, 409–416. [Google Scholar] [CrossRef]
- Dering, M.; Sekiewicz, K.; Boratynska, K.; Litkowiec, M.; Iszkulo, G.; Romo, A.; Boratynski, A. Genetic diversity and inter-specific relations of western Mediterranean relic Abies taxa as compared to the Iberian A. alba. Flora 2014, 209, 367–374. [Google Scholar] [CrossRef][Green Version]
- Sánchez-Robles, J.M.; Balao, F.; Terrab, A.; Garcia-Castaño, J.; Ortiz, M.A.; Vela, E.; Talavera, S. Phylogeography of SW Mediterraneanfirs: Different European origins for the North African Abies species. Mol. Phylogenet. Evol. 2014, 79, 42–53. [Google Scholar] [CrossRef] [PubMed]
- Razgour, O.; Forester, B.; Taggart, J.B.; Bekaert, M.; Juste, J.; Ibáñez, C.; Puechmaille, S.J.; Novella-Fernandez, R.; Alberdi, A.; Manel, S. Considering adaptive genetic variation in climate change vulnerability assessment reduces species range loss projections. Proc. Natl. Acad. Sci. USA 2019, 116, 6–11. [Google Scholar] [CrossRef] [PubMed]
- Hosy, E.; Vavasseur, A.; Mouline, K.; Dreyer, I.; Garmard, F.; Poree, F.; Boucherez, J.; Lebaudy, A.; Bouchez, D.; Very, A.-A.; et al. The Arabidiopsis outward K+ channel GORK is involved in regulation of stomatal movements and plant transpiration. Proc. Natl. Acad. Sci. USA 2003, 100, 5549–5554. [Google Scholar] [CrossRef]
- Tardieu, F.; Simonneau, T. Variability among species of stomatal control under fluctuating soil water status and evaporative demand: Modelling isohydric and anisohydric behaviours. J. Exp. Bot. 1998, 49, 419–432. [Google Scholar] [CrossRef]
- Sharma, T.; Dreyer, I.; Riedelsberger, J. The role of K(+) channels in uptake and redistribution of potassium in the model plant Arabidopsis thaliana. Front. Plant Sci. 2013, 4, 224. [Google Scholar] [CrossRef]
- Behringer, D.; Zimmermann, H.; Ziegenhagen, R.; Liepelt, S. Differential gene expression reveals candidate genes for drought stress response in Abies alba (Pinaceae). PLoS ONE 2015, 10, e0124564. [Google Scholar] [CrossRef]
- Cumbie, W.P.; Eckert, A.; Wegrzyn, J.; Whetten, R.; Neale, D.; Goldfarb, B. Association genetics of carbon isotope discrimination, height and foliar nitrogen in a natural population of Pinus taeda L. Heredity 2011, 107, 105–114. [Google Scholar] [CrossRef]
- Eveno, E.; Collada, C.; Guevara, M.A.; Leger, V.; Soto, A.; Diaz, L.; Leger, P.; Gonzalez-Martinez, S.C.; Cervera, M.T.; Plomion, C.; et al. Contrasting patterns of selection at Pinus pinaster Ait. drought stress candidate genes as revealed by genetic differentiation analyses. Mol. Biol. Evol. 2008, 25, 417–437. [Google Scholar] [CrossRef]
- Lorenz, W.W.; Sun, F.; Liang, C.; Kolychev, D.; Wang, H.; Zhao, X.; Cordonnier-Pratt, M.M.; Pratt, L.H.; Dean, J.F. Water stress-responsive genes in loblolly pine (Pinus taeda) roots identified by analyses of expressed sequence tag libraries. Tree Physiol. 2006, 26, 1–16. [Google Scholar] [CrossRef]
- Lorenz, W.W.; Alba, R.; Yu, Y.S.; Bordeaux, J.M.; Simões, M.; Dean, J.F. Microarray analysis and scale-free gene networks identify candidate regulators in drought-stressed roots of loblolly pine (P. taeda L.). BMC Genom. 2011, 12, 264–280. [Google Scholar] [CrossRef]
- Uehlein, N.; Lovisolo, C.; Siefritz, F.; Kaldenhoff, R. The tobacco aquaporin NtAQP1 is a membrane CO2 pore with physiological functions. Nature 2003, 425, 734–737. [Google Scholar] [CrossRef] [PubMed]
- Kaldenhoff, R.; Fischer, M. Functional aquaporin diversity in plants. Biochim. Biophys. Acta 2006, 1758, 1134–1141. [Google Scholar] [CrossRef]
- Sade, N.; Gebretsadik, M.; Seligmann, R.; Schwartz, A.; Wallach, R.; Moshelion, M. The Role of Tobacco Aquaporin1 in Improving Water Use Efficiency, Hydraulic Conductivity, and Yield Production under Salt Stress. Plant Physiol. 2010, 152, 245–254. [Google Scholar] [CrossRef] [PubMed]
- Eisenbarth, D.A.; Weig, A.R. Dynamics of aquaporins and water relations during hypocotyl elongation in Ricinus communis L. seedlings. J. Exp. Bot. 2005, 56, 1831–1842. [Google Scholar] [CrossRef]
- Gao, Z.; He, X.; Zhao, B.; Zhou, C.; Liang, Y.; Ge, R.; Shen, Y.; Huang, Z. Overexpressing a Putative Aquaporin Gene from Wheat, TaNIP, Enhances Salt Tolerance in Transgenic Arabidopsis. Plant Cell Physiol. 2010, 51, 767–775. [Google Scholar] [CrossRef]
- de Miguel, M.; Cabezas, J.A.; de María, N.; Sánchez-Gómez, D.; Guevara, M.A.; Vélez, M.D.; Sáez-Laguna, E.; Diaz, L.-M.; Mancha, J.-A.; Barbero, M.-C.; et al. Genetic control of functional traits related to photosynthesis and water use efficiency in Pinus pinaster Ait. drought response: Integration of genome annotation, allele association and QTL detection for candidate gene identification. BMC Genom. 2014, 15, 464. [Google Scholar] [CrossRef] [PubMed]
- Rinntech, H. LINTABTM: Tree-Ring Station Measurement. Heidelberg, Germany. 2003. Available online: http://www.rinntech.com (accessed on 13 February 2020).
- Méndez-Cea, B.; Cobo-Simón, I.; Perez-Gonzalez, A.; García-García, I.; Linares, J.C.; Gallego, F.J. DNA Extraction and Amplification from Pinaceae Wood. Silvae Genet. 2019, 68, 55–57. [Google Scholar] [CrossRef]
- Peakall, R.; Smouse, P.E. GenAlEx 6.5: Genetic analysis in Excel. Population genetic software for teaching and research—An update. Bioinformatics 2012, 28, 2537–2539. [Google Scholar] [CrossRef] [PubMed]
- Frichot, E.; Schoville, S.D. Testing for Associations between Loci and Environmental Gradients Using Latent Factor Mixed Models. Mol. Biol. Evol. 2013, 30, 1687–1699. [Google Scholar] [CrossRef] [PubMed]
- Benjamini, Y.; Hochberg, Y. Controlling the false discovery rate: A practical and powerful approach to multiple testing. J. R. Stat. Soc. Ser. B-Stat. Metodol. 1995, 57, 289–300. [Google Scholar] [CrossRef]
- De Mita, S.; Thuillet, A.-C.; Gay, L.; Ahmadi, N.; Manel, S.; Ronfort, J.; Vigouroux, Y. Detecting selection along environmental gradients: Analysis of eight methods and their effectiveness for outbreeding and selfing populations. Mol. Ecol. 2013, 22, 1383–1399. [Google Scholar] [CrossRef]
- Pompanon, F.; Bonin, A.; Bellemain, E.; Taberlet, P. Genotyping errors: Causes, consequences and solutions. Nat. Rev. Genet. 2005, 6, 847–859. [Google Scholar] [CrossRef]
- Taberlet, P.; Waits, L.P.; Luikart, G. Noninvasive genetic sampling: Look before you leap. Trends Ecol. Evol. 1999, 14, 323–327. [Google Scholar] [CrossRef]
- Wang, C.; Schroeder, K.B.; Rosenberg, N.A. A maximum-likelihood method to correct for allelic dropout in microsatellite data with no replicate genotypes. Genetics 2012, 192, 651–669. [Google Scholar] [CrossRef] [PubMed]
- Taberlet, P.; Griffin, S.; Goossens, B.; Questiau, S.; Manceau, V.; Escaravage, N.; Waits, L.P.; Bouvet, J. Reliable genotyping of samples with very low DNA quantities using PCR. Nucleic Acids Res. 1996, 24, 3189–3194. [Google Scholar] [CrossRef] [PubMed]
- Morin, P.A.; Chambers, K.E.; Boesch, C.; Vigilant, L. Quantitative polymerase chain reaction analysis of DNA from noninvasive samples for accurate microsatellite genotyping of wild chimpanzees (Pan troglodytes verus). Mol. Ecol. 2001, 10, 1835–1844. [Google Scholar] [CrossRef]
- Wasser, S.K.; Mailand, C.; Booth, R.; Mutayoba, B.; Kisamo, E.; Clark, B.; Stephens, M. Using DNA to track the origin of the largest ivory seizure since the 1989 trade ban. Proc. Natl. Acad. Sci. USA 2007, 104, 4228–4233. [Google Scholar] [CrossRef]
- Taberlet, P.; Luikart, G. Non-invasive genetic sampling and individual identification. Biol. J. Linn. Soc. 1999, 68, 41–55. [Google Scholar] [CrossRef]
- Wheeler, D.L.; Church, D.M.; Federhen, S.; Lash, A.E.; Madden, T.L.; Pontius, J.U.; Schuler, G.D.; Schriml, L.M.; Sequeira, E.; Tatusova, T.A.; et al. Database resources of the National Center for Biotechnology. Nucleic Acids Res. 2003, 31, 28–33. [Google Scholar] [CrossRef] [PubMed]
- Kelley, L.A.; Mezulis, S.; Yates, C.M.; Wass, M.N.; Sternberg, M.J. The Phyre2 web portal for protein modeling, prediction and analysis. Nat. Protoc. 2015, 10, 845–858. [Google Scholar] [CrossRef] [PubMed]
- Llamas, E.; Pulido, P.; Rodriguez-Concepcion, M. Interference with plastome gene expression and Clp protease activity in Arabidopsis triggers a chloroplast unfolded protein response to restore protein homeostasis. PLoS Genet. 2017, 13, e1007022. [Google Scholar] [CrossRef] [PubMed]
- Ooi, A.; Lemtiri-Chlieh, F.; Wong, A.; Gehring, C. Direct Modulation of the Guard Cell Outward-Rectifying Potassium Channel (GORK) by Abscisic Acid. Mol. Plant. 2017, 10, 1469–1472. [Google Scholar] [CrossRef]
- Anderson, J.T.; Lee, C.R.; Rushworth, C.A.; Colautti, R.I.; Mitchell-Olds, T. Genetic trade-offs and conditional neutrality contribute to local adaptation. Mol. Ecol. 2013, 22, 699–708. [Google Scholar] [CrossRef]
- Hong, E.P.; Park, J.W. Sample size and statistical power calculation in genetic association studies. Genom. Inform. 2012, 10, 117–122. [Google Scholar] [CrossRef]
- Roschanski, A.M.; Csilléry, K.; Liepelt, S.; Oddou-Muratorio, S.; Ziegenhagen, B.; Huard, F.; Ullrich, K.K.; Postolache, D.; Vendramin, G.G.; Fady, B. Evidence of divergent selection for drought and cold tolerance at landscape and local scales in Abies alba Mill. in the French Mediterranean Alps. Mol. Ecol. 2016, 25, 776–794. [Google Scholar] [CrossRef]
- Csilléry, K.; Ovaskainen, O.; Sperisen, C.; Buchmann, N.; Widmer, A.; Gugerli, F. Adaptation to local climate in multi-trait space: Evidence from silver fir (Abies alba Mill.) populations across a heterogeneous environment. Heredity 2020, 124, 77–92. [Google Scholar] [CrossRef]
- Fox, H.; Doron-Faigenboim, A.; Kelly, G.; Bourstein, R.; Attia, Z.; Zhou, J.; Moshe, Y.; Moshelion, M.; David-Schwartz, R. Transcriptome analysis of Pinus halepensis under drought stress and during recovery. Tree Physiol. 2018, 38, 423–441. [Google Scholar] [CrossRef]
- Lu, M.; Loopstra, C.A.; Krutovsky, K.V. Detecting the genetic basis of local adaptation in loblolly pine (Pinus taeda L.) using whole exome-wide genotyping and an integrative landscape genomics analysis approach. Ecol. Evol. 2019, 9, 6798–6809. [Google Scholar] [CrossRef] [PubMed]
- Tyrmi, J.; Vuosku, J.; Acosta, J.J.; Li, Z.; Sterck, L.; Savolainen, O.; Pyhäjärvi, T. Genomics of clinal local adaptation in Pinus sylvestris under continuous environmental and spatial genetic setting. G3 2020, 10, 2683–2696. [Google Scholar] [CrossRef] [PubMed]
- Adem, G.D.; Chen, G.; Shabala, L.; Chen, Z.H.; Shabala, S. GORK channel: A master switch of plant metabolism? Trends Plant Sci. 2020, 25, 434–445. [Google Scholar] [CrossRef] [PubMed]


Publisher’s Note: MDPI stays neutral with regard to jurisdictional claims in published maps and institutional affiliations. |
© 2021 by the authors. Licensee MDPI, Basel, Switzerland. This article is an open access article distributed under the terms and conditions of the Creative Commons Attribution (CC BY) license (https://creativecommons.org/licenses/by/4.0/).