Abstract
Fragmented and degraded ecosystems should be restored to ensure the biological connectivity among fragmented forest landscapes. The tropical rainforests of Southwestern Sri Lanka are highly degraded and fragmented due to plantation agriculture and human settlements. However, the high spatial variation in environmental factors and ecosystem functions challenge the success rate of restoration interventions. The aim of this study was to assess the vegetation composition and stand structure in relation to the spatial variation in key soil physicochemical parameters in the Endane Biodiversity Corridor that links peripheral forest reserve to the Sinharaja Rainforest Complex (SRC). The site that extends over 24 ha was classified into five land-use categories (productive tea lands, marginal tea lands, scrub—abandoned three years ago, and two woodlands—abandoned 15 years ago) in which the vegetation composition, stand structure, and physicochemical parameters of soil were assessed and mapped. Results revealed that the Shannon diversity index in the scrub and the woodlands were higher than in the tea lands. The diversity among the secondary forest patches was similar. However, with a mean record of 14 species, the species richness was high in sites close to the SRC. In comparison to the SRC (358 Mg ha−1), there was a substantial potential to sequester more carbon in the restoration sites (12–108 Mg ha−1). While explaining 31% of abundance and species distribution, the ordination results revealed a close relationship of the soil parameters to vegetation composition and species abundance. The calculated coefficient variation values for soil parameters (TN, EC, Av.P, Ex.K, OC, and BD) were beyond 12%, indicating high or moderate soil spatial variability among the land use categories. Coefficient of variation for soil pH was estimated to be 9%, revealing low soil spatial variability among the land use categories. The maps of these soil parameters corresponded with the type of land use and fertilizer application to tea fields. The highest and the lowest total N contents were observed in the scrub and woodlands, respectively, which appears to be mediated by the relative composition of N-fixing trees between the two groups. Our results facilitate effective matching of sites to species for restoration of the Endane Biodiversity Corridor that may be replicated in similar restoration contexts in tropical Asia.
1. Introduction
Globally, natural forests are under tremendous pressure and are being deforested at an annual rate of 10 million ha per year, while those remaining are severely being degraded [1]. Despite the global efforts such as the ‘UN Decade on Ecosystem Restoration’ to avert the negative impacts from deforestation and forest degradation, the world is not on track to meet three major already-set targets: Sustainable Development Goal 15.3—by 2030 to restore degraded lands and soils to achieve a land degradation-neutral world; Aichi Biodiversity Target 5—by 2020, the rate of loss of all natural habitats including forests is at least halved while significantly reducing forest degradation and fragmentation; and the United Nations Strategic Plan for Forests Goal 1—to reverse the loss of forest cover worldwide through sustainable forest management including protection, restoration, afforestation, and reforestation. Among the tropical forests, secondary forests are the most dominant, however, they are largely overlooked in classic research that is focused on undisturbed and intact ecosystems to answer fundamental research questions [1,2].
Forest fragmentation, which is the breakdown of previously large areas of forest habitats into small pieces by roads, buildings, plantations, and the like has serious conservation implications. Whereas forests are restored to achieve national restoration targets and to reinstate lost ecosystem services, less attention is paid to connect patches of forests with contiguous protected areas as an integral element of restoration projects [3]. Among the negative impacts from forest fragmentation, isolation of individuals of biologically outcrossing tree species into forest fragments leads to in-breeding or produces infertile seeds, which will not regenerate into seedlings [4]. It is also likely that seed predators eat fallen seeds in isolated forest patches, and the seed dispersal agents such as birds and mammals could be barred from dispersing seeds to distant germinating grounds [5,6]. In tropical biodiversity hotspots such as Sri Lanka, where plant endemism is remarkably high, alleviation of the negative consequences of forest fragmentation and consequently soliciting the ways to reconnect such habitats are of paramount importance.
Agricultural expansion is among the primary drivers contributing to 40% of tropical deforestation and fragmentation [1,7]. In tropical Asia, large scale perennial crop plantations such as tea, rubber, coffee, and oil palm pose major challenges to landscape level forest restoration efforts [8,9,10]. These long-term and intensive use of lands arrest the natural succession of tropical forests [3]. Tropical rainforests are being markedly resilient to short-term, less intensive disturbances such as treefalls and small landslides. Nevertheless, their natural succession is compromised by long-term intensive disturbances that reduce the availability of propagules (i.e., seeds and resprouting stems), distancing the proximity to natural forests, and by exposing lands for continuous excessive harvesting of forest-based products [11]. However, abandonment of agricultural lands initiates the natural forest succession in many regions, providing opportunities for forest landscape restoration. Among the intensive tree planting techniques available, natural forest succession and assisted natural regeneration are posed as cost-effective ways of increasing forest cover in tropical forest regions [3,12]. Moreover, matching environmental characteristics of sites to those required by the species (i.e., site-species matching), is an important prerequisite for the success of restoration outcomes [13,14]. This can be achieved by mapping existing stand characteristics and soil properties of restoration sites. Furthermore, the abundance of secondary forests with different land use history provides a powerful tool to study forest succession as successional chrono-sequences [2,12]. However, integration of the successional chrono-sequence approach with mapping stand characteristics and soil properties has received a low priority in recent research.
Chemical and physical parameters of soil are strongly associated with floristic composition and successional stages of vegetation [11,15]. Lands dominated by fast growing pioneer species with high turnover of leaves provide an ample supply of litter for decomposition leading to high organic matter contents in soils. In contrast, trees in mature rainforests are long-lived with rapid leaf turnover rates, eventually generating a relatively small fraction of decomposition, thus leading to low soil organic matter contents [16]. Whereas the total nitrogen content may be increased due to the abundance of N-fixing microbiota among pioneer vegetation, the contents may be decreased with increasing fallow age [15]. Available phosphorous content in the soil may be decreased with fallow age, though there is no agreement as to whether tropical rainforests are phosphorous-limited [17,18]. Likewise, the soil fertility and physical parameters, especially when they are mapped at micro-topographic scales, could be useful for effective mapping of restoration species to site characteristics using distribution patterns in nearby reference forests.
The plantation agriculture in the wet zone of Sri Lanka over the last century has left behind the legacy of both Ceylon Tea, the premium tea brand as well as an array of highly fragmented lowland rainforests. Most of the tropical lowland rainforests were deforested for tea and rubber plantations during the British colonial era. The continuous monoculture of tea with low inputs and poor land management has reduced the land productivity, leading to the abandonment of large-scale tea cultivations in mid- and low-elevations of Sri Lanka. Forest restoration in some abandoned tea lands, while reconnecting existing forest patches, provide opportunities for plant and animal species living in the small forest fragments to exchange their genetic materials and to restore the lost biodiversity and ecosystem services [19].
This proposed corridor aims to establish a biological link between the Sinharaja Rainforest Complex and Iharakanda Proposed Forest Reserve. The aim of this study was to assess vegetation composition and stand structure in relation to the spatial variation in key soil physicochemical parameters in the Endane Biodiversity Corridor of Dilmah Conservation, Dilmah Ceylon Tea Company, Sri Lanka. We tested two hypotheses. First, we evaluated whether vegetation composition and stand structure indicate directional changes in relation to the forest age and proximity to the Sinharaja Rainforest Complex. Second, we tested whether physicochemical parameters of soil correlate with vegetation composition, stand structure, and fallow age. Our results are directly translated to restoration actions by effective matching of sites to species within the Endane Biodiversity Corridor that may be replicated in similar restoration contexts in Sri Lanka and tropical Asia.
2. Materials and Methods
2.1. Study Site
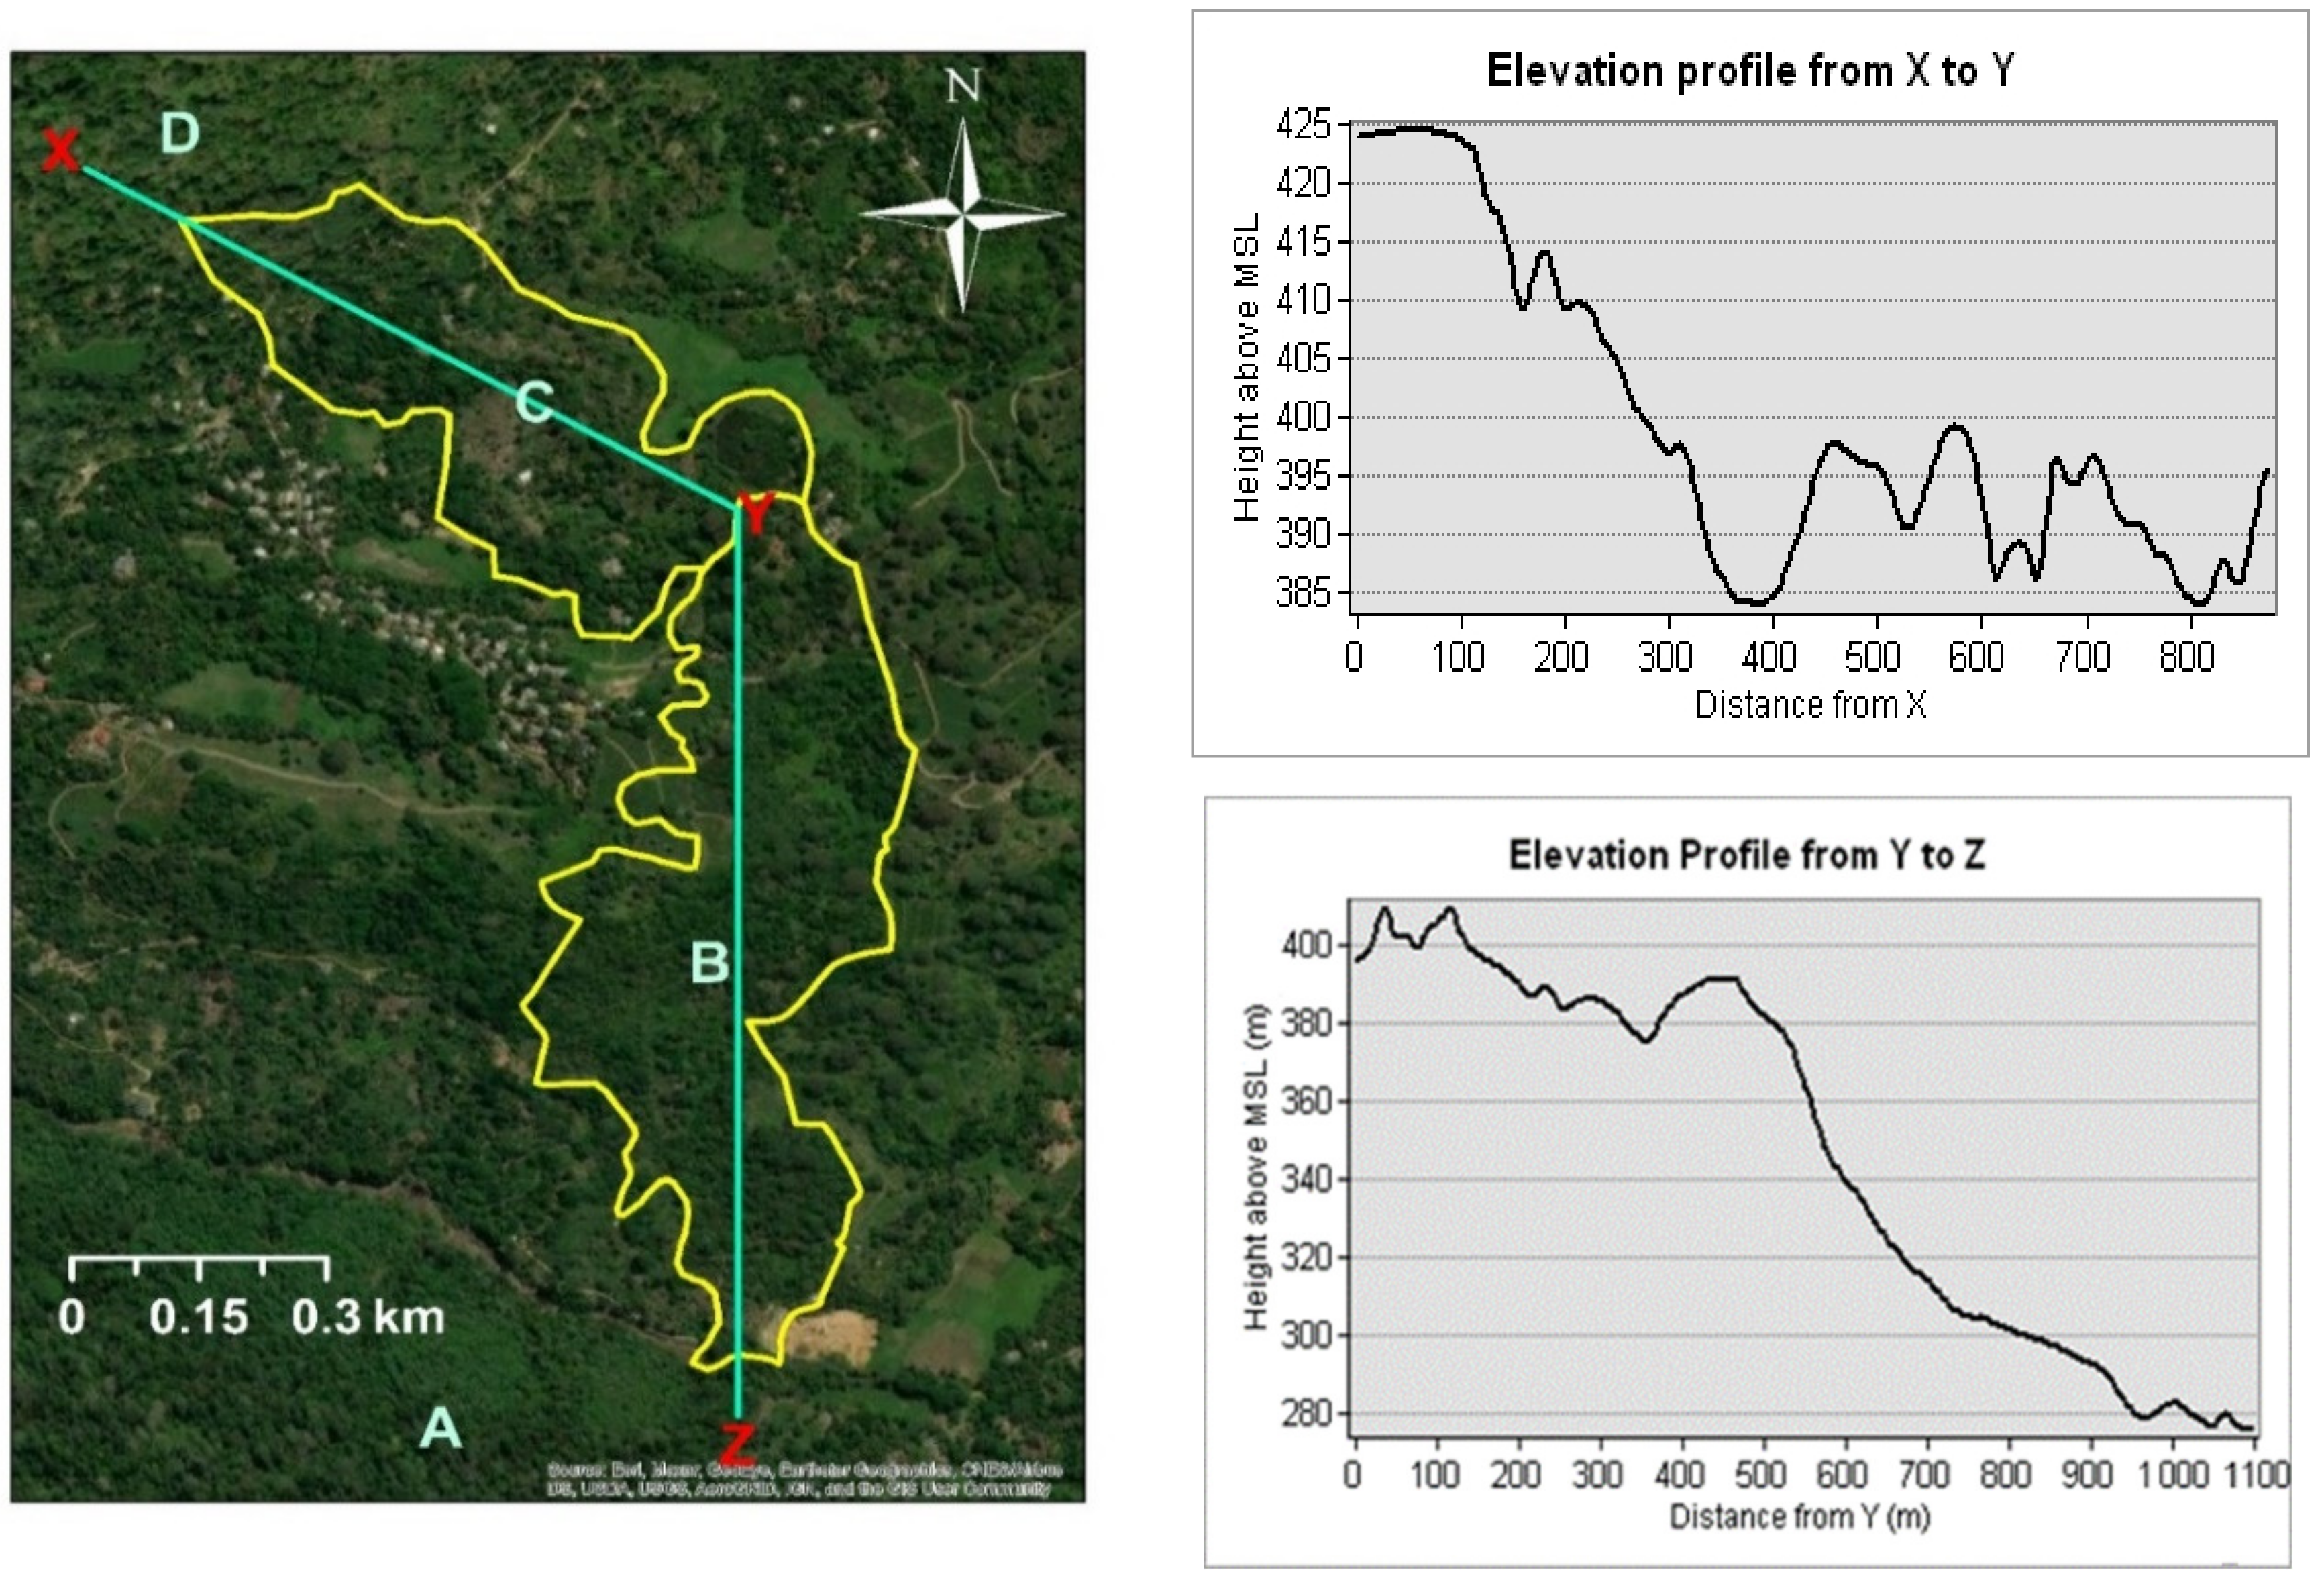
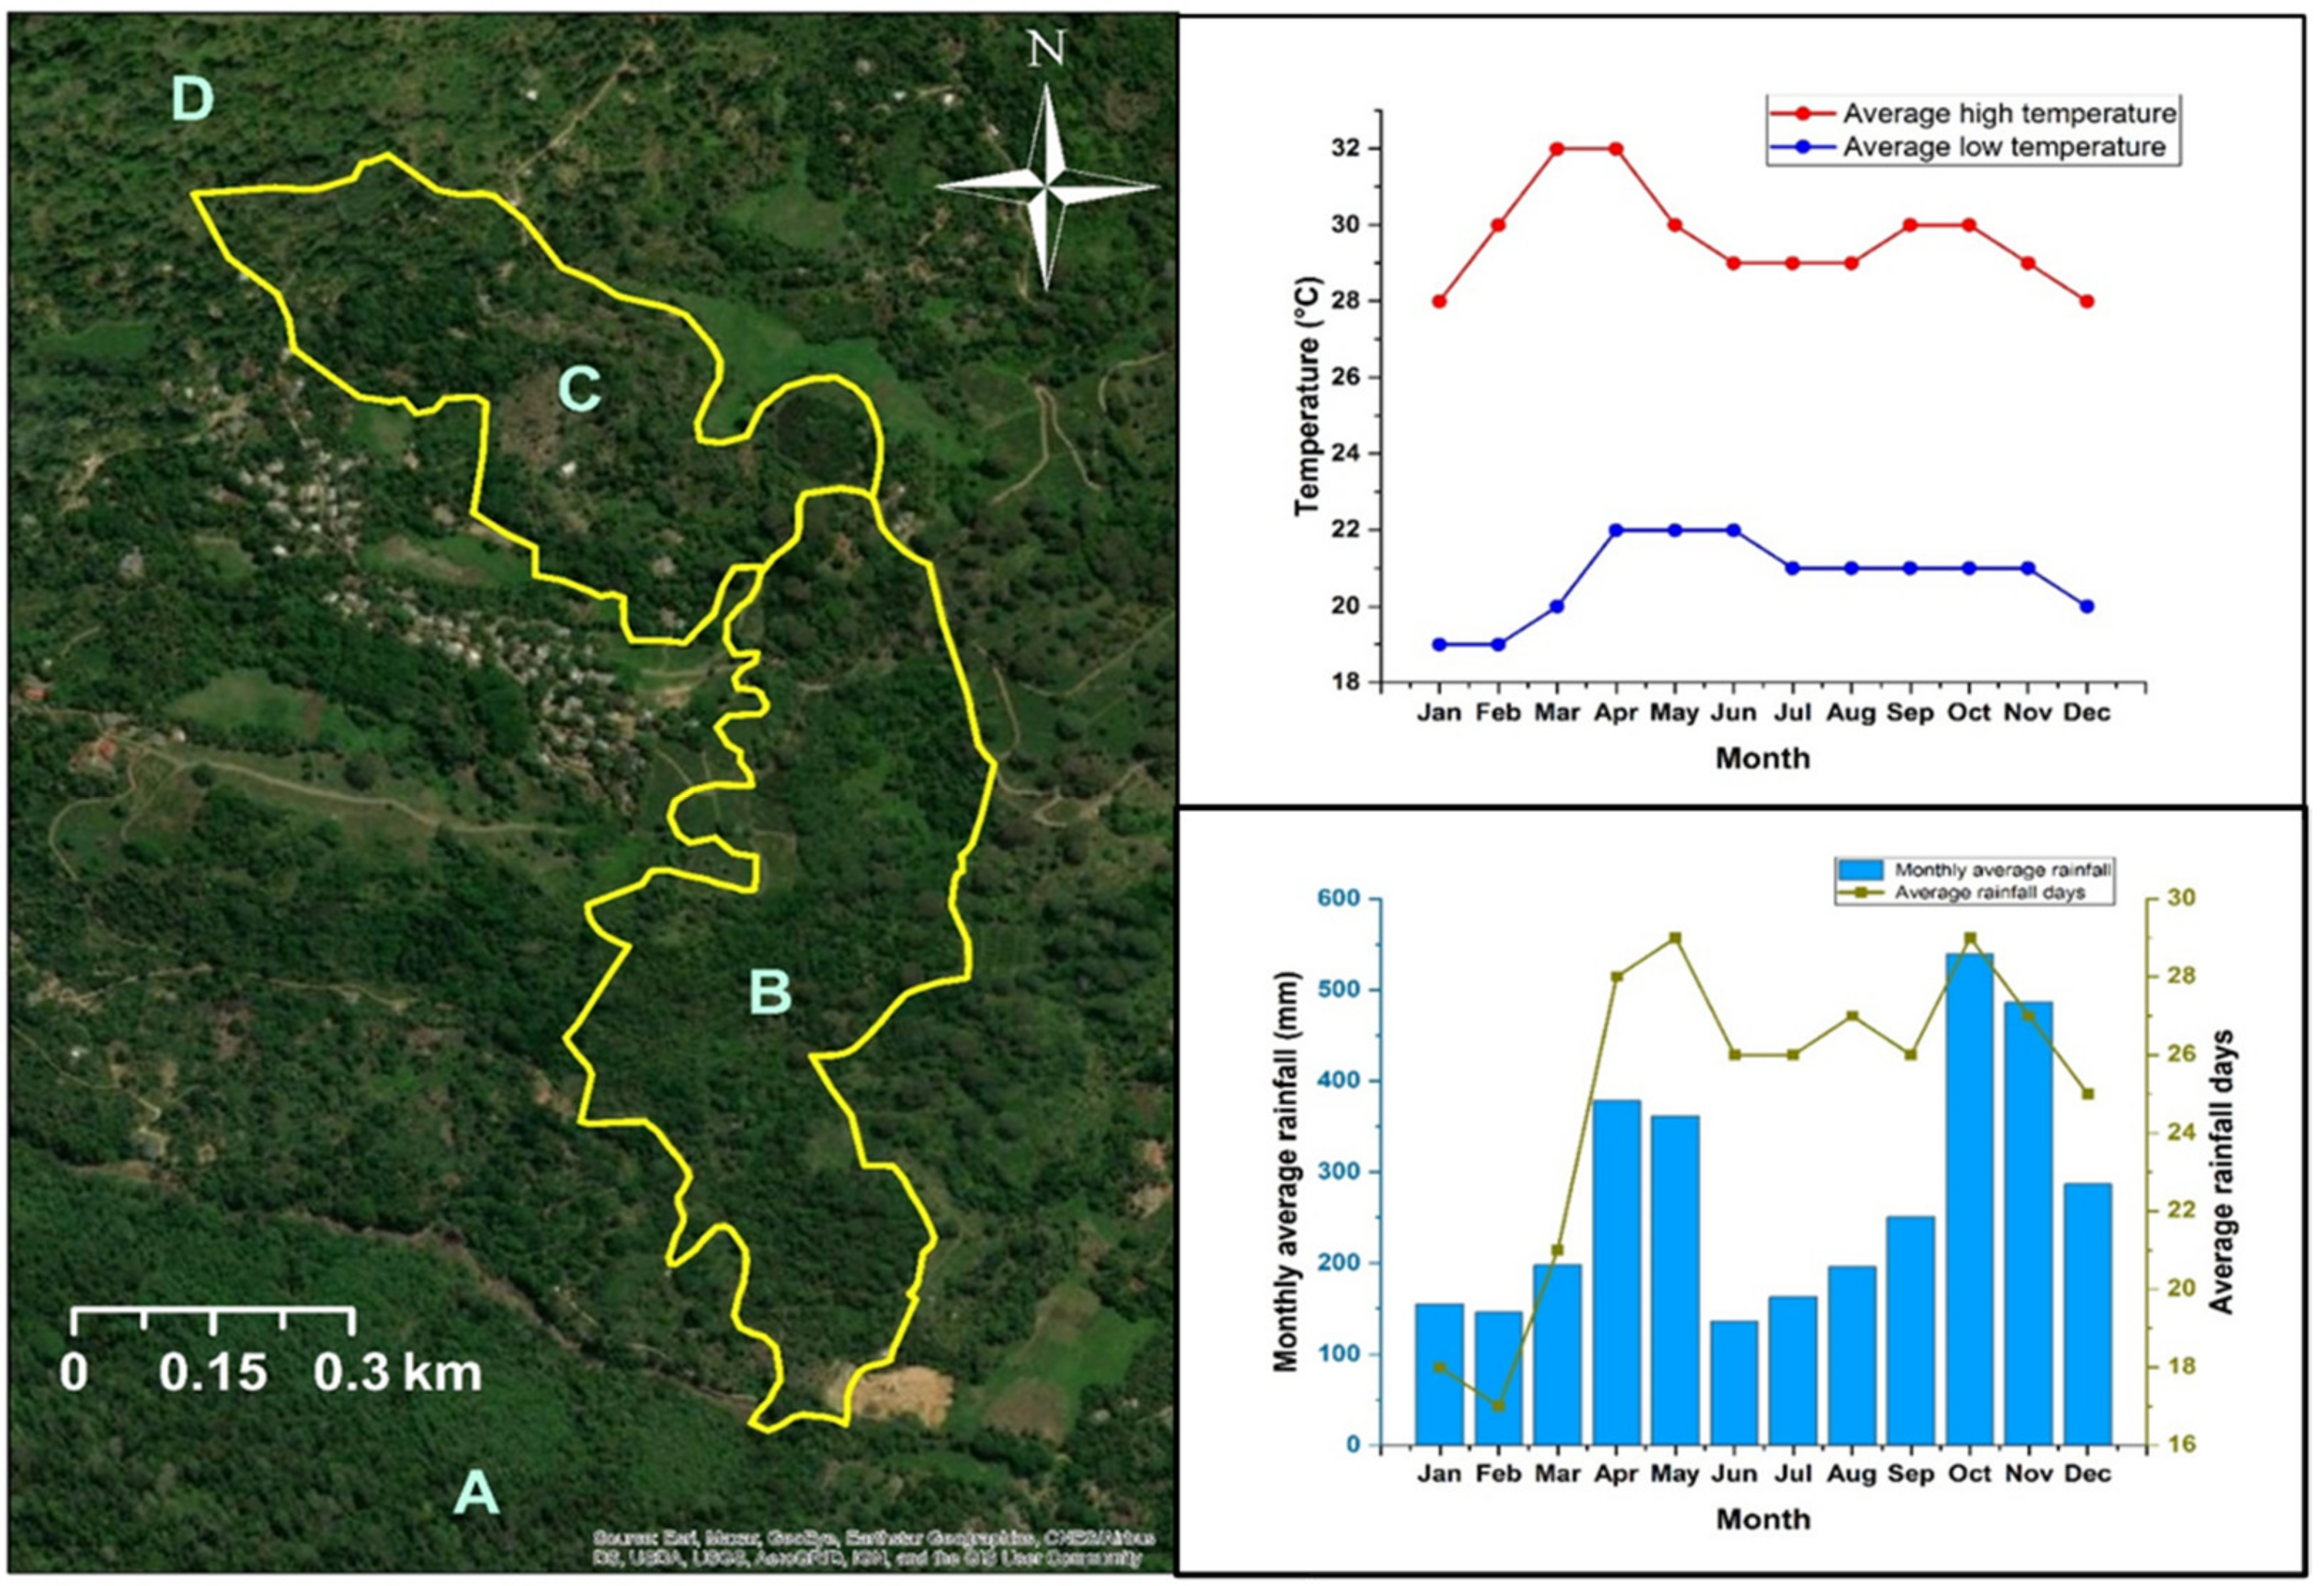
This study was conducted in the Endane Biodiversity Corridor of Dilmah Conservation, Dilmah Ceylon Tea Company, Sri Lanka. The site is located adjacent to the Sinharaja Rainforest Complex in thee Rathnapura District in Southwestern Sri Lanka (Figure 1). The location falls within the agroecological region WL2a, which records a mean annual temperature ranging between 18 °C–27 °C and mean annual rainfall between 2500 mm–3500 mm (Figure 1). The study was conducted from February to September in 2018. Based on land ownership, the study site was first classified into two major sections (the upper and the lower, C and B, respectively, in Figure 1). Whereas the upper part is owned by a local community, the lower part is owned by Kahawaththa Plantations PLC, a subsidiary of Dilmah Ceylon Tea Company. The work presented in this manuscript was conducted in the lower section that spreads across 24 ha along an elevational gradient of 268–420 m asl (Appendix A, Figure A1). The study area belongs to a physiographic unit of complex hill, ridge, and valley system in the Sri Lanka/Deniyaya land system. The ridges are very prominent, and the local relief is very high. The interfluves are broad. Moreover, excessive surface drainage is observed in this land system [20]. The terrain is slopy with less-steep spurs to less-steep gullies. The major soil in this region are red-yellow Podzolic soils (USDA taxonomy: Typic Haplohumults and FAO classification: Humic Alfisols) [20,21].

Figure 1.
Map of the Endane Biodiversity Corridor (EBC), Dilmah Conservation and Kahawaththa Plantations PLC., located adjacent to the Sinharaja Rainforest Complex in the Rathnapura District of Sri Lanka. Letters denote: A—Sinharaja Rainforest Complex, B—lower part of the EBC where the current study was conducted, C—agroforests in the upper part of the EBC, D—Iharakanda Proposed Forest Reserve. Monthly temperature and rainfall variation are shown in the panels on the right.
2.2. Study Design
The study site was classified into five land use categories considering both the current and historic land use as seen in digitized satellite images (Google CNES/Airbus camera: eye at 1050 m 6°32′48″ N, 80°32′03″ E) freely available via Google Earth (Figure 1; Figure 2a). In the past, this region had luxurious tea lands that have been abandoned over the last 3–15 years. This area was classified into five land use categories: (i) productive tea lands (PT); (ii) marginal tea lands (MT); (iii) scrub (SC—abandoned 3 years ago); and (iv) and (v) two woodlands (WD1 and WD2, both—abandoned 15 years ago). The fallow age of these land use categories was verified using the yield records from the field blocks of tea and records from field supervisors. This classification allowed us to analyze the within-site variation as a successional chrono-sequence in a tea–forest land interface.
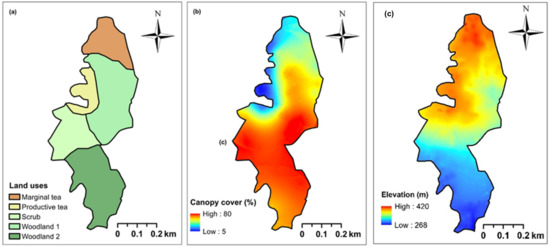
Figure 2.
Maps indicating (a) five land use categories: productive tea lands (PT), marginal tea lands (MT), scrub (SC), and two woodlands (WD1 and WD2); (b) the variation in forest canopy cover; and (c) digital elevation model (See Appendix A, Figure A1 for elevational profile) in a tea-forest interface in the Endane Biodiversity Corridor, Dilmah Conservation and Kahawaththa Plantations PLC., located adjacent to the Sinharaja Rainforest Complex in Rathnapura District of Sri Lanka. The southern end of this site connects to the Sinharaja Rainforest Complex, while the northern end connects with the Iharakanda Proposed Forest Reserve through a few agroforests, as seen in Figure 1.
Forest survey plots of 20 × 20 m in size were laid by minimally clearing their boundaries. The corners of the plots were demarcated using strip-painted PVC poles. The number of plots per land use category was determined by historical satellite imagery and the total land area occupied by a given land use category at present relative to the whole study area. Likewise, there were five plots each of the PT, MT, and SC categories: 10 plots in the WD1 and six plots in the WD2 land use categories.
2.3. Floristic Survey and Other Measurements
All trees with diameter at breast height (DBH) greater than 1 cm in each plot were counted and their diameter at breast height was measured using a metric tape in mm. Many of the species were identified by common name or scientific name within the site where possible. Voucher specimens were prepared for all species. Simultaneously, the leaf arrangement, leaf shape, size, and nature of the flowers were noted. For identification purposes, clean healthy plant parts with flowers, fruits, and leaves were collected. Each voucher specimen was dried and pressed inside newspapers placed between wooden plant presses for about two weeks. Species where the common name were known were identified by searching in the checklist with post-verification of samples at the National Herbarium, Department of National Botanical Gardens, Peradeniya, Sri Lanka [22].
Geo-referenced images of the forest canopy were obtained using a digital camera mounted on a GPS receiver (Oregon 700 Series: Garmin Ltd., Olathe, Kansas, USA). A total of 156 upward looking canopy cover images were taken 1.3 m above the ground across the study site (Figure 2b). These photographs were analyzed using ImageJ software (Version ImageJ v.1.48 freely available via https://imagej.nih.gov/ij/ - Accessed on 21 August 2018) to calculate the canopy cover percentage and to map the spatial distribution of the canopy cover (Figure 2b). The GPS coordinates were imported to Arc Map 10.1 software and depicted on the working area as a series of points using Universal Transverse Mercator (UTM) projection with the World Geodetic System (WGS) 1984 Datum. A polygon was created over these points by superimposing a new layer. Using the land use map (Figure 2a) and a digital elevation model (Figure 2c), slope, altitude, distances from neighboring main roads, nearest human settlements, and the Sinharaja Rainforest Complex to each plot were calculated.
2.4. Soil Survey and Other Measurements
A total of 67 soil samples including two from each sampling plot with additional samples along transects to increase spatial resolution were obtained using an Edelman soil auger at a 0–30 cm soil depth. Additionally, soil core samples were collected from the same locations using a core sampler. Both bulk and core soil samples were collected only at one time point from each sample location. The dimensions of cores used for analysis were measured to calculate the volume for soil bulk density. All samples were transferred to the Soil Science Laboratory, Faculty of Agriculture, Rajarata University of Sri Lanka for further processing and analysis. Soils were air dried by spreading them as a thin layer on a polythene sheet at room temperature of approximately 30°C. Large plant debris and gravels were removed, and soil clods were crushed to pass through a 2-mm sieve.
Soil samples were analyzed for soil pH, electrical conductivity (EC), organic matter content, total nitrogen, exchangeable K, and bulk density following the standard laboratory procedures. The soil pH was measured by soil suspension (soil/distilled water ratio—1:2.5) method using a potentiometric (glass electrode/pH meter) approach. The EC was measured by the potentiometric approach using the soil suspension (soil/solution ratio—1:5) method [23]. Soil organic matter content was determined by wet acid digestion followed by a titrimetric procedure [24]. The total N was analyzed by the Kjeldhal procedure [25]. Soil exchangeable K was measured using flame photometry [26]. Soil available P was measured using the molybdenum-blue colorimetric procedure [27]. Two undisturbed soil samples were collected from each sample location using a core soil sampler and were carefully transported to the laboratory. Soil bulk density of each core sample was measured by the standard laboratory procedure [28].
2.5. Calculations and Data Analysis
Shannon diversity indices were calculated as , where p is the proportion (n/N) of individuals of a particular species found (n) divided by the total number of individuals found (N); ln is the natural log; Σ is the sum of the calculations; and s is the number of species. Aboveground biomass of trees was calculated using a pantropical allometric equation: , where E is environmental stress; is the wood density in gcm−3; and D is the DBH in cm [29]. Our sample sizes were different among the land use categories which were different in size, therefore, we used unbalanced analysis of variance (ANOVA) for testing the effects of land uses on tree diversity and soil parameters. Tukey’s test was conducted for post-hoc comparison of means and evaluation of significant differences among each land-use category at the 95% confidence level. The Pearson correlation between species richness and distance from the nearest protected area was calculated. Exploratory data analyses were conducted to calculate mean, standard deviation, minimum, and coefficient of variation (CV) of soil parameters. Variogram for each tested soil parameter was prepared using Variowin 2.4 software. Relative nugget effect (RNE) was used to explain the strength of the structured spatial variability [30]. Ordinary kriging approach was implemented to interpolate point measurements of soil properties using GSLIB software. A cross validation procedure, where one observation is removed to estimate the same using neighboring observations, was implemented to investigate the accuracy of the interpolated layer. This process was repeatedly carried out until all observations were estimated [31]. Using basal area dominance in a species matrix, we applied redundancy analysis (RD) to identify the importance of soil parameters for species distribution and abundance. We used Hellinger standardization to minimize the effects of differences in abundance data.
3. Results
3.1. Vegetation Analyses in Relation to Land Use Categories
A total of 1302 trees representing 60 species belonging to 33 families were identified from the study plots located within the survey area. Of these tree species, Symplocos cohinchinensis (Lour.) S. Moore was the most abundant species in terms of stem density. Moraceae was the dominant family in the area, which was represented by five species (Appendix A, Table A1). The pioneer species: S. cohinchinensis, Syzygium caryophyllatum (L.) Alston and Osbeckia octandra DC. etc.; exotics: Gliricidia sapium (Jacq.) Walp. and Alstonia macrophylla Wall.ex G.Don; and climax species: Cleistocalyx operculatus (Roxb.) Merr. & L.M. Perry, Litsea longifolia, Cinnamomum verum (L.) Farw. and Artocarpus nobilis Kuntze were among the records found within the site (Appendix A, Table A1). Considering the basal area dominance Melia azedarach C. DC. (24 m2/ha), which is a planted species to obtain the high-shade requirement in commercial tea plantations, was the most dominant species. Likewise, Macaranga peltata (Roxb.) Müll.Arg., overgrown Camellia sinensis (L.), trees, and S. cohinchinensis were the subsequent dominant species in our study site.
The analysis of unbalanced ANOVA revealed a significantly higher Shannon diversity index in the scrub, WD1 and 2 in comparison to the tea lands with diversity among the forest land use categories being similar (Table 1). Jaccard similarity index between scrub and WDs was 30.35%. Scrub had achieved a high canopy cover within a relatively short period of time, which was approximately abandoned for three years compared to the WDs that have been abandoned for 15 years (Table 1). Due to the relatively early successional stage, the scrub was dominated by fast growing species leading to early canopy closure. This category was dominated by Macaranga peltata (Roxb.) Müll.Arg., Alstonia macrophylla Wall.ex G. Don, Mangifera indica L., S. cohinchinensis, and Leea indica (Burm. F.) Merr. As such, there were more light demanding species compared to other land use categories in the scrub area. Almost all the WDs quadrates had a higher value of canopy cover compared to three other land uses. Productive tea lands had very low, or no canopy cover compared to marginal tea lands because the estate had not planted high shade trees in the productive tea lands we studied. There was a significant difference in AGB among land use categories recording higher values in the WD1 and lower value in productive tea lands (Table 1).

Table 1.
Stand characteristics, floristics diversity, aboveground biomass (AGB), and canopy cover variation in five land use categories (PT—productive tea, MT—marginal tea, SC—scrub, WD1, and WD2) along a successional chrono-sequence in the tropical secondary lowland rainforest in the Endane Biodiversity Corridor, Dilmah Conservation and Kahawatte Plantations PLC., located close to the Sinharaja Rainforest Complex in the Rathnapura District of Sri Lanka. Comparisons depicted by the different letters indicate significant pair-wise differences at the 95% confidence level.
Considering the effects of disturbances and species richness in the study site, certain parts of the study area were heavily disturbed due to human activities. However, relatively undisturbed areas were found adjacent to the natural forest (Figure 1, label A). It was therefore possible to study species communities across a disturbance gradient. There was a significant negative correlation (r = −0.65, p < 0.05) between species richness and distance from the nearest protected area in indicating high values close to the protected area (Figure 3).
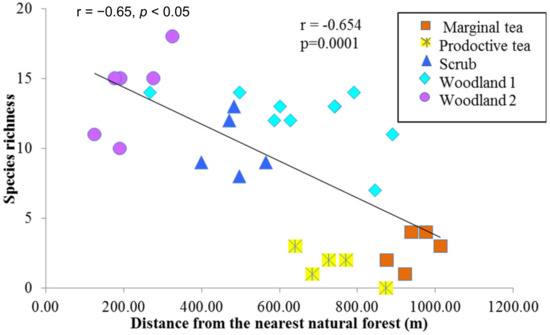
Figure 3.
A scatterplot between the species richness and distance from the Sinharaja Rainforest Complex. Species richness was measured within 20 m × 20 m plots including all trees >1 cm DBH within the Endane Biodiversity Corridor, Dilmah Conservation and Kahawatte Plantations PLC., located close to the Sinharaja Rainforest Complex in the Rathnapura District of Sri Lanka.
3.2. Spatial Variation in Soil Physical and Chemical Properties
The chemical and physical soil parameters measured showed a large variation across the landscape particularly due to the type of land use and fertilizer application to tea fields (Table 2). The mean values of total nitrogen (0.065%), soil available phosphorous (10.0 mg/kg), exchangeable potassium (15.8 mg/kg), organic carbon (1.44%), electrical conductivity (29.10 mS/cm), bulk density (1.48 Mg/m3), and pH (5.17) showed low to high coefficients of variation. Among the soil nutrients TN, Av. P, and Av. K showed high variation. Among the other soil properties, lower CV values were observed for pH (CV= 9%) and BD (CV = 20.9%). In contrast, high CV was reported for EC (CV = 64.3%). Moreover, comparatively moderate CV values were obtained for OC (CV = 38.2%).
Table 2.
Summary statistics of the measured soil chemical and physical parameters of 67 soil samples collected in a single time point from the Endane Biodiversity Corridor, linking the Iharakanda Proposed Forest Reserve and Sinharaja Rainforest Complex in the Rathnapura District of Sri Lanka.
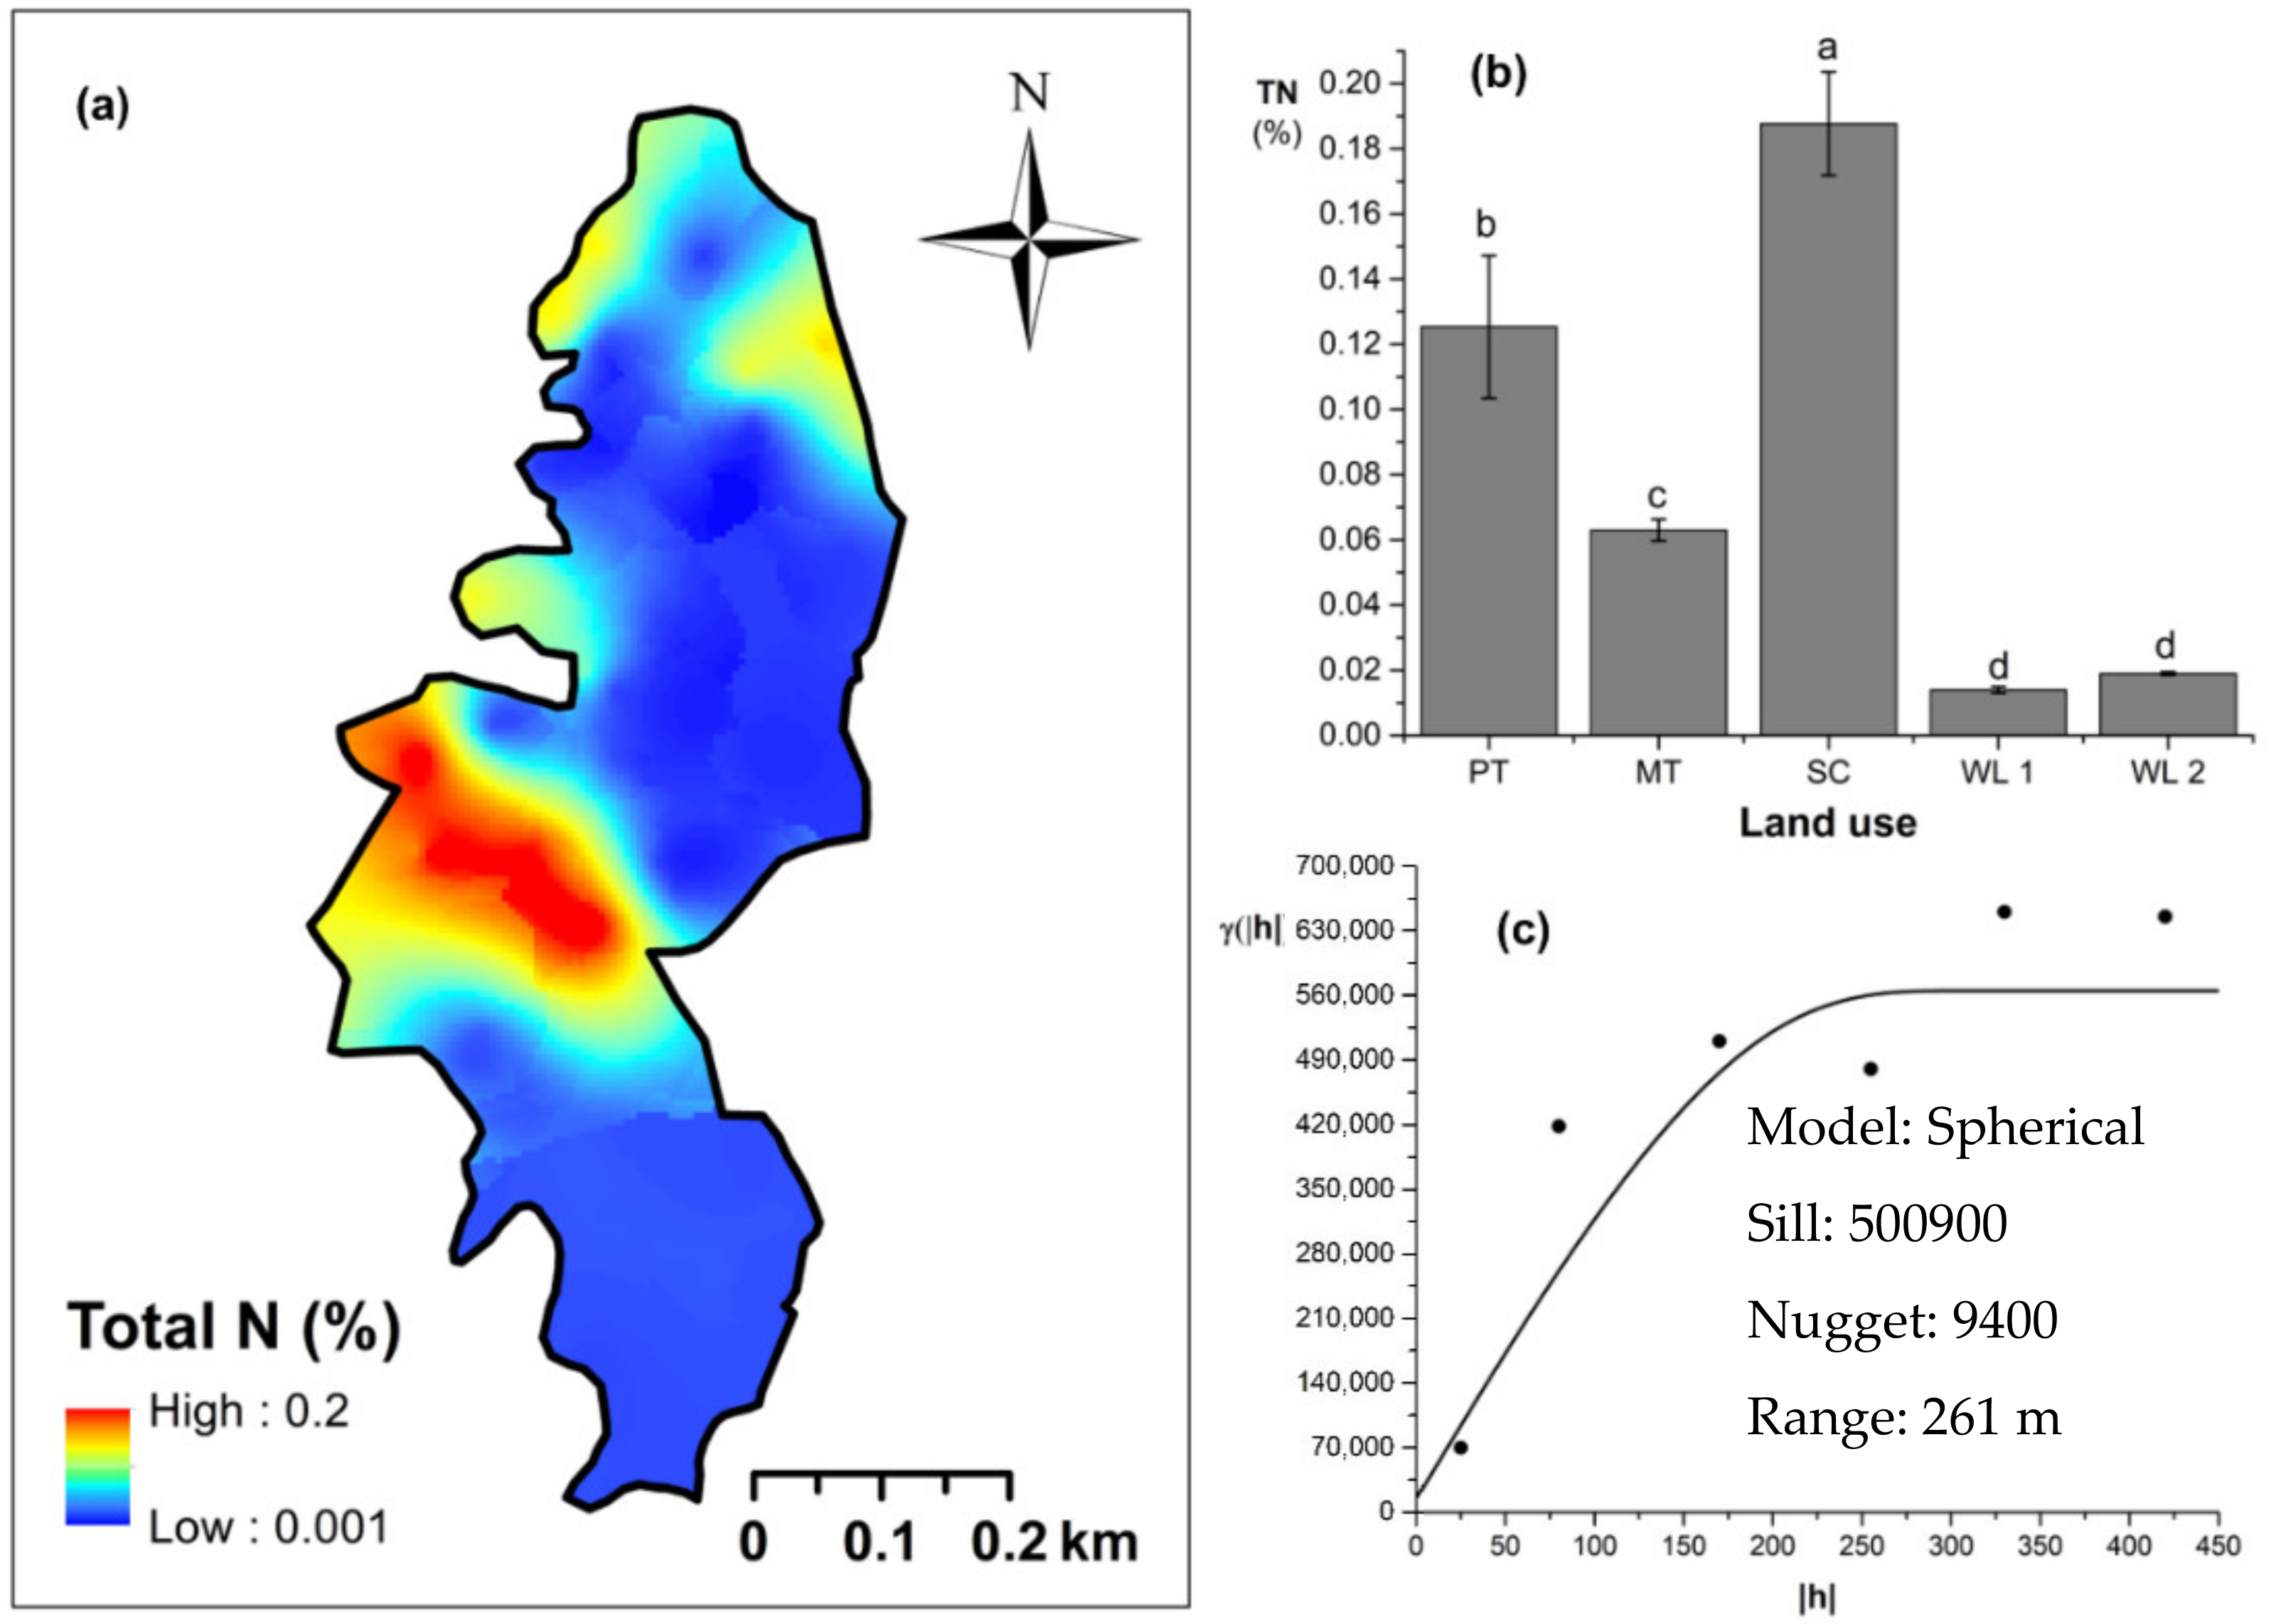
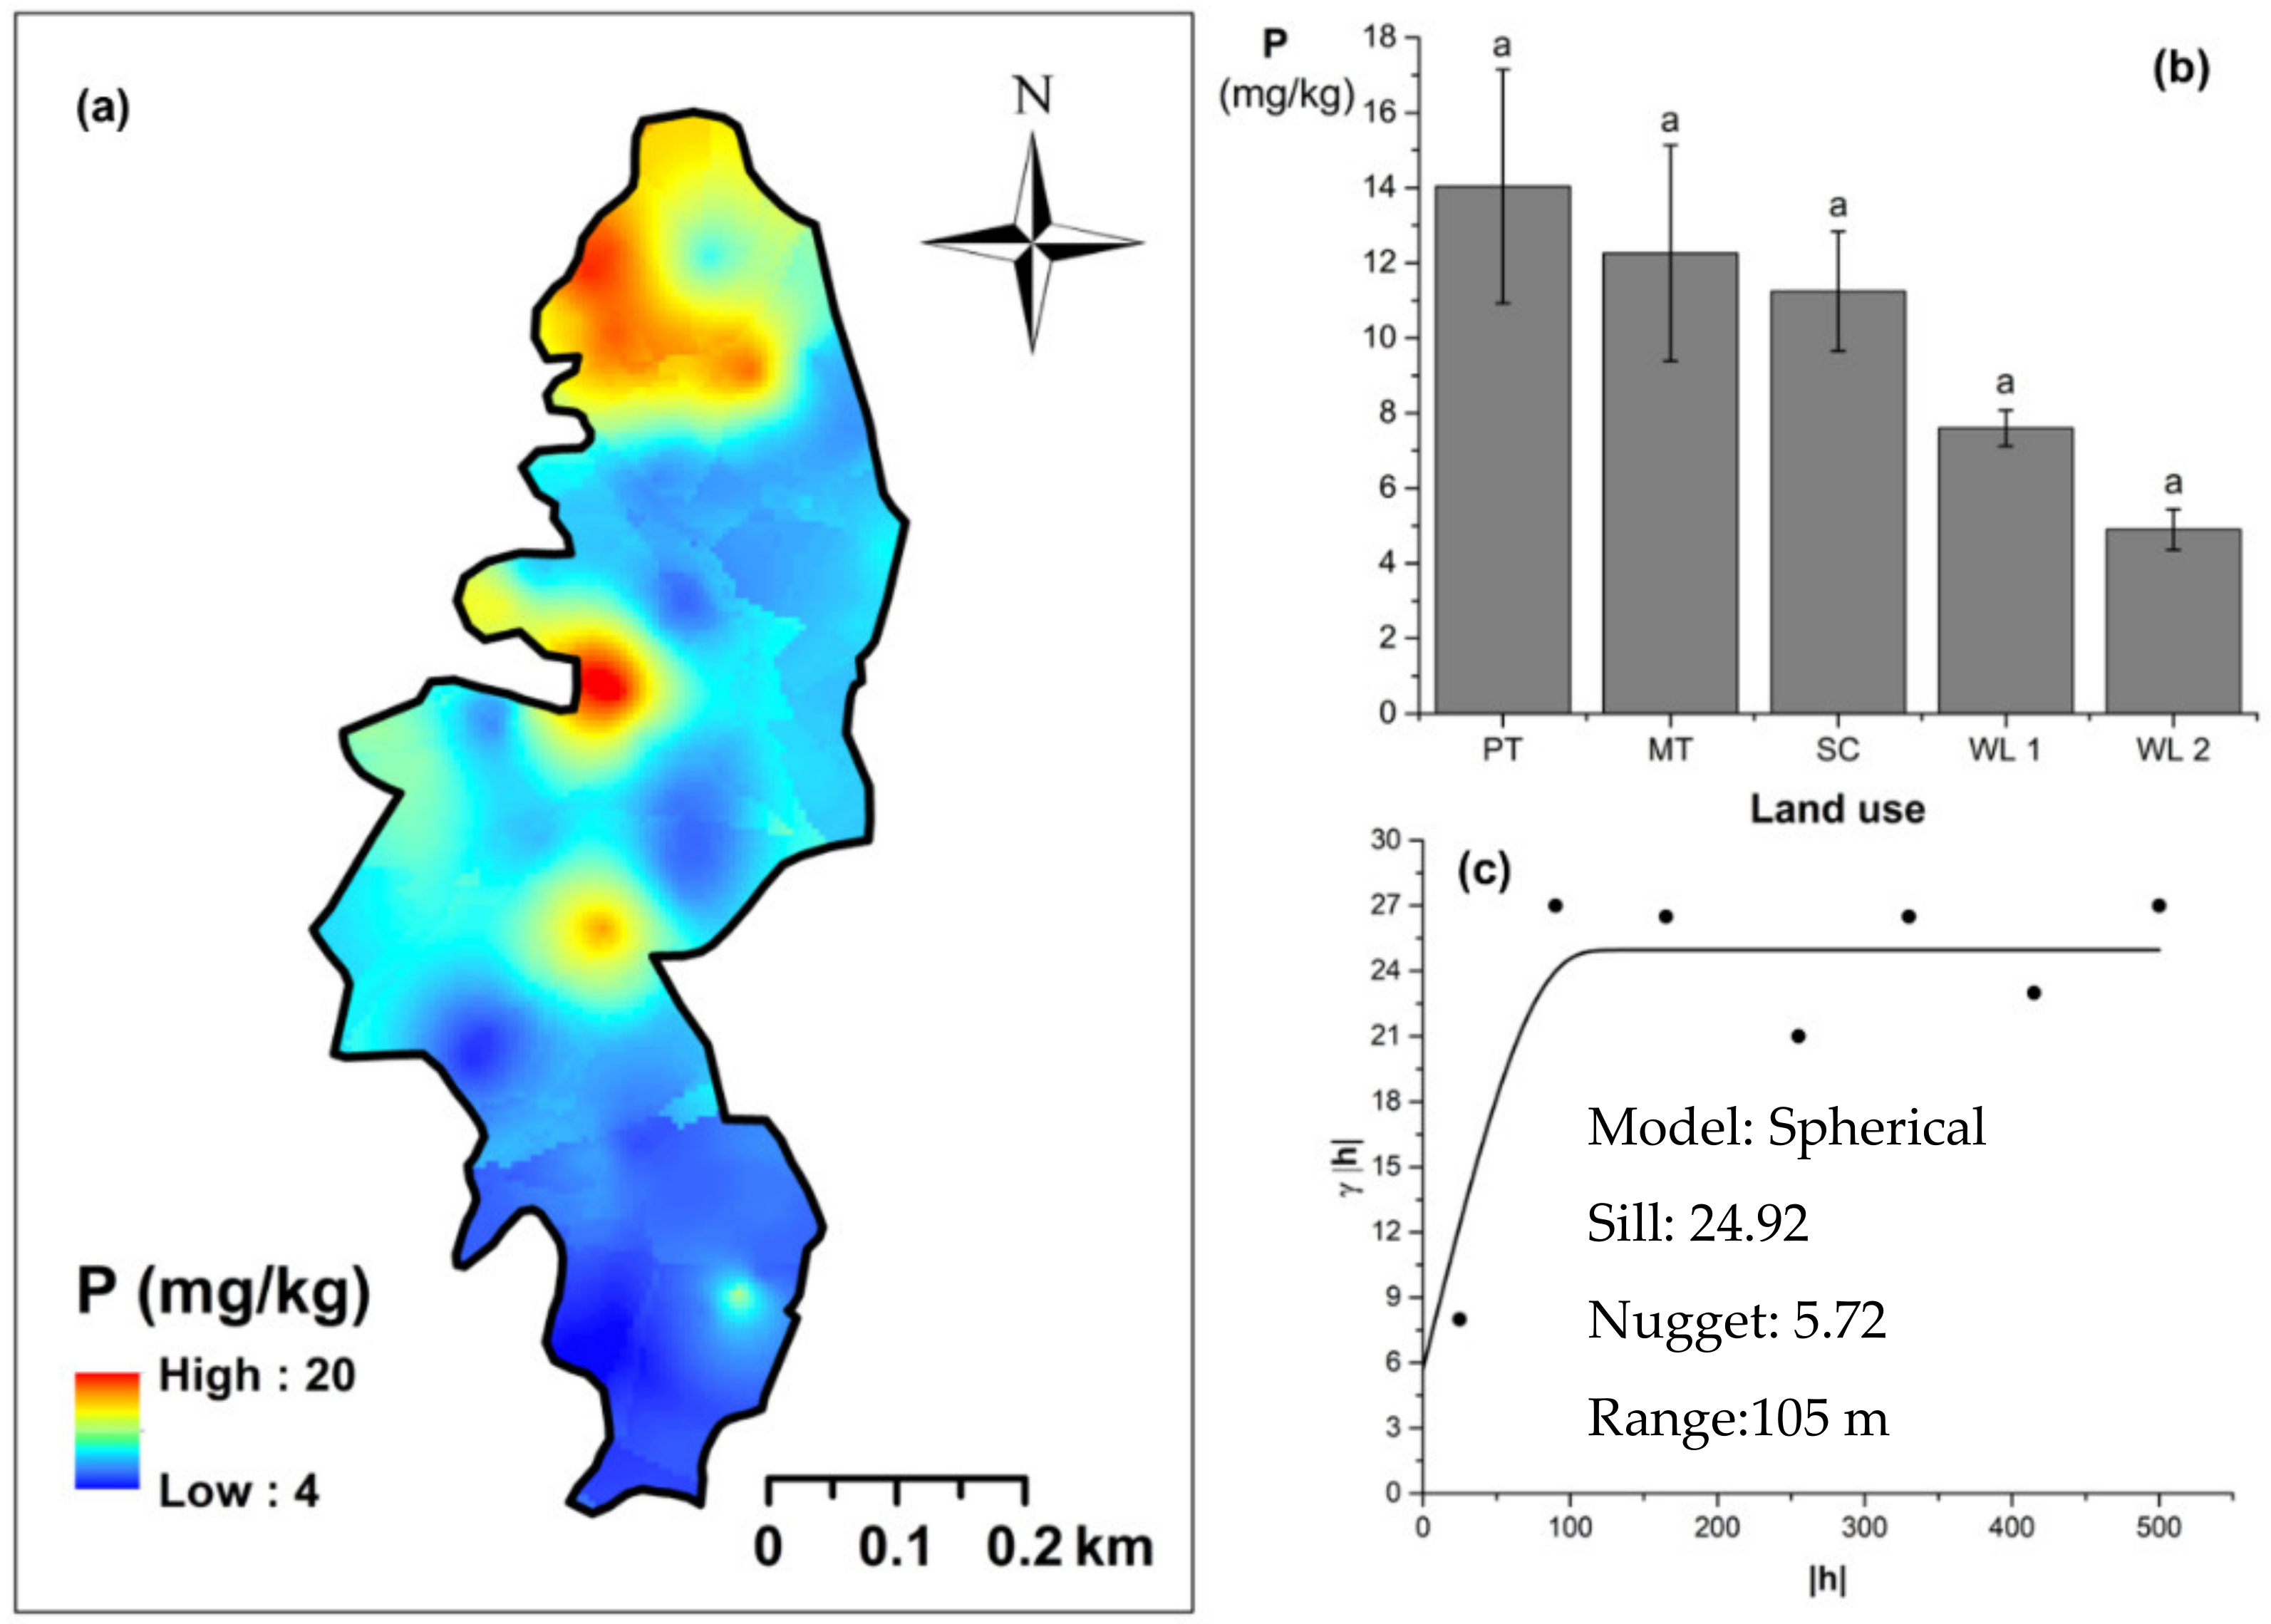
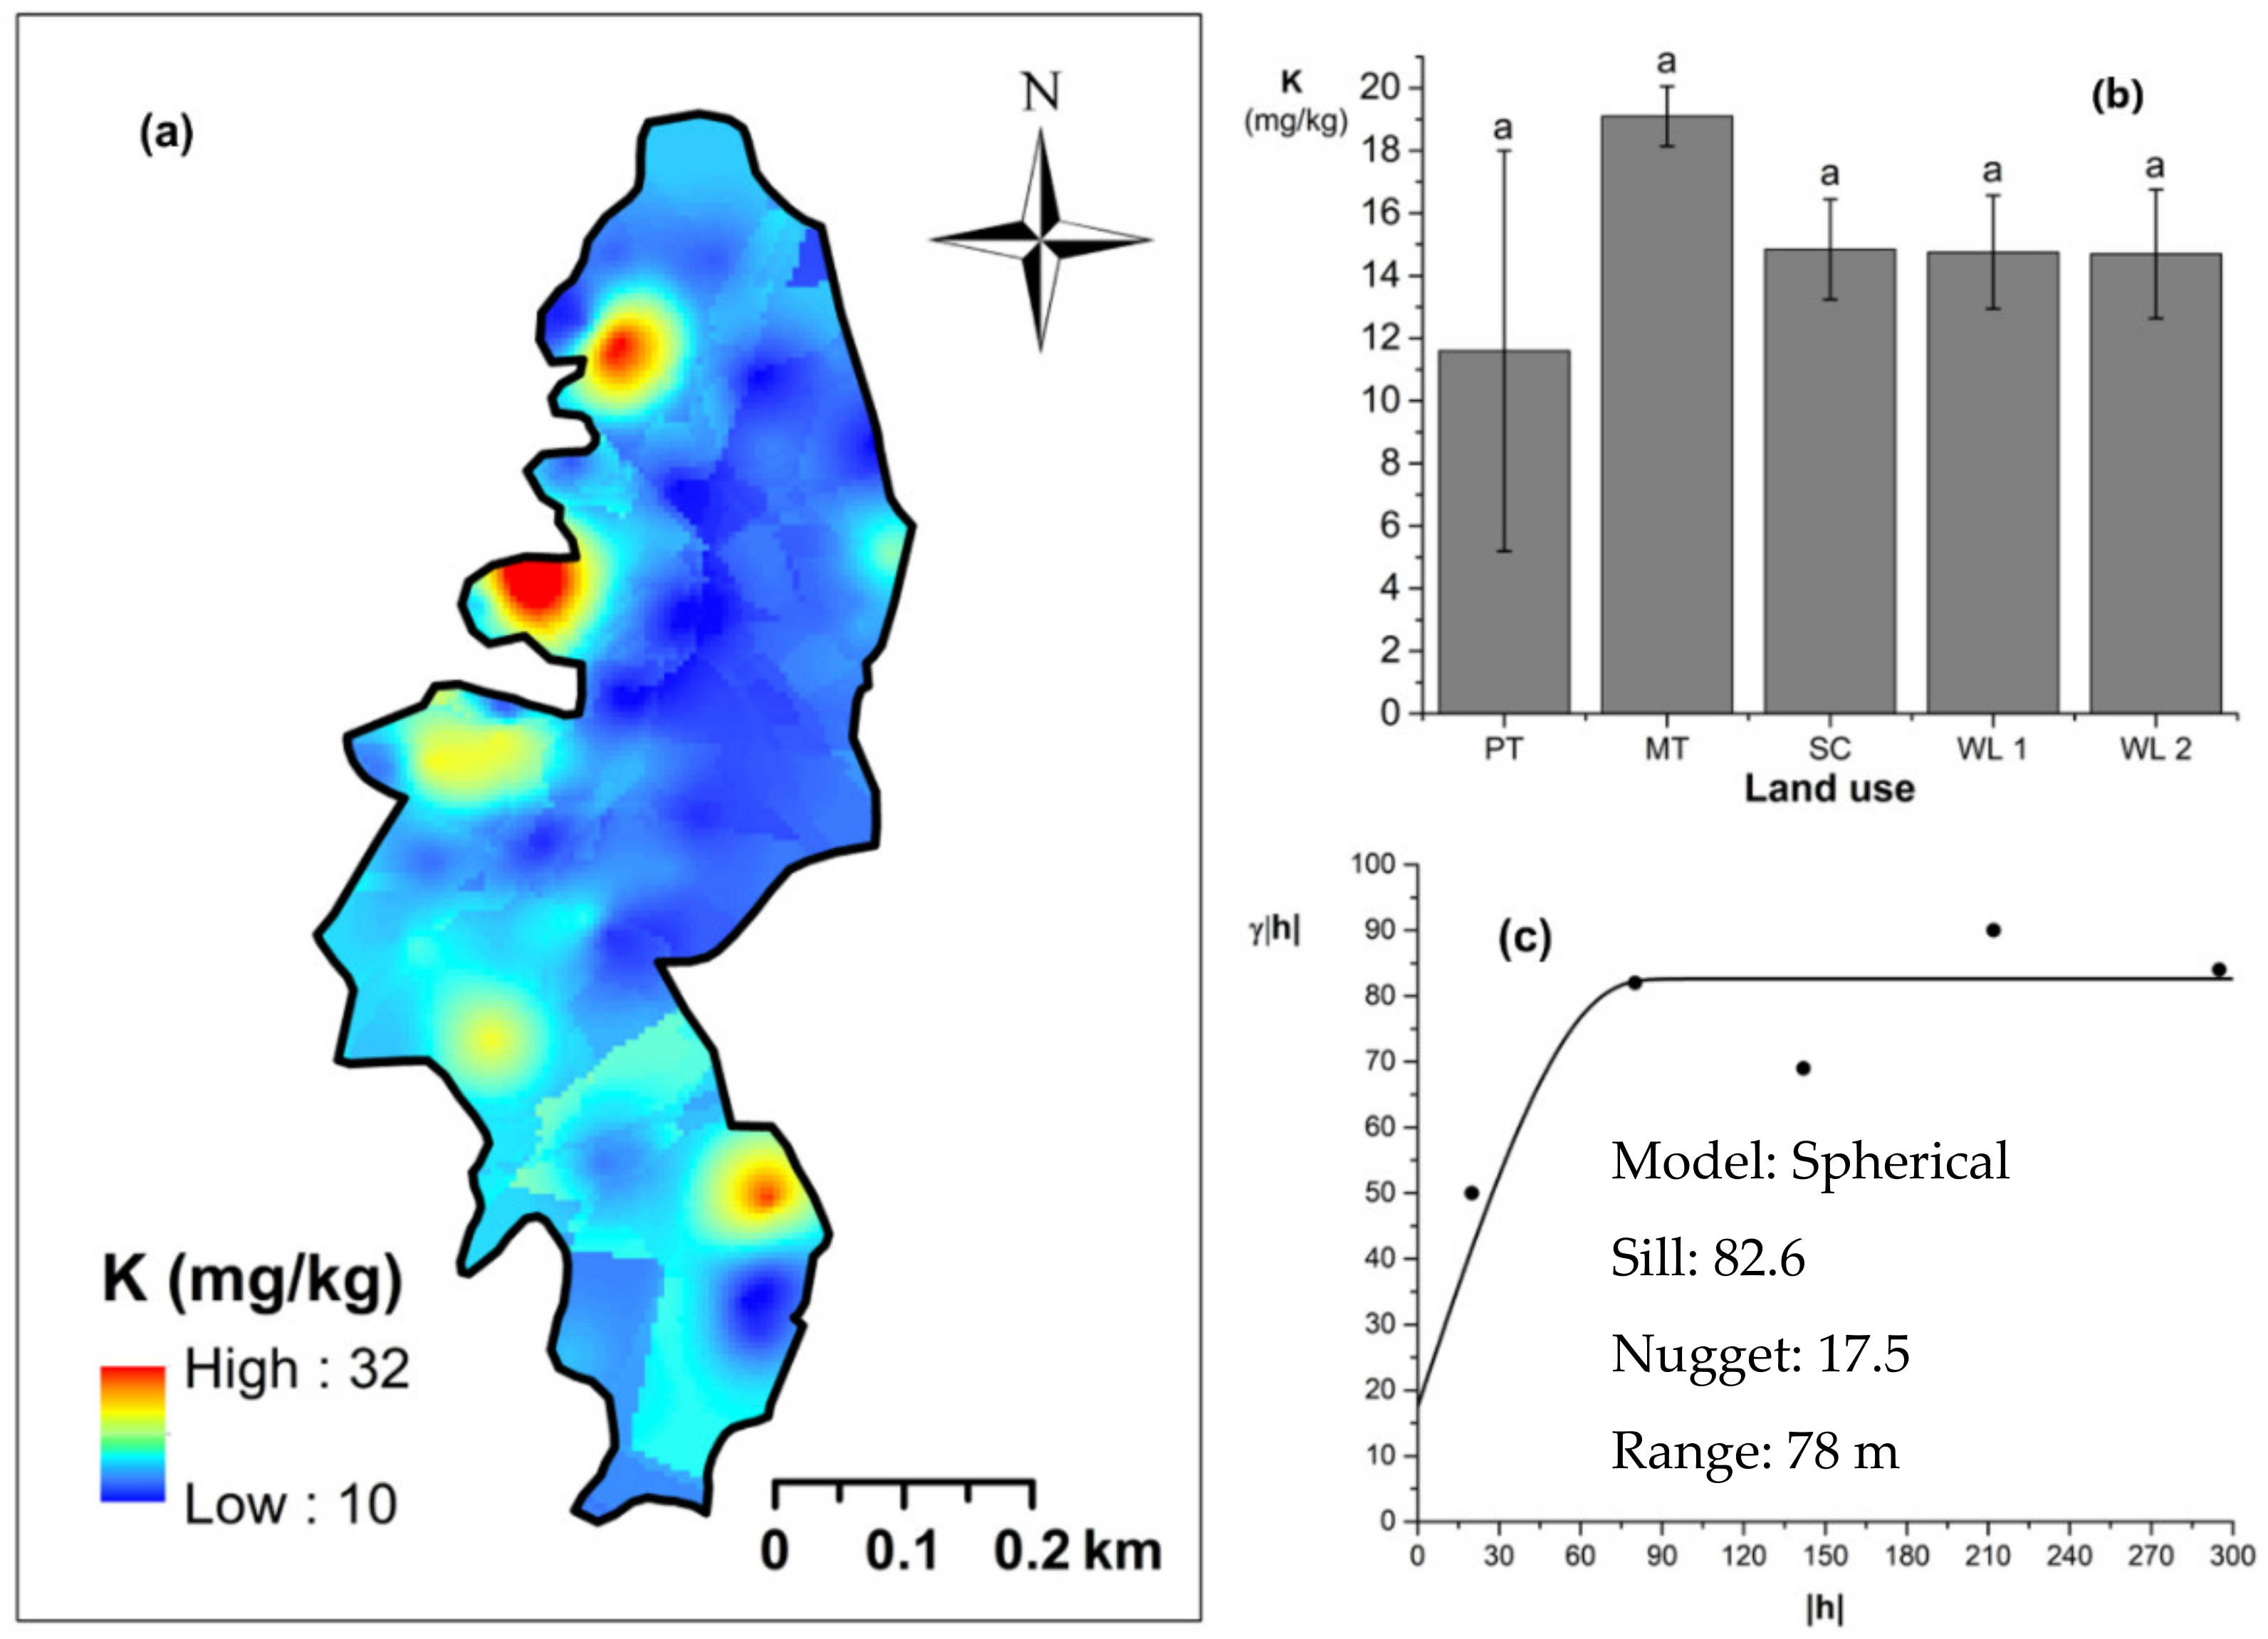
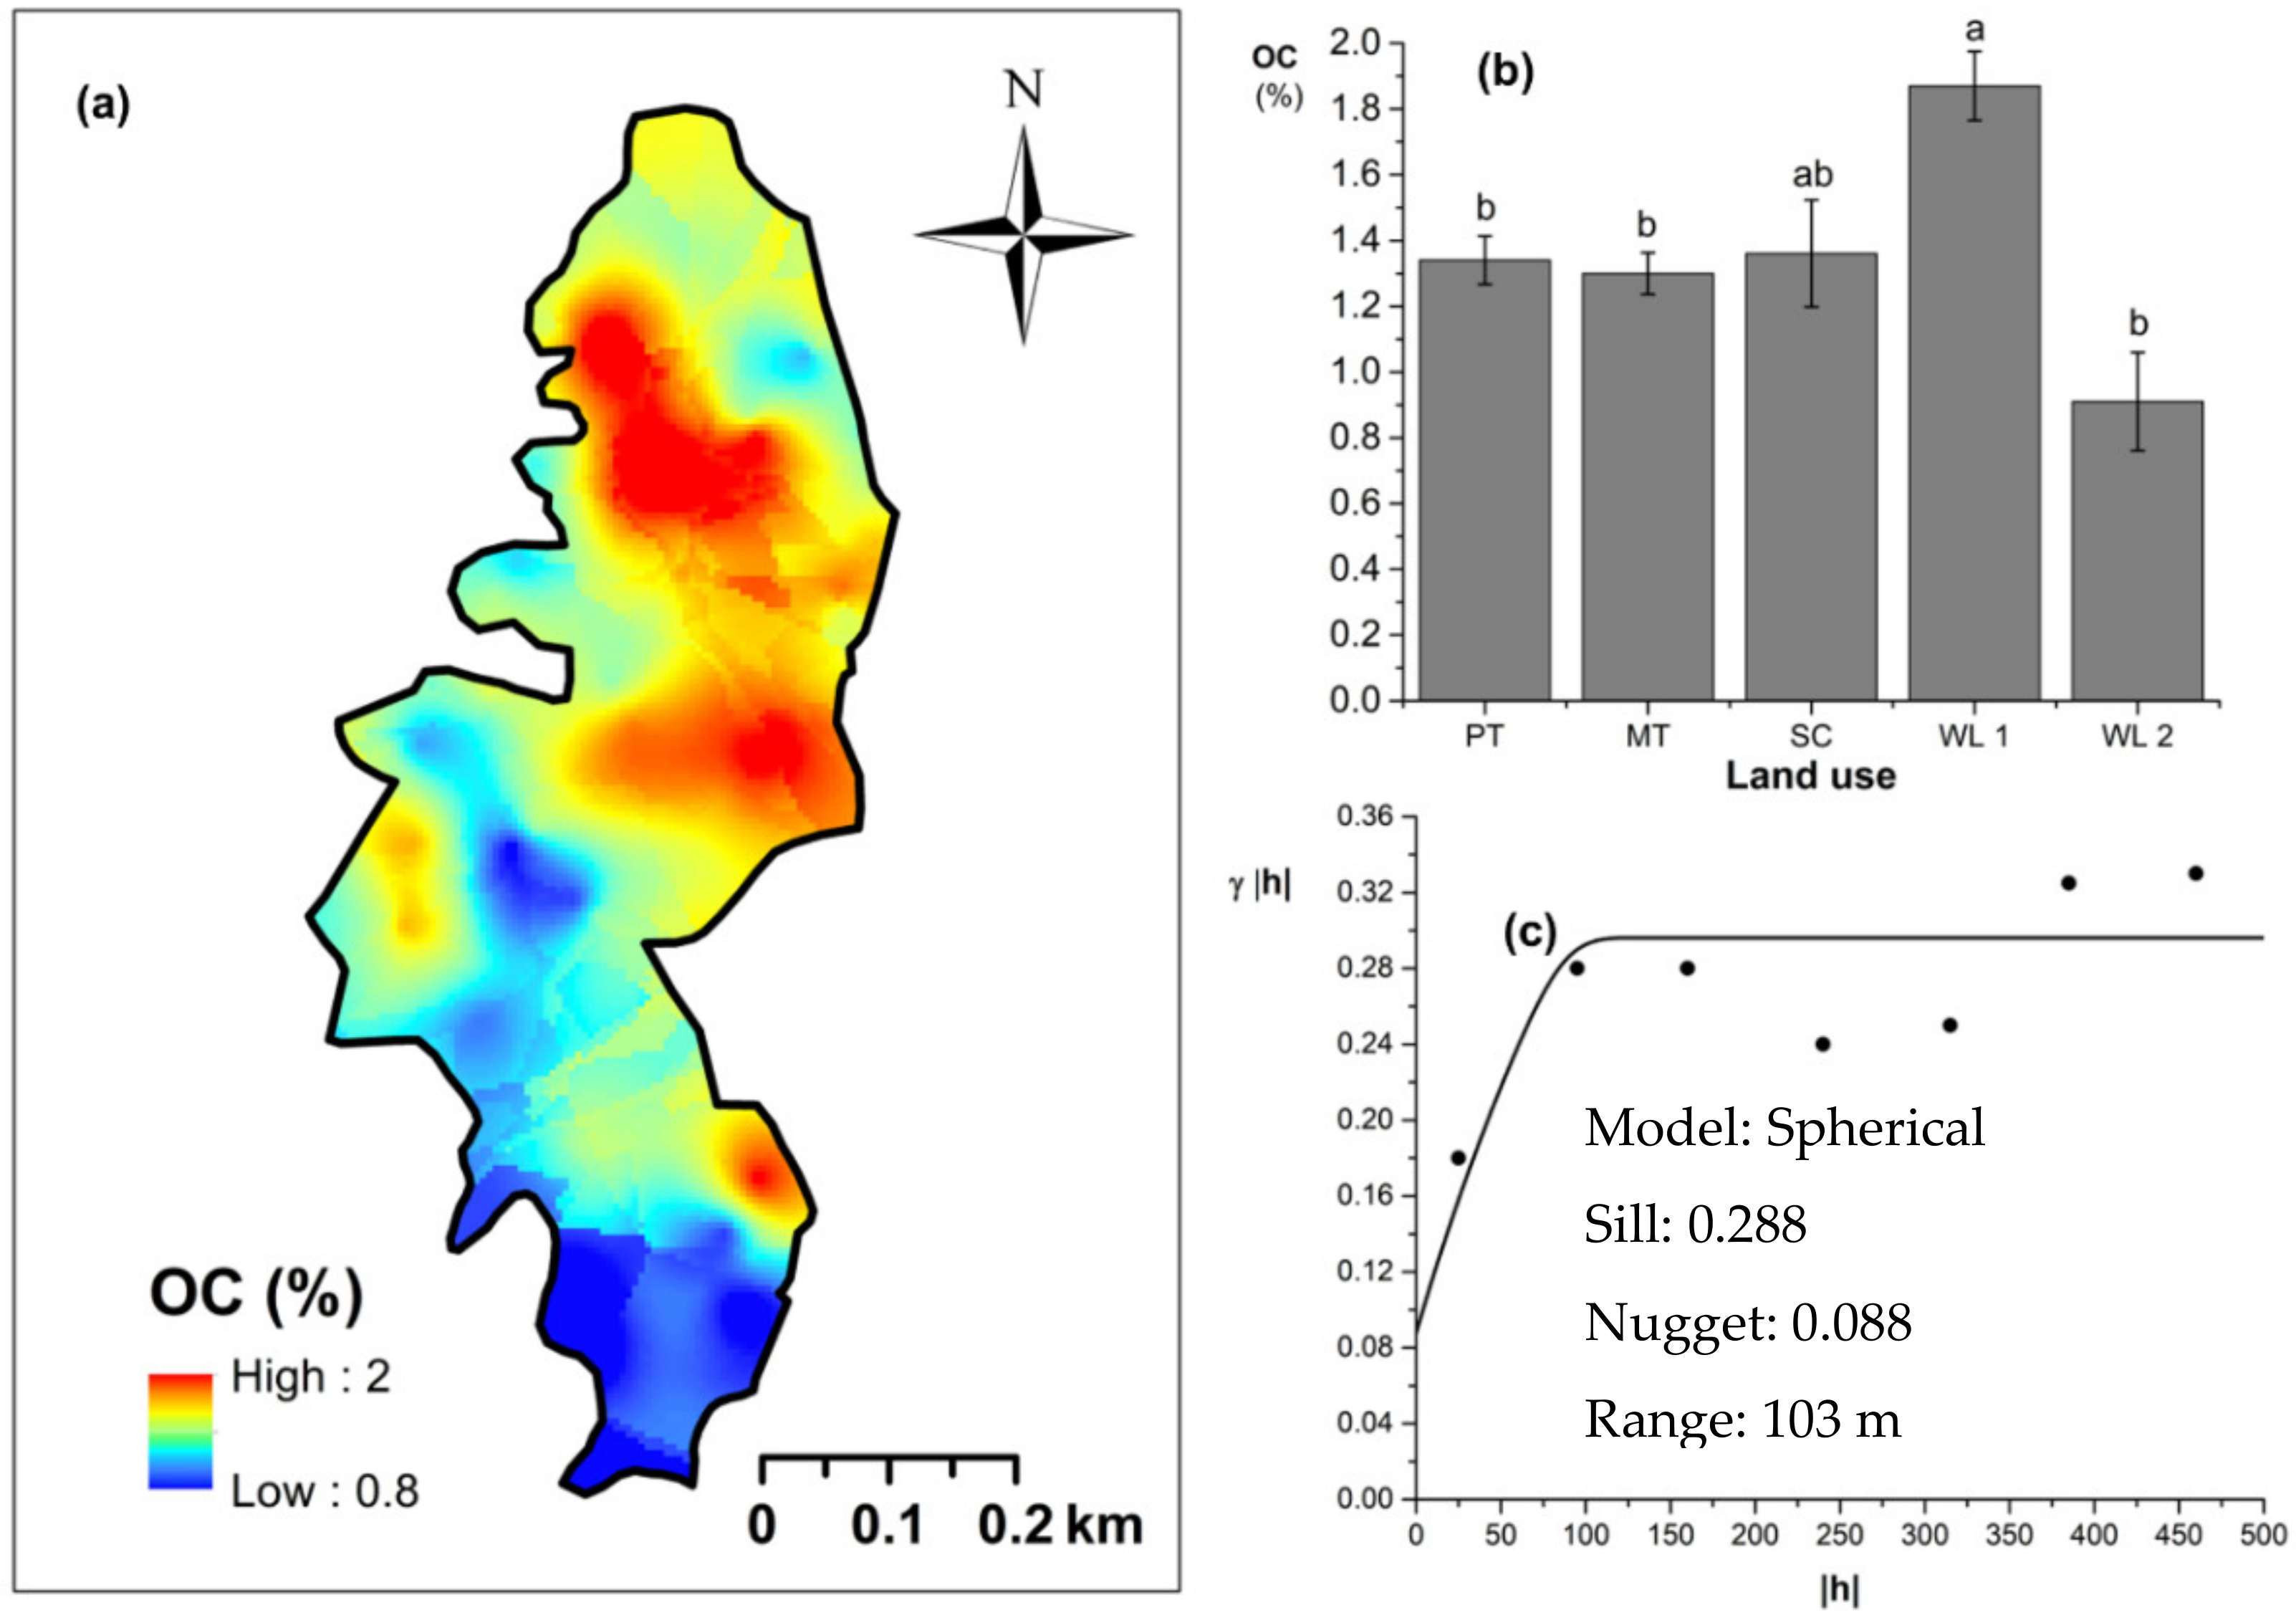
Soil TN content was significantly (p < 0.05) different among all four land uses (Figure 4). The highest and the lowest total N content were observed in scrub and WDs, respectively (Figure 4a,b). This variation appears to be mediated by the relative composition of N-fixing trees between the two groups. Comparatively moderate soil TN content was observed in productive and marginal tea, which was significantly (p < 0.05) different between the two types. A spherical variogram was best fitted for soil TN (Figure 4c). The range and RNE of the soil TN variogram were 273 m and 2.6%, respectively. The soil Av. P contents were higher among the tea-based land uses whereas the values observed in marginal tea and WDs were lower (Figure 5a–c). Even through these pair-wise comparisons were marginally significant, there was a clear directional and predictable change in the Av. P contents so that the most advanced age of the successional communities showed the lowest Av. P contents while the productive and marginal tea categories, where fertilizer is added, had higher Av. P contents (Figure 5b). A spherical variogram was best fitted for soil Av. P (Figure 5c). The range and RNE of the soil Av. P variogram were 105 m and 23%, respectively. Soil Ex. K contents were not significantly different among all four land uses (Figure 6a–c). The highest and the lowest Ex. K contents were observed in marginal tea and productive tea, perhaps because more potassium-based fertilizer is added to the marginal tea (Figure 7a–c). Comparatively moderate soil Ex. K content was observed in scrub and WDs with no significant post-hoc comparisons. A spherical variogram was best fitted for soil Ex. K. The range and RNE of the soil Ex. K variogram were 78 m and 21%, respectively. Soil OC% among the different land uses was not statistically significant in the study site (Figure 8a–c). However, the highest soil OC% values were observed in the WDs. A spherical variogram was best fitted for soil OC. The range and RNE of the soil OC variogram were 103 m and 30%, respectively.

Figure 4.
Spatial variability total soil nitrogen (total N): (a) map, (b) bar graph among different land uses (see Figure 1, label A for notations), and (c) variogram between lag distance and semivariance in the Endane Biodiversity Corridor, linking the Iharakanda Proposed Forest Reserve and Sinharaja Rainforest Complex in the Rathnapura District of Sri Lanka. Semivariance function: . Comparisons depicted by the different letters in the bars in subfigure (b) indicate significant pair-wise differences.

Figure 5.
Spatial variability of available phosphorous: (a) map, (b) bar graph among different land uses (see Figure 1, label A for notations) in the Endane Biodiversity Corridor, and (c) variogram between lag distance and semivariance. Semivariance function: . Comparisons depicted by the different letters in the bars in subfigure (b) indicate significant pair-wise differences.

Figure 6.
Spatial variability of soil exchangeable K: (a) map, (b) bar graph among different land uses (see Figure 1, label A for notations) in the Endane Biodiversity Corridor, and (c) variogram between lag distance and semivariance. Semivariance function: . Comparisons depicted by the different letters on the bars in subfigure (b) indicate significant pair-wise differences.
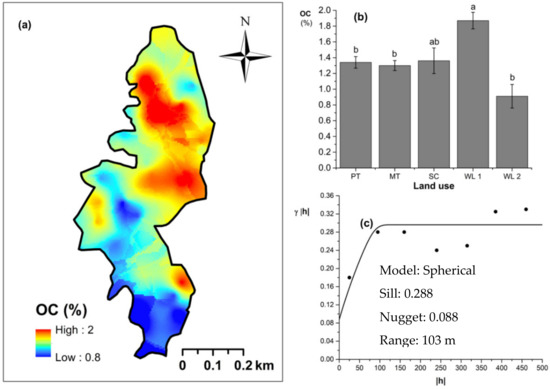
Figure 7.
Spatial variability of soil organic carbon (OC): (a) map, (b) bar graph among different land uses (see Figure 1, label A for notations) in the Endane Biodiversity Corridor (c) variogram between lag distance and semivariance, and (c). Semivariance function: . Comparisons depicted by the different letters in the bars in subfigure (b) indicate significant pair-wise differences.
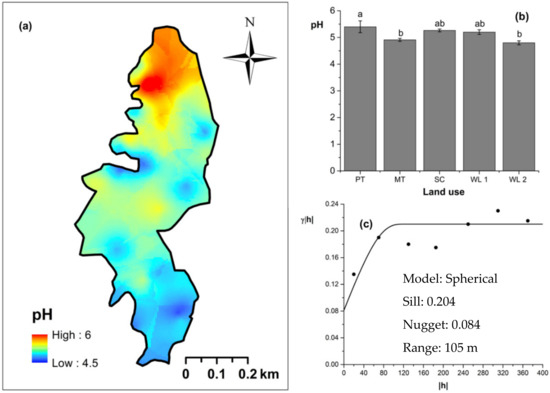
Figure 8.
Spatial variability of soil pH: (a) map, (b) bar graph among different land uses (see Figure 1, label A for notations) in the Endane Biodiversity Corridor, and (c) variogram between lag distance and semivariance. Semivariance function: . Comparisons depicted by the different letters on the bars in subfigure (b) indicate significant pair-wise differences.
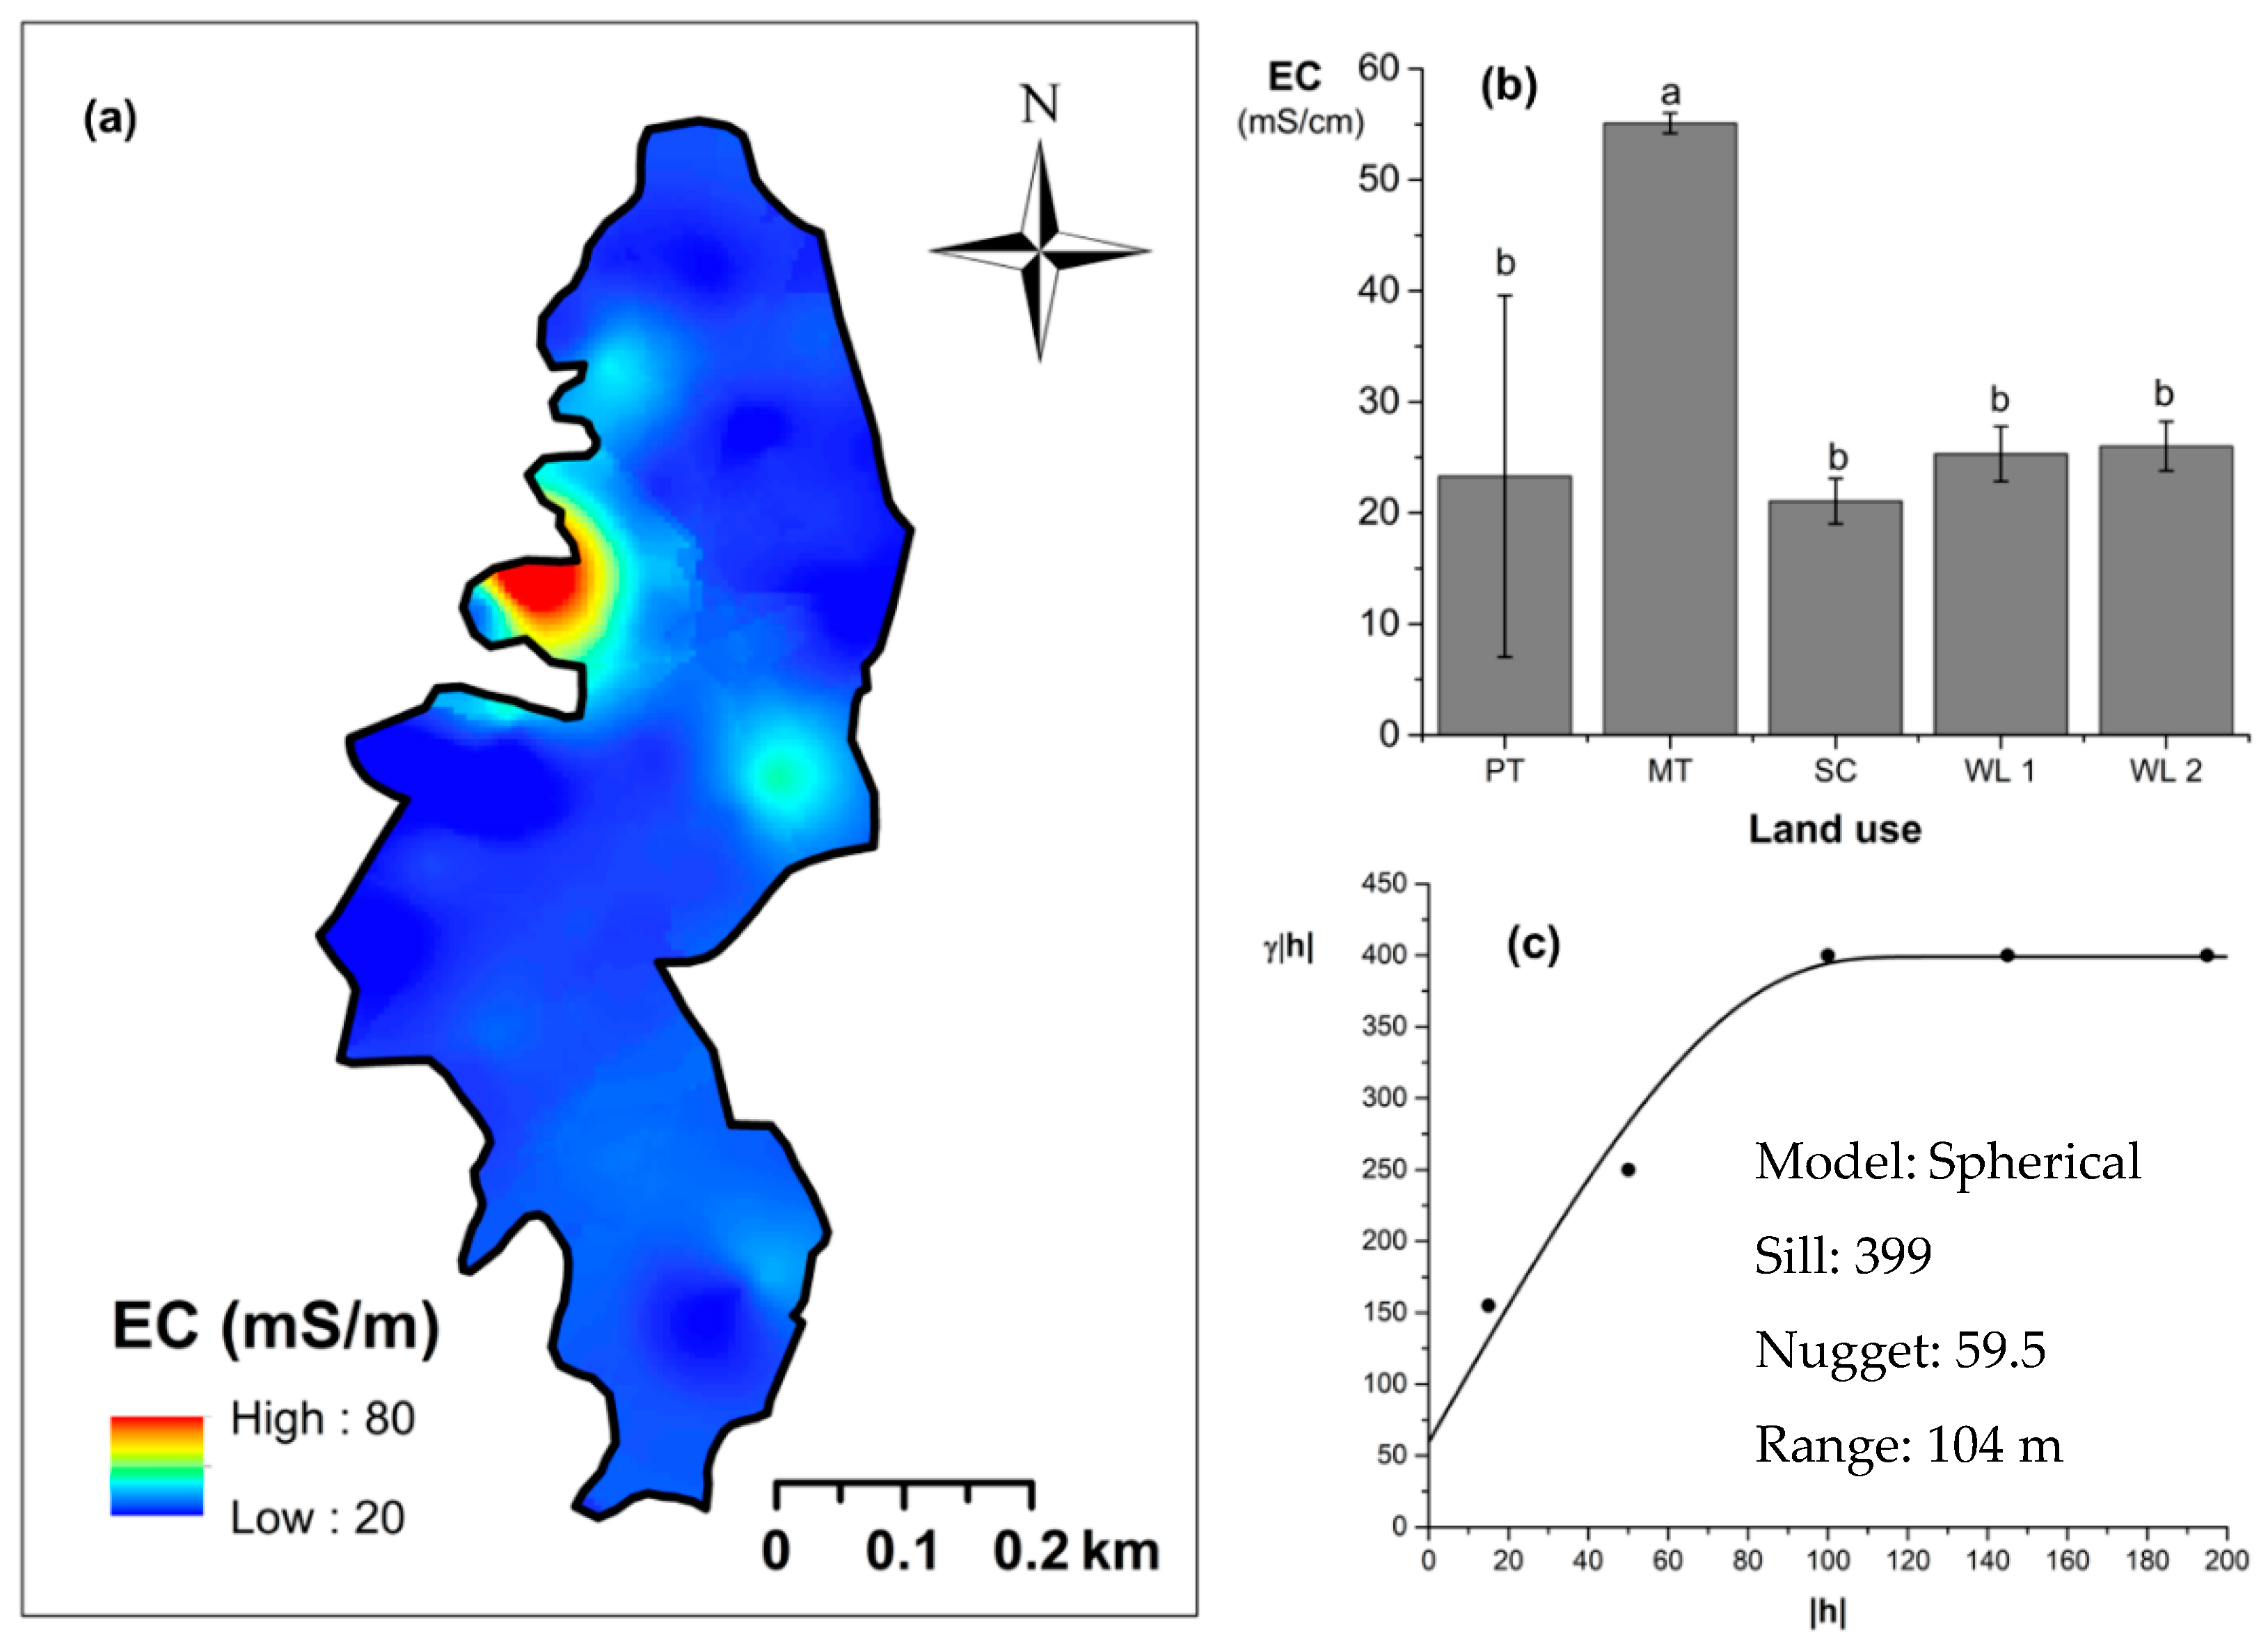
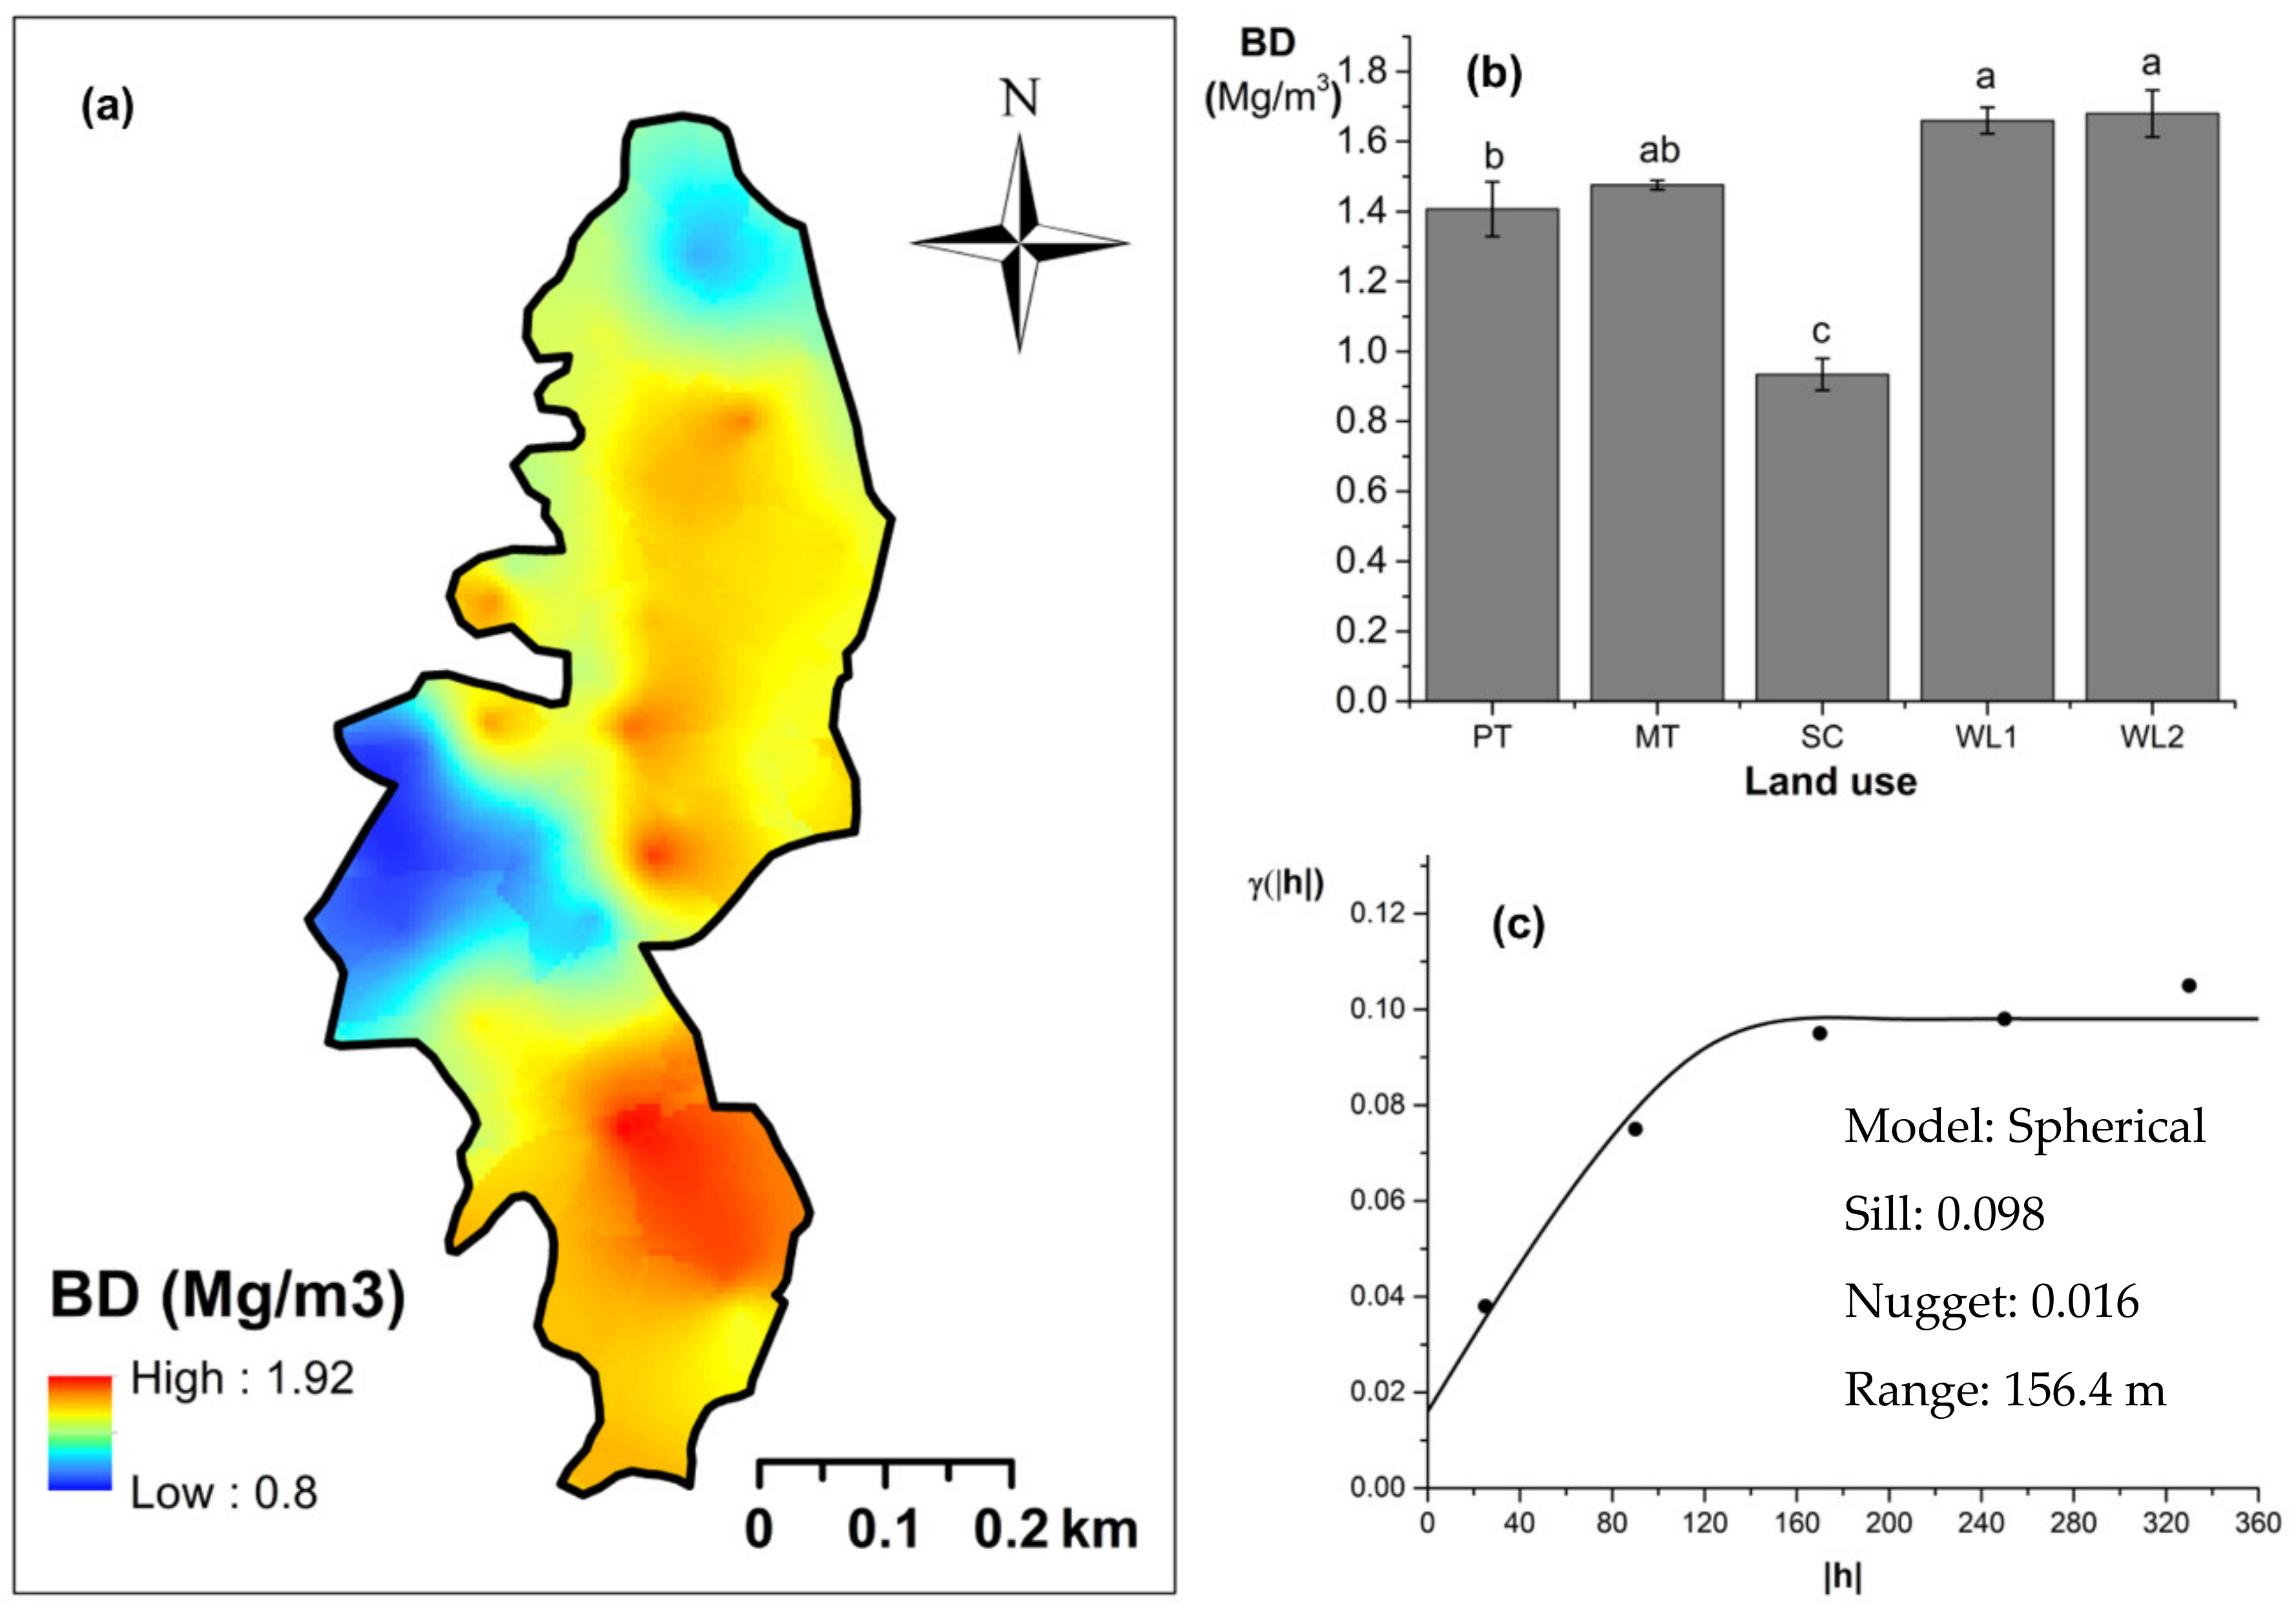
Overall soil pH in the study field showed an acidic nature (pH < 6.5). The highest and lowest soil pH values were observed (p < 0.05) in marginal and productive tea, respectively. Soil pH in scrub and marginal tea showed in between values. A spherical-shaped variogram was best fitted with four land uses. The range of the soil pH variogram was 103 m. According to the relative nugget effect (RNE) obtained through the nugget and scale ratio, it was 39% for the variogram of soil pH. The soil EC was significantly (p < 0.05) highest in productive tea in the study site (Figure 9a–c). Soil EC in other land uses were comparable and significantly (p < 0.05) lower in comparison to productive tea. There was a pocket of marshy area within woodland 1 where a relatively high EC value was observed (Figure 9a) A spherical variogram was best fitted for soil EC. The range and RNE of the soil EC variogram were 104 m and 15%, respectively. The highest and the lowest soil bulk density values were observed in the WDs and scrub, respectively (Figure 10a–c). Each was significantly (p < 0.05) different from the bulk density values of other land uses. Soil bulk density values in productive and marginal tea were in between those of the WDs and scrub. They were significantly (p < 0.05) different to each other and significantly (p < 0.05) different from bulk density values of other land uses. A spherical variogram was best fitted for soil bulk density. The range and RNE of the variogram of soil bulk density were 156 m and 16%, respectively.
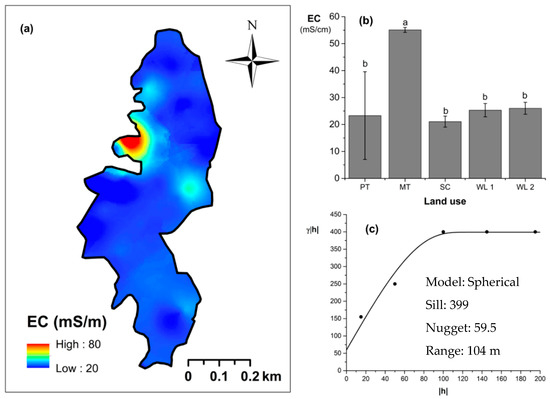
Figure 9.
Spatial variability of soil electrical conductivity (EC): (a) map, (b) bar graph among different land uses (see Figure 1, label A for notations) in the Endane Biodiversity Corridor, and (c) variogram between lag distance and semivariance. Semivariance function: . Comparisons depicted by the different letters on the bars in subfigure (b) indicate significant pair-wise differences.
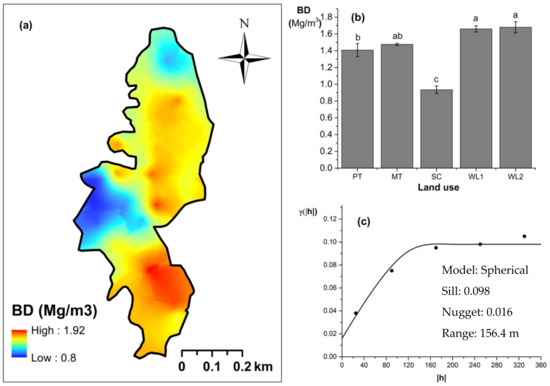
Figure 10.
Spatial variation in soil bulk density: (a) map, (b) bar graph among different land uses (see Figure 1, label A for notations) in the Endane Biodiversity Corridor, and (c) variogram between lag distance and semivariance, and (c). Semivariance function: . Comparisons depicted by the different letters in the bars in subfigure (b) indicate significant pair-wise differences.
3.3. Vegetation Analysis in Relation to Soil Parameters and Landu Use Categories
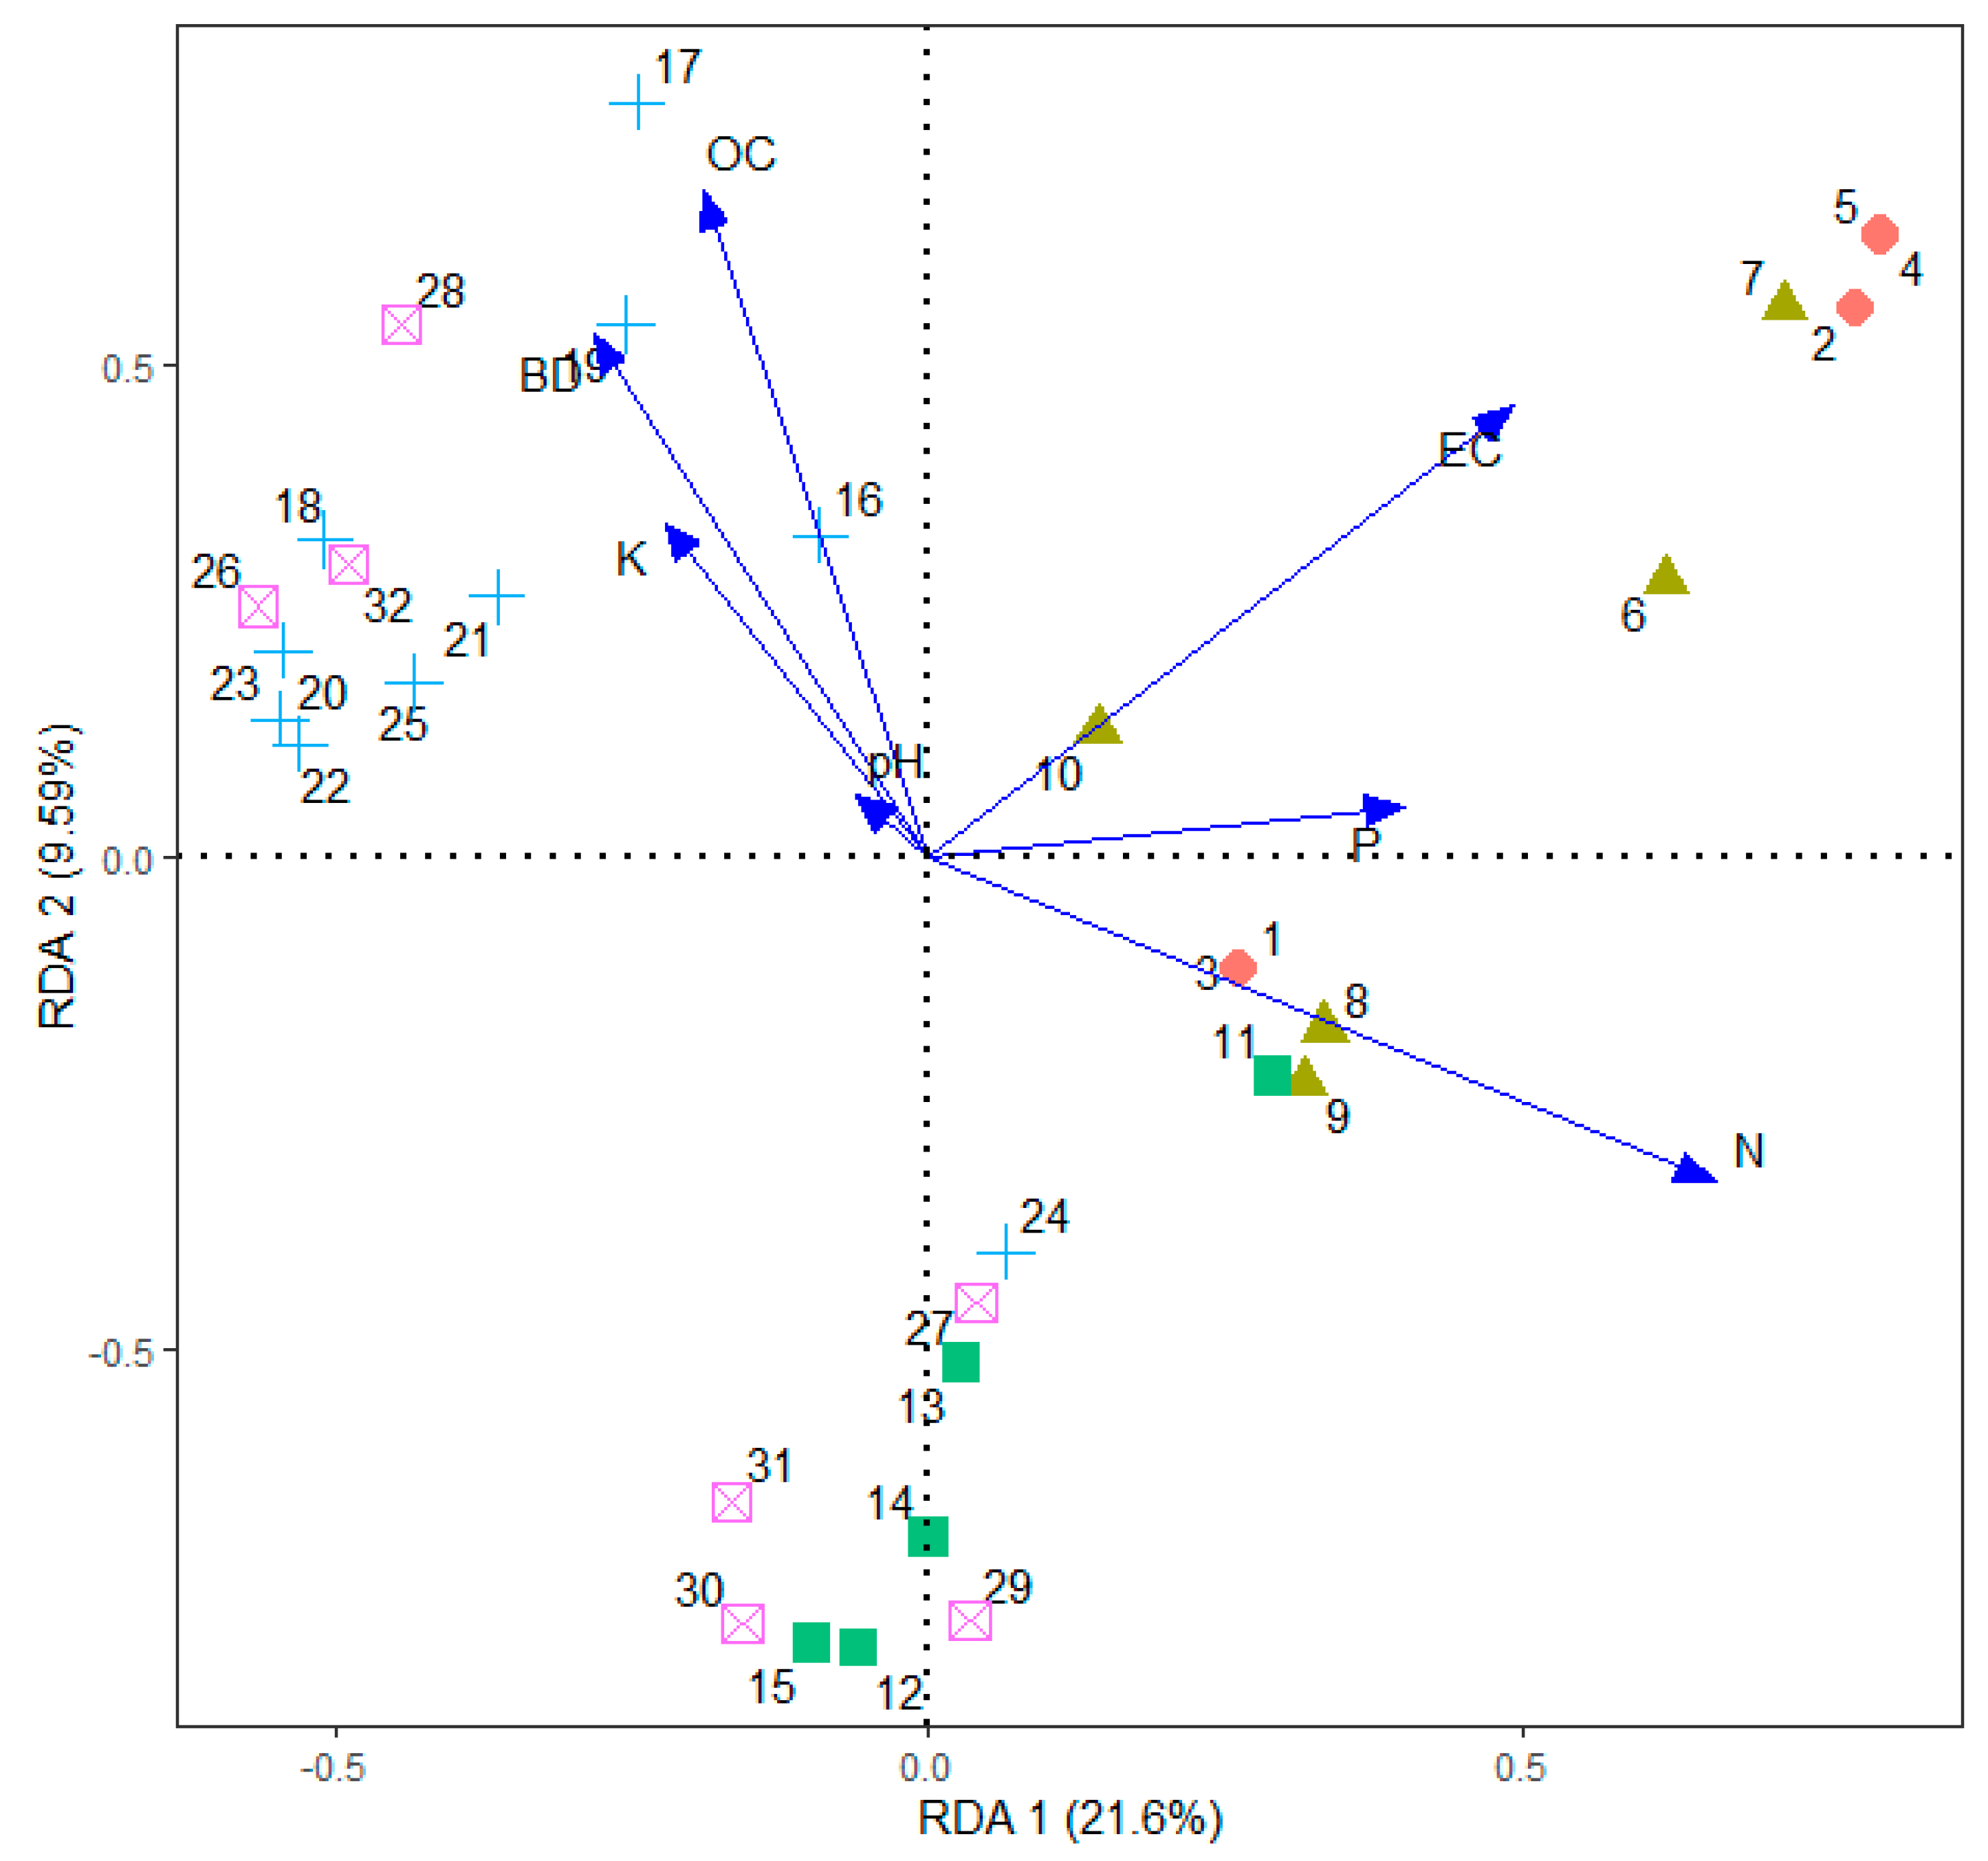
Redundancy analysis of soil factors was displayed in a biplot (Figure 11). The first RD axis was strongly constrained with total N, EC, and available P. The second axis was loaded with soil OC and bulk density. These patterns corresponded with the spatial variation of soil parameters and the land use categories. High concentration of available P, total nitrogen, and EC appeared to be closely associated with the sites that were frequently fertilized, confirming the results of unbalanced ANOVA. Likewise, the vegetation in the two types of WDs were closely associated with high soil OC and high bulk density of soil.
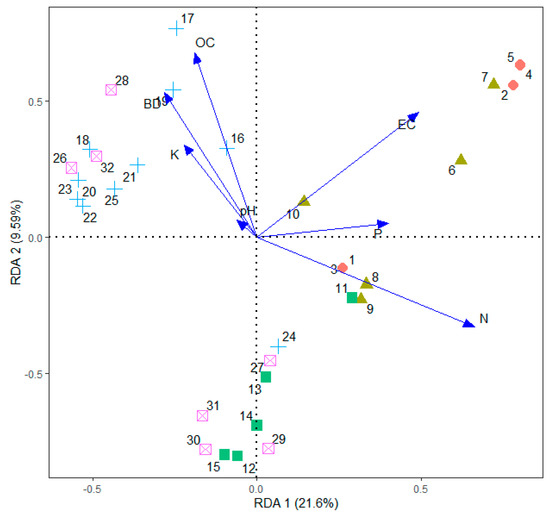
Figure 11.
Redundancy analysis biplot for 32 sampling quadrats constrained by six soil parameters (represented by arrows). Sampling quadrats: solid-circles 1–5 are productive tea, solid-triangles 6–10 are marginal tea, solid-squares 11–15 are scrub, pluses 16–25 are WD1, and crossed-squares 25–32 are—WD2 in the Endane Biodiversity Corridor.
4. Discussion
4.1. Restoration of Floristics Diversity, Abovegound Biomass, and Canopy Cover
We found that natural regeneration had restored tree diversity in the scrub vegetation after three years and in WDs within nearly 15 years (Figure 2). The sites with medium levels of disturbances showed high diversity, which is partly explained by the intermediate disturbance hypothesis that predicts species richness is the highest at intermediate levels of disturbance [32,33,34]. In tropical forests, variation in disturbance could be due to frequency, extent, intensity, duration, or time disturbance events [35]. It is obvious that most of the tree species are locally absent in this tea plantation. Similar to the buffer zone of the Sinharaja and Kanneliya Forest Reserves where encroachment for tea cultivations reduces the vegetation cover and tree diversity [36,37], peripheral areas of SRC and IPFR are also being encroached for smallholder tea gardens.
Under low light conditions, the light demanding evergreen species may fail to photosynthesize at their optimum level [38], leading to high seedling mortality among light demanding species. M. peltata, under a 10% light regime in the evergreen forests of Kerala, India, is attributed to this factor [39]. However, for optimal functioning of photosynthesis, light demanding evergreen species may possess the ability to absorb light when light is relatively lower than what is required [39]. Mallotus tetracoccus, M. peltata, Croton malabaricus, and Leea indica have been identified as light demanding tree species compared to shade tolerant species [39]. Light demanding trees include M. peltata, Alstonia macrophylla, Mangifera indica, S. cohinchinensis, and Leea indica facilitate regeneration of other tree species beneath their canopy [40]. In tea plantations, fast growing G. sapium (Jacq.) Walp. [Wetamara (S)] and Albizia odoratissima (L.F.) Benth. are used to provide shade for tea to protect bushes from high intensity light. There was high canopy closure in the scrubs and the WDs compared to tea-based land use categories, suggesting the possibility of introducing mid successional species following principles of relay floristics to the scrubs and the WDs [41].
Based on our results, it is best to first establish plants capable of growing fast and provide more shade to the study area. Some such examples are Trema orientalis L., M. peltata, Osbekia octandra, and A. macrophylla. After several years, they grow and provide opportunities for a second lap in succession by providing enough shade and conserving soil and water while accumulating organic matter. High shade enhances the growth of seedlings and saplings of shade tolerant species [42]. The key to restoration of abandoned tea lands in this corridor is to first establish early successional forest species that grow well in this locality. Then, when they provide shade gradually, after about a year or two, other species can be introduced underneath the shade of these species. Light demanding species, which often grow on forest edges, can then replace the pioneers after several years.
In our study, tea lands and the scrub had lower AGB in comparison to the WDs, as we expected. We found significant differences between land use categories and AGB estimates produced by allometric equations. High values of AGB in WD1 was due to the high value of stem density of trees compared to other land use categories. When compared with the tropical rainforests in the same region (Sinharaja undisturbed primary forest: 357.9 Mg ha−1), there is a high potential to sequester more carbon in our study site [43]. Likewise, an evaluation of the change in forest structure and AGB in forest restoration sites in Western Ghats, India found that forest restoration sites had 49.0–89.8 Mg ha−1 in comparison to the 287.6 Mg ha−1 reported from contiguous forests in the region [44].
4.2. Proximity to the Sinharaja Rainforest Complex Facilitates Regeneration
Natural regeneration is the most economical way of restoration as it allows for the successful establishment of trees naturally [45]. In our study, the distance from natural forests was one of the major factors affecting species richness. Our site is located adjacent to the Sinharaja Rainforest Complex where a high species richness is recorded. Low severity of disturbances and efficient seed dispersal from this protected area situated in a close proximity should be among the reasons for the arrival of more species into the WD1. Natural regeneration alone, however, is insufficient for effective restoration of sites away from natural forests [46] because they are influenced by complex interactions of various factors including edaphic conditions, amount and species composition of seed rain, and levels of seed and seedling predation [46]. Therefore, we recommend enrichment planting for sites such as scrub and WD1 to accelerate the rainforest succession.
4.3. Land-Use Type and Soil Parameters along the Successional Chrono-Sequence
We used the coefficient of variation (CV) to describe the spatial variability of soil properties [47]. According to a standard CV classification framework [48], soil pH, BD, and OC showed lower spatial variability (CV < 12%). Soil Ex. K and Av. P revealed moderate variability (12% < CV < 60%) and soil EC and TN revealed higher spatial variability (CV > 60%). We used the relative nugget effect (RNE = nugget/sill), which is calculated as a percentage, to indicate the proportion of spatially unstructured variation in relation to the total variation observed [49]. According to a proposed RNE classification [30], strong structured (25% > RNE) spatial variability was observed for EC, Ex. K, BD, TN, and Av. P. Moderately structured spatial variability (25% < RNE < 75%) was observed for OC and pH. Moreover, we conducted a variogram analysis that indicated the spatial dependence of soil parameters against horizontal distance on land. In compliance with the published literature, all the measured soil parameters were best fitted with spherical shaped variograms, validating our results [50]. This analysis further revealed greater ranges (>150 m) for TN and BD. The ranges of EC, OC, pH, and P ranged from 103 m to 105 m, suggesting a low variability for these soil properties. The lowest range (78 m) was reported for Ex. K. These results revealed that structured spatial variability of Ex. K in comparison to other soil properties was spatially dependent on a short distance.
The redundancy analysis revealed a close association between the species–environment relationship. The first two axes cumulatively explained 31% of the variation in the species abundance and distribution. Our a priori classification of three non-tea land uses (i.e., scrub and the two WDs) were not clearly separated in the redundancy analysis, rather, they were aggregated to a major clusters separated by bulk density, organic carbon, and to a lesser extent by total N.
4.3.1. Soil Total Nitrogen
Soil nitrogen is a key element that determines the primary productivity and soil fertility of ecosystems [51,52]. Soil TN refers to the summation of both organic and mineral N [53]. High mobility and microbe-mediated reactions related to N dynamics leads to greater spatial and temporal variability of soil TN [54]. Soil N retention of forest soils is determined by both biotic processes (e.g., N mineralization, biotic N immobilization, and N fixation) and abiotic processes (e.g., NH4+ retention by 2:1 clay minerals and organic matter) [55]. Spatial differences of these processes may be related to the variation in soil TN at the study site. Higher soil TN was observed in scrub area, where N-fixing leguminous species are abundant, in comparison to other land uses. Moderate soil TN values were observed in inorganic-fertilizer-applied tea lands. Low TN values were observed in WDs.
4.3.2. Soil Exchangeable Potassium
Potassium is an important macro nutrient required for the growth and development of higher plants. It is also considered to be one of the major basic cations in soil [56]. Both inherent (releasing K from soil containing minerals) and external supply of K (through inorganic fertilizer and other organic amendments) contribute to exchangeable K reserves in soil [57]. Significant differences were not observed among soil Ex. K content among different land uses. Moreover, higher soil Ex. K values were observed in inorganic-fertilizer-applied productive tea lands in comparison to other land uses.
4.3.3. Soil Available Phosphorus
Phosphorus is a non-metallic element that is considered as an important macro-nutrient required for the growth and development of higher plants [58]. Moreover, it is considered to be the most conserved and limiting nutrient in tropical forest ecosystems [59,60]. Many studies have highlighted the significance of soil P for forest productivity and function. Soil Av. P content shows a positive correlation to net primary production in tropical forest ecosystems [61], soil N fixation, and soil N availability in terrestrial ecosystems [62,63]. The comparable results for soil Av. P content of tropical rainforests in Panama and the Amazon Basin are reported [64]. Soil P availability is determined by factors such as soil pH, soil mineralogy, organic matter, and placement of P fertilizers [56]. Spatial heterogeneity of these factors might lead to variations of soil Av. P across the study site. High Av. P values were observed in tea lands due to continuous application of inorganic fertilizer. Low Av. P values were observed in the WDs.
4.3.4. Soil Organic Carbon
The measurable component of soil organic matter (SOM) is indicated by soil organic carbon. Soil organic carbon is a key soil parameter determining soil health, influencing ecosystem productivity and is an indicator of soil-related ecosystem services: carbon sequestration, water retention, soil fertility, and erosion control. Moreover, SOM plays an important role in a variety of physical, chemical, and biological functions including aggregation, soil reaction, and ion exchange and nutrient cycling in addition to supply of food and energy to soil biota [65]. Van Bemmelen factor (1.724) is conventionally used to convert OC to SOM [66]. Thus, SOM in the study field ranged from 0.59% to 4.65%. The average SOM of primary and secondary forests in Ultisols is estimated to be 1.2%, respectively [65]. Therefore, SOM in the study site is beyond the average SOM of forest soils in Ultisols.
4.3.5. Soil pH
Overall soil pH in the study field showed an acidic nature (pH < 6.5) due to leaching of basic cations [67]. The values correspond to the forests in the wet zone of Sri Lanka, where high rainfall (>2500 mm) is experienced. Moreover, soil becomes acidic due to many reasons such as acidic parent material, organic matter, aluminum content, dissolution of carbon dioxide and low content of clay minerals in soils. Application of liming materials is a common agronomic practice in tea soils of Sri Lanka [68]. Continuous application of liming materials in marginal tea lands may have resulted in higher pH values in comparison to other land uses.
4.3.6. Soil Bulk Density
Bulk density indicates soil suitability for root penetration and permeability for different ions that are important for smooth functioning of the soil–plant–atmosphere continuum [69]. This soil parameter also indicates the relative porosity and compaction of soil [70]. The bulk density of uncultivated soils (forest and grassland soils) generally range between 0.8 Mg m−3 and 1.2 Mg m−3 [70]. The lowest BD values were observed in scrub areas of the study site where most of the sampling locations were dominated by fast growing pioneer species and infested with invasive species with high leaf turnover rates: Panicum maximum, Lantana camara, and Sphagneticola trilobata. The rapid leaf litter influx might have improved the soil structure in the scrub, leading to lower BD values. In contrast, higher soil BD values were observed in WDs of the site, which had previously been tea lands. The soil compaction that occurred during long-term cultivation of tea appears to be not improved in the WDs. Soil BD values of marginal and productive tea areas were comparable with those of agricultural lands reported in the literature (1.2–1.8 Mg m−3) [70]. Many factors such as soil texture, soil organic matter, the density of soil mineral, and their packing arrangement and depth in soil profile affect soil BD [70,71]. Differential influences of these factors across the study field resulted in moderate spatial variability of soil BD among different land uses of the study site.
4.3.7. Soil Electrical Conductivity
Soil of the study site belonged to the non-saline soil category according to Smith and Doran’s saline soil classification [72]. Soil EC is a measurement of dissolved salts in soil [56]. Soil dissolved salt content is determined by soil inherent factors (e.g., soil texture and mineralogy) as well as other external factors (e.g., climate and anthropogenic activities) [70]. A considerable number of agricultural inputs such as inorganic fertilizers and liming materials (i.e., dolomite) was received by productive tea lands. Thus, higher soil EC values in productive tea areas revealed that application of agricultural inputs such as fertilizers and liming materials has increased soil EC, contributing to soil spatial variability among different land uses of the study site.
A considerable soil spatial variability was observed in the study site with respect to each measured soil parameter. Land use pattern and anthropogenic activities are the key factors governing spatial variability of each soil parameter measured. The recovery of many of the soil parameters measured indicate the resilience of soils to the long-term changes in vegetation and land use patterns. The soil health of scrub and WDs have recovered up to a considerable level after 3–15 years of abandonment. However, the restoration process of these land uses is at different stages. The choice of appropriate restoration interventions prior to and during the reforestation process help to assess the recovery of soil-related ecosystem services and the identification of soil processes that limit the vegetation recovery. Furthermore, our results emphasize the necessity of multiple approaches to restore different land uses in the study site.
Our study site has been once monoculture tea plantation established by the British planters about a century ago. Though our study site is small in scale, the findings may be replicated within physiographic unit of complex hill, ridge, and valley system, which is unique to Southwestern Sri Lanka, where a number of similar tea plantations exist. Our study set a roadmap for ecological restoration by demonstrating matching of species to sites on contrary to widespread ad-hoc tree planting campaigns and restoration attempts that fail. To provide a comprehensive spectrum of soil quality improvement due to forest restoration, we suggest conducting the assessments at multiple timepoints and evaluating additional soil quality parameters such as texture, aggregate stability, hydraulic conductivity, effective cation exchange capacity, soil buffering capacity, soil respiration, soil microbial biomass and diversity etc.
5. Conclusions and Recommendations
Approximately after 15 years of abandonment, this site has been restored into a site with a species richness of 60 species within 32 plots. Based on 1302 trees assessed, the area has a mixture of endemic species and native species. We conclude that this secondary forest is progressing towards a climax forest community where it lies between mid-successional and climax forests. Mid-successional tree species can be introduced to scrub and WDs as they have reached canopy closure such as Garcinia echinocarpa, S. trapezifolia, Garcinia quaesit, and Vernonia arborea. Pioneer species can be introduced to marginal tea lands as a first step of rely-floristics such as S. cohinchinensis, S. caryophyllatum, and O. octandra. However, natural regeneration is insufficient for the restoration of sites away from the primary forest. Spatial variation of key soil parameters assessed are indicative of the species distribution and their relative abundance among the five land use categories evaluated. Overall, these findings contribute to the matching of ecological requirements of species with the site quality for the ecological restoration of abandoned tea lands in the lowland wet zone forests of Sri Lanka.
Author Contributions
N.G. (Nalaka Geekiyanage) and S.R. conceptualized and designed the methodology; N.G. (Nalaka Geekiyanage), S.R., S.G. (Sriyani Gamage) and A.A.D.S. collected the data and conducted formal analysis; N.G. (Nalaka Geekiyanage), S.N. and D.M.S.D. provided resources; A.A.D.S. and S.G. (Sriyani Gamage) curated the data; N.G. (Nalaka Geekiyanage) and S.R. wrote the original manuscript draft; N.G. (Nimal Gunatilleke), S.R., S.N., D.M.S.D., S.G. (Savitri Gunatilleke) and N.G. (Nimal Gunatilleke) reviewed and carried out the editing; N.G. (Nalaka Geekiyanage) and S.R. visualized the data; N.G. (Nalaka Geekiyanage), S.N., S.G. (Savitri Gunatilleke) and N.G. (Nimal Gunatilleke). supervised the project; N.G. (Nalaka Geekiyanage), and S.N. administered the project; N.G. (Nalaka Geekiyanage), S.N., S.G. (Savitri Gunatilleke) and N.G. (Nimal Gunatilleke) acquired the funding. All authors have read and agreed to the published version of the manuscript.
Funding
This research was funded by Dilmah Conservation, Dilmah Ceylon Tea Company, Sri Lanka, and Rajarata University of Sri Lanka.
Institutional Review Board Statement
Ethical review and approval were waived for this study, because human and animal subjects were not used.
Data Availability Statement
Data associated with this manuscript has been publicly made available via DOI: 10.6084/m9.figshare.16909396.
Acknowledgments
The authors acknowledge the staff at the Endane Tea Estate, Kahawaththa Plantations PLC, Sri Lanka for the extensive field support and Rajarata University of Sri Lanka for the materials and assistance in laboratory analyses. Dilmah Conservation extended logistical support. The constructive criticism by three anonymous reviewers have substantially improved an earlier version of this manuscript.
Conflicts of Interest
The authors declare no conflict of interest. The funders had no role in the design of the study; in the collection, analyses, or interpretation of data; in the writing of the manuscript. Prior permission was obtained from Dilmah Conservation to publish the results.
Appendix A
Table A1.
List of woody species recorded in the Endane Biodiversity Corridor, linking the Iharakanda Proposed Forest Reserve and Sinharaja Forest Complex in the Rathnapura District of Sri Lanka.
Table A1.
List of woody species recorded in the Endane Biodiversity Corridor, linking the Iharakanda Proposed Forest Reserve and Sinharaja Forest Complex in the Rathnapura District of Sri Lanka.
| No | Scientific Name | Family | Common Name | Frequency |
|---|---|---|---|---|
| 1 | Symplocos cohinchinensis (Lour.) S. Moore | Symplocaceae | Bombu | 278 |
| 2 | Camellia sinensis (L.) Kuntze | Theaceae | Tea | 171 |
| 3 | Macaranga peltata (Roxb.)Müll.Arg. | Euphorbiaceae | Kenda | 160 |
| 4 | Lantana camara L. | Verbenaceae | Gandapana | 116 |
| 5 | Alstonia macrophylla Wall.ex G.Don | Apocynaceae | Ginikuru | 66 |
| 6 | Litsea longifolia Nees | Lauraceae | Rathkeliya | 58 |
| 7 | Melia azedarach C.DC. | Meliaceae | Lunumidella | 56 |
| 8 | Mallotus tetracoccus Roxb. | Euphorbiaceae | Bu kenda | 47 |
| 9 | Calliandra guildingii Killip & J.F. Macbr | Leguminosae | Calliandra | 44 |
| 10 | Cinnamomum verum (L.) Farw. | Lauraceae | Kurundu | 39 |
| 11 | Psidium guajava L. | Myrtaceae | Pere | 33 |
| 12 | Bridelia retusa (L.) A.Juss. | Euphorbiaceae | Kata kela | 25 |
| 13 | Gliricidia sapium (Jacq.)Walp. | Fabaceae | Wetamara | 22 |
| 14 | Filicium decipiens (Wight & Arn.) Thwaites | Sapindaceae | Pihibiya | 20 |
| 15 | Acacia melanoxylon R.Br | Leguminosae | Acacia | 13 |
| 16 | Albizia odoratissima (L.F.) Benth. | Leguminosae | Albizia | 12 |
| 17 | Chromolaena odorata (L.) R.M.King & H.Rob. | Asteraceae | Podisinghomaran | 12 |
| 18 | Ziziphus oenoplia (L.) Mill. | Rhamnaceae | Heen eraminiya | 12 |
| 19 | Eucalyptus obliqua L ‘Hėr. | Myrtaceae | Eucalyptus | 11 |
| 20 | Alstonia scholaris L. | Apocynaceae | Rukkathtana | 8 |
| 21 | Horsfieldia iryaghedhi (Gaertn.) Warb. | Myristicaceae | Rukkathtana | 8 |
| 22 | Artocarpus nobilis Kuntze | Moraceae | Wal del | 7 |
| 23 | Caryota urens L. | Arecaceae | Kithul | 7 |
| 24 | Syzygium caryophyllatum (L.) Alston | Myrtaceae | Dan | 7 |
| 25 | Artocarpus heterophyllus Lam. | Moraceae | Kos | 6 |
| 26 | Myristica dactyloides Wall. | Myristicaceae | Malabada | 6 |
| 27 | Ficus benghalensis L. | Moraceae | Nuga | 5 |
| 28 | Leea indica (Burm. F.) Merr. | Leeaceae | Burulla | 5 |
| 29 | Artabotrys zelianicus Hook.f.&.Thomson | Annonaceae | Kalu bambara wel | 4 |
| 30 | Elaeocarpus serratus Raf. | Elaeocarpaceae | Weralu | 4 |
| 31 | Ceiba pentandra (L.) Gaertn. | Malvaceae | Pulun kotta | 3 |
| 32 | Ziziphus lucida (L.) Mill. | Rhamnaceae | Yak eraminiya | 3 |
| 33 | Adenanthera pavonina L. | Fabaceae | Madatiya | 2 |
| 34 | Annona squamosa L. | Annonaceae | Katuanoda | 2 |
| 35 | Bambusa sp. | Poaceae | Bata | 2 |
| 36 | Bombax ceiba L. | Malvaceae | Katu ibul | 2 |
| 37 | Mangifera indica L. | Anacardiaceae | Amba | 2 |
| 38 | Osbeckia octandra DC. | Melastomataceae | Bowitiya | 2 |
| 39 | Pagiantha dichotoma (Roxb. Ex Wall.) Markgr. | Apocynaceae | Divi kaduru | 2 |
| 40 | Plumeria obtusa L. | Apocynaceae | Araliya | 2 |
| 41 | Pterospermum suberifolium (L.) Willd | Malvaceae | Welan | 2 |
| 42 | Swietenia macrophylla King | Meliaceae | Mahogani | 2 |
| 43 | Acronychia pedunculata (L.) Miq. | Rutaceae | Ankenda | 1 |
| 44 | Aporusa lindleyana L. | Euphorbiaceae | Kebella | 1 |
| 45 | Ardisia elliptica Thunb. | Myrsinaceae | Balu dan | 1 |
| 46 | Artocarpus altilis (Parkinson ex. F.A.Zorn) Fosbers | Moraceae | Del | 1 |
| 47 | Canthium coromandelicum (Burm.f.)Alston | Rubiaceae | Kara | 1 |
| 48 | Cassine balae Kosterm. | Celastraceae | Neralu | 1 |
| 49 | Cleistocalyx operculatus (Roxb.) Merr. & L.M. Perry | Myrtaceae | Bata damba | 1 |
| 50 | Coffea spp. | Rubiaceae | Copi | 1 |
| 51 | Dillenia spp. L. | Dilleniaceae | Godapara | 1 |
| 52 | Erythrina variegata L. | Fabaceae | Erabadu | 1 |
| 53 | Ficus religiosa L. | Moraceae | Bo | 1 |
| 54 | Gironniera parvifolia Planch. | Ulmaceae | Akmediya | 1 |
| 55 | Gomphia serrata (Gaertn.) Kanis | Ochnaceae | Bo kera | 1 |
| 56 | Lannea coromandelica (Houtt.) Merr. | Anacardiaceae | Hik | 1 |
| 57 | Salacia chinensis L. | Hippocrateaceae | Hibutu | 1 |
| 58 | Schumacheria castaneifolia Vahl | Dilleniaceae | kekiriwara | 1 |
| 59 | Spathodea campanulata L. | Bignoniaceae | Sapodia | 1 |
| 60 | Vitex altissima L.f. | Lamiaceae | Milla | 1 |
| Total | 60 species | 33 families | 1302 |
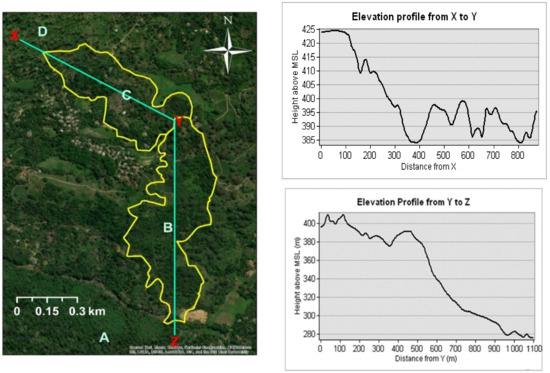
Figure A1.
Elevation profiles of the upper section (from X to Y) and the lower section (from Y to Z) of thee Endane Biodiversity Corridor, Dilmah Conservation and Kahawaththa Plantations PLC, Sri Lanka.
Figure A1.
Elevation profiles of the upper section (from X to Y) and the lower section (from Y to Z) of thee Endane Biodiversity Corridor, Dilmah Conservation and Kahawaththa Plantations PLC, Sri Lanka.
References
- Food and Agriculture Organization (FAO); UN Environment Programme (UNEP). The State of the World’s Forests 2020: Forests, Biodiversity and People; Food and Agriculture Organization: Rome, Italy, 2020. [Google Scholar]
- Powers, J.S.; Marín-Spiotta, E. Ecosystem Processes and Biogeochemical Cycles in Secondary Tropical Forest Succession. Annu. Rev. Ecol. Evol. Syst. 2017, 48, 497–519. [Google Scholar] [CrossRef] [Green Version]
- Chazdon, R.L.; Harvey, C.A.; Komar, O.; Griffith, D.M.; Ferguson, B.G.; Martínez-Ramos, M.; Morales, H.; Nigh, R.; Soto-Pinto, L.; van Breugel, M.; et al. Beyond Reserves: A Research Agenda for Conserving Biodiversity in Human-modified Tropical Landscapes. Biotropica 2009, 41, 142–153. [Google Scholar] [CrossRef] [Green Version]
- Murawski, D.A.; Dayanandan, B.; Bawa, K.S. Outcrossing Rates of Two Endemic Shorea Species from Sri Lankan Tropical Rainforests. Biotropica 1994, 26, 23. [Google Scholar] [CrossRef]
- Amira, A.; Lippok, D.; Hensen, I.; Schleuning, M.; Both, S.; Apaza-Quevedo, A.; Lippok, D.; Hensen, I.; Schleuning, M.; Both, S. Elevation, Topography, and Edge Effects Drive Functional Composition of Woody Plant Species in Tropical Montane Forests. Biotropica 2015, 47, 449–458. [Google Scholar] [CrossRef]
- Murcia, C. Edge effects in fragmented forests: Implications for conservation. Trends Ecol. Evol. 1995, 10, 58–62. [Google Scholar] [CrossRef]
- Corlett, R.T. Plant diversity in a changing world: Status, trends, and conservation needs. Plant Divers. 2016, 38, 10–16. [Google Scholar] [CrossRef] [Green Version]
- Jayathilake, H.M.; Prescott, G.W.; Carrasco, L.R.; Rao, M.; Symes, W.S. Drivers of deforestation and degradation for 28 tropical conservation landscapes. Ambio 2021, 50, 215–228. [Google Scholar] [CrossRef]
- Thapa, G.B.; Weber, K.E. Actors and Factors of Deforestation in “Tropical Asia”. Environ. Conserv. 1990, 17, 19–27. [Google Scholar] [CrossRef]
- Sudhakar Reddy, C.; Saranya, K.R.L.; Vazeed Pasha, S.; Satish, K.V.; Jha, C.S.; Diwakar, P.G.; Dadhwal, V.K.; Rao, P.V.N.; Krishna Murthy, Y.V.N. Assessment and monitoring of deforestation and forest fragmentation in South Asia since the 1930s. Glob. Planet. Chang. 2018, 161, 132–148. [Google Scholar] [CrossRef]
- Chazdon, R.L. Second Growth: The Promise of Tropical Rainforest Regeneration in the Age of Deforestation; University of Chicago Press: Chicago, IL, USA, 2014. [Google Scholar]
- Teixeira, H.M.; Cardoso, I.M.; Bianchi, F.J.J.A.; da Cruz Silva, A.; Jamme, D.; Peña-Claros, M. Linking vegetation and soil functions during secondary forest succession in the Atlantic forest. For. Ecol. Manag. 2020, 457, 117696. [Google Scholar] [CrossRef]
- Kettle, C.J. Ecological considerations for using dipterocarps for restoration of lowland rainforest in Southeast Asia. Biodivers. Conserv. 2010, 19, 1137–1151. [Google Scholar] [CrossRef]
- Balazs, K.R.; Kramer, A.T.; Munson, S.M.; Talkington, N.; Still, S.; Butterfield, B.J. The right trait in the right place at the right time: Matching traits to environment improves restoration outcomes. Ecol. Appl. 2020, 30, e02110. [Google Scholar] [CrossRef] [Green Version]
- Werner, P. Changes in Soil Properties During Tropical Wet Forest Succession in Costa Rica. Biotropica 1984, 16, 43. [Google Scholar] [CrossRef]
- Guggenberger, G.; Zech, W. Soil organic matter composition under primary forest, pasture, and secondary forest succession, Region Huetar Norte, Costa Rica. For. Ecol. Manag. 1999, 124, 93–104. [Google Scholar] [CrossRef]
- Palmiotto, P.A.; Davies, S.J.; Vogt, K.A.; Ashton, M.S.; Vogt, D.J.; Ashton, P.S. Soil-related habitat specialization in dipterocarp rainforest tree species in Borneo. J. Ecol. 2004, 92, 609–623. [Google Scholar] [CrossRef]
- Townsend, A.R.; Cleveland, C.C.; Asner, G.P.; Bustamante, M.M.C. Controls over foliar n:p ratios in tropical rainforests. Ecology 2007, 88, 107–118. [Google Scholar] [CrossRef]
- Sreekar, R.; Mohan, A.; Das, S.; Agarwal, P.; Vivek, R. Natural Windbreaks Sustain Bird Diversity in a Tea-Dominated Landscape. PLoS ONE 2013, 8, e70379. [Google Scholar] [CrossRef] [PubMed] [Green Version]
- Mapa, R.B.; Somasiri, R.; Nagarajah, S. Soils of the Wet Zone of Sri Lanka. Soils of the Wet Zone of Sri Lanka. Morphology, Characterization and Classification. Special Publication No. 1; Survodaya Publishers: Colombo, Sri Lanka, 1999. [Google Scholar]
- Maheswaran, J.; Gunathilake, I.A.U.N. Nitrogenase Activity in Soil and Litter of a Tropical Lowland Rainforest and an Adjacent Fernland in Sri Lanka. J. Trop. Ecol. 2016, 6, 281–289. [Google Scholar] [CrossRef]
- Ashton, M.S. A Field Guide to the Common Trees and Shrubs of Sri Lanka; WHT Publication (Pvt.) Limited: Colombo, Sri Lanka, 1997. [Google Scholar]
- Gartley, K. Recommended Methods for Measuring Soluble Salts in Soils; University of Delaware Extension: Newark, NJ, USA, 1982; pp. 87–94. [Google Scholar]
- Nelson, D.W.; Sommers, L.E. Total carbon, organic carbon, and organic matter. In Methods of Soil Analysis, Part 2; Miller, R.H., Keeney, D.R., Eds.; Soil Science Society of America (SSSA): Madison, WI, USA, 1982; pp. 539–579. [Google Scholar]
- Nelson, D.W.; Sommers, L.E. A Simple Digestion Procedure for Estimation of Total Nitrogen in Soils and Sediments1. J. Environ. Qual. 1972, 1, 423. [Google Scholar] [CrossRef]
- Jackson, M.L. Soil Chemical Analysis; Prentice Hall: London, UK, 1958. [Google Scholar]
- Murphy, J.; Riley, J.R. A Modified Single Solution Method for the Determination of Phosphate. Anal. Chim. Acta 2002, 27, 31–36. [Google Scholar] [CrossRef]
- Blake, G.R.; Hartge, K.H. Bulk density. In Methods of Soil Analysis: Part 1. Physical and Mineralogical Method, Agronomy Monograph 9; Klute, A., Ed.; American Society of Agronomy: Madison, WI, USA; Soil Science Society of America: Madison, WI, USA, 1986; pp. 363–375. [Google Scholar]
- Chave, J.; Maxime, R.-M.; Búrquez, A.; Chidumayo, E.; Colgan, M.S.; Delitti, W.B.C.; Duque, A.; Eid, T.; Fearnside, P.M.; Goodman, R.C.; et al. Improved allometric models to estimate the aboveground biomass of tropical trees. Glob. Chang. Biol. 2014, 20, 3177–3190. [Google Scholar] [CrossRef]
- Cambardella, C.A.; Moorman, T.B.; Novak, J.M.; Parkin, T.B.; Karlen, D.L.; Turco, R.F.; Konopka, A.E. Field-scale Variability of Soil Properties in Central Lowa Soils. Soil Sci. Soc. Am. J. 1994, 53, 800–805. [Google Scholar]
- Issaaks, E.H.; Srivastava, R.M. Applied Geostatistics; Oxford University Press: New York, NY, USA, 1989. [Google Scholar]
- Connell, J.H. Diversity in tropical rainforests and coral reefs. Science 1978, 199, 1302–1310. [Google Scholar] [CrossRef] [Green Version]
- Grime, J.P. Competitive exclusion in herbaceous vegetation. Nature 1973, 242, 344–347. [Google Scholar] [CrossRef]
- Wilkinson, D.M. The Disturbing History of Intermediate Disturbance. Oikos 1999, 84, 145. [Google Scholar] [CrossRef] [Green Version]
- Shea, K.; Roxburgh, S.H.; Rauschert, E.S.J. Moving from pattern to process: Coexistence mechanisms under intermediate disturbance regimes. Ecol. Lett. 2004, 7, 491–508. [Google Scholar] [CrossRef]
- Wijesooriya, W.A.D.A.; Gunatilleke, C.V.S. Buffer zone of the Sinharaja Biosphere Reserve in Sri Lanka and its management strategies. J. Natl. Sci. Found. Sri Lanka 2003, 31, 57. [Google Scholar] [CrossRef]
- Lindström, S.; Mattsson, E.; Nissanka, S.P. Forest cover change in Sri Lanka: The role of small scale farmers. Appl. Geogr. 2012, 34, 680–692. [Google Scholar] [CrossRef]
- Chazdon, R.L.; Fetcher, N. Photosynthetic Light Environments in a Lowland Tropical Rainforest in Costa Rica. J. Ecol. 1984, 72, 553. [Google Scholar] [CrossRef]
- Sreekumar, V.; Hussain, K.; Renuka, C. Virtual Herbarium of Kerala forest Research Institute, Peechi, Kerala, India. Curr. Sci. 2017, 112, 466–470. [Google Scholar] [CrossRef]
- Ashton, M.S.; Gunatilleke, C.V.S.; Gunatilleke, I.A.U.N.; Singhakumara, B.M.P.; Gamage, S.; Shibayama, T.; Tomimura, C. Restoration of rainforest beneath pine plantations: A relay floristic model with special application to tropical South Asia. For. Ecol. Manag. 2014, 329, 351–359. [Google Scholar] [CrossRef]
- Cohen, A.L.; Singhakumara, B.M.P.; Ashton, P.M.S. Releasing Rainforest Succession: A Case Study in the Dicranopteris linearis Fernlands of Sri Lanka. Restor. Ecol. 1995, 3, 261–270. [Google Scholar] [CrossRef]
- Egler, F.E. Vegetation science concepts I. Initial floristic composition, a factor in old-field vegetation development with 2 figs. Veg. Acta Geobot. 1954, 4, 412–417. [Google Scholar] [CrossRef]
- Chave, J.; Condit, R.; Muller-Landau, H.C.; Thomas, S.C.; Ashton, P.S.; Bunyavejchewin, S.; Co, L.L.; Dattaraja, H.S.; Davies, S.J.; Esufali, S.; et al. Assessing Evidence for a Pervasive Alteration in Tropical Tree Communities. PLoS Biol. 2008, 6, e45. [Google Scholar] [CrossRef]
- Osuri, A.M.; Kasinathan, S.; Siddhartha, M.K.; Mudappa, D.; Raman, T.R.S. Effects of restoration on tree communities and carbon storage in rainforest fragments of the Western Ghats, India. Ecosphere 2019, 10, e02860. [Google Scholar] [CrossRef]
- Chapman, C.A.; Chapman, L.J. Forest Restoration in Abandoned Agricultural Land: A Case Study from East Africa. Conserv. Biol. 1999, 13, 1301–1311. [Google Scholar] [CrossRef]
- Shono, K.; Cadaweng, E.A.; Durst, P.B. Application of Assisted Natural Regeneration to Restore Degraded Tropical Forestlands. Restor. Ecol. 2007, 15, 620–626. [Google Scholar] [CrossRef]
- Gallardo, A.; Paramá, R. Spatial variability of soil elements in two plant communities of NW Spain. Geoderma 2007, 139, 199–208. [Google Scholar] [CrossRef]
- Warrick, A.W.; Nielsen, D.R. Spatial Variability of Soil Physical Properties in the Field. In Applications of Soil Physics; Hillel, D., Ed.; Academic Press: New York, NY, USA, 1980; pp. 319–344. [Google Scholar]
- Goovaerts, P. Geostatistics for Natural Resources Evaluation; Oxford University Press: New York, NY, USA, 1997. [Google Scholar]
- Mc Bratney, A.B.; Webster, R. Choosing functions for semi-variograms of soil properties and fitting them to sampling estimates. Eur. J. Soil Sci. 1986, 37, 617–639. [Google Scholar] [CrossRef]
- Martínez-Yrízar, A. Biomass distribution and primary productivity of tropical dry forests. In Seasonally Dry Tropical Forests; Bullock, S.H., Mooney, H.A., Medina, E., Eds.; Cambridge University Press: Cambridge, MA, USA, 2010; pp. 326–345. [Google Scholar]
- Vitousek, P.M.; Melillo, J.M. Nitrate Losses from Disturbed Forests: Patterns AND Mechanisms. For. Sci. 1979, 25, 605–619. [Google Scholar]
- Birch, H.F. The effect of soil drying on humus decomposition and nitrogen availability. Plant Soil 1958, 10, 9–31. [Google Scholar] [CrossRef]
- Gilliam, F.S.; Adams, M.B. Effects of Nitrogen on Temporal and Spatial Patterns of Nitrate in Streams and Soil Solution of a Central Hardwood Forest. ISRN Ecol. 2011, 2011, 1–9. [Google Scholar] [CrossRef] [Green Version]
- Johnson, D.W.; Cheng, W.; Burke, I.C. Biotic and Abiotic Nitrogen Retention in a Variety of Forest Soils. Soil Sci. Soc. Am. J. 2000, 64, 1503–1514. [Google Scholar] [CrossRef] [Green Version]
- Tan, K.H. Principles of Soil Chemistry; CRC Press: Boca Raton, FL, USA, 2011. [Google Scholar]
- Rao, C.; Srinivas, K. Potassium Dynamics and Role of Non-exchangeable Potassium in Crop Nutrition. Indian J. Fertil. 2017, 13, 80–94. [Google Scholar]
- Jones, J.B., Jr. Plant Nutrition and Soil Fertility Manual; CRC Press: Boca Raton, FL, USA, 2012. [Google Scholar]
- Campo, J.; Maass, M.; Jaramillo, V.J.; Martínez-Yrízar, A.; Sarukhán, J. Phosphorus cycling in a Mexican tropical dry forest ecosystem. Biogeochemistry 2001, 53, 161–179. [Google Scholar] [CrossRef]
- Yang, X.; Thornton, P.E.; Ricciuto, D.M.; Post, W.M. The role of phosphorus dynamics in tropical forests—A modeling study using CLM-CNP. Biogeosciences 2014, 11, 1667–1681. [Google Scholar] [CrossRef] [Green Version]
- Aragão, L.E.O.C.; Malhi, Y.; Metcalfe, D.B.; Silva-Espejo, J.E.; Jiménez, E.; Navarrete, D.; Almeida, S.; Costa, A.C.L.; Salinas, N.; Phillips, O.L.; et al. Above- and below-ground net primary productivity across ten Amazonian forests on contrasting soils. Biogeosciences 2009, 6, 2759–2778. [Google Scholar] [CrossRef] [Green Version]
- Crews, T.E.; Farrington, H.; Vitousek, P.M. Changes in asymbiotic, heterotrophic nitrogen fixation on leaf litter of Metrosideros polymorpha with long-term ecosystem development in Hawaii. Ecosystems 2000, 3, 386–395. [Google Scholar] [CrossRef]
- Edwards, E.J.; McCaffery, S.; Evans, J.R. Phosphorus availability and elevated CO2 affect biological nitrogen fixation and nutrient fluxes in a clover-dominated sward. New Phytol. 2006, 169, 157–167. [Google Scholar] [CrossRef]
- Dalling, J.W.; Heineman, K.; Lopez, O.R.; Wright, S.J.; Turner, B.L. Nutrient Availability in Tropical Rainforests: The Paradigm of Phosphorus Limitation; Springer: Cham, Switzerland, 2016; pp. 261–273. [Google Scholar]
- Osman, K.T. Forest Soils: Properties and Management; Springer: Cham, Switzerland, 2013; Volume 9783319025414, ISBN 9783319025414. [Google Scholar]
- Pribyl, D.W. A critical review of the conventional SOC to SOM conversion factor. Geoderma 2010, 156, 75–83. [Google Scholar] [CrossRef]
- Dissanayaka, S.T.B.; Wijewardena, J.D.H.; Samarappuli, L. Management of the Wet Zone Soil. In Soils of the Wet Zone of Sri Lanka; Special Publication No. 1.; Mapa, R.B., Somasiri, S., Nagarajah, S., Eds.; Soil Science Society of Sri Lanka: Peradeniya, Sri Lanka, 1999; pp. 160–176. [Google Scholar]
- Liyanage, L.R.M.C.; Jayakody, A.N.; Wijayatunga, W.M.S.; Gunaratne, G.P. Feasibility of using soil pH buffering capacity for dolomite recommendation for tea growing soils in Sri Lanka. Sri Lanka J. Tea Sci. 2012, 77, 57–69. [Google Scholar]
- Hillel, D. Introductions to Environmental Soil Physics; Academic Press: San Diego, CA, USA, 2004. [Google Scholar]
- Weil, R.R.; Brady, N.C. The Nature and Properties of Soils, 15th ed.; Prentice Hall: Upper Saddle River, NJ, USA,, 2017. [Google Scholar]
- USDA NRCS. Soil Bulk Density/Moisture/Aeration; United States Department of Agriculture, National Agricultural Statistical Service: Washington, DC, USA, 2014.
- Smith, J.L.; Doran, J.W. Measurement and Use of pH and Electrical Conductivity for Soil Quality Analysis. In Methods for Assessing Soil Quality; Doran, J.W., Jones, A.J., Eds.; John Wiley & Sons: Madison, WI, USA, 1997; pp. 169–185. [Google Scholar]


Publisher’s Note: MDPI stays neutral with regard to jurisdictional claims in published maps and institutional affiliations. |
© 2021 by the authors. Licensee MDPI, Basel, Switzerland. This article is an open access article distributed under the terms and conditions of the Creative Commons Attribution (CC BY) license (https://creativecommons.org/licenses/by/4.0/).