Article

Patterns and Internal Stability of Carbon, Nitrogen, and Phosphorus in Soils and Soil Microbial Biomass in Terrestrial Ecosystems in China: A Data Synthesis

1
College of Resources Science and Technology, Beijing Normal University, Beijing 100875, China
2
State Key Laboratory of Earth Surface Processes and Resources Ecology, Beijing Normal University, Beijing 100875, China
*
Author to whom correspondence should be addressed.
Forests 2021, 12(11), 1544; https://doi.org/10.3390/f12111544
Submission received: 10 September 2021 / Revised: 3 November 2021 / Accepted: 3 November 2021 / Published: 9 November 2021
(This article belongs to the Section Forest Soil)

Abstract

:
Inspired by the strict constraint ratio (relatively low variability) between carbon (C), nitrogen (N), and phosphorus (P) in global soils and soil microbial biomass, our study explores the biogeographic distribution of C:N:P stoichiometric ratios in soils and soil microbial biomass in China and seeks to identify areas with similar ratios. Our study also attempts to determine the impacts of soil and soil microbial biomass C:N:P in China and the factors determining the ratio. The element concentrations may vary in each phylogenetic group of soils and soil microbial communities in China’s terrestrial ecosystems, as they do in global terrestrial ecosystems. However, on average, the C:N:P ratios for soil (66:5:1) and soil microbial biomass (22:2:1) are highly constrained within China. Soil microbial biomass C, N, and P concentrations have relatively weak internal stability, while soil microbial biomass C:N, C:P, and N:P ratios do not have internal stability at the national scale and in different terrestrial ecosystems of China. Unlike plant N:P, which can be used as the basis for evaluations of nutrient restrictions, the use of soil or soil microbial biomass N:P to evaluate soil nutrients is not universal. Latitude is the main factor influencing the patterns of soil C, N, and P. Longitude is the main factor determining the patterns of soil microbial biomass C, N, and P. pH is the main nonzonal factor affecting the patterns of soil and soil microbial biomass C, N, and P. The findings of this study are helpful in understanding the spatial pattern of soils and soil microbial biomass and their influencing factors in regions with complex ecosystems.

1. Introduction

Soil is an important part of terrestrial ecosystems and the main source of the nutrients required for plant growth and development [1]. Soil microorganisms are the main drivers of soil material circulation and energy circulation. These organisms control the supply, conversion, and circulation of soil nutrients and have beneficial effects on the structure, function, and service of ecosystems [2] and are thus commonly used as an indicator of soil quality changes [3,4]. Soil microbial biomass, which functions as a fast-turnover nutrient reservoir, plays an important role in driving the biogeochemical cycles of chemical elements such as C, N, and P and is closely correlated with soil physical and chemical characteristics [5]. The relationship between ecological stoichiometric characteristics and soil microbial biomass is very important for understanding not only biogeochemical cycling but also microbial biogeography in terrestrial ecosystems, but few studies have examined this relationship [6].
Ecological stoichiometry describes the balance of the various chemical substances involved in the interactions and transformations within ecosystems and is an important tool for the study of soil nutrient cycling and limitations. Initially, the theory was mainly applied to aquatic ecosystems [7,8,9]. Terrestrial ecosystems have more variable habitats, biota, and environmental factors than aquatic ecosystems, thus they are more complex [10]. Moreover, in all terrestrial ecosystems, soil is complex and dynamic. Differences in climatic factors, changes in land use, and the influence of human factors increase the spatial heterogeneity of the nutrient cycle in the soil [11,12]. Previous studies have explored the spatial distribution of C, N, and P in soils and soil microbial biomass in terrestrial ecosystems. For instance, Cleveland and Liptzin integrated soil microbial biomass data in global terrestrial ecosystems and found that the ecological stoichiometric characteristics of soils and soil microbial biomass on a large regional scale include relatively stable C:N:P ratios (186:13:1 and 60:7:1, respectively) [13]. Furthermore, Tian et al. [14] studied the characteristics of soil stoichiometry in China and found that, in topsoils rich in organic matter, the stoichiometric ratio is limited to a certain range (the ratios of C:N, C:P, and N:P in soils are 11.9, 61, and 5.2, respectively, and the ratio of C:N:P is stable at 60:5:1). A global meta-analysis showed that although the concentrations of C, N, and P in soils and soil microbial biomass vary greatly in different ecosystems, their ecological stoichiometric ratio has an optimal value on a global scale, and their molar ratios are 287:17:1 and 42:6:1, respectively [6]. Therefore, inspired by previous studies, we hypothesize that there is a soil microbial biomass element ratio in China similar to the Redfield ratio in oceans.
Climatic changes, vegetation changes, and pH have been shown to significantly influence soils and soil microbial biomass [15,16,17,18]. For instance, higher plant biomass is usually related to higher nutrient inputs into soils [11,19]. In addition, precipitation and temperature determine the spatial patterns of C, N, and P in soil microbial biomass by regulating plant growth and soil moisture [20]. Although previous studies have described the factors influencing the patterns of soils and soil microbial biomass, there are still knowledge gaps. First, the terrestrial ecosystems in China are highly complex and diverse, and the vegetation distribution covers a variety of climate types, from cold temperate zones to tropical zones. Therefore, the study of C, N, P, and stoichiometry have only been carried out at the local scale [21]. In addition, there are very limited studies of C, N, and P concentrations and the effects of multiple factors on them based on coarse (national) scales. Second, most studies are limited to a certain ecosystem, and few studies have investigated C, N, P, and stoichiometry in different terrestrial ecosystems. To address the above questions, we used Web of Science, CNKI, and other databases to search for previous studies and extract soil and soil microbial biomass C, N, and P data from the original publications to answer the following questions: (1) On a nationwide scale, is there a ratio of soil and soil microbial biomass C:N:P in terrestrial ecosystems of China similar to the Redfield ratio for marine plankton? (2) On a national scale, can the ecological stoichiometric characteristics of soil microbial biomass be used to evaluate ecosystem nutrient limitations? (3) What are the effects of environmental factors and climate zones across the country on soils and soil microbial biomass C, N, and P and their ecological stoichiometric and internal stability characteristics? This study will help clarify the relationships between multiple factors and the soil material cycle in China’s terrestrial ecosystems.

2. Materials and Methods

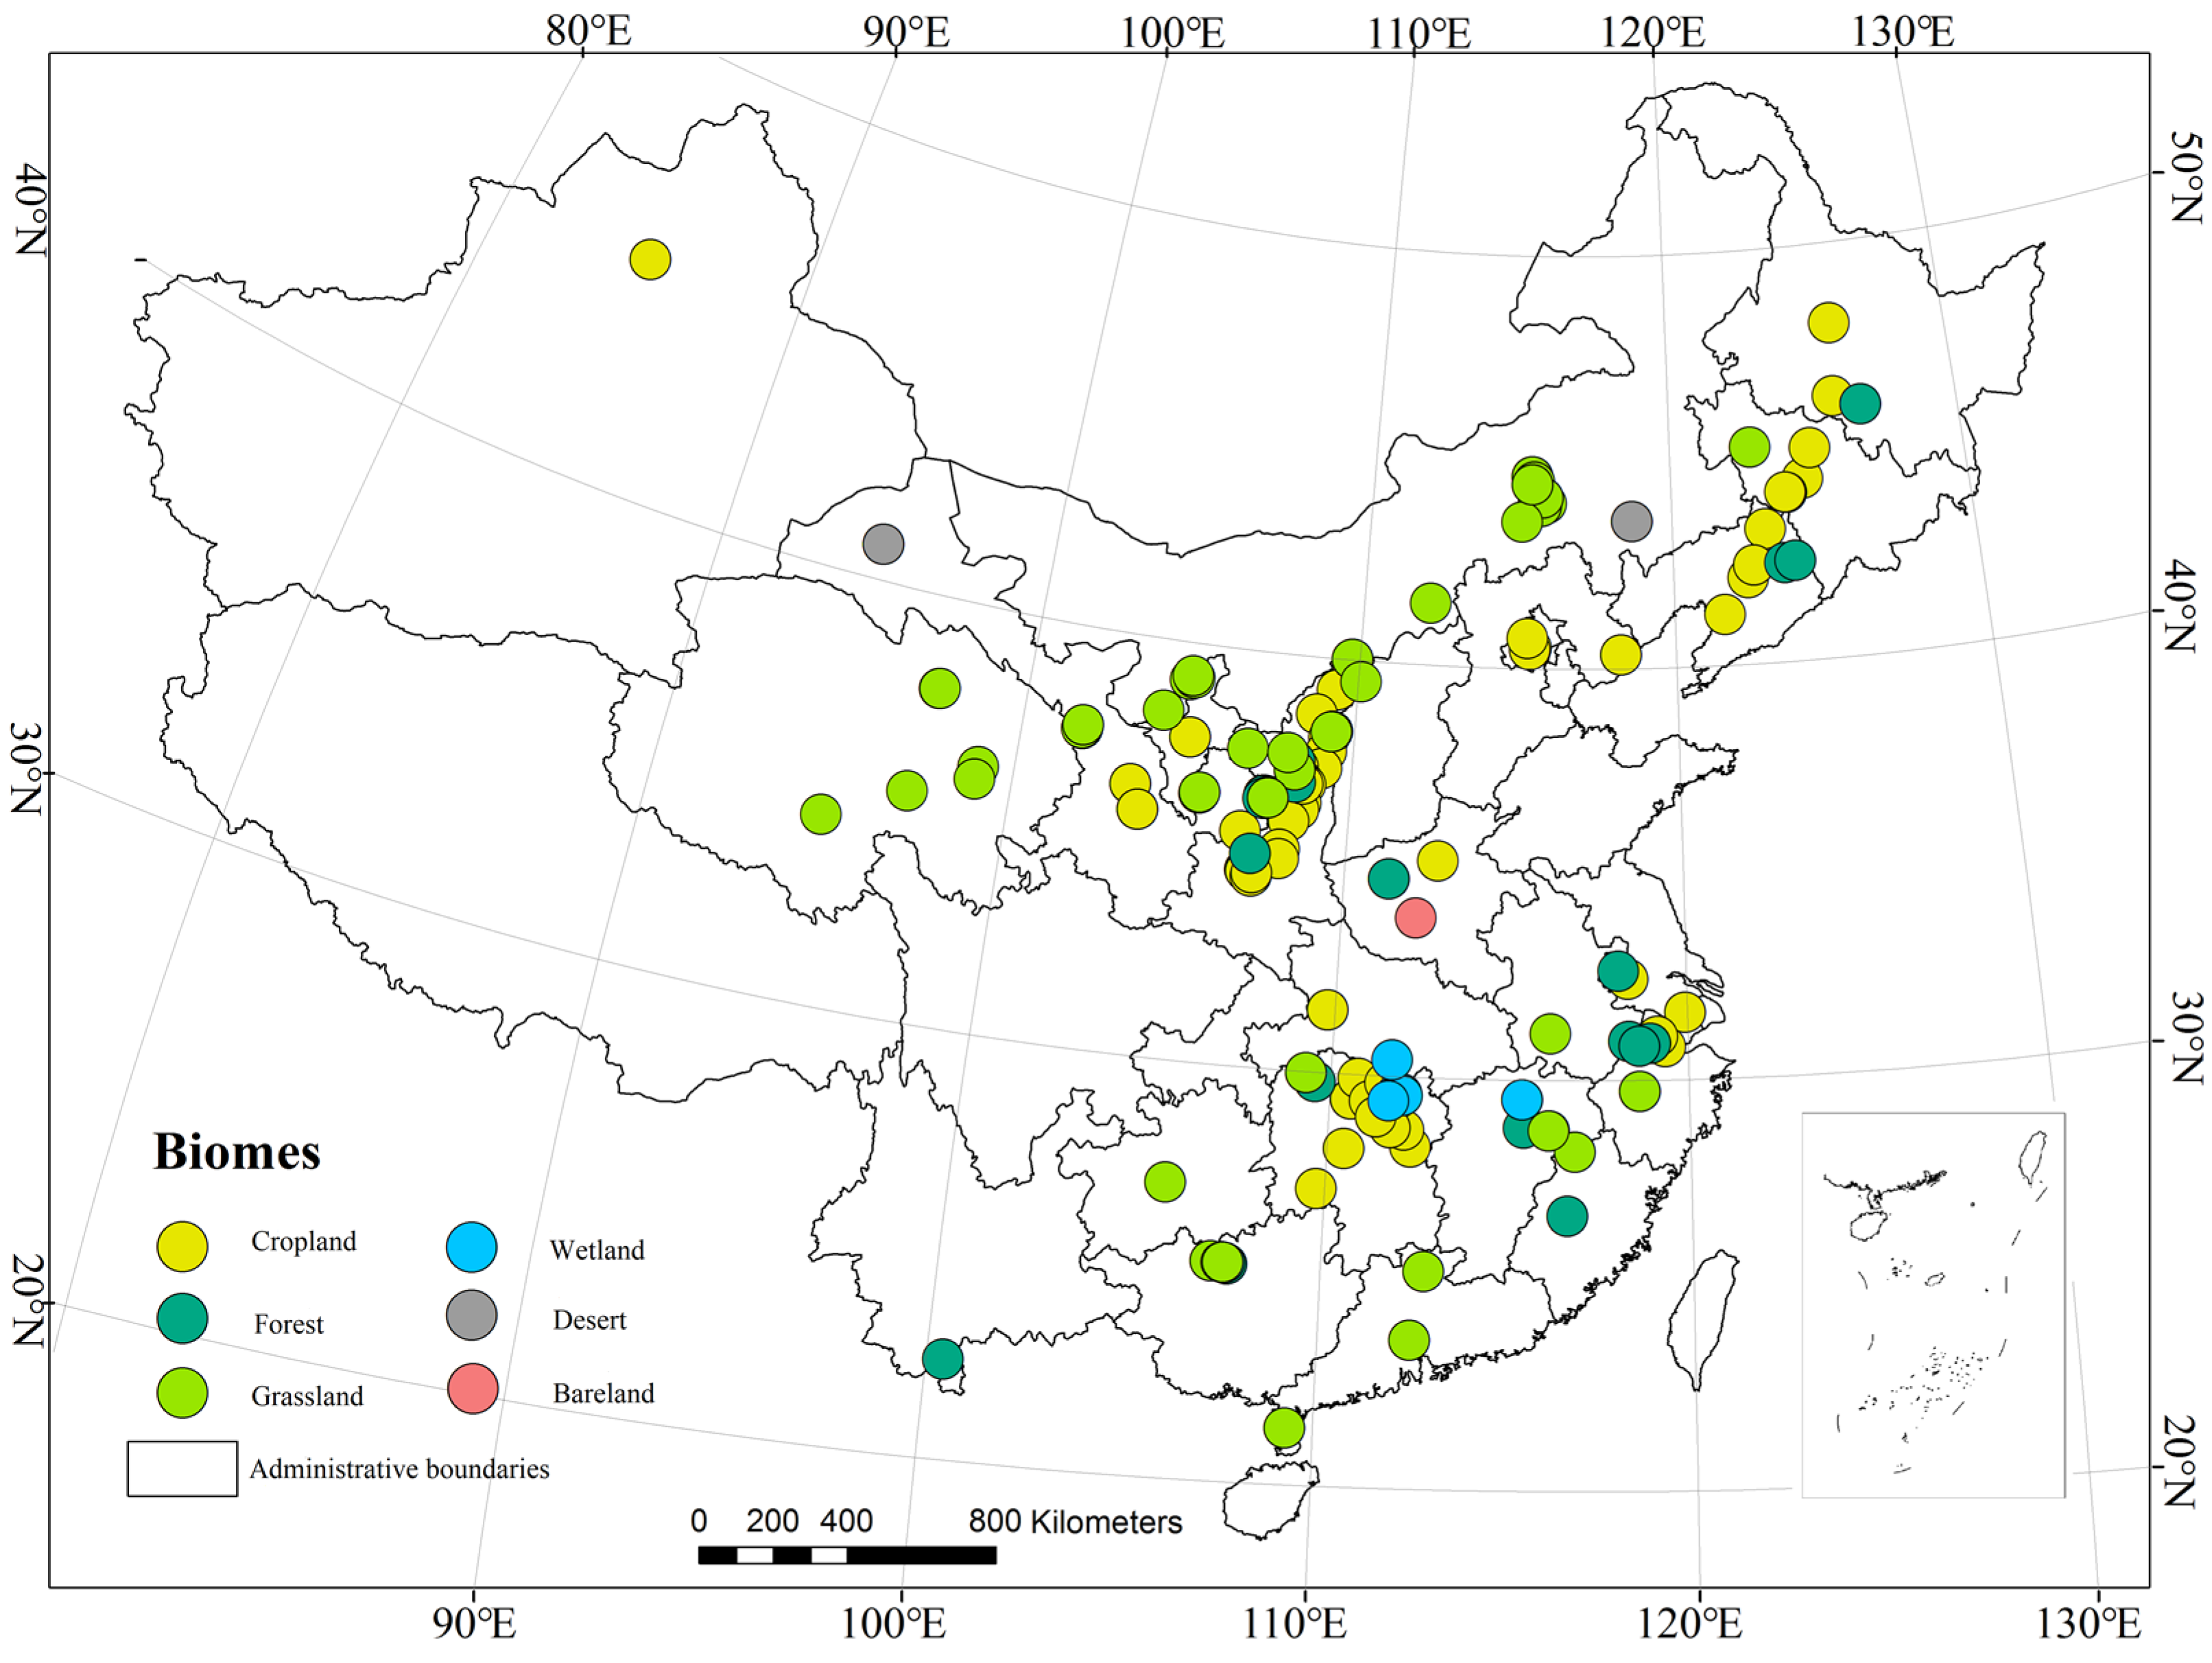
2.1. Distribution of Types of Terrestrial Ecosystems in China

According to the statistical analysis of the macrostructure data of terrestrial ecosystems in China (Figure 1), grassland ecosystems accounted for the greatest proportion at 31.47%, including three types of grasslands: those with high coverage, those with medium coverage, and those with low coverage. Forest ecosystems followed, at 23.96%, including forests, brushy areas, open woodlands, and other woodlands. Cropland ecosystems (the type of terrestrial ecosystem most affected by human activities) accounted for 18.79%, mainly including dry lands and paddy fields. Desert ecosystems accounted for 13.41%, mainly including sandy lands, Gobi Desert, saline-alkali lands, and alpine deserts. Wetland ecosystems accounted for 3.78%, including swamps, canals, lakes, reservoirs, glaciers, permanent snow, and beaches. Developed ecosystems accounted for 2.33%, including towns, rural residential areas, and industrial and mining ecosystems. Other ecosystems (bare land and bare rock and gravel land) accounted for 6.64% of the total area of China’s terrestrial ecosystems.

2.2. Data Acquisition

Data from papers published in English were based on the three main databases of Clarivate Analytics’ ISI Web of Sciences Core Collection™ (WOS, http://apps.webofknowledge.com/ accessed on 20 September 2021): Science Citation Index-Expanded™ (SCI-E, Science Citation Index), Social Sciences Citation Index™ (SSCI, Social Sciences Citation Index), and Art & Humanities Citation Index® (A & HCI, Arts and Humanities Citation Index). An advanced search function was adopted, and the source of the journal was not limited. The subject heading used was “(TS = microbial C OR TS = microbial N OR TS = microbial P)”. Data from papers published in Chinese came from the Chinese Journals Full-text Database of China National Knowledge Infrastructure (CNKI, http://www.cnki.net/ accessed on 20 September 2021) using professional retrieval, unlimited journal sources, and the subject words “microbial biomass carbon (MBC)”, “microbial biomass nitrogen (MBN)”, and “microbial biomass phosphorus (MBP)”. Nonacademic newspapers, publications, calls for papers, reports, international and domestic conferences, miscellaneous talks, scientific anecdotes, and other papers that were not significantly related were excluded. To achieve the purpose of our studies and reduce the potential bias in the screening of papers, three screening criteria for the collected data were used: (a) the papers contained concentrations of at least two elements for soil C, N, and P and soil microbial biomass C, N, and P measurements; (b) the soil microbial biomass (including bacteria and fungi) in the papers was determined based on the fumigation-extraction (FE) method [22]; (c) papers examining the addition of nutrients to the soil were not included; (d) the content of soil C, N, and P in the study was greater than the content of soil microbial biomass C, N, and P; and (e) if the original study reported the vertical distribution of elements in the soil, only the surface (thickness 0–20 cm) soil data were selected for our study. Based on the above screening criteria, 170 research papers that met the requirements were finally obtained, and 404 sets of data were extracted (using Getdata software to extract the data from graphs in the original papers or directly extracting the data from tables in the original papers). According to the sample plot locations and vegetation coverage given in the literature, all sample plots in the database were divided for statistical analysis into 6 specific ecosystem types: grassland (91), forest (122), cropland (157), wetland (14), desert (18), and bare land (2) (Figure 2).

2.3. Data Analysis

The stoichiometric ratios of soils and soil microbial biomass C, N, and P are expressed in molar ratios (molar ratios are commonly used in physiology; unless otherwise specified below, the units are all expressed in molar ratios). The statistical data were preliminarily sorted and calculated using Microsoft Excel 2019, and SPSS PASW (Predictive Analytics Suite Workstation) Statistics 22.0 (IBM, Armonk, NY, USA) software was used for statistical analysis. Before data analysis, the Levene homogeneity test was used, and the homogeneity of variance was not uniform. The data were log10 transformed to meet the normal distribution required for statistical analysis. After the analysis was complete, the results were restored to the original numerical state through logarithmic conversion. One-way analysis of variance (one-way ANOVA) was used to compare the means and test for significant differences among three or more samples (α = 0.05); Pearson correlation analysis was used to analyze soil and soil microbial C, N, and P concentrations and the corresponding relationships of C:N, C:P, and N:P. Statistical drawing was performed using Origin 2021 (Originlab Inc., Northampton, MA, USA) and SigmaPlot 14.0 software. ArcGIS 10.2 was used for sampling point mapping.
The internal stability is represented by the internal stability index (obtained through the regression analysis of the internal stability model using data that were not transformed using the log10 function) and the internal stability model defined by the formula [23]:
dy y = 1 H dx x
In this model, y represents the percentage of element concentration or the ratio of element content in the organism, such as C%, N%, and P% or C:N, C:P, and N:P, and x refers to the supply of nutrients in the environment. Performing exponential conversion of Formula (1), the following exponential expression can be obtained:
y = cx 1 H
The logarithmic conversion of Formula (2) yields the following logarithmic expression:
lny = lnc + 1 H lnx
H = lnx lny lnc
In Formula (4), c is a constant, H represents the homeostasis index, which can determine the degree of urgency of changes. H > 1 can be regarded as the ability to maintain homeostasis. The greater the value of H, the more biological organisms maintain their own chemical composition in a variable environment, and the stronger the ability of the organisms to maintain homeostasis [23]. To facilitate statistical analysis, 1/H (0 < 1/H < 1) is often used to measure the strength of internal stability. The homeostasis index was classified as follows: 0 < 1/H < 0.25, steady-state type; 0.25 < 1/H < 0.5, weak steady-state type; 0.5 < 1/H < 0.75, weakly sensitive type; and 1/H > 0.75, sensitive type [24,25]. When the homeostasis index is negative, the absolute value of the index is used to characterize the strength of biological stoichiometric homeostasis [25,26].

3. Results

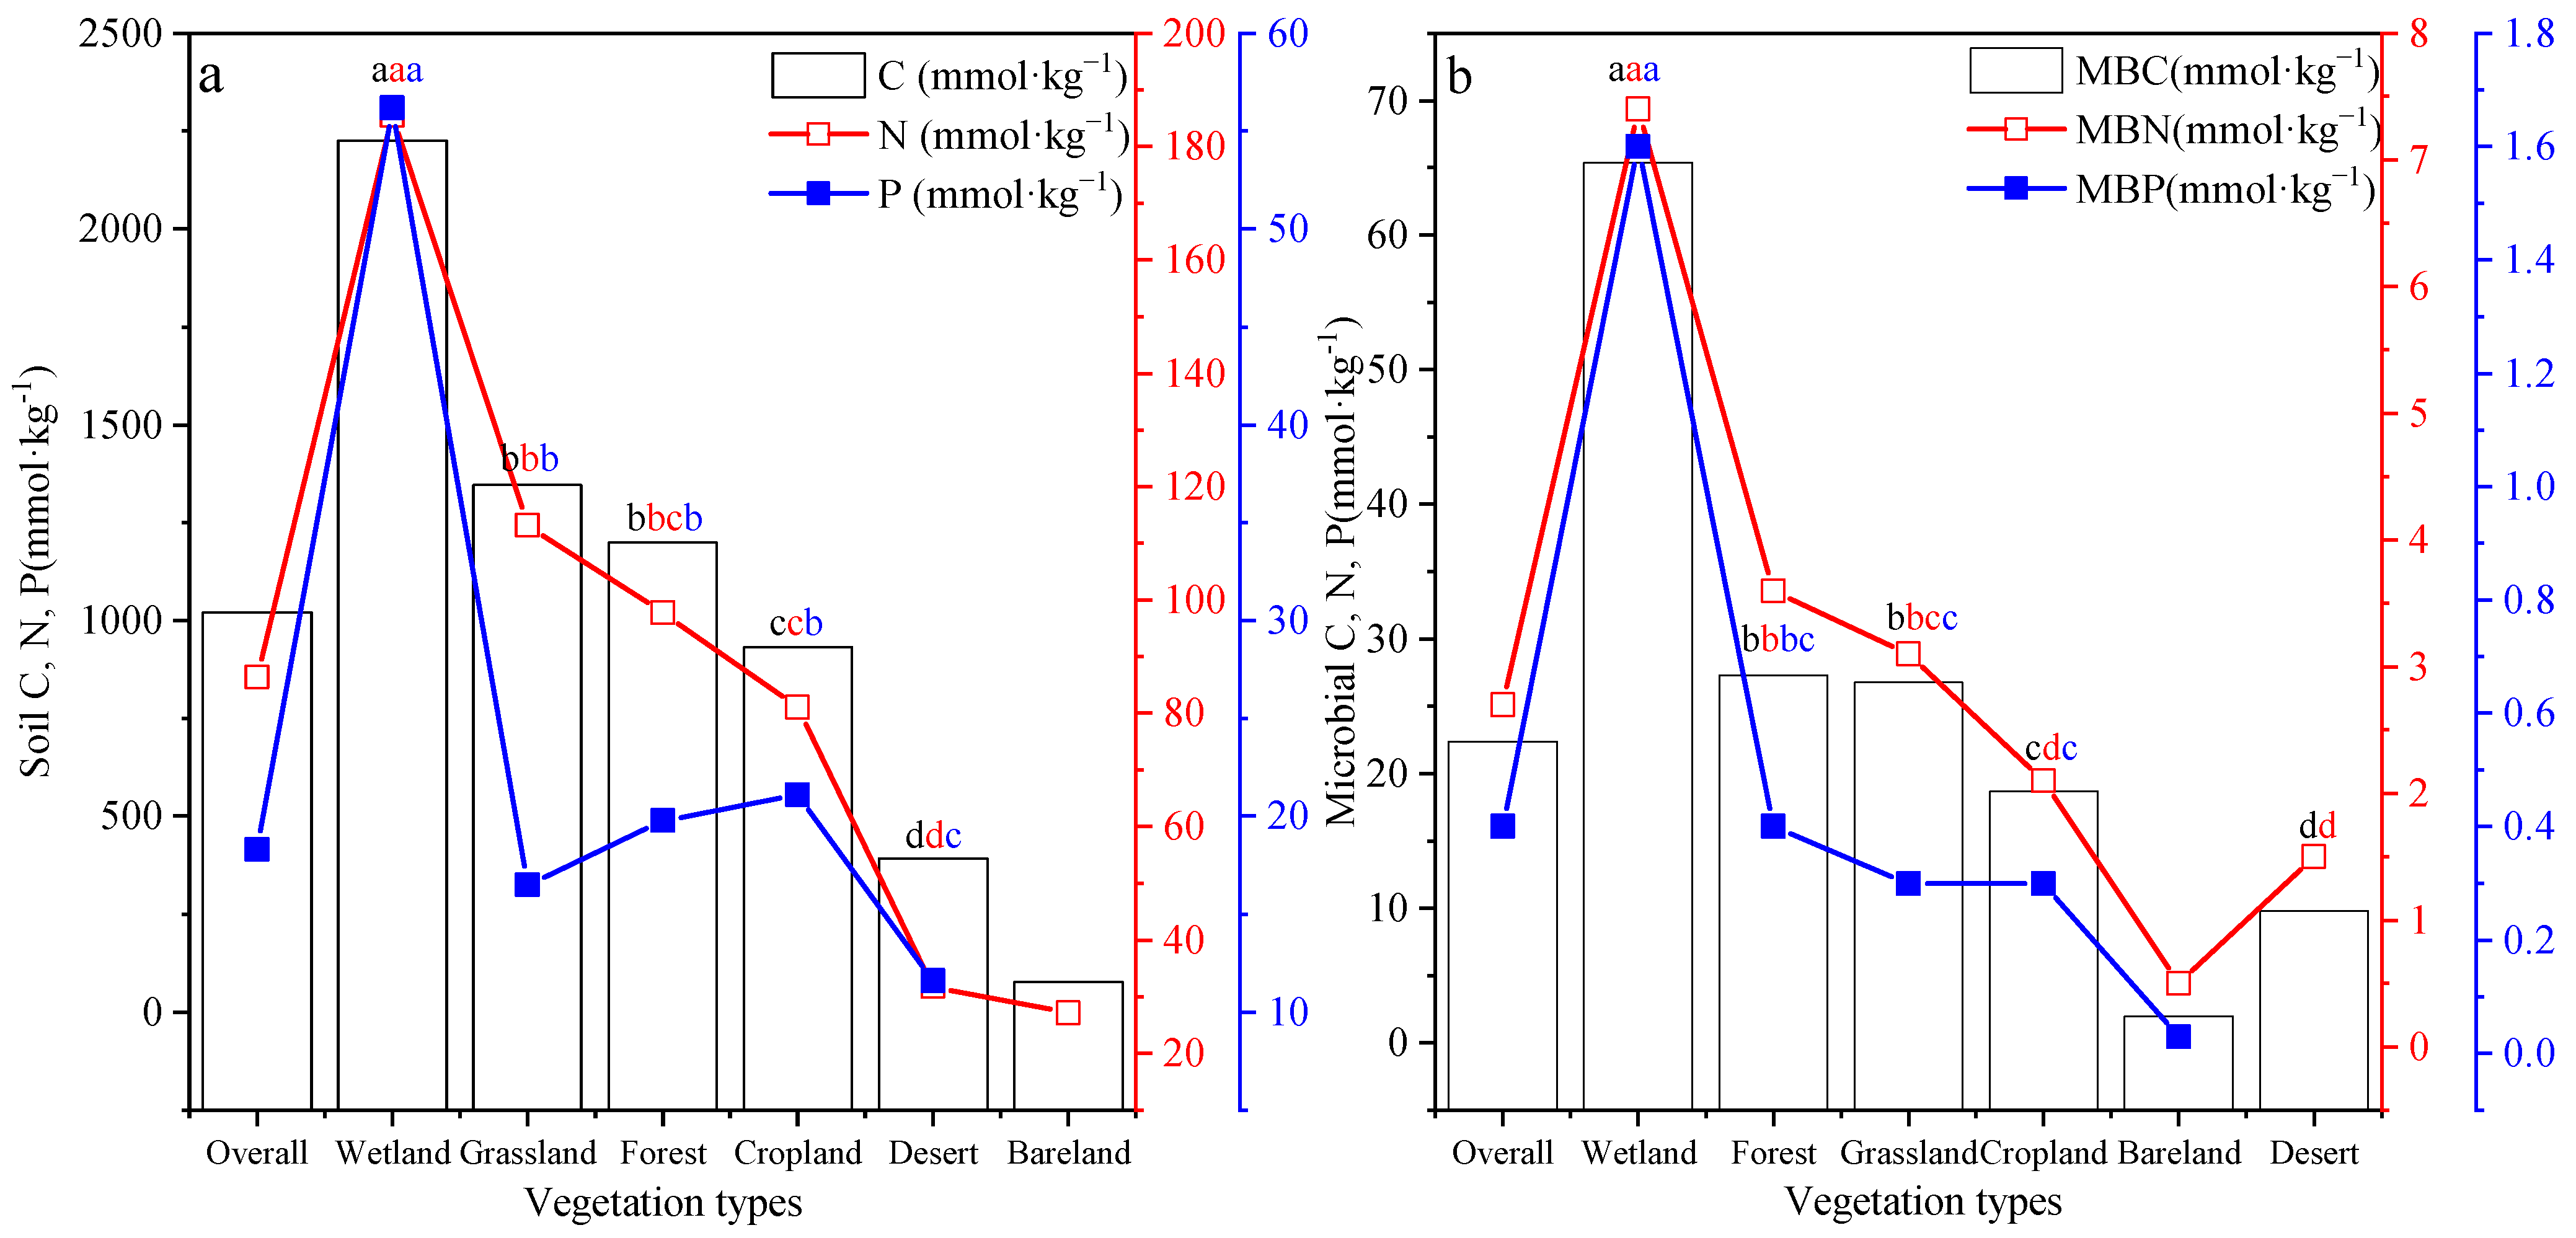
3.1. Summary of Soil and Soil Microbial Biomass Carbon (C), Nitrogen (N), and Phosphorus (P) Concentrations in Different Ecosystem Types

The soil and soil microbial C, N, and P concentrations differed significantly among ecosystem types (p < 0.05) (Figure 3). Among them, the values of wetland soil C, N, and P (2225.8 mmol·kg−1, 185.5 mmol·kg−1, and 56.2 mmol·kg−1, respectively) and soil microbial C, N, and P (65.4 mmol·kg−1, 7.4 mmol·kg−1, and 1.6 mmol·kg−1, respectively) were significantly higher than those of other ecosystem types (p < 0.05) and higher than the averages of all types (1020.7 mmol·kg−1, 86.4 mmol·kg−1, and 18.3 mmol·kg−1, respectively), while desert and bare land soil and soil microbial C, N, and P concentrations were relatively low. The changes in soil and soil microbial C and N concentrations were similar, and the overall performance was in the order wetland > cropland > forest > grassland > desert. However, the changes in P content were slightly different (wetland > forest > grassland > cropland > desert > bare land).
Table 1 shows that the C:N of soil in China’s terrestrial ecosystems ranges from 8.11 to 16.94, with an average of 10.69; the C:P ranges from 34.97 to 143.36, with an average of 100.19; and the N:P ranges from 2.88 to 13.83, with an average of 10.33. The average soil C:N, C:P, and N:P ratios are mainly distributed in the intervals 8–32, 16–64, and 2–8, and the soil C:N, C:P, and N:P ratios obey a positive state distribution (Figure 4). The soil microbial biomass C:N ranges from 8.55 to 26.96, with an average value of 13.7; the C:P ranges from 1.48 to 181.85, with an average value of 85.15; and the N:P ranges from 0.20 to 10.61, with an average value of 9.23. The average ratios of C:N, C:P, and N:P are mainly distributed in the intervals 4–16, 16–64, and 2–8, and the soil microbial C:N, C:P, and N:P ratios also obeyed a normal distribution (Figure 4). Under the different vegetation types, the soil C:N ratio of wetland ecosystems was significantly lower than that of desert ecosystems (p < 0.05), and there were no significant differences among other ecosystems (p > 0.05). The soil microbial C:N ratio of desert ecosystems was significantly lower than that of wetland ecosystems (p < 0.05). The soil microbial C:P ratio was greatest in grasslands, followed by forests, with deserts and wetlands having the smallest ratio (p < 0.05). The soil microbial N:P ratio was greatest in wetlands, followed by croplands and grasslands, with deserts having the smallest ratio (p < 0.05).

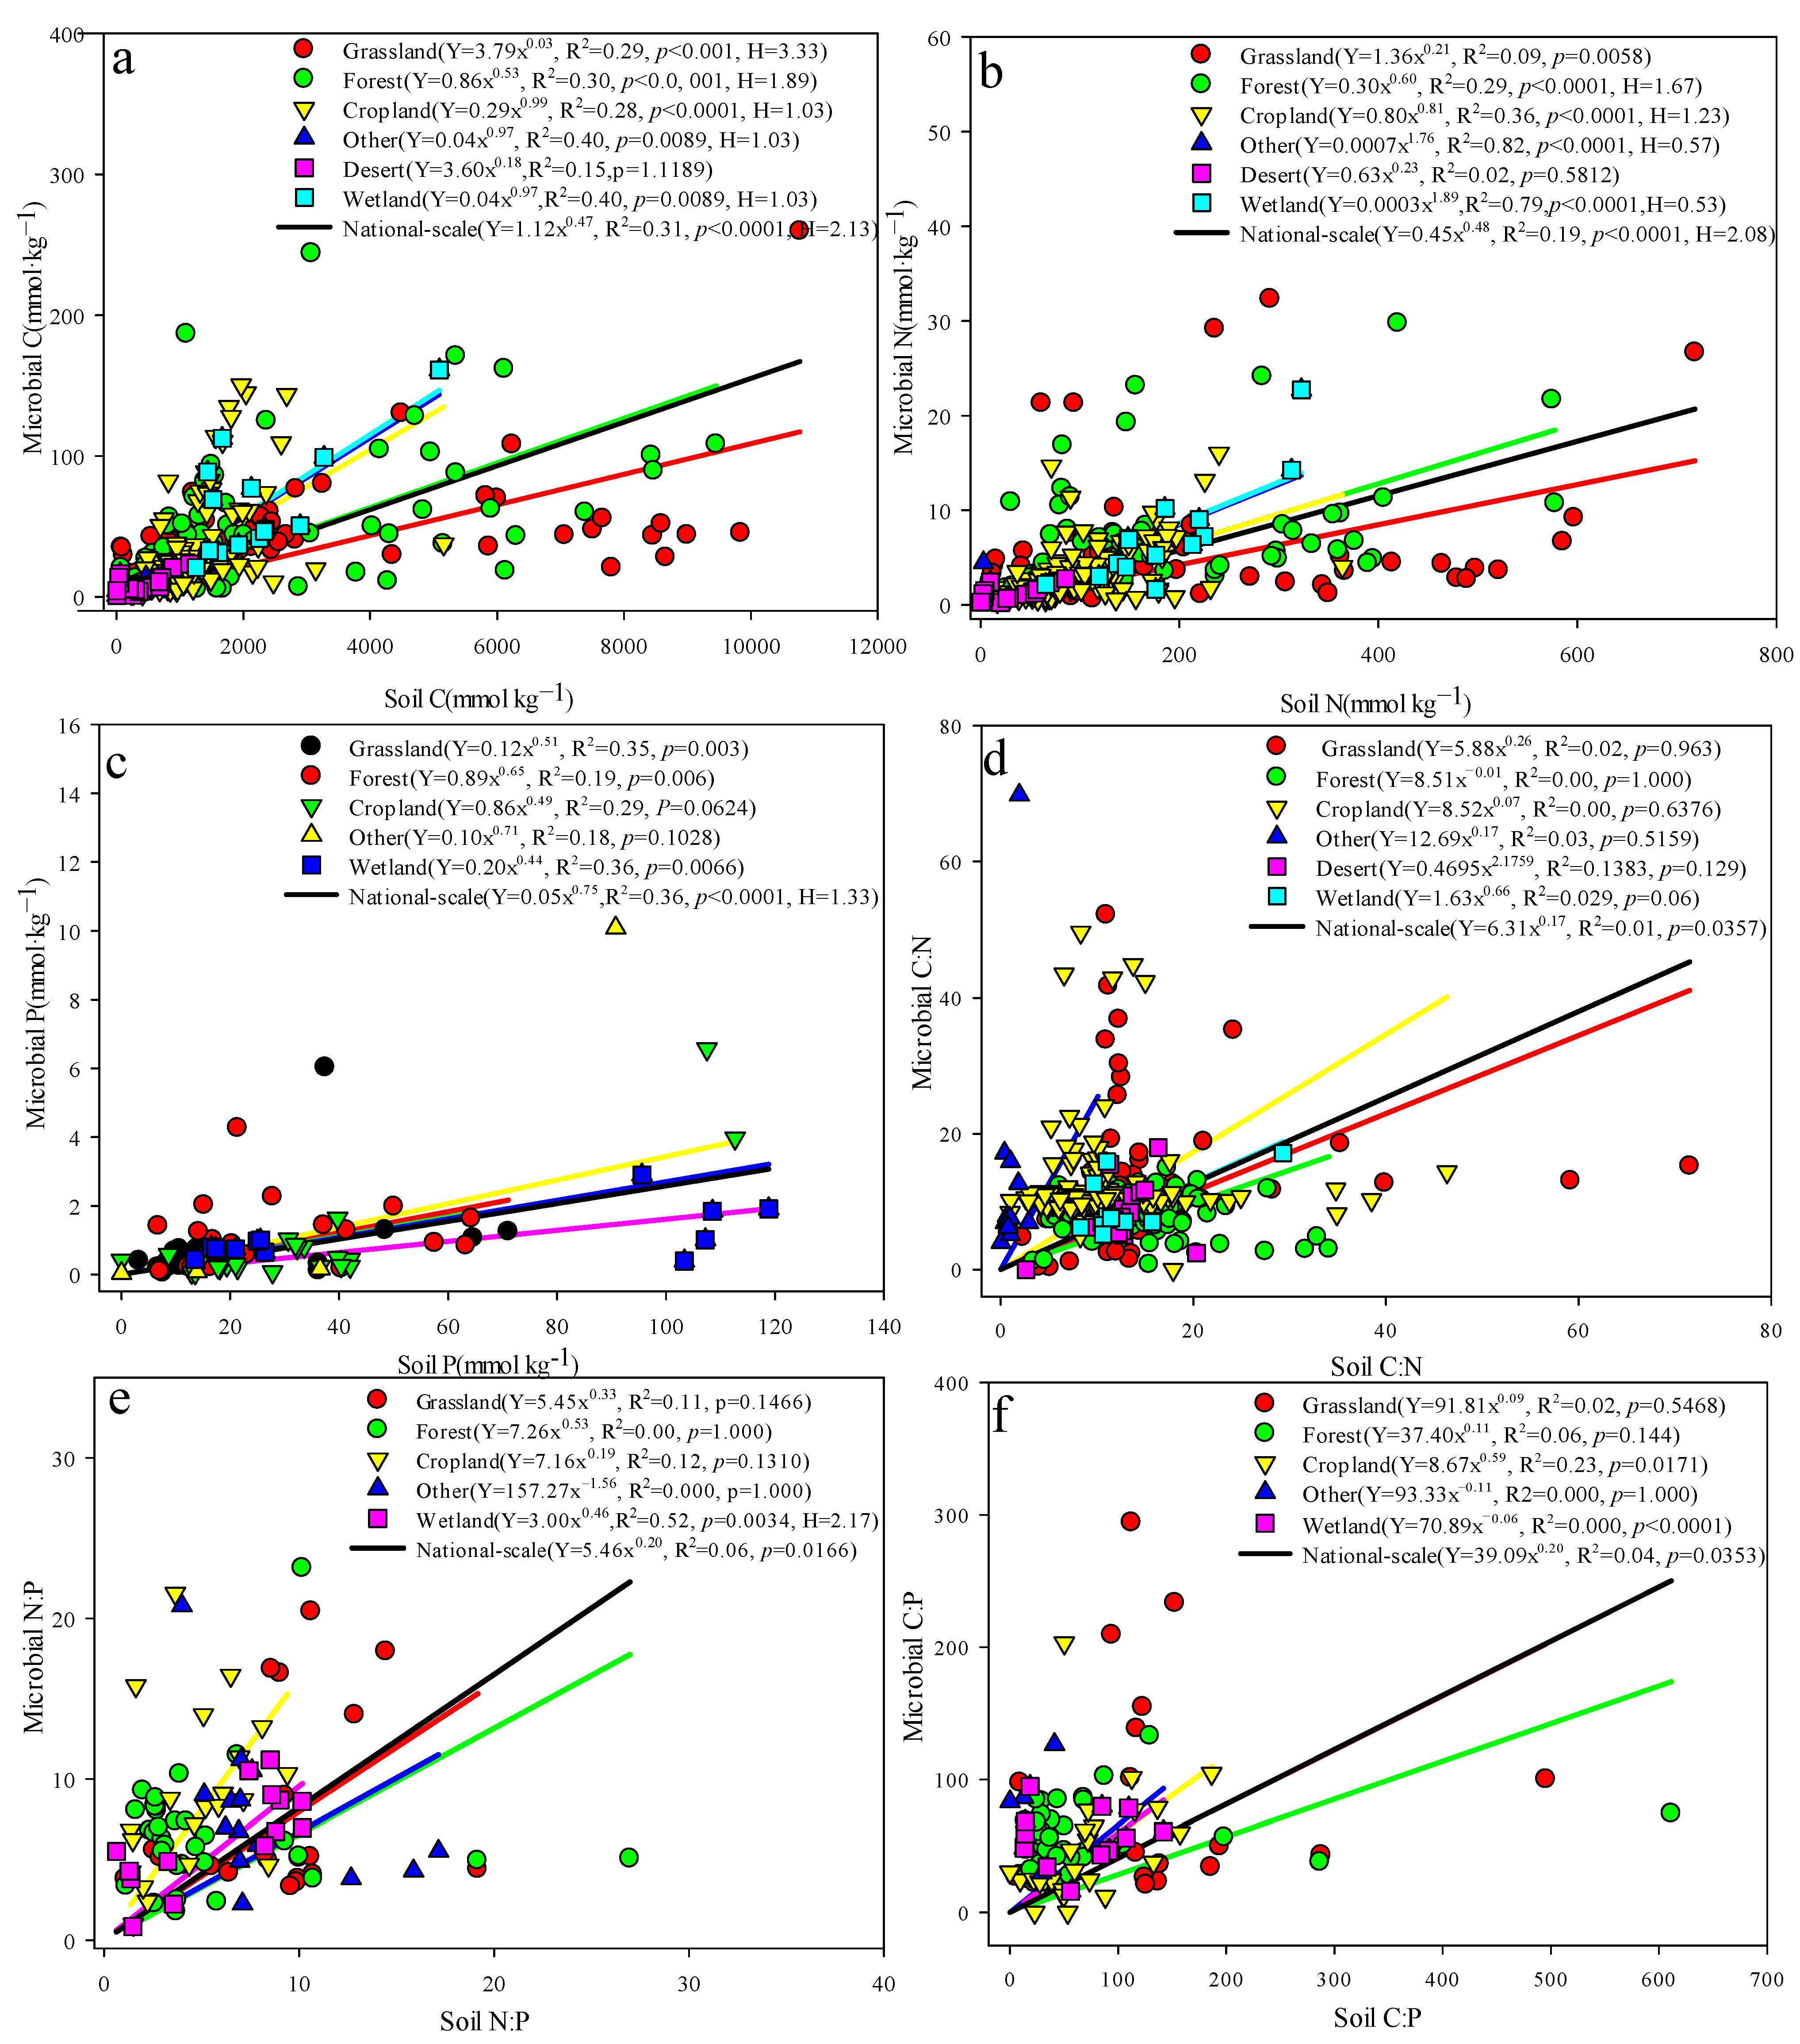
3.2. Correlation Analysis of Soil and Soil Microbial Biomass C, N, and P Concentrations and Their Ecological Stoichiometric Characteristics

Figure 5 shows significant correlations for soil and microbial C, N, and P in terrestrial ecosystems. The correlation coefficients between MBC and MBN, MBC and MBP, and MBN and MBP were 0.715, 0.479, and 0.428, respectively, and their correlations reached a significance level of p < 0.01; the correlation coefficients of soil C and N, C and P, and N and P were 0.894, 0.168, and 0.245, respectively, and the correlations were significant (p < 0.01). Correlation analysis of soils and soil microbial C, N, and P and their stoichiometric ratios (Figure 5) showed that MBC, MBN, and MBC:MBN were non-significantly correlated (p > 0.05), but MBC:MBP had a significant positive correlation with MBN:MBP (p < 0.05); MBP was non-significantly correlated with MBC:MBN and MBC:MBP (p > 0.05), but was significantly positively correlated with MBN:MBP (p < 0.05). MBC and MBN were significantly correlated with the C:N ratio (p < 0.05), but they were non-significantly correlated with the C:P and N:P ratios (p > 0.05), while MBP was correlated with the C:N, C:P, and N ratios. There were no correlations between the P ratios. In addition, the correlations between MBC, MBN and MBP, and the MBP:P ratio were extremely significant (p < 0.01). MBC:MBN had a significant negative correlation with soil C:P and N:P (p < 0.01); MBC:MBP and MBN:MBP had nonsignificant correlations with soil C:N, C:P, and N:P (p > 0.05), but N:P was significantly correlated with MBP:P.

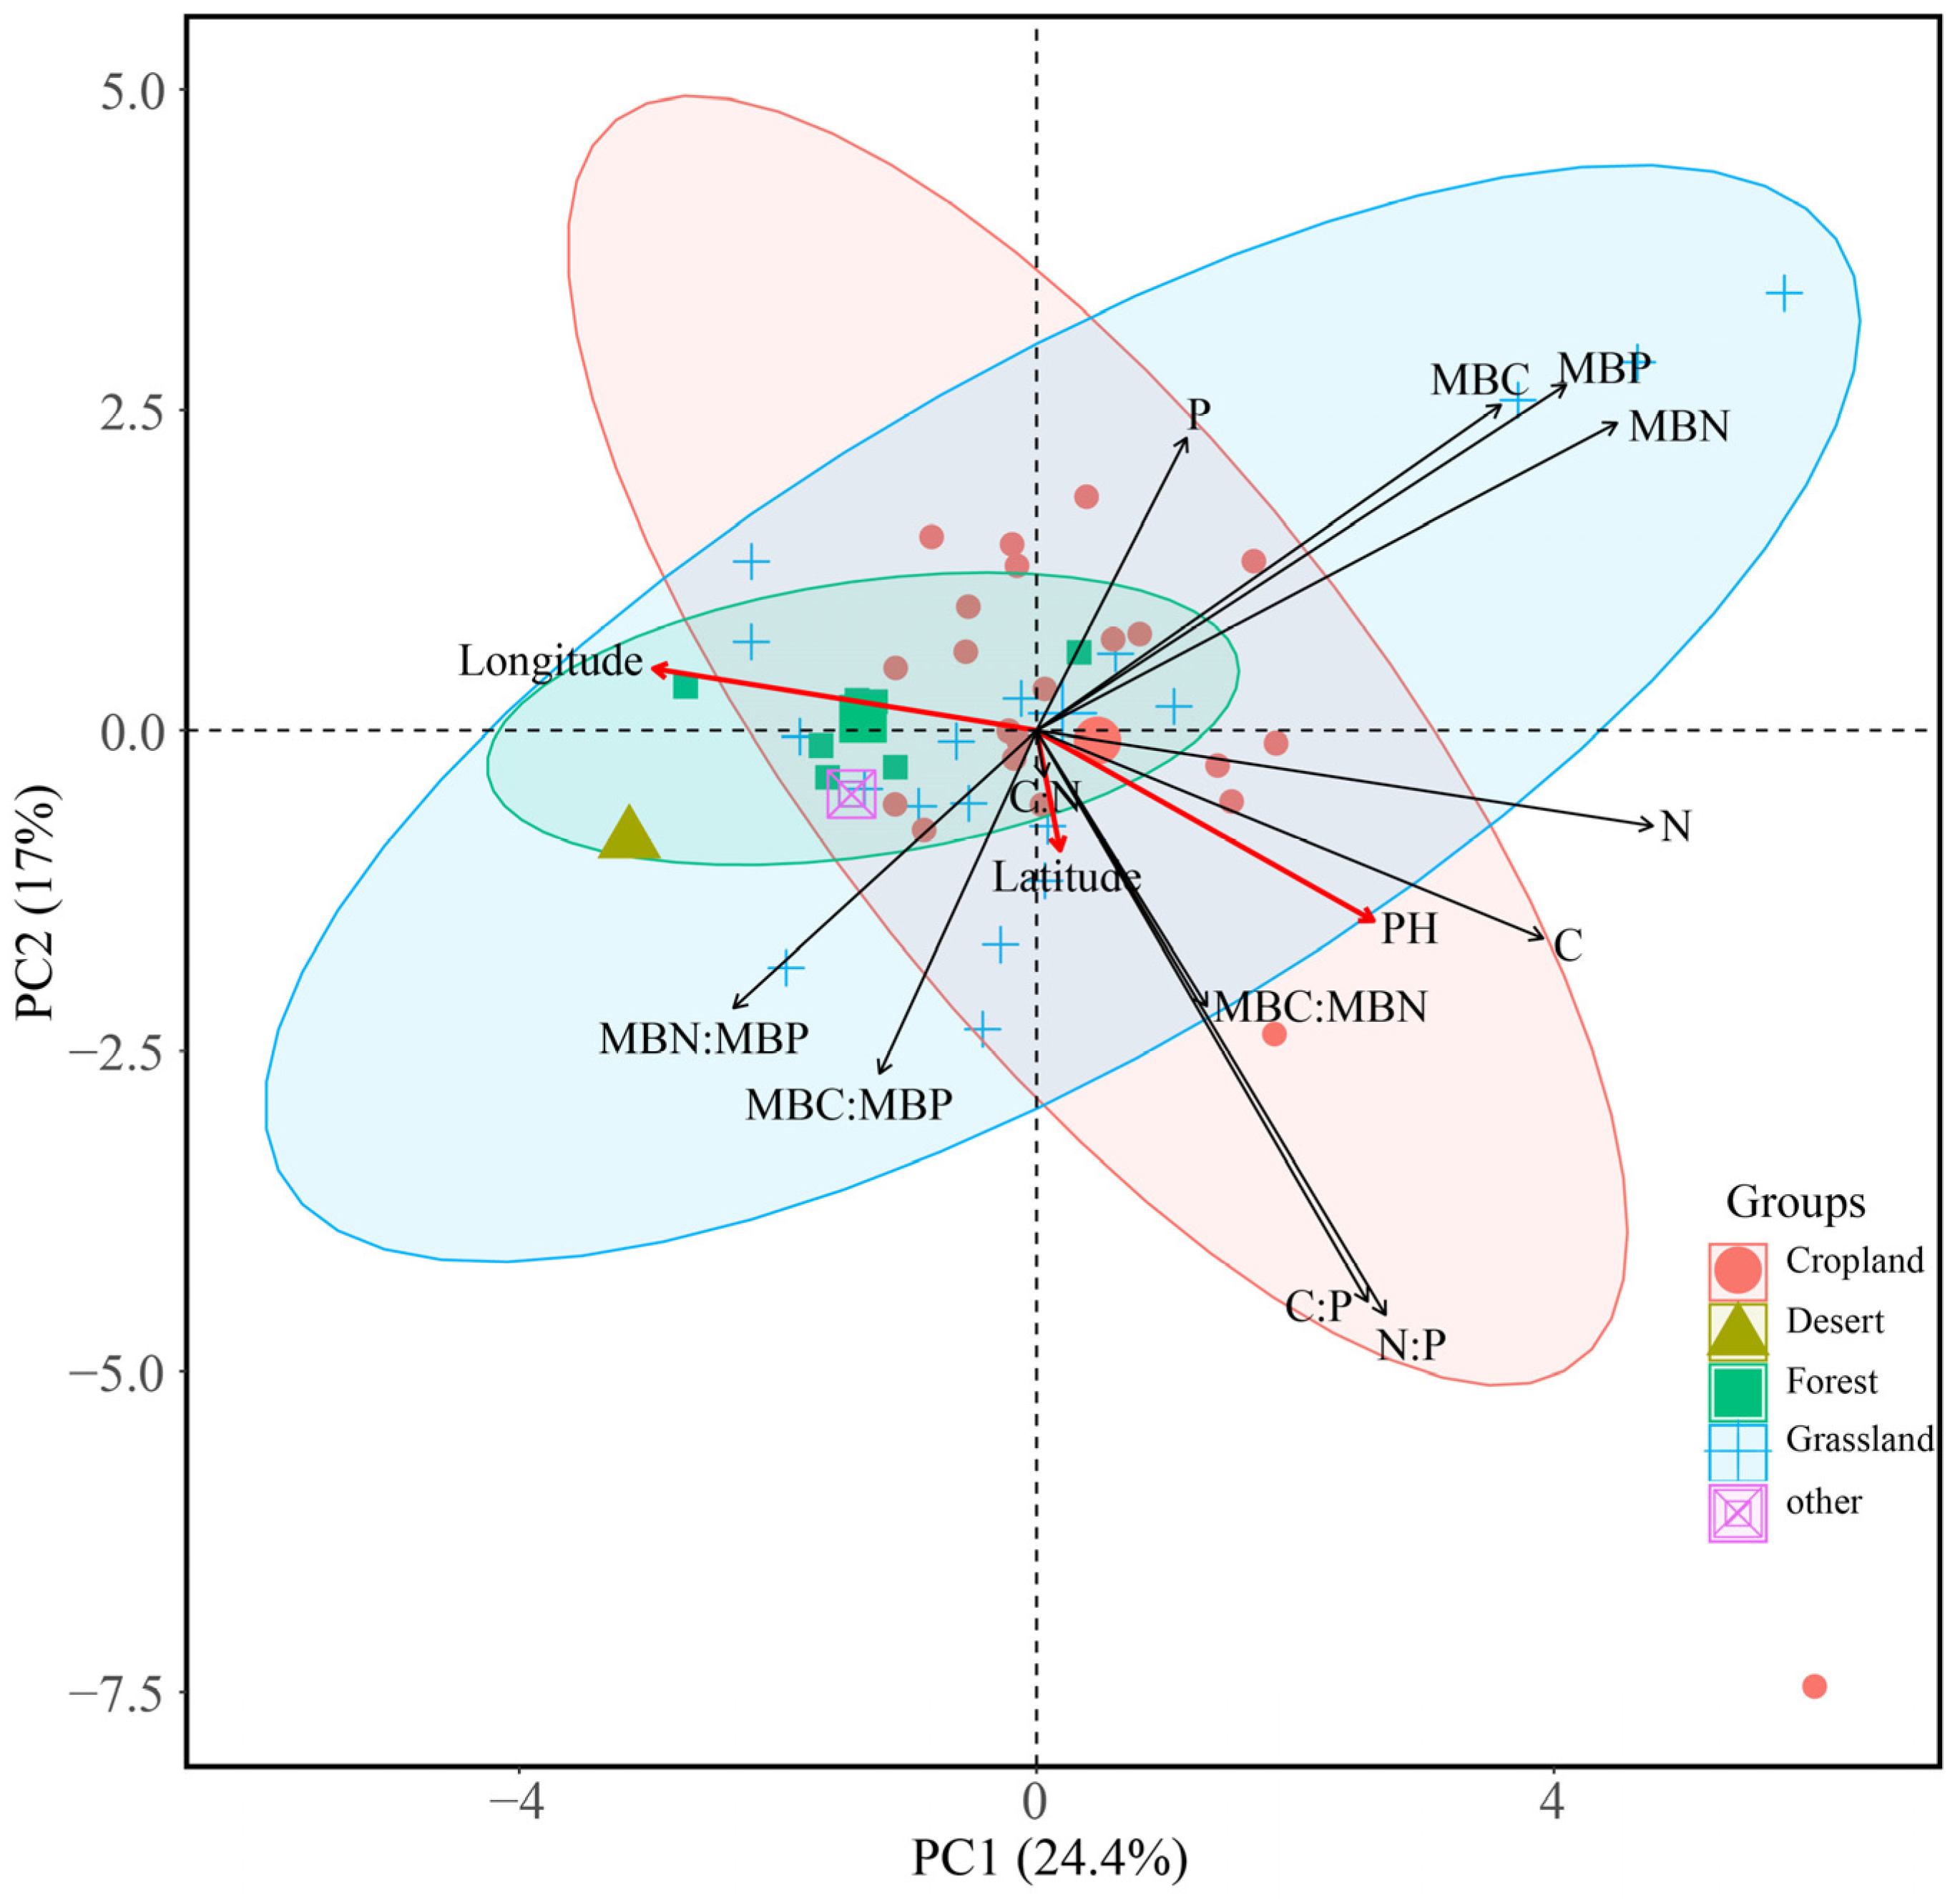
3.3. Relationships between Environmental Factors and Ecological Stoichiometry of Soil and Soil Microbial Biomass

Figure 6 shows that the C, N, and P concentrations of the soil were extremely negatively correlated with soil pH and latitude (p < 0.01), the C:N and C:P ratios of the soil were significantly negatively correlated with longitude (p < 0.05), and the C:P ratio was significantly positively correlated with latitude (p < 0.05). The C, N, and P concentrations of the soil microbial biomass were closely related to longitude, latitude, and pH (p < 0.01). MBC:MBN and MBC:MBP were mainly affected by pH. Principal component analysis of soil and soil microbial biomass C, N, and P concentrations revealed significant correlations between the soil C, N, and P concentrations and the soil MBC, MBN, and MBP concentrations (Figure 7). Principal component 1 explains 24.4% of the variation in the dependent variable variation, and principal component 2 explains 17%; principal component 1 is mainly related to latitude and pH, and principal component 2 is mainly positively correlated with longitude.

3.4. Characteristics of the Internal Stability of Soil Microbial C, N and P

Figure 8 shows that the concentration of soil microbial biomass C, N, and P increased with increasing soil C, N, and P concentrations. Correlation analysis and t-tests showed that the two were extremely significantly correlated (p < 0.001) (Figure 8a–c). The homeostasis index H values of soil microbial biomass C, N, and P were 2.13 (1/H = 0.47, weak steady-state type), 2.08 (1/H = 0.48, weak steady-state type), and 1.33 (1/H) = 0.75, sensitive type), showing weaker internal stability. Based on the p value and R2 shown in Figure 8d–f, the internal stability index values of the soil microbial biomass C:N, C:P, and N:P ratios cannot be calculated. In summary, soil microbial biomass C, N, and P concentrations have relatively weak internal stability, while soil microbial biomass C:N, C:P, and N:P ratios do not have internal stability.
Figure 8 shows that the internal stability indexes of different ecosystem types are quite different. In the grassland ecosystem type, only MBC satisfies the internal stability model, with values of H = 3.33, 1/H = 0.30, weak steady-state type, which is higher than the national-scale internal stability index (H = 2.13, 1/H = 0.47, weak steady-state type). The MBC:MBN, MBC:MBP, and MBN:MBP ratios do not exhibit internal stability. Under forest vegetation types, only MBC and MBN have internal stability indexes, with values of 1.89 (1/H = 0.53, weakly sensitive type) and 1.67 (1/H = 0.60, weakly sensitive type), respectively. The forest ecosystem MBC internal stability index (HC = 1.89, weak steady-state type) is lower than the MBC internal stability index for grassland ecosystems (H = 3.33, 1/H = 0.30, weak steady-state type), and the MBC:MBN, MBC:MBP, and MBN:MBP ratios are the same for forests and grasslands and do not have the characteristics of internal stability. MBC and MBN in cropland ecosystems have some internal stability, 1.01 (1/H = 0.99, sensitive type) and 1.23 (1/H = 0.81, sensitive type), respectively, but this stability is weaker than that of forest ecosystems. The internal stability index values of MBC:MBN, MBC:MBP, and MBN:MBP for cropland ecosystems cannot be calculated according to the internal stability model. For wetlands, the internal stability index values of MBC and MBN (H = 1.03, 1/H = 0.97, sensitive; H = 0.53, 1/H = 1.89, sensitive type, respectively) are significantly lower than the soil microbial homeostasis index of grassland, forest, and cropland ecosystems, and although the N:P ratio indicates internal stability (H = 2.17, 1/H = 0.46, weak steady-state type), the other measurements lack internal stability characteristics. In desert ecosystems, MBC, MBN, and MBP have no internal stability characteristics. In summary, soil microbial biomass C:N, C:P, and N:P ratios do not have internal stability in different terrestrial ecosystems.

4. Discussion

4.1. Is There a “Redfield-like” Ratio for Soil and Soil Microbial Biomass C:N:P in China’s Terrestrial Ecosystems?

Research on stoichiometric relationships mainly focuses on the three elements C, N, and P and was originally based on the study of phytoplankton in marine ecosystems. Scientists have discussed C:N:P stoichiometric characteristics from the perspectives of leaves, litter, and roots. For example, McGroddy et al. [27] studied the C:N:P metrological relationship between global forest leaves and litter and found that the C:N:P ratio is 12:28:1 for forest plant leaves and 3007:45:1 for litter. However, there are few reports of stoichiometric characteristics at the soil ecosystem scale. In contrast to marine ecosystems, strong spatial heterogeneity is the main reason for the variation in stoichiometric relationships in terrestrial ecosystems. The spatial heterogeneity of climate, topography, soil matrix (including soil depth), and biodiversity will affect the stoichiometric relationship of terrestrial ecosystems, complicating the study of ecological stoichiometry. Some scholars have concluded that C:N:P has relatively stable characteristics based on integrations of the stoichiometric characteristics of C, N, and P in the soil on a large scale, and this ratio usually fluctuates within a certain range [6,13]. For example, Cleveland and Liptzin [13] found that although the concentrations of C, N, and P in the soil vary widely globally, the C, N, and P concentrations in the soil have significant positive correlations. The ecological stoichiometric ratio of C, N, and P is also restricted to a very narrow range, where C:N is 2–30 (molar ratio) and N:P is 1–77. On average, the C:N:P ratio is 186:13:1, which is similar to the Redfield ratio in marine ecosystems. Tian et al. [14] found that, in the soil of China, the average C:N, C:P, and N:P ratios at depths (some soil profiles as deep as 250 cm) were 11.9, 61.0, and 5.2, respectively, and the C:N:P ratio was 60:5:1. These values are also similar to the ocean Redfield ratio. Our study analyzed 404 sets of data extracted from 170 published papers and found that the average C:N, C:P, and N:P ratios of soils in China’s terrestrial ecosystems were 10.7, 100.2, and 10.3, respectively, and the C:N:P ratio was stable at 66:5:1, which is close to the results reported by Tian et al. [14] (Table 2). In addition, there is a significant correlation between the content of C, N, and P in the soil, which verifies that there is a soil ratio similar to the Redfield ratio found in the ocean. However, the soil C:N:P ratios in this study and those reported by Tian et al. [14] are far lower than the average ratios of global soils [6,13], which shows that although C, N, and P restrict each other in different regions, their ecological stoichiometry changes with environmental changes. In our study, the C:N, C:P, and N:P ratios of soil microbial biomass elements were 13.7, 85.2, and 9.2, respectively, and the C:N:P molar ratio was 22:2:1, which was compared with the results of Cleveland and Liptzin [13] and Xu et al. [6]. There was a significant difference from the research results at the global scale (p > 0.05). However, there was an extremely significant positive correlation between the content of C, N, and P in the soil microbial biomass (Figure 5), which indicated that the soil microbial biomass C:N:P of China’s terrestrial ecosystems had a fixed Redfield ratio.

4.2. Can Soil Microbial Biomass N:P Be Used as a Tool to Evaluate Nutrient Limitations?

N and P are generally considered to be the most important limiting elements of plants in terrestrial ecosystems. Most scholars use the critical N:P ratio of plant leaves as an indicator of the nutrient supply status of the environment for plant growth [28,29]. However, soil N mainly comes from organic matter derived from litter and atmospheric nitrogen deposition. Its spatial distribution is mainly controlled by climatic conditions and soil-forming mechanisms [30], and their spatial distribution varies greatly, while soil P is mainly from rock weathering [31], with low spatial variability. Therefore, soil N:P was used as a diagnostic index of N saturation to determine the threshold of nutrient limitation. For example, the average soil N:P value of the loess hilly and gully area was 0.86, which is lower than the average value for Chinese soils, indicating that the soil in the loess hilly and gully area was N limited [32]. In 2007, Cleveland and Liptzin proved that soil microbial biomass N:P can also be used to reflect soil nutrient limitations in low-latitude tropical ecosystems [13]. Their research showed that high soil microbial biomass N:P indicates P limitation.
Research by Ren et al. [33] confirmed this view. However, their study did not examine the internal stability of soil microorganisms. Our study revealed that, in China’s terrestrial ecosystems, where the terrain is complex and changeable, there was a significant difference between the soil microbial biomass N:P (9.2) ratio and the average global N:P (6.9) (Table 2) as well as between the soil microbial biomass N:P ratio and the soil N:P ratio. The supply ratio is irrelevant (Figure 5). Furthermore, soil microbial biomass N:P is insensitive to vegetation zone changes (i.e., latitude changes) (Figure 6), which is inconsistent with the research results of Cleveland and Liptzin [13], indicating that soil microbes in China’s terrestrial ecosystems have no internal stability and may not be suitable for using to reflect the nutrient limitations of these ecosystems. Moreover, Figure 6 shows that the soil microbial biomass C, N, and P have relatively weak internal stability, while the soil microbial biomass C:N, C:P, and N:P do not have the characteristics of internal stability in different terrestrial ecosystems (Figure 6). Therefore, the use of soil microbial N:P as an indicator of the effect of soil nutrients is not universal, and there may be an inhibitory effect according to the soil and the environment in different regions.

4.3. What Are the Factors Affecting the C:N:P Ratio of Soil and Soil Microbial Biomass in China?

China has a vast territory, complex geographic environment, rich plant resources, and a high spatial heterogeneity of soil. Various environmental factors affecting soil development and geographic distribution will directly or indirectly influence the material cycle processes of C, N, and P in the soil [11,34]. The spatial patterns of soil and soil microbial biomass C:N:P have been extensively studied. Previous studies have shown that vegetation types have a greater impact on the chemical properties of soil than do other factors. Different vegetation types have a greater influence on the absorption, transportation, and distribution of chemical elements. Significant differences in utilization and release processes [35] can change soil properties (physical, chemical, and biological characteristics) and soil environmental conditions and affect many ecological processes [36,37]. For example, Bui and Henderson [38] studied soil C, N, and P under the main vegetation types in Australia and found that soil N:P and C:P have greater variability under different vegetation types. In our study, the C:P ratio of soil under all vegetation types except forest ecosystems was significantly lower than that of grasslands and wetlands (p < 0.05), and there were no significant differences among the other ecosystems (p > 0.05). The C:N ratio of soil microbial biomass differed significantly (wetlands had the greatest C:N ratio, grasslands and farmlands had the second greatest C:N ratio, and bare land had the lowest C:N ratio) (p < 0.05). There was no significant difference in C:P and N:P among different vegetation types. The influence of vegetation types on soils and soil microbial biomass and its stoichiometric characteristics does not show a universal pattern of spatial change.
The climate zone determines the soil development process, the vegetation succession sequence, and many other ecological processes on a large geographic scale. Climate zones reflect the distribution of water and heat characteristics across latitude and longitude [39]. Studies have confirmed that soil C mainly depends on the decomposition of litter and the soil organic matter content. Soil N mainly comes from organic matter derived from litter and the deposition of atmospheric nitrogen. Its spatial distribution is mainly controlled by climatic conditions and soil-forming mechanisms [30]; to a certain extent, C and N usually have the same, highly variable spatial distribution pattern [13]. Soil P exists and is stored in the form of sediment and has a specific chemical behavior in the soil [31], with low spatial variability, but climate change is the most important factor affecting the spatial distribution of soil P [40]. Therefore, in low-latitude regions, high temperatures and humid environments are conducive to the accumulation of soil organic matter [41] and rock weathering [42], and as latitude increases, these favorable hydrothermal conditions decrease. The aboveground biomass and litter of plants are continuously decreasing, and the weathering of rocks is weakened, resulting in a decrease in the content of decomposed and litter-derived organic matter that is transported to the soil [43]. From south to north, the concentrations of soil C, N, and P decrease. For example, Li et al. [42] found that global forest soil microbial biomass N:P decreases with increasing latitude, indicating that low-latitude areas and higher latitude areas are more restricted by P. The results of this study show that latitude has a very significant negative correlation with soil C, N, and P (p < 0.01), which is in line with the conclusions of previous studies. In contrast with soil C, N, and P, the correlations between soil microbial biomass C, N, and P and latitude were not significant (p > 0.05), but these soil factors had a significant positive correlation with longitude (p < 0.05) due to the zonality of longitude. The dominant factor influencing the pattern of differentiation is water, and water status is an important factor affecting soil microbial biomass. The availability of water directly affects microbial activity [44]. There are three obvious isohyets (800 mm, 400 mm, and 200 mm) from east to west in the area investigated in this study. The precipitation generally decreases from southeast to northwest, which greatly affects the soil moisture content. Some studies report that an increase in moisture leads to decreases in soil microbial biomass C:N and C:P [45,46,47,48], but Figure 7 shows that longitude has a significant negative correlation with soil microbial biomass C:N and C:P (p < 0.05), which is consistent with previous studies. This negative correlation exists because the increase in precipitation causes an increase in soil moisture, and the effect of soil microbes on N immobilization and enhanced P mineralization reduces soil microbial biomass C:N and C:P [49,50]. In addition, Chen et al. [51] found that the increase in moisture had no significant effect on soil microbial biomass N:P, but it changed the concentrations of soil microbial biomass N and P. In this study, longitude had no significant correlation with soil microbial biomass N:P (p > 0.05), but it had a very significant positive correlation with soil microbial biomass C, N, and P (p < 0.05), which is consistent with the conclusions of Chen et al. [49], indicating that changes in humidity increase mineralization and the absorption rate of soil nutrients.
Soil pH is an important controlling factor of the growth of soil bacterial communities. A decrease or increase in pH reflects the accumulation and decomposition of nutrients in the soil, with increasing pH resulting in changes in the concentration of soil and soil microbial biomass C, N, and P [51]. One study observed no correlation or a weak correlation between soil pH and soil microbial biomass C:N, C:P, and N:P ratios [52]. With the exception of the soil microbial biomass P and pH, which were not significantly correlated (p > 0.05), our study found that the other elements were extremely significantly negatively correlated with pH (Figure 7). However, soil pH was insignificantly correlated with soil C:N, C:P, N:P, or with MBC:MBN, MBC:MBP, MBN:MBP(p > 0.05) (Figure 6). This finding is similar to the results of previous studies and indicates that the pH value has a greater impact on the C, N, and P in the soil and its soil microorganisms, while the stoichiometric ratio of N and P has little effect. The ratios of soil and soil microbial biomass C:N, C:P, and N:P are internally stable, in line with the results of previous studies [13,14].

5. Conclusions

The molar C:N:P ratios in the soil (66:5:1 on average) and soil microbial biomass (22:2:1 on average) were both considered constrained. The former elemental ratio was remarkably close to the overall area- and depth-weighted atomic C:N:P ratio (60:5:1) reported by Tian [14]. The latter elemental ratio was significantly different from the global average soil microbial biomass atomic C:N:P ratio (60:7:1) for soil [13]. However, there is a significant correlation between the contents of C, N, and P in the soil microbial biomass, which indicates that the soil microbial biomass C:N:P of China’s terrestrial ecosystems has a fixed Redfield ratio. Our dataset revealed that soil microbial biomass C, N, and P concentrations have relatively weak internal stability, while soil microbial biomass C:N, C:P, and N:P ratios do not have internal stability at the national scale and in different terrestrial ecosystems. Therefore, we believe that using soil microbial biomass N:P as an indicator of soil nutrients does not have universal applicability. In addition, we found that latitude (heat) is the main factor that determines the change in soil C, N, and P, and longitude (moisture) is the main factor that determines the pattern of soil microbial biomass C, N, and P. Consequently, our study demonstrates that the spatial patterns of China’s soil and soil microbial biomass C, N, and P were statistically significant. Our dataset and analysis provide valuable supplementary information for the study of soil elemental ratios in China, especially soil microbial biomass C:N, C:P, and N:P ratios.

Author Contributions

Conceptualization, Y.P., F.F. and H.T.; methodology, Y.P., F.F. and H.T.; software, Y.P. and F.F.; validation, Y.P. and H.T.; writing-original draft preparation, Y.P. and H.T.; writing-review and editing, H.T.; visualization, Y.P. and F.F.; supervision, H.T.; project administration, H.T.; funding acquisition, H.T. All authors have read and agreed to the published version of the manuscript.

Funding

This research was supported by the National Natural Science Foundation of China (Grant No. 31972945) and the Second Tibetan Plateau Scientifc Expedition and Research Program (STEP, Grants No. 2019QZKK0606).

Institutional Review Board Statement

Not applicable.

Informed Consent Statement

Not applicable.

Data Availability Statement

The data presented in this study are available on request from the corresponding author. The data are not publicly available due to privacy.

Acknowledgments

We thank three anonymous reviewers for their valuable comments on the earlier manuscript. Han Lin from Fujian Agriculture and Forestry University kindly improved our English.

Conflicts of Interest

We declare that we have no financial or personal relationships with other people or organizations that could inappropriately influence our work, and there is no professional or other personal interest of any nature or kind in any product related to this work.

References

  1. Michaels, A.F. The ratios of life. Science 2003, 300, 906–907. [Google Scholar] [CrossRef]
  2. Li, Z.; Tian, D.; Wang, B.; Wang, J.; Wang, S.; Chen, H.Y.H.; Xu, X.; Wang, C.; He, N.; Niu, S. Microbes drive global soil nitrogen mineralization and availability. Glob. Change Biol. 2019, 25, 1078–1088. [Google Scholar] [CrossRef]
  3. Tao, Y. Fire Interference on Forest Soil Microbial Communities and the Mechanism: A Review. Sci. Silvae Sin. 2013, 49, 146–157. [Google Scholar]
  4. An, S.S.; Mentler, A.; Acosta-Martínez, V.; Blum, W. Soil microbial parameters and stability of soil aggregate fractions under different grassland communities on the Loess Plateau, China. Biologia 2009, 64, 424–427. [Google Scholar] [CrossRef]
  5. Trivedi, P.; Anderson, I.C.; Singh, B.K. Microbial modulators of soil carbon storage: Integrating genomic and metabolic knowledge for global prediction. Trends Microbiol. 2013, 21, 641–651. [Google Scholar] [CrossRef] [PubMed]
  6. Xu, X.; Thornton, P.E.; Post, W.M. A global analysis of soil microbial biomass carbon, nitrogen and phosphorus in terrestrial ecosystems. Global Ecol. Biogeogr. 2013, 22, 737–749. [Google Scholar] [CrossRef]
  7. Redfield, A. The biological control of chemical factors in the environment. Am. Sci. 1958, 46, 205–221. [Google Scholar]
  8. Schindler, D.W. Balancing planets and molecules. Nature 2003, 423, 225–226. [Google Scholar] [CrossRef]
  9. Zeng, D.H.; Chen, G.S. Ecological stoichiometry: A science to explore the complexity of living systems. Chin. J. Plant Ecol. 2005, 29, 1007–1019. [Google Scholar]
  10. Wang, X.; Song, Y.; Huo, G.; Zhang, F. Research advances of soils and plants ecological stoichiometry. J. Dalian Minzu Univ. 2016, 18, 437–442. [Google Scholar]
  11. Zhang, Z.; Xue, Z.; Liu, X. Is There a Redfield-Type C:N:P Ratio in Chinese Wetland Soils? Acta Pedol. Sin. 2016, 53, 1160–1169. [Google Scholar]
  12. Blodau, C. Carbon cycling in peatlands-A review of processes and controls. Environ. Rev. 2002, 10, 111–134. [Google Scholar] [CrossRef]
  13. Cleveland, C.C.; Liptzin, D. C:N:P stoichiometry in soil: Is there a “Redfield ratio” for the microbial biomass? Biogeochemistry 2007, 85, 235–252. [Google Scholar] [CrossRef]
  14. Tian, H.; Chen, G.; Zhang, C.; Melillo, J.M.; Hall, C.A. Pattern and variation of C:N:P ratios in China’s soils: A synthesis of observational data. Biogeochemistry 2010, 98, 139–151. [Google Scholar] [CrossRef]
  15. Yang, Z.F.; Yu, T.; Hou, Q.Y.; Xia, X.; Feng, H.; Huang, C.; Wang, L.; Lv, Y.; Zhang, M. Geochemical evaluation of land quality in China and its applications. J. Geochem. Explor. 2014, 139, 122–135. [Google Scholar] [CrossRef]
  16. Cao, Y.; Zhang, P.; Chen, Y.M. Soil C:N:P stoichiometry in plantations of N-fixing black locust and indigenous pine, and secondary oak forests in Northwest China. J. Soils Sediments 2018, 18, 1478–1489. [Google Scholar] [CrossRef]
  17. Liu, J.; Gou, X.; Zhang, F.; Bian, R.; Yin, D. Spatial patterns in the C: N: P stoichiometry in Qinghai spruce and the soil across the Qilian Mountains, China. Catena 2021, 196, 104814. [Google Scholar] [CrossRef]
  18. Wang, H.; Ren, T.; Müller, K.; Van Zwieten, L.; Wang, H.; Feng, H.; Xu, C.; Yun, F.; Ji, X.; Yin, Q.; et al. Soil type regulates carbon and nitrogen stoichiometry and mineralization following biochar or nitrogen addition. Sci. Total Environ. 2021, 753, 141645. [Google Scholar] [CrossRef] [PubMed]
  19. Chen, X.; Zhang, H.; Yao, X.; Zeng, W.; Wang, W. Latitudinal and depth patterns of soil microbial biomass carbon, nitrogen, and phosphorus in grasslands of an agro-pastoral ecotone. Land Degrad. Dev. 2021, 32, 3833–3846. [Google Scholar] [CrossRef]
  20. Zhao, H.; Sun, J.; Xu, X.; Qin, X. Stoichiometry of soil microbial biomass carbon and microbial biomass nitrogen in China’s temperate and alpine grasslands. Eur. J. Soil Biol. 2017, 83, 1–8. [Google Scholar] [CrossRef]
  21. Zhou, W.; Gang, C.; Zhou, L.; Chen, Y.; Li, J.; Ju, W.; Odeh, I. Dynamic of grassland vegetation degradation and its quantitative assessment in the Northwest China. Acta Oecol. 2014, 55, 86–96. [Google Scholar] [CrossRef]
  22. Joergensen, R.G.; Wu, J.S.; Brookes, P.C. Measuring soil microbial biomass using an automated procedure. Soil Biol. Biochem. 2011, 43, 873–876. [Google Scholar] [CrossRef]
  23. Sterner, R.W.; Elser, J.J. Ecological Stoichiometry: The Biology of Elements from Molecules to the Biosphere; Princeton University Press: Princeton, NJ, USA, 2002; pp. 225–226. 439p. [Google Scholar]
  24. Hood, J.M.; Sterner, R. Diet mixing: Do animals integrate growth or resources across temporal heterogeneity? Am. Nat. 2010, 176, 651–663. [Google Scholar] [CrossRef] [PubMed] [Green Version]
  25. Persson, J.; Fink, P.; Goto, A. To be or not to be what you eat: Regulation of stoichiometric homeostasis among autotrophs and heterotrophs. Oikos 2010, 119, 741–751. [Google Scholar] [CrossRef]
  26. Xing, W.; Wu, H.; Shi, Q.; Hao, B.; Liu, H.; Wang, Z.; Liu, G. Multielement stoichiometry of submerged macrophytes across Yunnan plateau lakes (China). Sci. Rep. 2015, 5, 10186. [Google Scholar] [CrossRef] [PubMed] [Green Version]
  27. McGroddy, M.E.; Daufresne, T.; Hedin, L.O. Scaling of C:N:P stoichiometry in forest worldwide: Implications of terrestrial Redfield-type ratios. Ecology 2004, 85, 2390–2401. [Google Scholar] [CrossRef]
  28. Koerselman, W.; Meuleman, A.F.M. The vegetation N:P ratio: A new tool to detect the nature of nutrient limitation. J. Appl. Ecol. 1996, 33, 1441–1450. [Google Scholar] [CrossRef]
  29. Güsewell, S. N/P ratios in terrestrial plants: Variation and functional significance. New Phytol. 2004, 164, 243–266. [Google Scholar] [CrossRef]
  30. Hu, L.J.; Shao, M.A.; Yang, W.Z. Relationship between vegetation spatial collocations and soil moisture spatial heterogeneities in the Loess Plateau area. Acta Pratacul. Sin. 2004, 13, 14–20. [Google Scholar]
  31. Li, B.; Yang, C.; Lin, P. Ecology; Higher Education Press: Beijing, China, 2000. [Google Scholar]
  32. Zhu, Q.L.; Xing, Y.Y.; Zhang, H.; An, S. Soil ecological stoichiometry under different vegetation area on loess hilly-gully region. Acta Ecol. Sin. 2013, 33, 4674–4682. [Google Scholar]
  33. Ren, C.; Zhao, F.; Kang, D.; Yang, G.; Han, X.; Tong, X.; Feng, Y.; Ren, G. Linkages of C:N:P stoichiometry and bacterial community in soil following afforestation of former farmland. For. Ecol. Manag. 2016, 376, 59–66. [Google Scholar] [CrossRef]
  34. Lovett, G.M.; Weathers, K.C.; Arthur, M.A. Control of nitrogen loss from forested watersheds by soil carbon: Nitrogen ratio and tree species composition. Ecosystems 2002, 5, 712–718. [Google Scholar] [CrossRef]
  35. Sistla, S.A.; Appling, A.P.; Lewandowska, A.M.; Taylor, B.N.; Wolf, A.A. Stoichio-metric flexibility in response to fertilization along gradients of environmental and organismal nutrient richness. Oikos 2015, 124, 949–959. [Google Scholar] [CrossRef]
  36. Malchair, S.; Carnol, M. Microbial biomass and C and N transformations in forest floors under European beech, sessile oak, Norway spruce and Douglas-fir at four temperate forest sites. Soil Biol. Biochem. 2009, 41, 831–839. [Google Scholar] [CrossRef]
  37. Liu, C.; Liu, Y.K.; Jin, G.Z. Seasonal dynamics of soil microbial biomass in six forest types in Xiaoxing’an Mountains, China. Acta Ecol. Sin. 2014, 34, 451–459. [Google Scholar]
  38. Bui, E.N.; Henderson, B.L. C:N:P stoichiometry in Australian soils with respect to vegetation and environmental factors. Plant Soil 2013, 373, 553–568. [Google Scholar] [CrossRef]
  39. Walter, H.; Box, E. Global classification of natural terrestrial ecosystems. Vegetatio 1976, 32, 75–81. [Google Scholar] [CrossRef]
  40. Zhang, X.; Ma, L.; Chen, Y.; Yang, J.; An, S. Ecological stoihiometry characteristics of Robinia pseudoacacia forest soil in different latitudes of Loess Plateau. Acta Pedol. Sin. 2013, 50, 818–825. [Google Scholar]
  41. Bai, J.; Deng, W.; Zhu, Y.; Luan, Z.; Zhang, Y. Spatial distribution characteristics and ecological of effects of carbon and nitrogen of soil in Huolin River catchment wetland. J. Appl. Ecol. 2003, 14, 1494–1498. [Google Scholar]
  42. Li, T.; Deng, Q.; Yuan, Z.Y.; Jiao, F. Latitudinal changes in plant stoichiometric and soil C, N, P stoichiometry in Loess Plateau. Environ. Sci. 2015, 36, 2988–2996. [Google Scholar]
  43. Tu, X.; Cao, J.; Han, Y.; Shen, Z.; Zhang, B. Storage and spatial distribution of organic and inorganic carbon in the topsoil of Loess Plateau. J. Arid Land Resour. Environ. 2012, 26, 114–118. [Google Scholar]
  44. Díaz-Ravia, M.; Acea, M.J.; Carballas, T. Seasonal changes in microbial biomass and nutrient flush in forest soils. Biol. Fert. Soils 1995, 19, 220–226. [Google Scholar] [CrossRef]
  45. Dijkstra, F.A.; Pendall, E.; Morgan, J.A.; Blumenthal, D.M.; Carrillo, Y.; LeCain, D.R.; Follett, R.F.; Williams, D.G. Climate change alters stoichiometry of phosphorus and nitrogen in a semiarid grassland. New Phytol. 2012, 196, 807–815. [Google Scholar] [CrossRef] [PubMed] [Green Version]
  46. Djukic, I.; Zehetner, F.; Watzinger, A.; Horacek, M.; Gerzabek, M.H. In situcarbon turnover dynamics and the role of soil microorganisms therein: A climate warming study in an Alpine ecosystem. FEMS Microbiol. Ecol. 2013, 83, 112–124. [Google Scholar] [CrossRef] [Green Version]
  47. Drake, J.E.; Darby, B.A.; Giasson, M.A.; Kramer, M.A.; Phillips, R.P.; Finzi, A.C. Stoichiometry constrains microbial response to root exudation: Insights from a model and a field experiment in a temperate forest. Biogeosciences 2013, 10, 821–838. [Google Scholar] [CrossRef] [Green Version]
  48. Ren, C.; Zhao, F.; Shi, Z.; Chen, J.; Han, X.; Yang, G.; Feng, Y.; Ren, G. Differential responses of soil microbial biomass and carbon-degrading enzyme activities to altered precipitation. Soil Biol. Biochem. 2017, 115, 1–10. [Google Scholar] [CrossRef]
  49. Chen, Y.L.; Chen, L.Y.; Peng, Y.F.; Ding, J.Z.; Li, F.; Yang, G.B.; Kou, D.; Liu, L.; Fang, K.; Zhang, B.B.; et al. Linking microbial C: N: P stoichiometry to microbial community and abiotic factors along a 3500 km grassland transect on the Tibetan Plateau. Glob. Ecol. Biogeogr. 2016, 25, 1416–1427. [Google Scholar] [CrossRef]
  50. Lambers, H.; Shane, M.W.; Cramer, M.D.; Pearse, S.J.; Veneklaas, E.J. Root structure and functioning for efficient acquisition of phosphorus: Matching morphological and physiological traits. Ann. Bot. 2006, 98, 693–713. [Google Scholar] [CrossRef] [Green Version]
  51. Fierer, N.; Jackson, R.B. The diversity and biogeography of soil bacterial communities. Proc. Natl. Acad. Sci. USA 2006, 103, 626–631. [Google Scholar] [CrossRef] [Green Version]
  52. Liu, Y.Q. Ecological C:N:P Stoichiometry of Soil Microorganisms and Its Driving Factors in Grassland of Inner Mongolia. Master’s Thesis, Nanjing Normal University, Nanjing, China, 2019. [Google Scholar]
Figure 1. Distribution map of ecosystem types of China. The data were acquired from the Resource and Environmental Science Data Center of the Chinese Academy of Sciences (https://www.resdc.cn/data.aspx?DATAID=198) (accessed on 3 November 2021).
Forests 12 01544 g001
Figure 2. Distribution of sampling sites used in this synthesis; 386 out of 404 data points with geographical coordinates are shown in this map.
Forests 12 01544 g002
Figure 3. Soils (a) and soil microbial biomass (b) carbon (C), nitrogen (N), and phosphorus (P) concentrations for each vegetation type across global forest ecosystems. Different lowercase letters indicate significant differences among vegetation types at p < 0.05. MBC, soil microbial biomass carbon content; MBN, soil microbial biomass nitrogen content; MBP, soil microbial biomass phosphorus content. The same abbreviations are used in subsequent tables and figures.
Forests 12 01544 g003
Figure 4. Frequency distributions of C:N (a), C:P (b), and N:P (c) for terrestrial ecosystems in China.
Forests 12 01544 g004
Figure 5. Relationships between the C, N, and P concentrations of the soil and soil microbial biomass. Red indicates a positive correlation, and blue indicates a negative correlation.
Forests 12 01544 g005
Figure 6. Structural equation modeling of the effects of different ecological variables on the C, N, and P concentrations and the C:N, N:P, and C:P ratios in soil and soil microbial biomass. The dotted lines indicate a significant negative correlation (0.01 < p < 0.05), and the solid lines indicate a significant positive correlation (0.01 < p < 0.05). * and ** indicate significant correlation at the 0.05 and 0.01 level, respectively.
Forests 12 01544 g006
Figure 7. Relationships between environmental factors and ecological stoichiometry of soil and soil microbial biomass.
Forests 12 01544 g007
Figure 8. Internal stability index values in different terrestrial ecosystems of China. (af) respectively represent the internal stability index of soil MBC, MBN, MBP, MBC: MBN, MBC: MBP, MBN: MBP under different terrestrial ecosystems.
Forests 12 01544 g008
Table 1. Soil and soil microbial biomass C:N, N:P, and C:P in different terrestrial ecosystems of China.
Different EcosystemsC:NC:PN:PMBC:MBNMBC:MBPMBN:MBP
Grassland11.92 ± 9.19 ab143.36 ± 253.32 a13.08 ± 17.96 a14.53 ± 10.29 b181.85 ± 241.91 a10.61 ± 14.35 b
Forest8.43 ± 3.35 ab92.54 ± 130.09 a13.83 ± 22.76 a14.12 ± 5.77 b97.56 ± 196.69 b6.07 ± 4.49 bc
Cropland12.01 ± 10.35 ab113.85 ± 296.64 a8.89 ± 8.46 a12.60 ± 17.09 b73.03 ± 52.09 bc6.29 ± 3.98 b
Desert12.56 ± 3.31 a34.97 ± 26.62 a2.88 ± 2.09 a8.55 ± 3.79 c1.48 ± 0.99 c0.20 ± 0.20 d
Wetland16.94 ± 1.89 bNaNa26.96 ± 16.97 a2.23 ± 17.50 c2.32 ± 0.88 a
Other8.11 ± 3.99 ab63.19 ± 25.50 a7.33 ± 4.57 a12.29 ± 4.40 bc58.57 ± 41.32 bc4.72 ± 3.18 cd
Overall10.69100.1910.3313.785.159.23
Note: Values are means. Different letters above the table indicate significant differences among different ecosystems at p < 0.05. Na, not available. MBC:MBN, soil microbial biomass C and N ratio; MBC:MBP, soil microbial biomass C and P ratio; MBN:MBP, soil microbial biomass N and P ratio. The same abbreviations are used in subsequent tables and figures.
Table 2. Molar ratios in the microbial biomass and total soil element pools compared to other Redfield-like ratios.
RegionSoil NutrientsSoil Microbial BiomassCitations
C:NC:PN:PC:N:PC:NC:PN:PC:N:P
Global14.3 ± 0.5 *186.0 ± 12.9 *13.1 ± 0.8 *186:13:018.6 ± 0.359.5 ± 3.66.9 ± 0.460:07:01Cleveland & Liptzin [13]
16.4 *286.5 *17.5 *287:17:017.642.45.642:06:01Xu et al. [6]
China11.9 ± 0.161.0 ± 0.95.2 ± 0.160:05:01----Tian et al. [14]
10.7100.210.366:05:0113.7 *85.2 *9.2 *22:02:01Our study
Note: * indicate significant correlation at the 0.05 level.
Publisher’s Note: MDPI stays neutral with regard to jurisdictional claims in published maps and institutional affiliations.

