Article

How Does Radial Growth of Water-Stressed Populations of European Beech (Fagus sylvatica L.) Trees Vary under Multiple Drought Events?

1
Site Classification and Vegetation Science, Institute of Forest Science, Faculty of Environment and Natural Resources, University of Freiburg, Tennenbacherstr.4, 79085 Freiburg, Germany
2
Research Centre Human Biometeorology, German Weather Service, Stefan-Meier-str.4, 79104 Freiburg, Germany
3
Research Group Sylvanus, Institute for Technology Assessment and Systems Analysis, Karlsruhe Institute of Technology, Karlstr.11, 76133 Karlsruhe, Germany
*
Authors to whom correspondence should be addressed.
Forests 2021, 12(2), 129; https://doi.org/10.3390/f12020129
Submission received: 4 January 2021 / Revised: 20 January 2021 / Accepted: 20 January 2021 / Published: 24 January 2021
(This article belongs to the Special Issue Drought Resilience of Forest Trees)

Abstract

:
European beech (Fagus sylvatica L.) trees are becoming vulnerable to drought, with a warming climate. Existing studies disagree on how radial growth varies in European beech in response to droughts. We aimed to find the impact of multiple droughts on beech trees’ annual radial growth at their ecological drought limit created by soil water availability in the forest. Besides, we quantified the influence of competition and canopy openness on the mean basal area growth of beech trees. We carried out this study in five near-natural temperate forests in three localities of Germany and Switzerland. We quantified available soil water storage capacity (AWC) in plots laid in the transition zone from oak to beech dominated forests. The plots were classified as ‘dry’ (AWC < 60 mL) and ‘less-dry’ (AWC > 60 mL). We performed dendroecological analyses starting from 1951 in continuous and discontinuous series to study the influence of climatic drought (i.e., precipitation-potential evapotranspiration) on the radial growth of beech trees in dry and less-dry plots. We used observed values for this analysis and did not use interpolated values from interpolated historical records in this study. We selected six drought events to study the resistance, recovery, and resilience of beech trees to drought at a discontinuous level. The radial growth was significantly higher in less-dry plots than dry plots. The increase in drought had reduced tree growth. Frequent climatic drought events resulted in more significant correlations, hence, increased the dependency of tree growth on AWC. We showed that the recovery and resilience to climatic drought were higher in trees in less-dry plots than dry plots, but it was the opposite for resistance. The resistance, recovery, and resilience of the trees were heterogeneous between the events of drought. Mean growth of beech trees (basal area increment) were negatively impacted by neighborhood competition and positively influenced by canopy openness. We emphasized that beech trees growing on soil with low AWC are at higher risk of growth decline. We concluded that changes in soil water conditions even at the microsite level could influence beech trees’ growth in their drought limit under the changing climate. Along with drought, neighborhood competition and lack of light can also reduce beech trees’ growth. This study will enrich the state of knowledge about the ongoing debate on the vulnerability of beech trees to drought in Europe.

1. Introduction

Increasing summer temperature and decreasing precipitation have caused drought-induced die-back and growth decline in the temperate forests of Europe in recent decades [1,2]. European beech (Fagus sylvatica L.) trees are regarded as vulnerable to drought because of the species’ physiological constraints and the decline in tree growth [3,4,5]. Beech trees are essential components of European temperate forests and have high ecological, social, and economic values [6]. Although beech trees excel in many sites, their distribution is mostly limited by the soil water availability in dry areas [7,8]. Moreover, hotter and drier summers could affect beech trees as the climate warms in Europe [4]. The populations at the lower latitudinal limit of beech distribution are more vulnerable to drought than other populations [5]. In those regions, the chance of cavitation, and the susceptibility to drought-induced death, increase, and trees are often outcompeted by more drought-tolerant species such as Quercus spp., Pinus spp., Sorbus torminalis (L.) Crantz and Sorbus aria Crantz [9,10]. However, numerous studies contradict the claims on the shrinking distribution of beech trees under a warmer climate in Europe and emphasize the importance of site-level factors such as water availability in the maintenance of beech vitality [11,12,13]. Beech trees cope better with drought stress when they grow in mixed forests because facilitation by co-occurring trees reduces mortality [14]. Pretzsch et al. (2014) described that beech trees have a higher yield in poor than in fertile sites in low-growth than in high-growth years, but this phenomenon’s underlying mechanism is not clear yet [15]. Such contrasting findings have challenged forest practitioners to take appropriate measures to manage and preserve the beech forests. Therefore, more field research should be conducted to understand beech trees’ growth response to drought in natural mixed forests at dry sites, both at a tree and stand level. A population of trees previously weakened by a site-limiting factor such as water availability could be more vulnerable to multiple events of extreme drought. The reduction in tree growth in response to those events could be more prominent at the trees’ dry distribution limit [16]. On the contrary, such micro-climatic variation due to low soil water storage at their dry distribution limit might help the trees to adapt with their own plasticity by creating a more drought-resistant population [17]. However, the trees’ ecological performance could differ among the individuals depending on their resource availability and utilization [18]. Therefore, to focus on beech trees’ response to drought, we conducted this study in near-natural forest sites in which beech trees were growing naturally at their dry distribution limit created by soil water availability with oaks and other broadleaves [19].
With its changing magnitude and frequency, drought is one of the critical environmental and climatic drivers for the variation of the trees’ radial growth [20]. Hence, tree rings’ dendroecological assessment provides a suitable approach to analyze retrospective responses of past drought events on tree growth at multiple spatial and temporal scales [21,22]. Earlier studies had shown high correlations between the growth of beech trees, temperature, and precipitation [23]. Moreover, beech trees of different populations from multiple sites had shown variability in climate-growth relations in elevational and precipitation gradients [7,10]. However, it remains unclear whether such variation in climate-growth dependency occurs within the same population in a forest stand when water is limiting, under the multiple event of severe droughts.
The resistance of trees to severe drought events, the subsequent recovery, and the overall resilience of trees, i.e., the capacity to reach pre-drought levels of the radial growth, are essential attributes to assess the ecological fitness of a species under drought [24]. Central Europe is facing severe drought events since the mid-twentieth century, and the frequency and magnitudes of such events will increase [25]. These droughts affect the resistance, recovery, and resilience of the trees [24]. Studies comparing recovery, resistance, and resilience of radial growth in beech trees to multiple drought events between dry and less-dry habitats in Europe are few because of lack of dendrochronological data from such sites [13,26], however, are of utmost importance to evaluate the ecological performance of the trees under stress.
We selected five near-natural forests in Germany and Switzerland for this study. In those forests, beech trees grew naturally from seeds and were located in soils with low water storage capacity [19]. Low water availability could have variable impacts on individual beech trees under drought stress depending on the soil profile where the tree is growing [27]. The main aim of our research was to assess the radial growth of beech trees under drought stress in the trees growing on soils with heterogeneous water storage capacity (i.e., dry plots vs. less-dry plots) by performing a dendroecological analysis of the past 60 years (1951 to 2010) in forests prone to multiple climatic drought events. Besides, we wanted to study the influence of competition and canopy openness on the mean growth (i.e., mean basal area increment) of beech trees growing on dry and less-dry plots. The objectives of our study were:
  • to compare the radial growth between beech trees from dry and less-dry plots;
  • to establish the influence of temperature, precipitation, and drought on radial growth of beech trees in dry and less-dry plots over the last 60 years;
  • to compare the resistance, recovery, and resilience of beech trees between dry and less-dry plots after multiple drought years;
  • to quantify the influence of neighborhood plant-plant competition, canopy openness, and water availability status (i.e., dry plots vs. less-dry plots) on the mean basal area increment in beech trees.

2. Materials and Methods

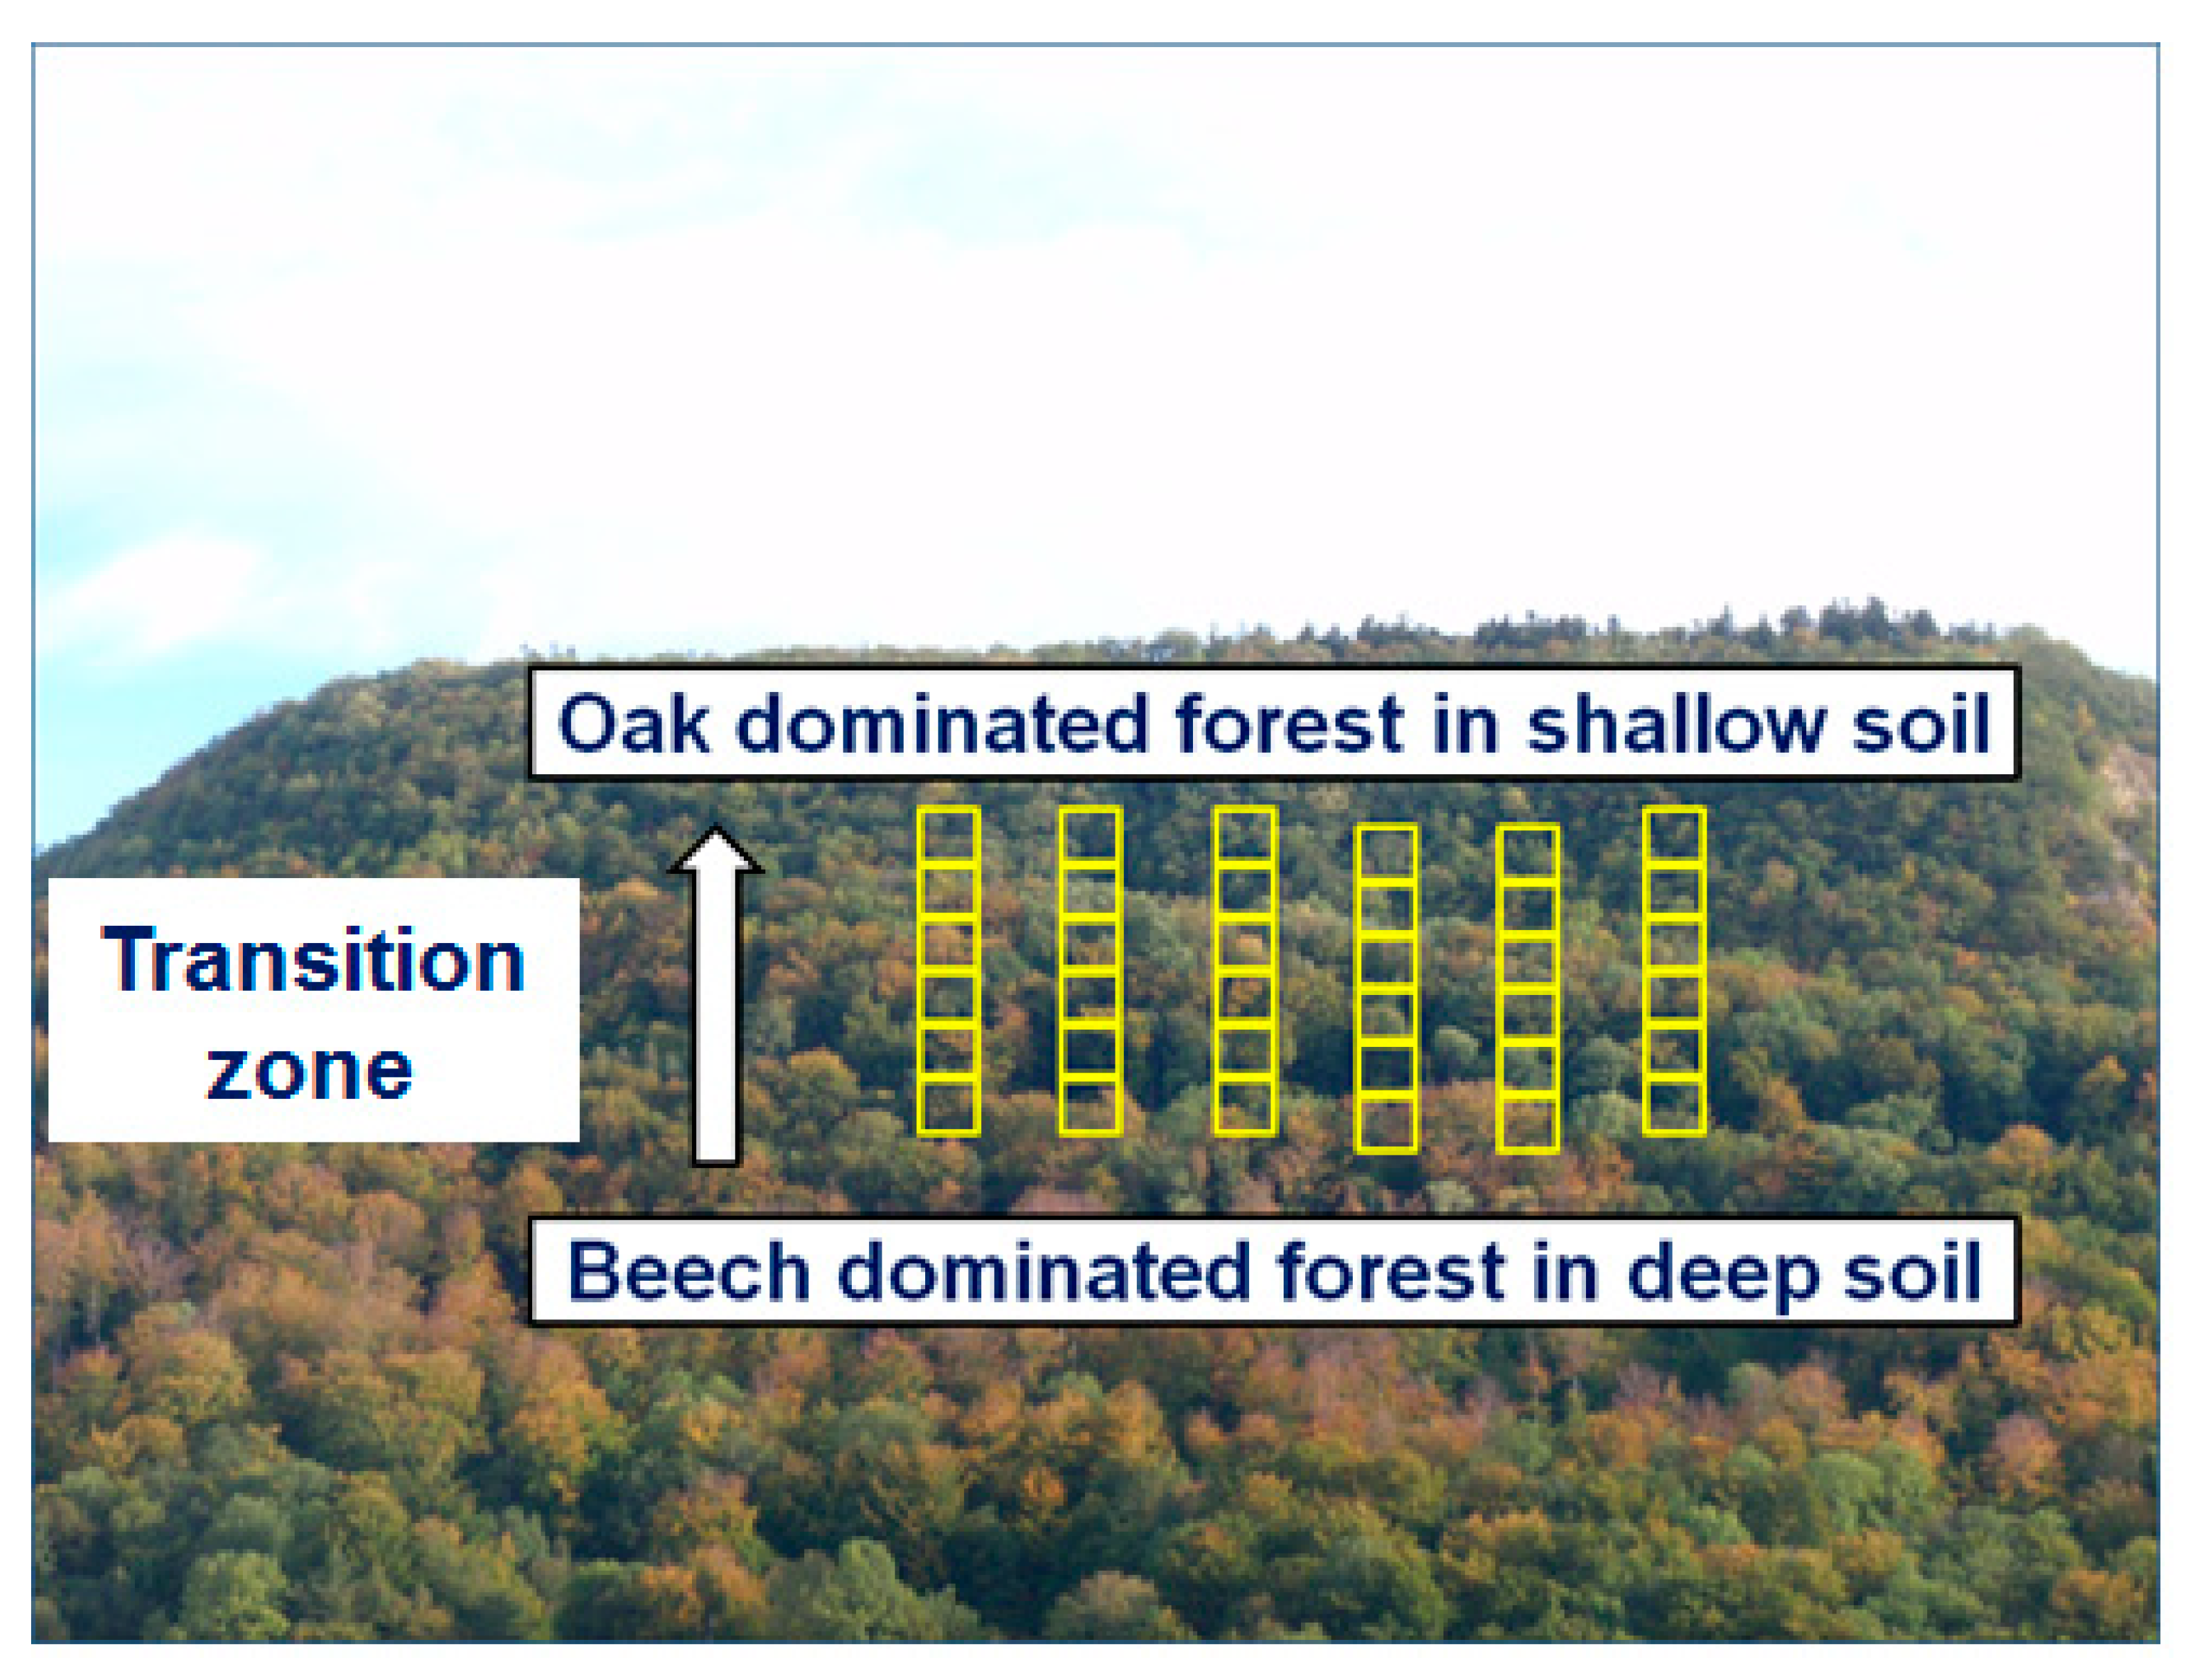
2.1. Study Locations and Sampling Design

This study was conducted by analyzing data collected from five forests located on south-facing rocky hill slopes with a low soil water storage capacity in southern Germany and northern Switzerland during 2012 and 2013 (Table 1, Figure 1). These forests were historically managed as oak (Quercus petraea (Matt.) Liebl., Q. pubescens Schwarz) coppice forests but remain unmanaged since the 1950s. Old coppiced oak trees dominate the canopy layer under which naturally regenerated beech trees are found in a mixture with other broadleaf tree species. Beech-dominated mixed forests in the lower hill slopes with deep soil to the adjacent sites form a transitional zone with the oak-dominated forests in the upper hill slopes with shallow soil (Figure 2). So, these transitional forest zones are established in areas where beech trees’ occurrence and establishment are limited by water availability due to the topographic effect on soil and solar radiation effect at aspect [14,19]. The beech trees found in those transition areas are mostly young intermediate to co-dominant trees along with the seedlings and saplings. Our sampling area for this study were those oak-beech transition zones of those five locations. For this study, we sampled intermediate and co-dominant beech trees, as it is known that younger trees can be more susceptible to drought than older and more established trees. Detailed dendrometric information of the sampled beech trees is given in Table 2.
The transition areas had heterogeneous soil conditions depending on the soil depth and rock contents, which created heterogeneity of soil water availability at the microsite level. To capture the soil water heterogeneity, we laid at least three transects starting from beech-dominated forests at one end to oak-dominated forests at the other end in each forest stand. Each transect was subdivided into continuous 10 × 10-m quadrat plots, which allowed us to evaluate heterogeneous soil conditions for a total of 67 plots on 19 transects (Figure 2). Overall, 56 beech trees were felled from 44 out of 67 plots in the five forests because some plots only had saplings; hence, they were not considered in this study. The stem discs at DBH (tree diameter at the height of 1.3 m) were collected from 56 trees, and the tree rings were analyzed in the laboratory (Table 2).

2.2. Tree Ring Analysis
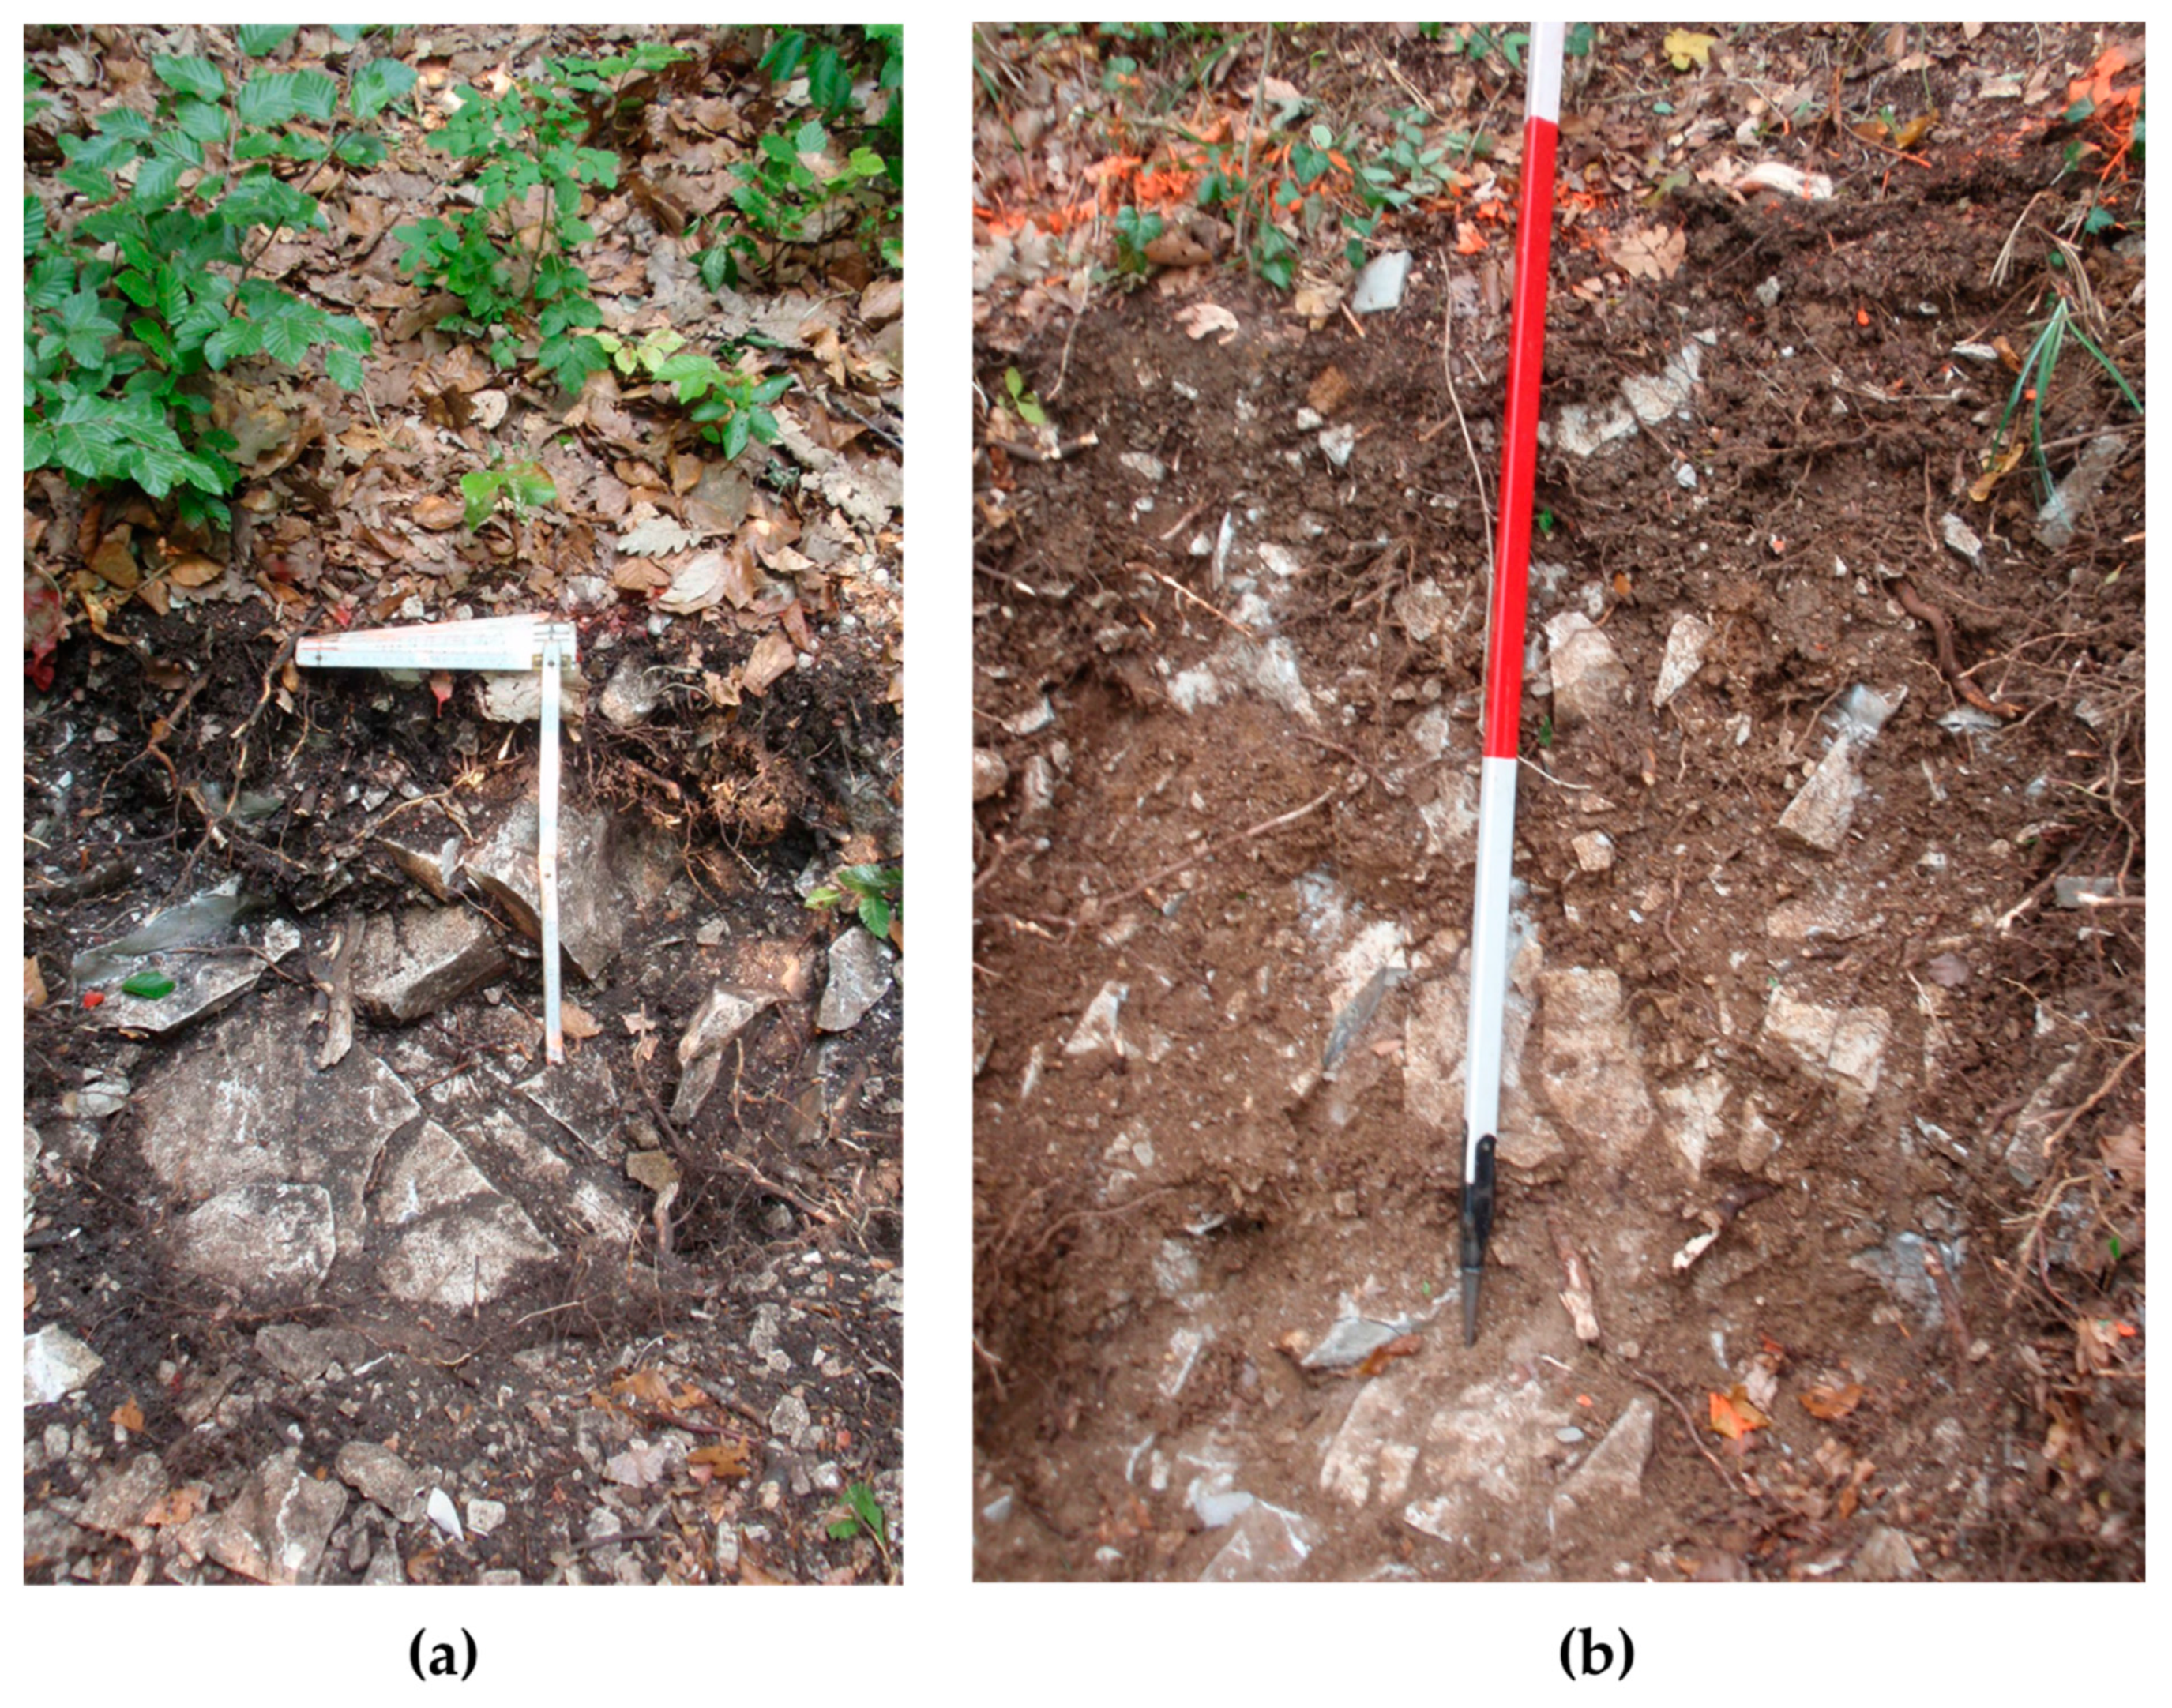
Tree ring width (TRW) and age were measured for the 56 sampled stem discs (Table 2) with the software WinDENDRO (Regent Instrument Inc. 2008). As we used whole discs, TRW was measured at four radial directions for each stem, and an average of the four radii was used for each year. Here, TRW means the average value of the four radii of each year. Raw TRW data were cross-dated visually and then statistically by using the software COFECHA [32]. Mean sensitivity was calculated to measure the year-to-year variability in tree growth [33]. The signal strength of the chronology was measured by using the mean inter-series correlation (“rbar”) of the whole series and expressed population signal (i.e., “EPS”) [21] (Table 2).
The chronology series was built by detrending and indexing (standardizing) the TRW data using the ARSTAN software [34] that removed the age trend, which was not controlled by the climate and might act as noise in climate-growth comparisons. The series were detrended by using 32 years of cubic smoothing spline function after transforming the raw data with the adaptive power transformation and removing the first-order autocorrelation, which could reduce the biological inertia to some extent. Residual TRW chronologies were built by using Tukey’s bi-weight robust mean.
We also calculated basal area increment (BAI) from the raw TRW. The mean BAI chronology was calculated year wise for each tree in Microsoft Excel as follows:
B a s a l   a r e a   i n c r e m e n t = π ( r n 2 r n 1 2 )
where r = radius of the tree, here the average value of the four radii of each year, n = the year of TRW formation, and π = 3.14.
In total, 12 tree ring chronologies were built together for dry and less-dry plots, which are as follows: six chronologies based on residual chronologies, and another six chronologies based on mean BAI for both dry and less-dry plots for three study locations (Table 2, Figure 3). These 12 chronologies were further used for the analysis. The mean BAI chronology was used in the recovery, resilience, and resistance analysis [33], whereas residual TRW chronology was used for the climate-growth correlation analysis.

2.3. Soil Analyses

For all plots, the slope, aspect, Global Positioning System (GPS) coordinates, and elevation were recorded. A one-meter wide soil profile was dug at the center of each 10 × 10-m plot until the compact bedrock was reached to record soil properties (Figure 4). Available soil water storage capacity (AWC) was calculated using soil texture, humus content, soil depth horizon thickness, and skeleton content for each plot following the method developed by the Food and Agriculture Organization of the United Nations (2006) [35,36,37]. We brought horizon-specific soil samples from the field to the laboratory to perform soil chemical and physical analyses. Soil texture analysis, pH, and nutrients were analyzed in the laboratory. The AWC ranged from 24 to 168 mm, and of the 44 plots, we classified 24 plots as “dry” (AWC < 60 mm) and 20 plots as “less-dry” (AWC > 60 mm), following the aridity classification of German Soil Classification Working Group [38]. We wanted to know whether soil nutrient availability differs between dry and less-dry plots. Therefore, we compared the concentrations of soil micro and macronutrients between dry and less-dry plots and did not find any significant difference (Table S1 in the Supplementary document).

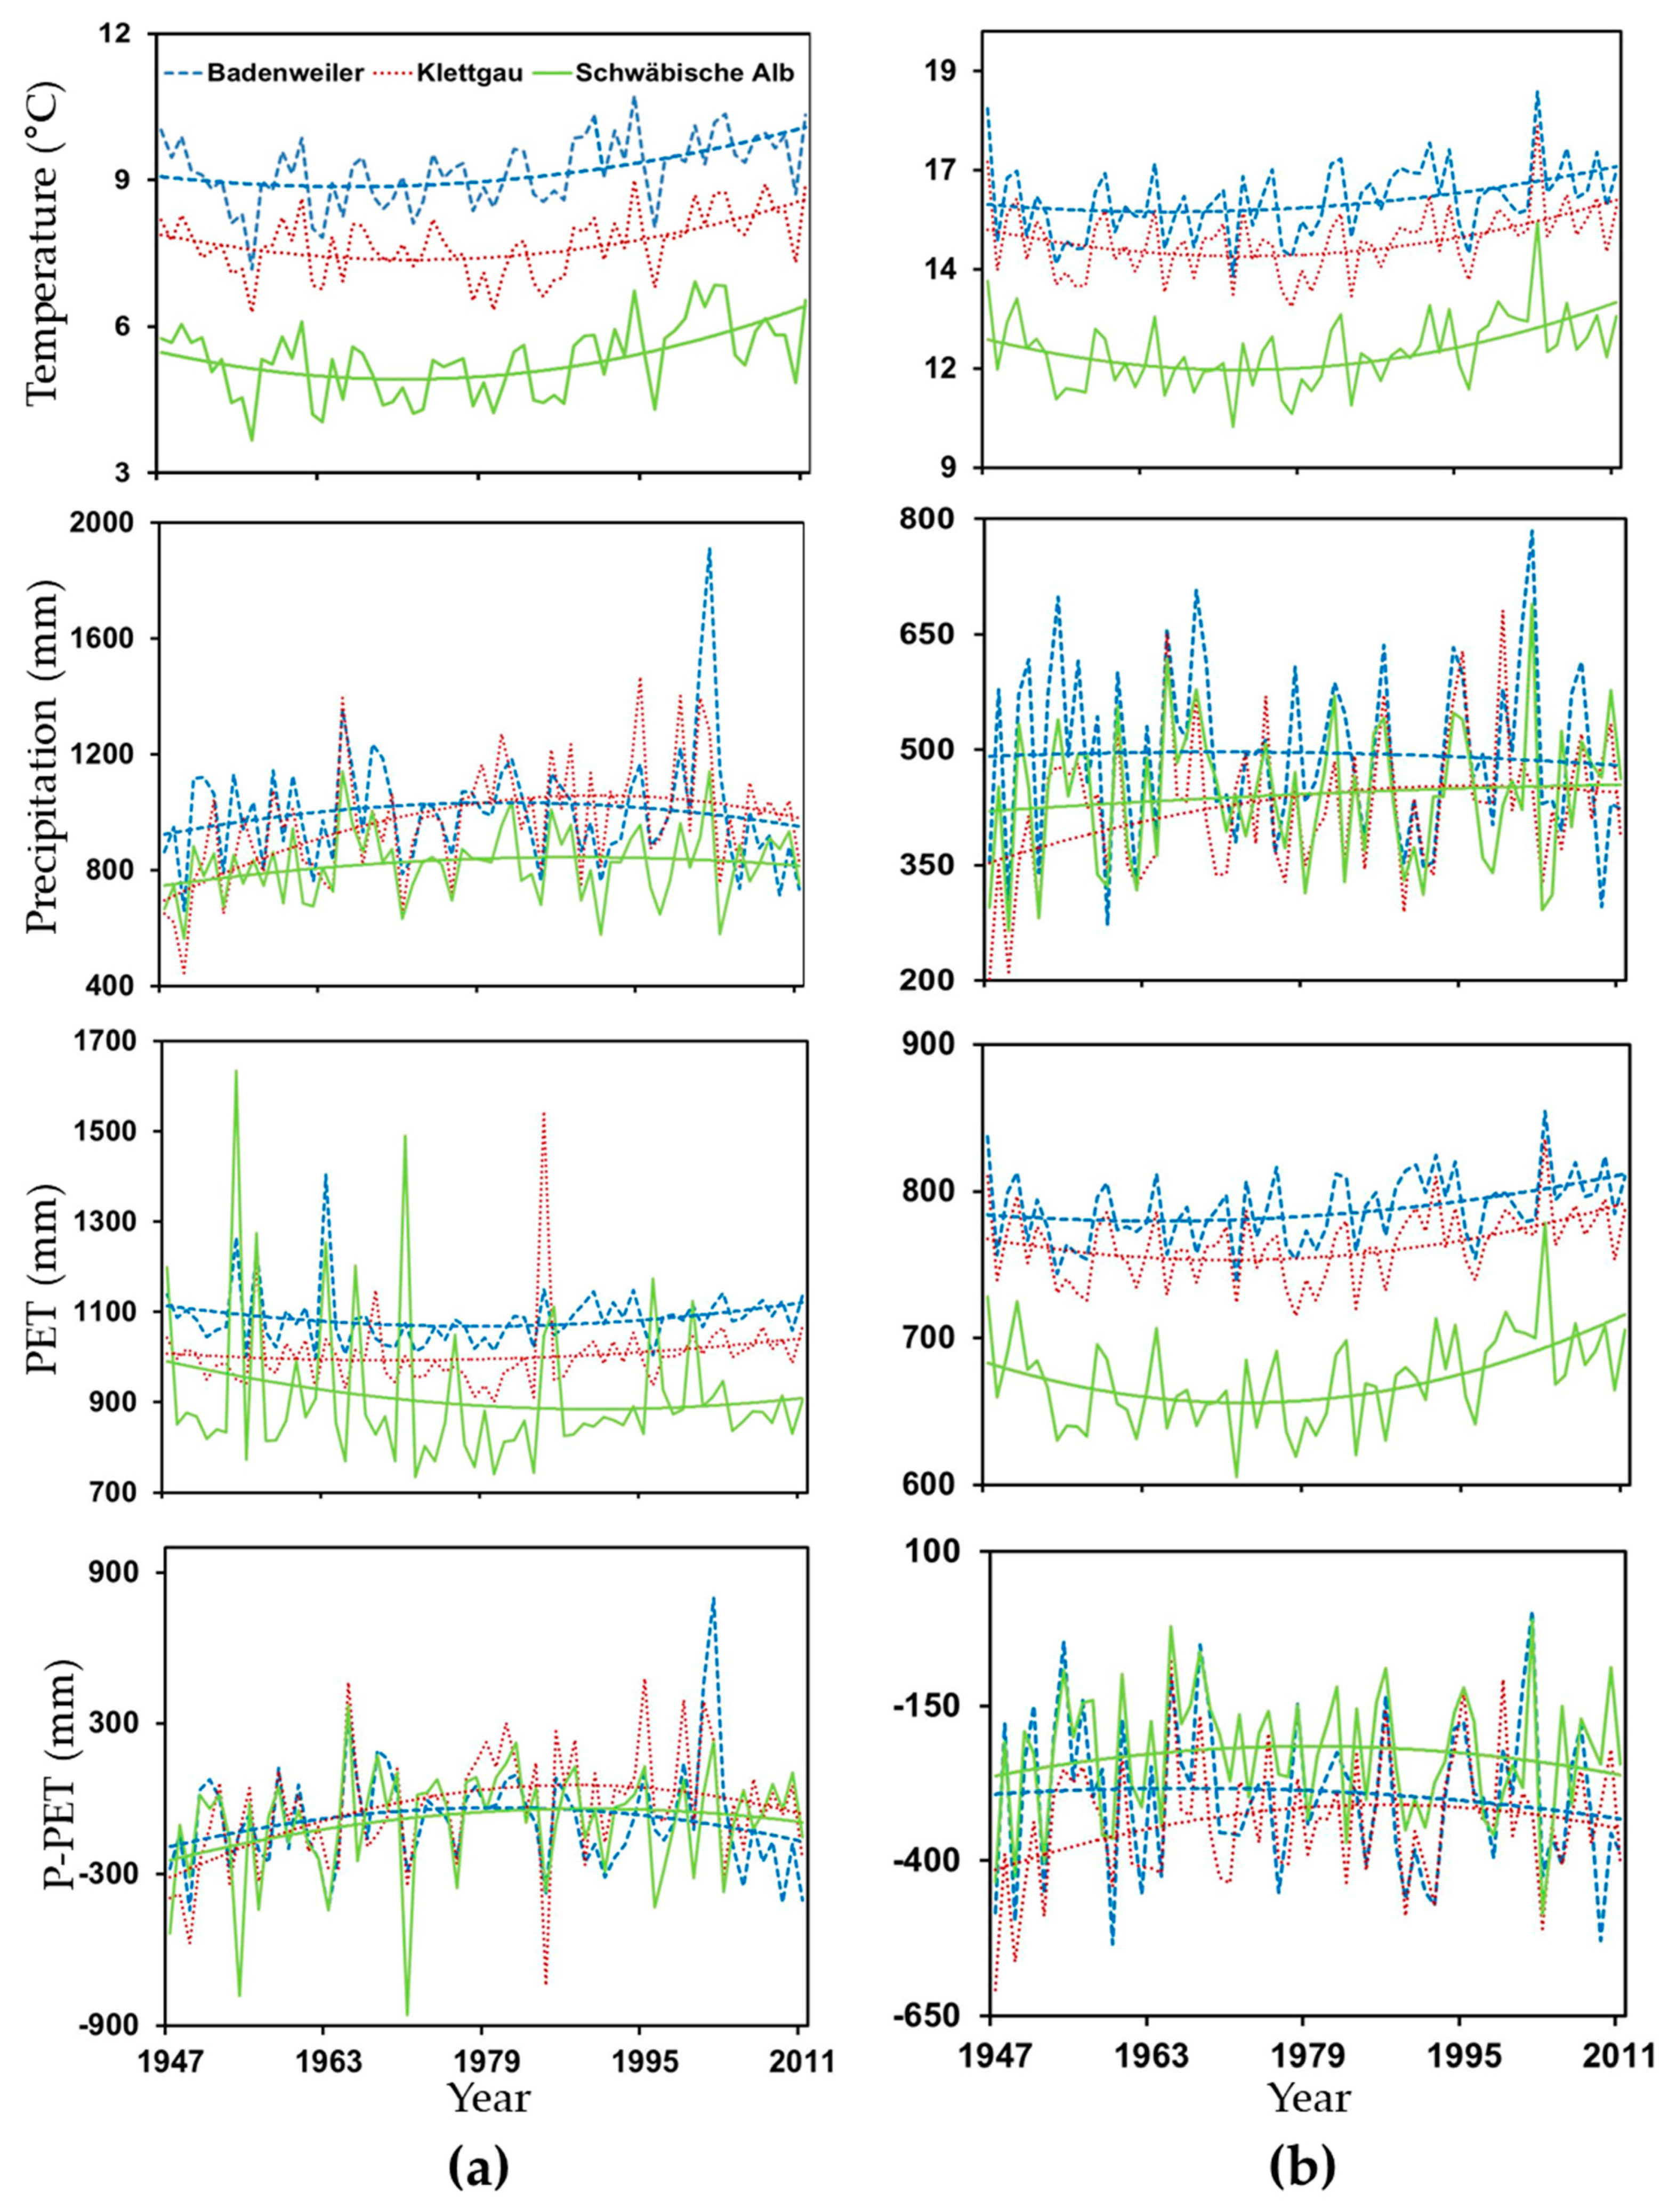
2.4. Climate Data and Quantification of Drought

We used a climatic water balance model approach to quantify forest stand-specific drought stress by using different climatic parameters gathered from German and Swiss weather stations [29,30], for the whole study period (see A1 and Table A1.1 in the Supplementary file). First, climate variables that included daily mean temperature, cloud cover, and relative humidity were used in combination with topographic information (i.e., slope, aspect, latitude, longitude, and elevation) to calculate daily solar radiation for each stand by using the RayMan software [39]. The calculated solar radiation data were used with mean temperature, total precipitation, and relative humidity data to calculate potential evapotranspiration (PET) for each stand, as per Turc’s formula [31]. The water balance model was then applied, and the monthly and annual climatic drought index was calculated from the deviation of precipitation-potential evapotranspiration (P-PET) for each forest stand for the whole study period [12]. We included PET in our drought index calculation for three reasons: (1) unlike wide geographical scale index, such as Palmer Drought Severity Index (PDSI), PET considers local fluctuations of temperature; (2) PET considers local variation in solar irradiation; and (3) in central Europe there is evidence that increase in drought events are related to a significant increase in PET in last 60 years [40]. The water balance model estimates surplus water in forest soil when precipitation exceeds PET, and when precipitation is less than the PET, the stored water in the soil begins to be depleted. The daily differences between P and PET were summarized for each month for the study period, separately for each stand (Table S2 in the Supplementary document). The climatic drought index of three closely located forests, Kätzler, Steimüri, and Steinbruch, was similar, and therefore, these forests were combined into the “Klettgau” region. Finally, the climatic drought index was calculated for three locations: Badenweiler: BAD, Klettgau: KLET, and the Schwäbische Alb: SBA. High values in the water balance model indicated a less-dry condition, whereas low values denoted dry condition. The temperature, precipitation, PET, and drought index were calculated monthly, annually, and for the growing season (May to September) (Figure 5, Table S2 in the Supplementary document). Starting of the exact year for increasing temperature, potential evapotranspiration, and drought index, and decreasing precipitation have been calculated separately for the growing period and annual climatic budget from the regression equations prepared from the climatic data of each location. The climatic drought index, temperature, and precipitation were correlated with annual tree growth in the dry and less-dry plots.

2.5. Relating the Response of Annual Growth to Climate and Drought Intensity

The relationship between tree growth and climatic drought was assessed using the software DENDROCLIM [41]. Correlations between monthly drought index (P-PET), temperature, and precipitation with residual series of TRW data were evaluated by both single and moving interval analyses. Single interval correlation function analysis can explain the overall climate correlation with growth, whereas moving interval correlation analysis can assess the correlations’ temporal trend [12,41]. Single interval correlation was conducted for the period that began in May of the previous year and continued to September of the current year (i.e., 17 total months). We selected this timespan following Garcia-Suarez et al. [23] because the growth of beech trees is dependent on the weather in both the current and previous years growing seasons [12,42,43,44] as temperate deciduous trees are using previous year’s carbohydrate storage [45], particularly the young trees [46], which is the case for our study. Then we reduced the number of months from 17 to 7 (March to September of the current year) following Weber et al. [12] and 6 (May to October of the previous year) to study the shifts in the drought response pattern over time by using the moving correlation. This time window of both previous and current years’ summer months was chosen as the essential growing months for beech trees in our study areas. Moving correlation analysis is used to identify temporal changes or shifts of growth relation among trees to weather [41] during the spring and summer months as the seasonal time period is crucial for the beech growth in temperate regions [6]. A series of coefficients from Pearson’s product-moment correlation functions were calculated using DENDROCLIM and used for further correlations of monthly climate with residual TRW chronologies. In this analysis, a total of 1000 bootstrap replicates were used, with 95% confidence interval for the standard errors during the significance testing (see [41] for the details). Finally, pairwise comparisons of chronologies were performed between dry and less-dry plots.

2.6. Influence of Multiple Severe Drought Years on Resistance, Recovery, and Resilience of Growth

Our goal was to determine whether resistance, recovery, and resilience of beech trees to extreme drought events differed between the trees growing in identical climatic conditions but with different soil water availability (i.e., dry vs. less-dry plots) due to heterogeneous soil conditions. We used the site-specific mean BAI chronologies of trees of dry and less-dry plots separately to measure resistance, recovery, and resilience, which were compared between dry and less-dry plots following multiple events of severe drought. To determine the extreme years of drought, we matched the high temperature, low rainfall, and high PET of the growing seasons (May to September commonly for all three locations) with the annual depressions in growth [22]. With this approach, we identified six common, regional dry years for our three study locations, which were 1976, 1984, 1989, 1992, 1998, and 2003. We calculated the resistance, recovery, and resilience of the trees to drought following the concept proposed by Lloret et al. [47] as:
R e s i s t a n c e =   B A I D r B A I P r e D r ( s )
R e c o v e r y =   B A I P o s t D r ( s ) B A I D r
R e s i l i e n c e =   B A I P o s t D r ( s ) B A I P r e D r ( s )
where B A I D r is the basal area growth during the drought year, B A I P r e D r ( s ) is the (mean) basal area growth during the pre-drought year(s) and B A I P o s t D r ( s ) is the (mean) basal area growth during the post-drought year(s). We calculated two types of values called short- and mid-term values for each of the three Lloret-indices, based on a different time scale for calculating the growth. Analyzing the long-term values (i.e., at least five years) was not possible for this study as in those sites, we found consecutive drought events within five years (from 1984 to 1992). The short-term value was consisted of a one-year assessment period before and after the drought year, whereas the mid-term value was consisted of an assessment period of three consecutive years before and after a year of drought by following Sohn et al., (2012) [48]. With these mid-term values, we would discuss the carry-over effect of drought on the beech trees’ growth and the immediate effect of drought stress. The response ratio was used to compare the values of resistance, recovery, and resilience for each tree from dry and less-dry plots [49].

2.7. Comparing Resistance, Recovery, and Resilience with the Response Ratio

Response ratio is a measure of effect size, often used in ecology to compare the mean responses from two contrasting groups (e.g., dry vs. less-dry plots in our study) [50]. Response ratio can test the significance of a difference and provide inference on the scale of the difference between groups, which is a notable benefit compared with the typical mean comparison statistics such as Student’s t-test [51]. Because of this statistical power, we calculated the response ratio for each of the three locations to compare the Lloret’s resistance, recovery, and resilience values [49]. We used a fixed-effect model to combine these three response ratio values from the three locations to calculate an average value of response ratio (i.e., cumulative effect size) to identify the general trend in responses from the three locations. The value of each location’s response ratio was weighted according to the population’s size and the variance within and between the dry and less-dry plots. Finally, the response ratio’s heterogeneity between the locations was calculated using Q-statistics, and the significance was tested with a Chi-square test [52]. We used 1000 iterations and calculated a bootstrap confidence interval while averaging the response ratio’s three values [52]. The response ratio was significant only when the bootstrap confidence interval’s upper or lower limit did not touch 1. We performed the response ratio analysis using the program MetaWin 2.0 [53]. Steps in weighting and heterogeneity analysis for combining response ratios from the 3 locations followed those described by Saha et al., 2012 [52].

2.8. Light Measurement and Assessment of Plant-Plant Neighborhood Interactions

We wanted to capture the neighborhood light availability for our sampled beech trees by hemispherical photography. We took the photographs in September of 2012 and 2013 before the leaves’ shedding began in deciduous trees. Canopy openness was used as a measure of light availability. The sampled beech trees were intermediate and co-dominant; hence, they were receiving mostly the lateral lights [54,55]. Photos were taken at 1.3 m height on a fixed tripod stand under the overcast cloud condition, either in the dawn or in the dusk. The crown expansion area was determined on the field, and it was used to calculate the circumference and radius of each tree’s crown. Crown hemispherical photographs were then taken within that circle at the radial position of three different East, South, and West compass angles as plants were located on the south facing slopes. Photos were taken at each 1 m interval of that circle of the crown expansion area. The number of photographs per plant ranged from 3 to 9 related to the size of the respective plant. Hemispherical photographs were analyzed in the WinSCANOPY 2008 software [56]. The canopy openness values obtained from multiple photographs were then averaged for the respective tree. Besides, neighborhood interactions were assessed for each target beech tree because plant–plant interactions can be altered by size (i.e., size asymmetric interaction) and thereby influence the resource and space utilization between trees in mixed forests of diverse age [57]. Neighborhood interactions were quantified using Hegyi’s competition index [58]; this index is independent of stand age and size and depends only on the trees’ relative spatial pattern. Competitors were selected applying the searching cone method described by Pretzsch (2009) [59].

3. Results

3.1. Tree Ring Chronology, Size, and Growth Comparisons

The trees from dry plots of all sites showed significantly lower size (DBH, height) and Growth (BAI) than the trees from less-dry plots, but the age did not differ significantly between them (Table 2). The comparison of the chronologies (by independent sample t-tests) showed significantly higher BAI values in less-dry plots than dry plots (Badenweiler: t (−2.503), degrees of freedom or d.f. = 120; p < 0.05; Klettgau: t (−8.109), d.f. = 120; p < 0.001; Schwäbische Alb: t (−2.946), d.f. = 100; p < 0.01) for the study period. Mean sensitivity was within the range of 0.277–0.496 for all series, with higher values for less-dry plots. Expressed population signal was ranged between 0.85 and 0.89 across all series, which is an acceptable range of common signal strength [21]. Differences in mean inter-series correlations between the chronologies of trees from dry and less-dry plots revealed variability in growth within the plots, where low rbar indicated high variability among the trees. Mean rbar was lower in dry plots for Badenweiler and Klettgau, where it was opposite for the Schwäbische Alb. Both dry and less-dry plots showed growth depression during the drought events (Table 2, Figure 3).

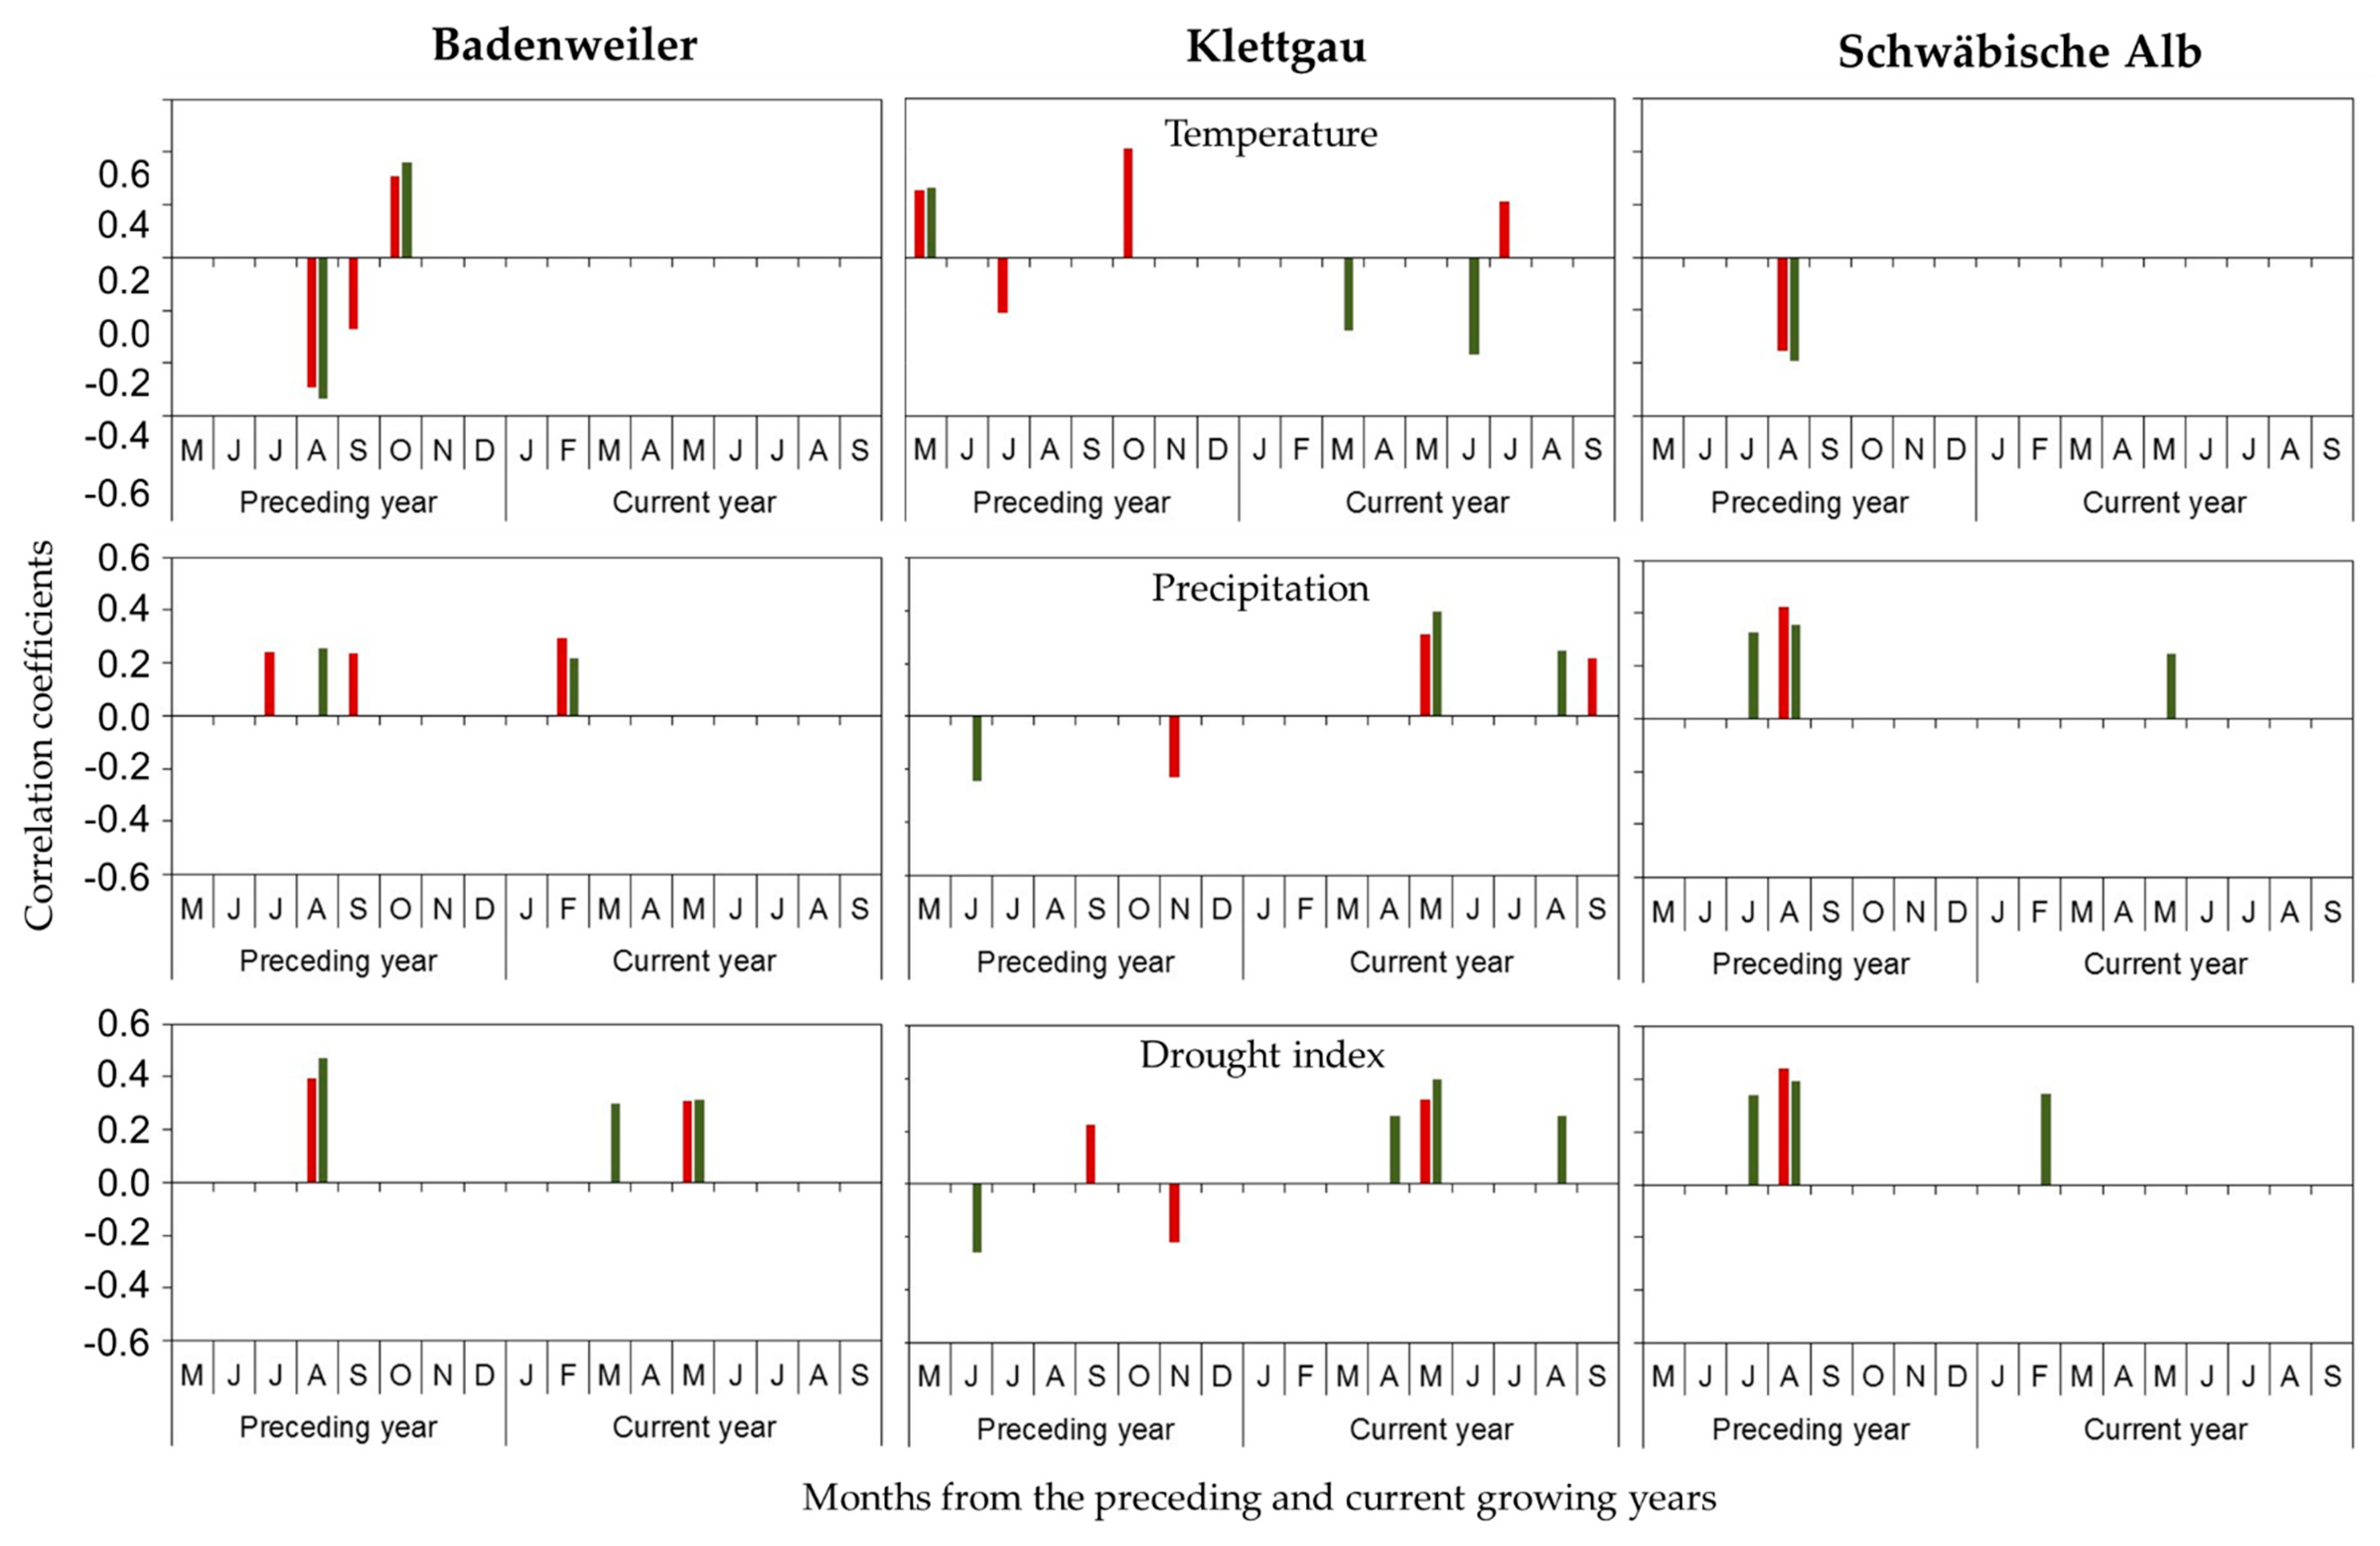
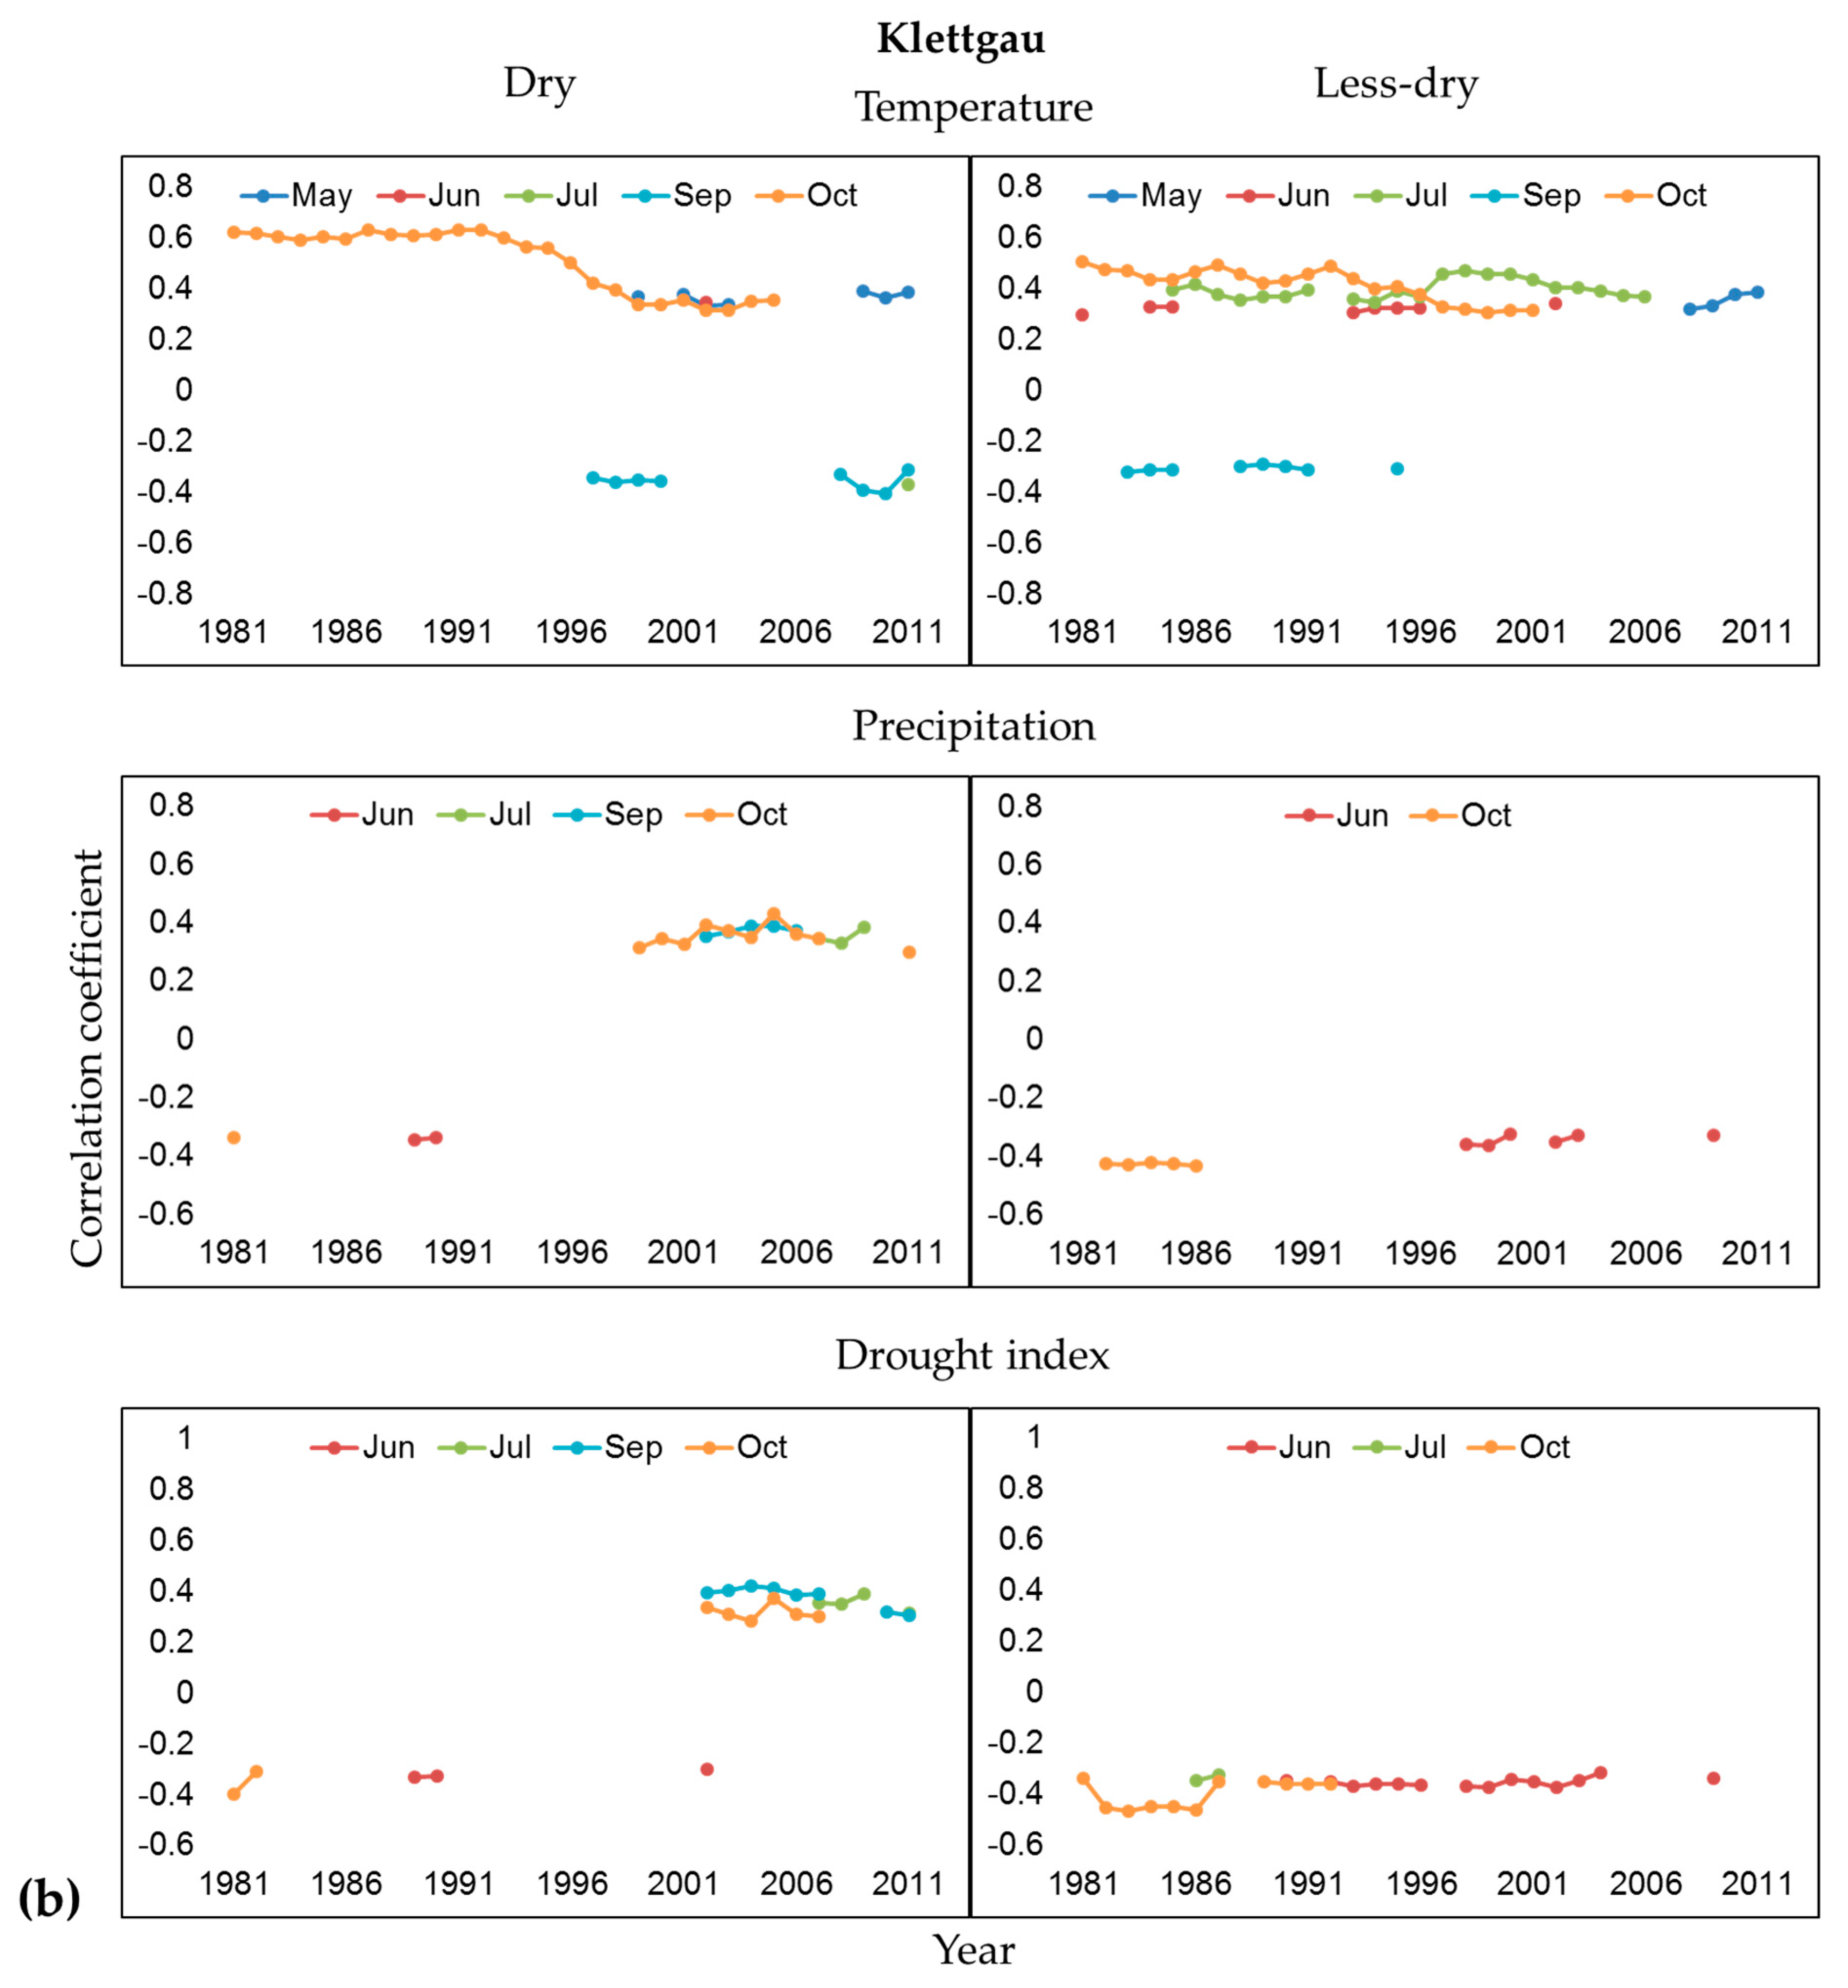
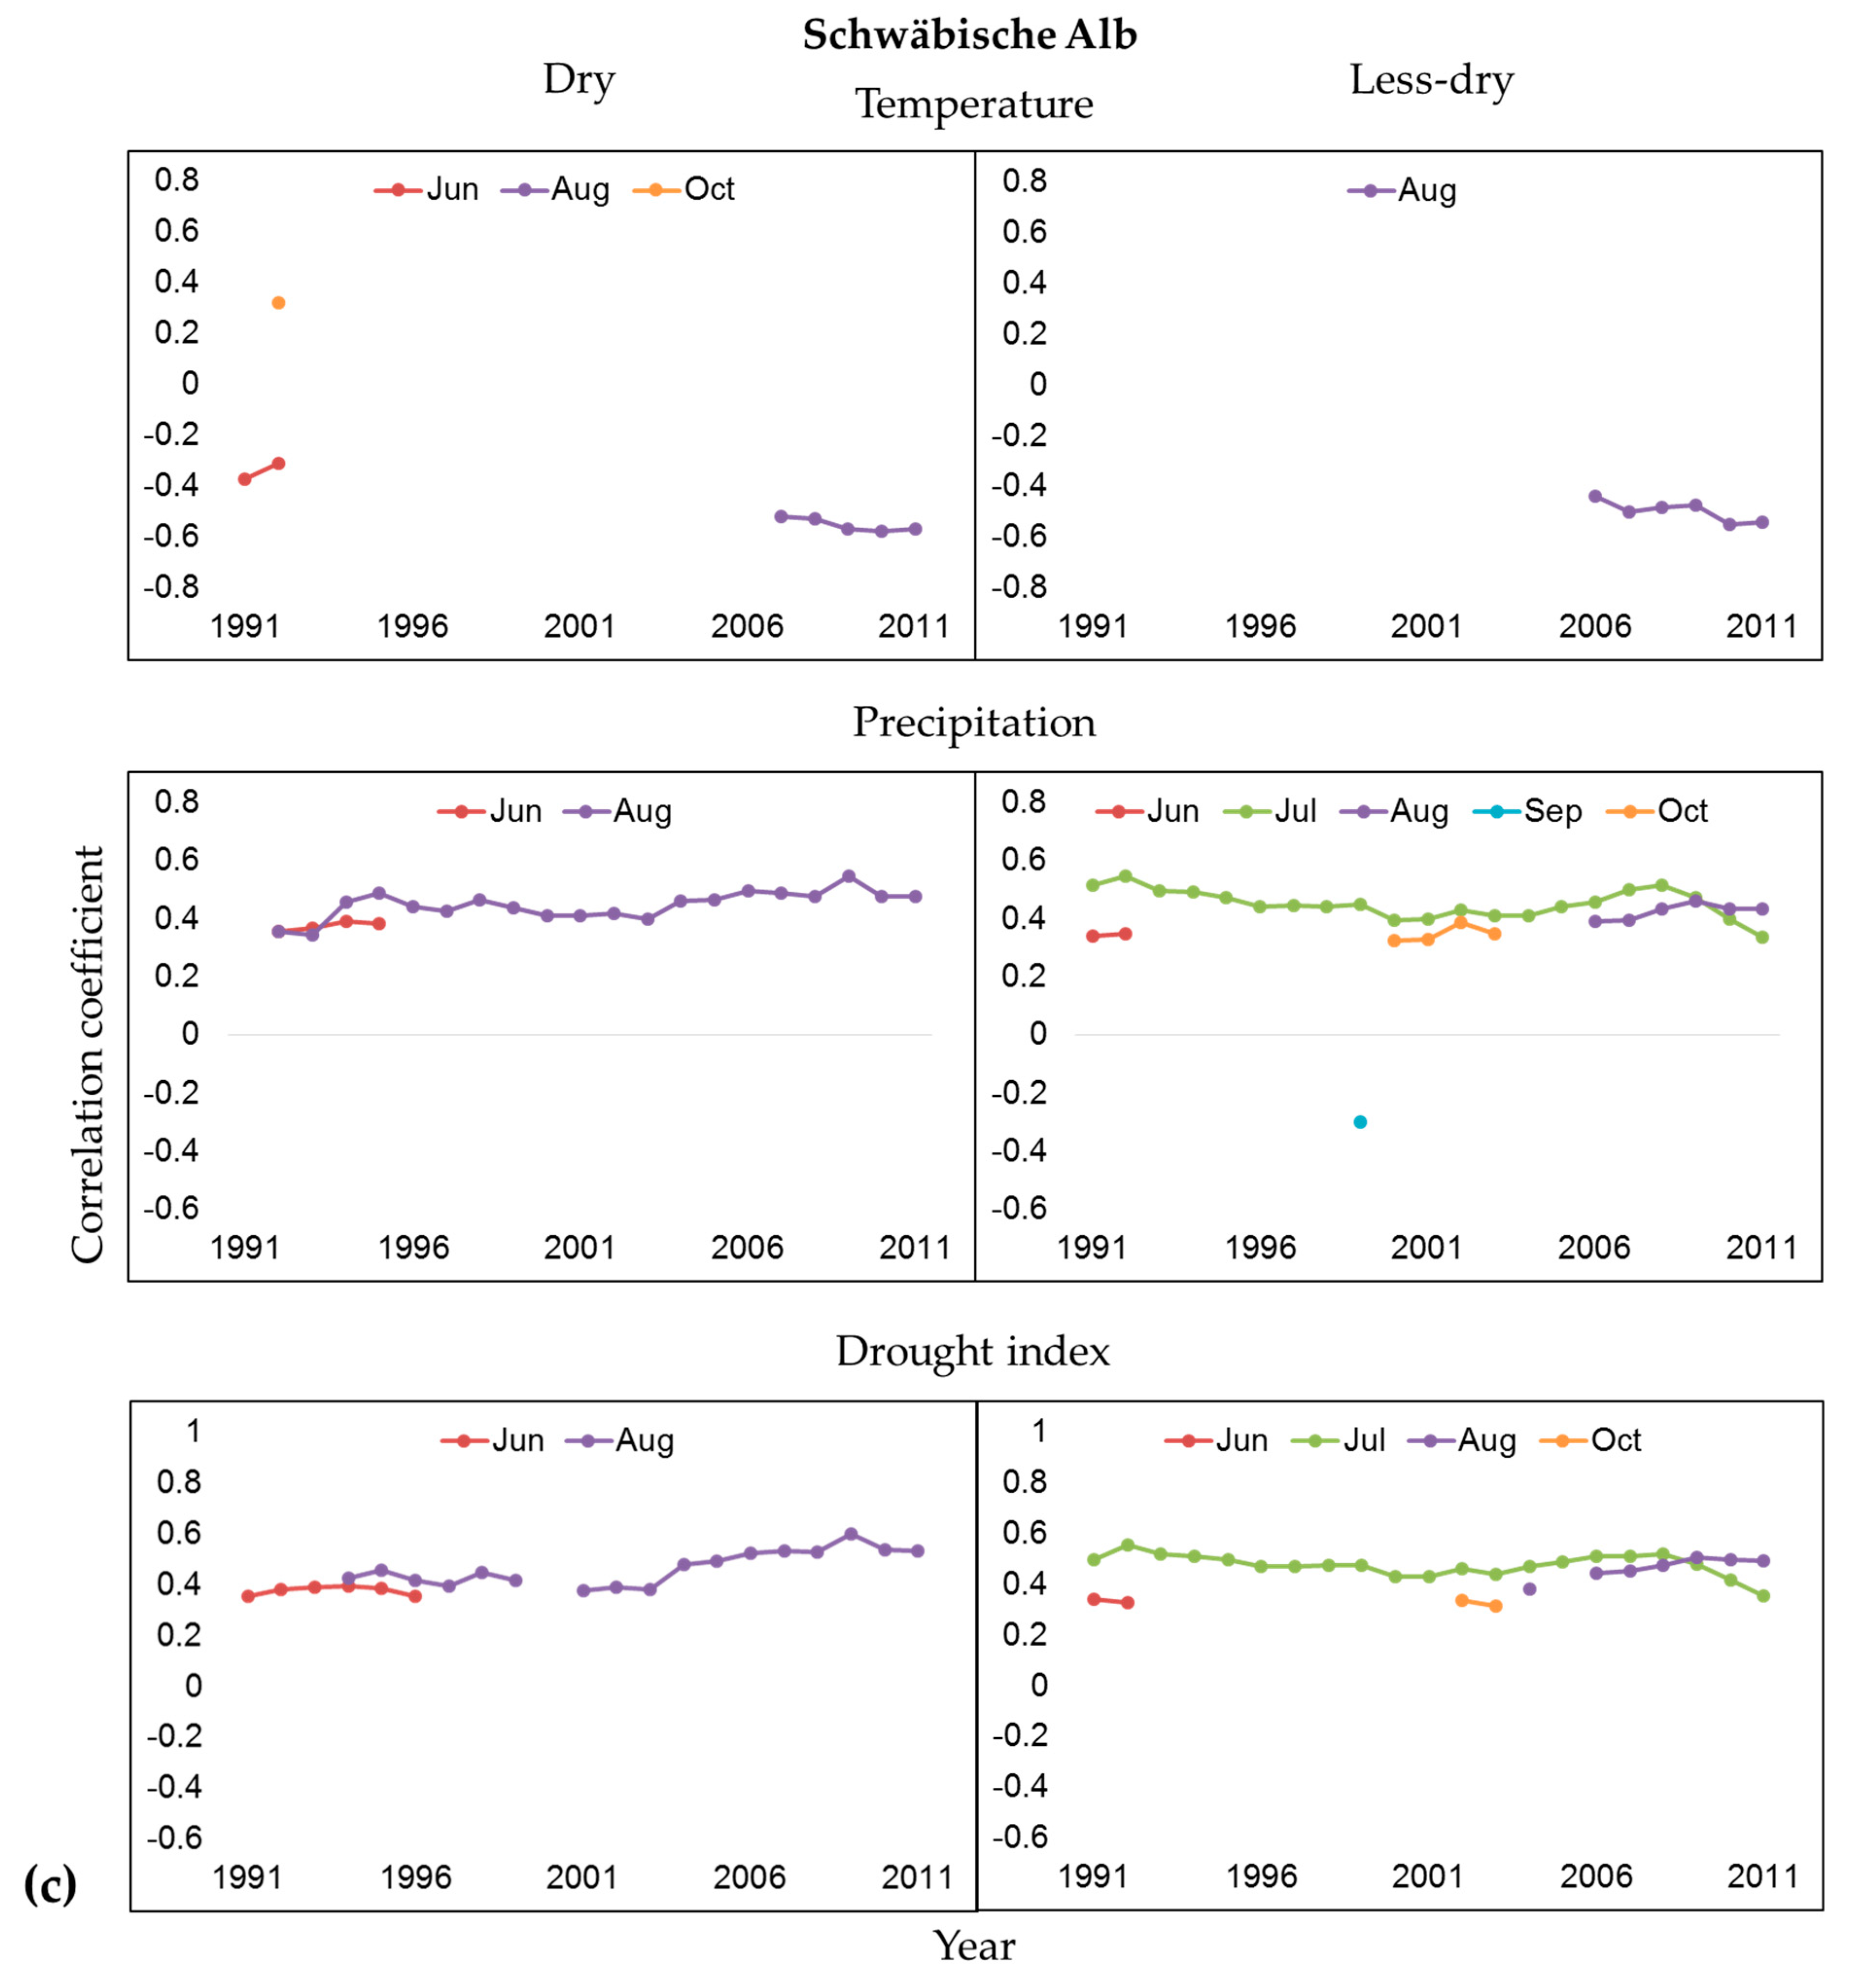
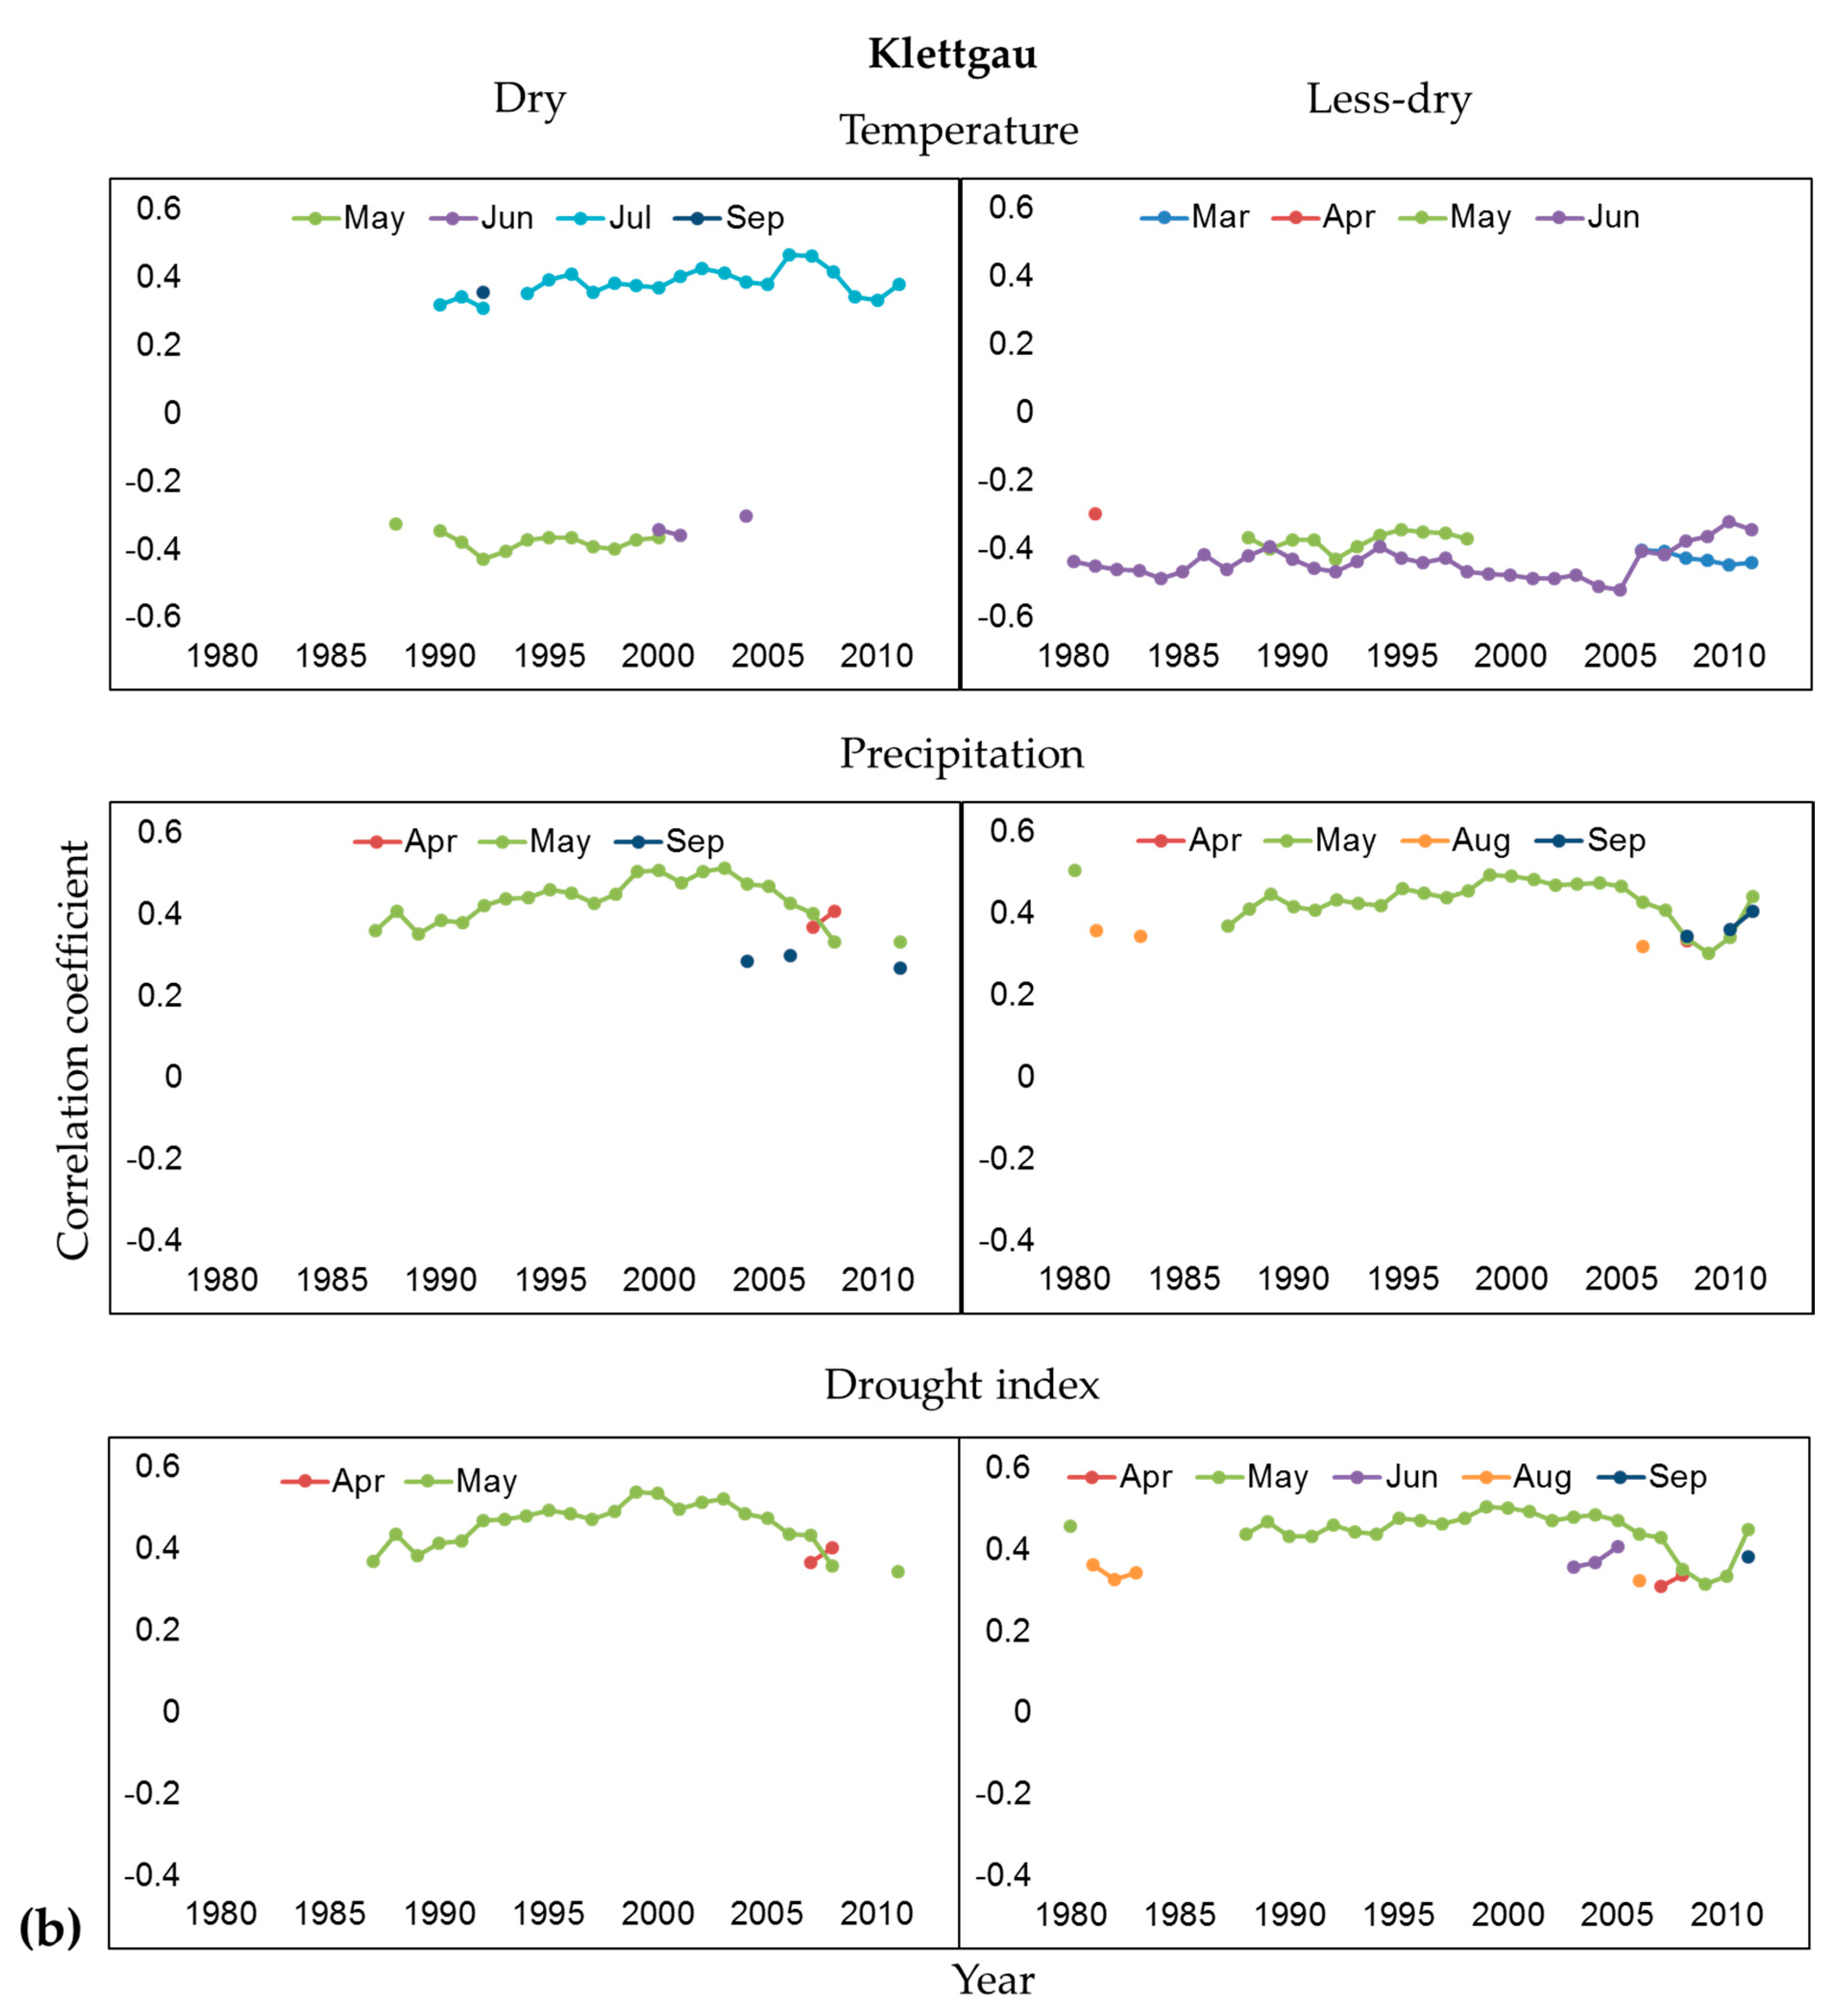
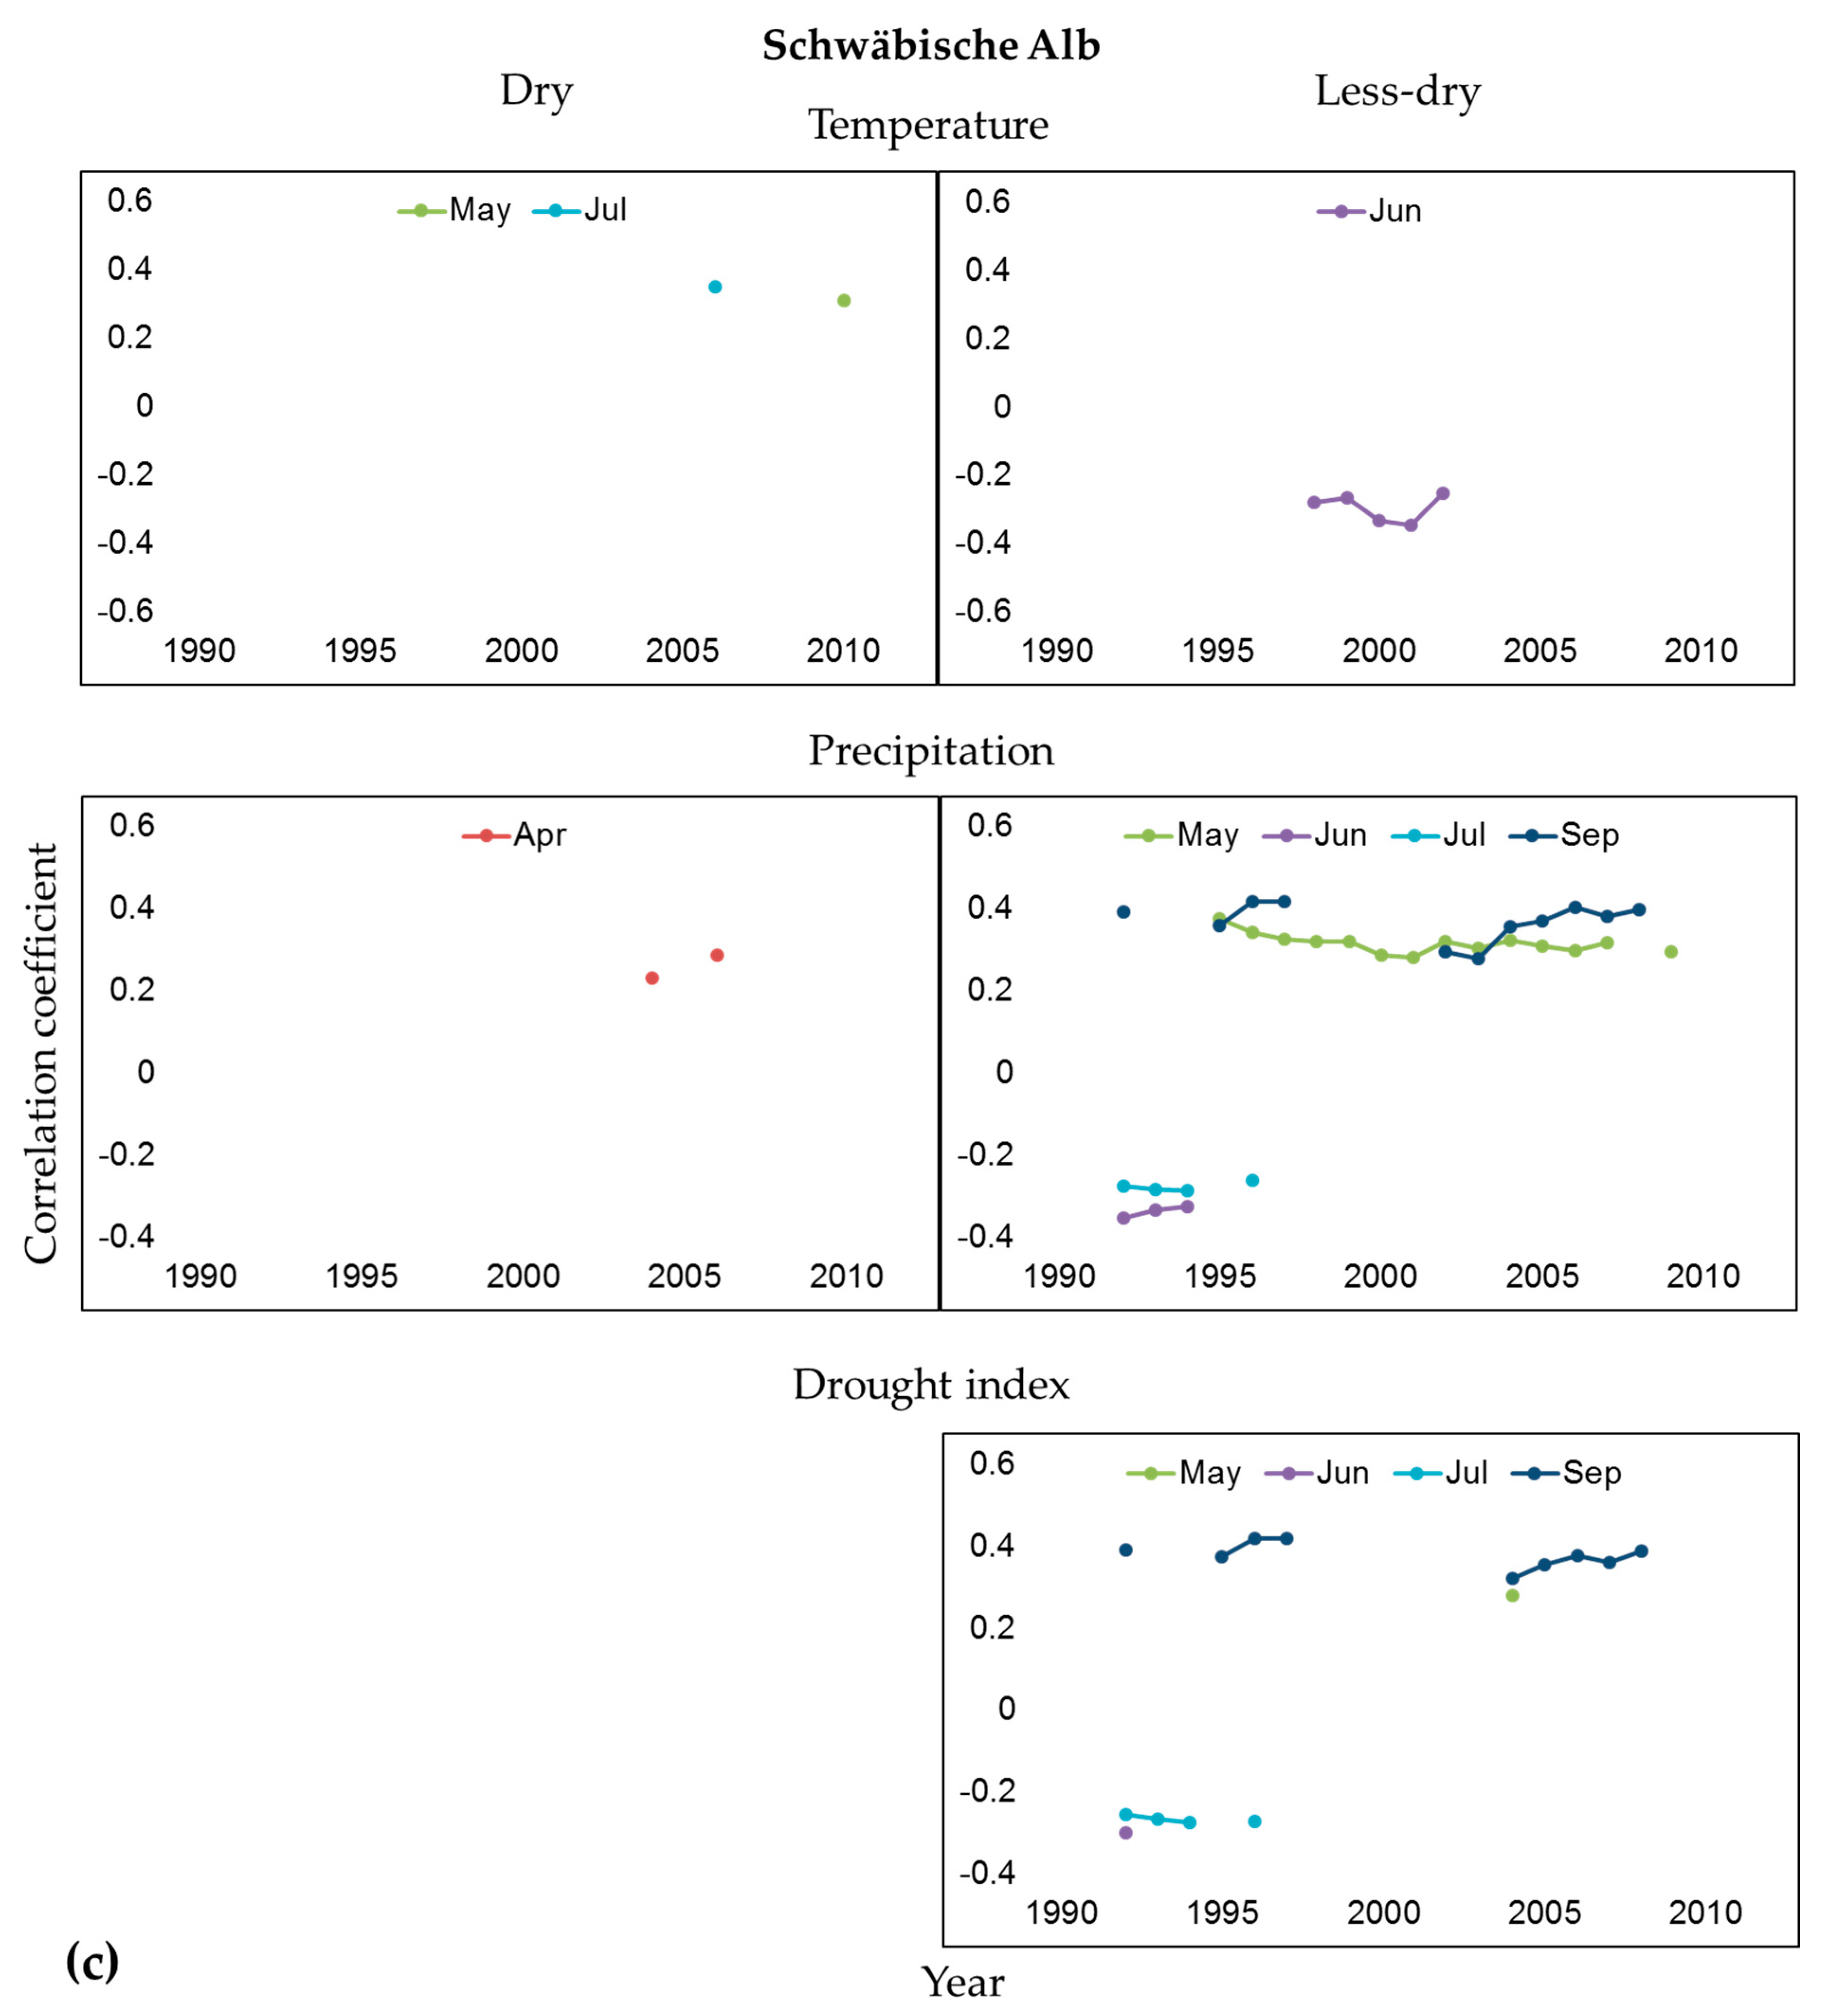
3.2. Influence of Climate and Drought on Radial Growth

The temperature increased in all study locations during the study period, with an increase of about 1 °C on average. A pattern of decreasing precipitation, increasing potential evapotranspiration, and increasing drought have been found in all study sites (Figure 4). In general, as a combination of higher temperatures, lower precipitation, and higher potential evapotranspiration, climatic drought increased in all study regions, particularly from the late 1980s (Figure 4).
For both dry and less-dry plots of all study locations, the previous growing year’s summer months showed significant relations. In all three regions, temperature shows significant negative relations for both dry and less-dry plots. The climate of the previous August was vital for Badenweiler and Schwäbische Alb. For Klettgau, June temperature and July precipitation of the previous years were important (Figure 6). It means the growth of the beech trees depends on the temperature and precipitation of the previous years.
Looking at the summer months of the current growing years, Klettgau showed significant negative relation for less-dry plots and a significant positive relationship for dry plots. For the precipitation, both dry and less-dry plots of Klettgau showed a significant positive relation. Current year’s May precipitation showed positive relation in less-dry plots in Schwäbische Alb., Looking at the drought index, current year’s May showed a positive relationship for both dry and less-dry plots in Badenweiler, whereas, in Klettgau, the positive relationship with drought index was found in both May and August. Nevertheless, Klettgau showed significant correlations for the summer months of the current year’s growth for all climatic variables; and less-dry plots showed higher relation than dry plots (Figure 6), which means the beech trees in Klettgau are showing higher climatic dependency on their growth compared to Badenweiler and Schwäbische Alb. However, beech trees from each of the three study regions are showing climate dependency on their growth.
Overall, Badenweiler showed higher significant relations for dry plots than less-dry plots explicitly looking at the temperature and precipitation (negative relations for temperature and positive relations for precipitation). Schwäbische Alb showed higher significant relations for less-dry plots than dry plots explicitly looking at the precipitation and drought index (positive relations). Klettgau showed higher relations for dry plots than less-dry plots for temperature (negative relations). All study sites showed higher positive relations for the drought index in less-dry plots (Figure 6). It means the beech trees’ growth from both dry and less-dry plots at different regions shows climate dependency, but the temperature and precipitation are impacting the trees based on their AWC.
The moving response function analysis showed the changes in the relationship between climatic variables and beech trees’ growth over time. For the growing season (May to October of the previous year: Figure 7 and March to September of the current year: Figure 8), the number of months with a positive and negative correlation between growth and climate has changed at a temporal time scale. This temporal change was significant and continuous for both previous and current years’ months. A temporal shift of climate-growth relation was found from late summer to early summer months, particularly for the months of the previous years (Figure 7). An increasing pattern of significant relations between growth and climatic parameters are found at a temporal scale. By summarizing the data, it could be stated that the effect of temperature, precipitation, and drought index has been increasing almost in all study sites for both dry and less-dry plots with few exceptions (Figure 7 and Figure 8). However, the climate-growth relation was different between dry and less-dry plots and for previous and current months. Trees in dry plots had shown higher relations between growth and all climatic parameters for the previous years compared to the trees from less-dry plots combining all three sites. This pattern was the opposite for the current year when less-dry plots had shown higher relation between growth and all climatic parameters than the dry plots. This finding means that the months’ climatic variables from the previous years could have a greater influence on growth for the dry plots, whereas in less-dry plots, it is higher from the months of the current years.

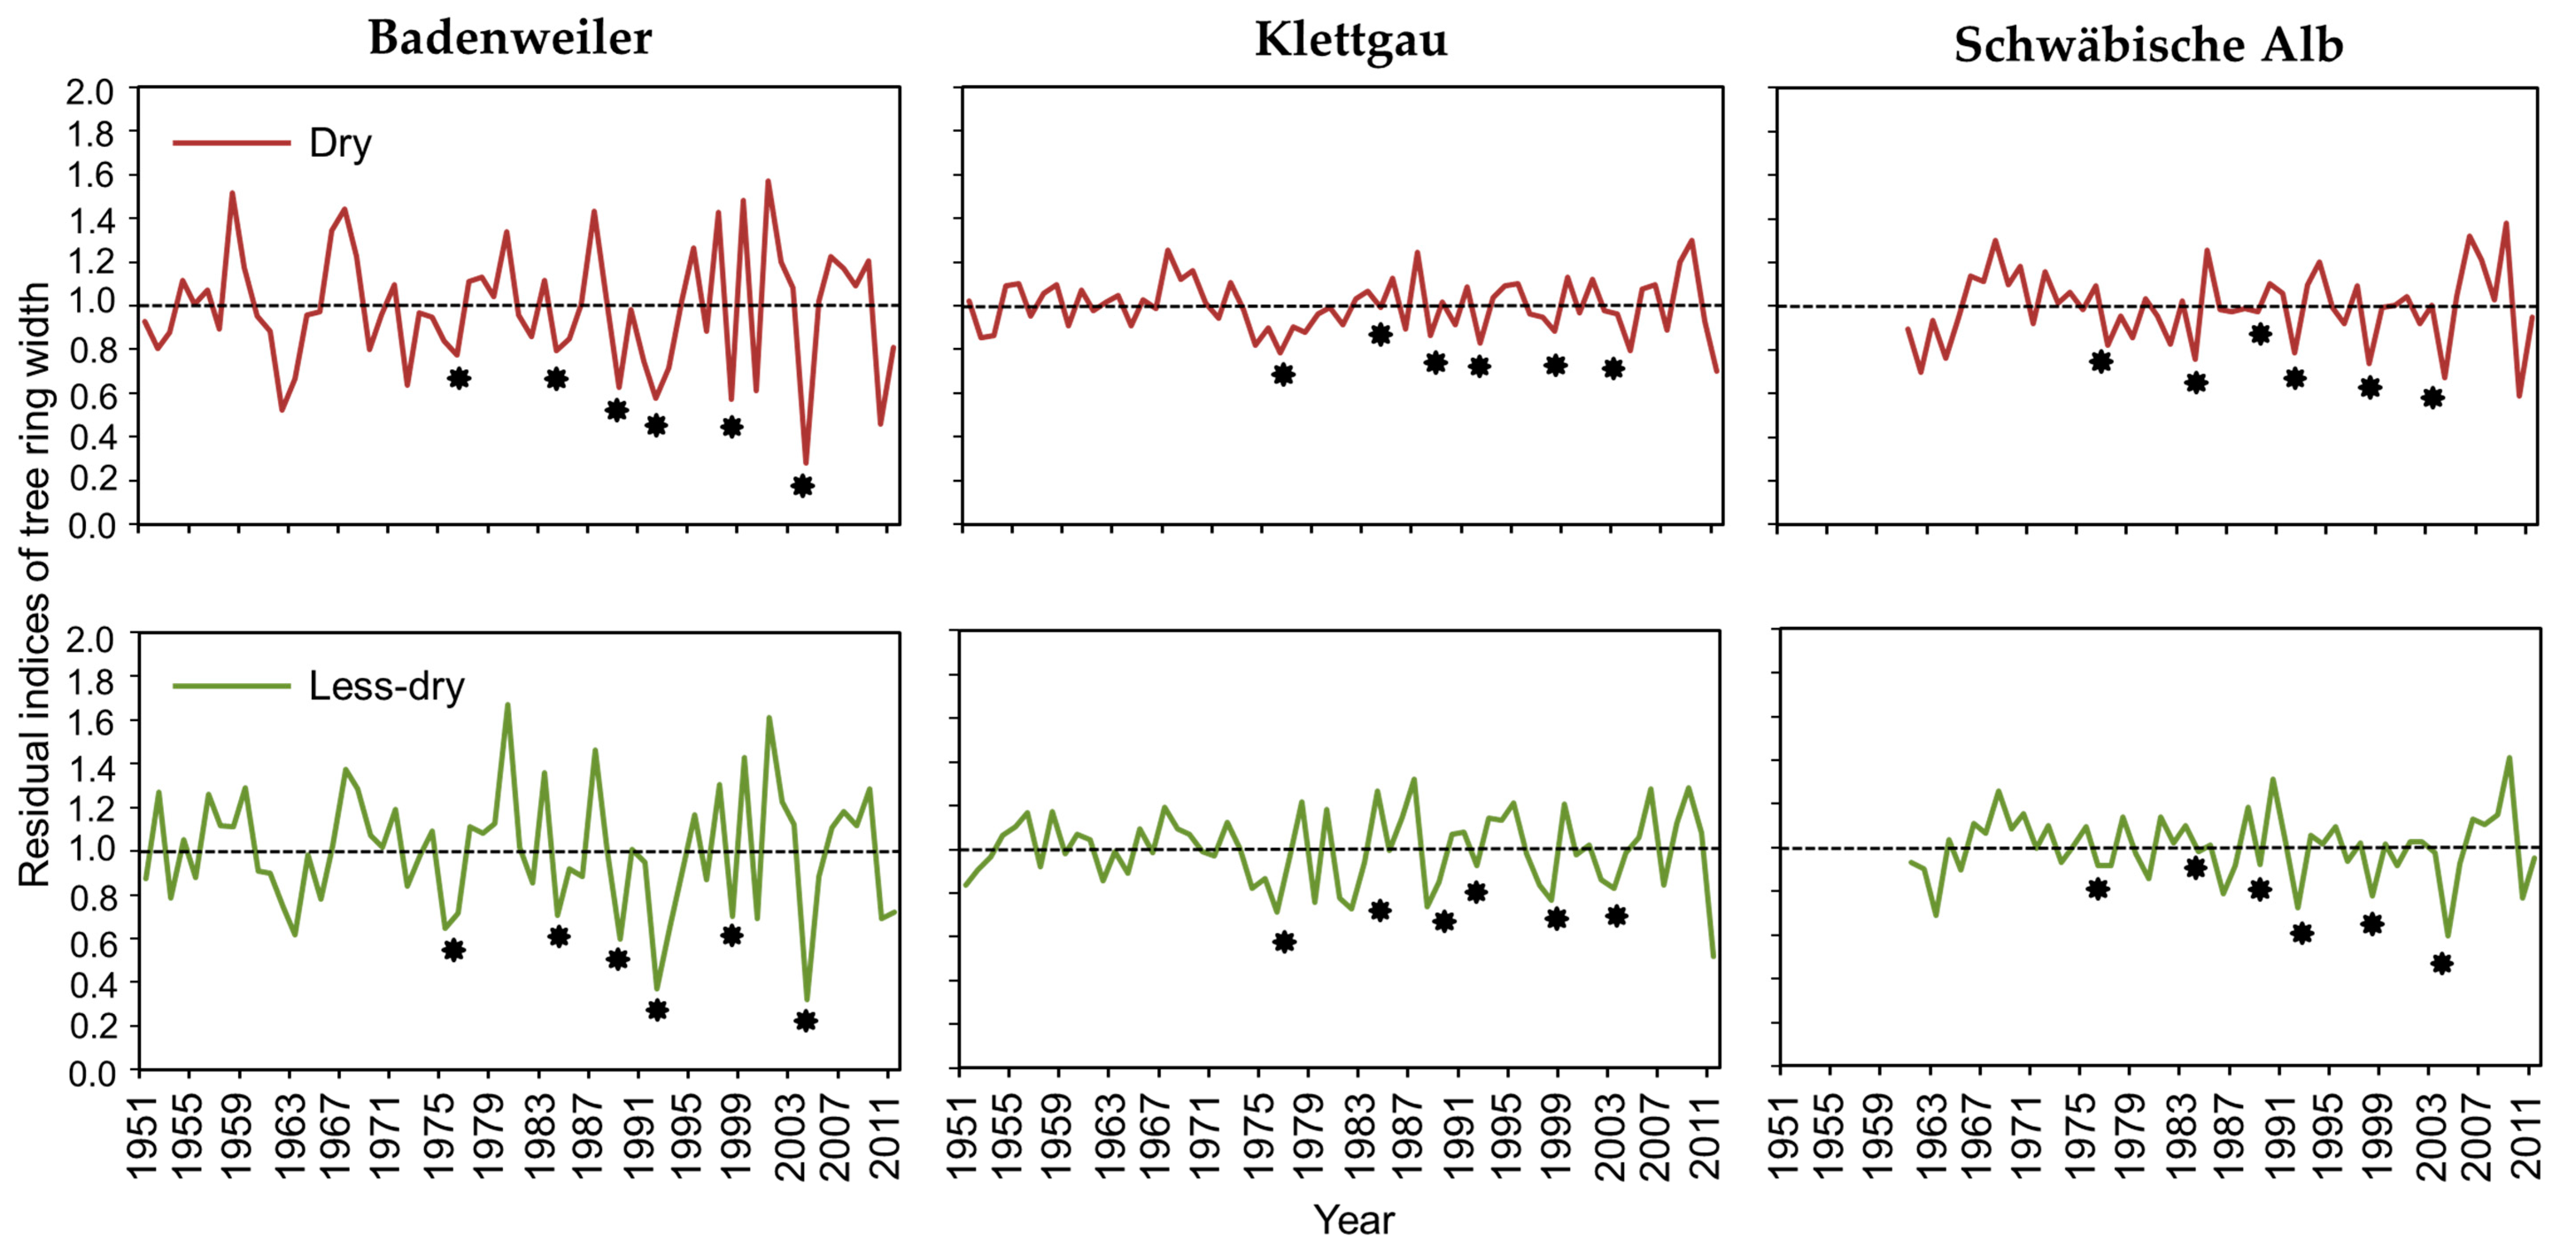
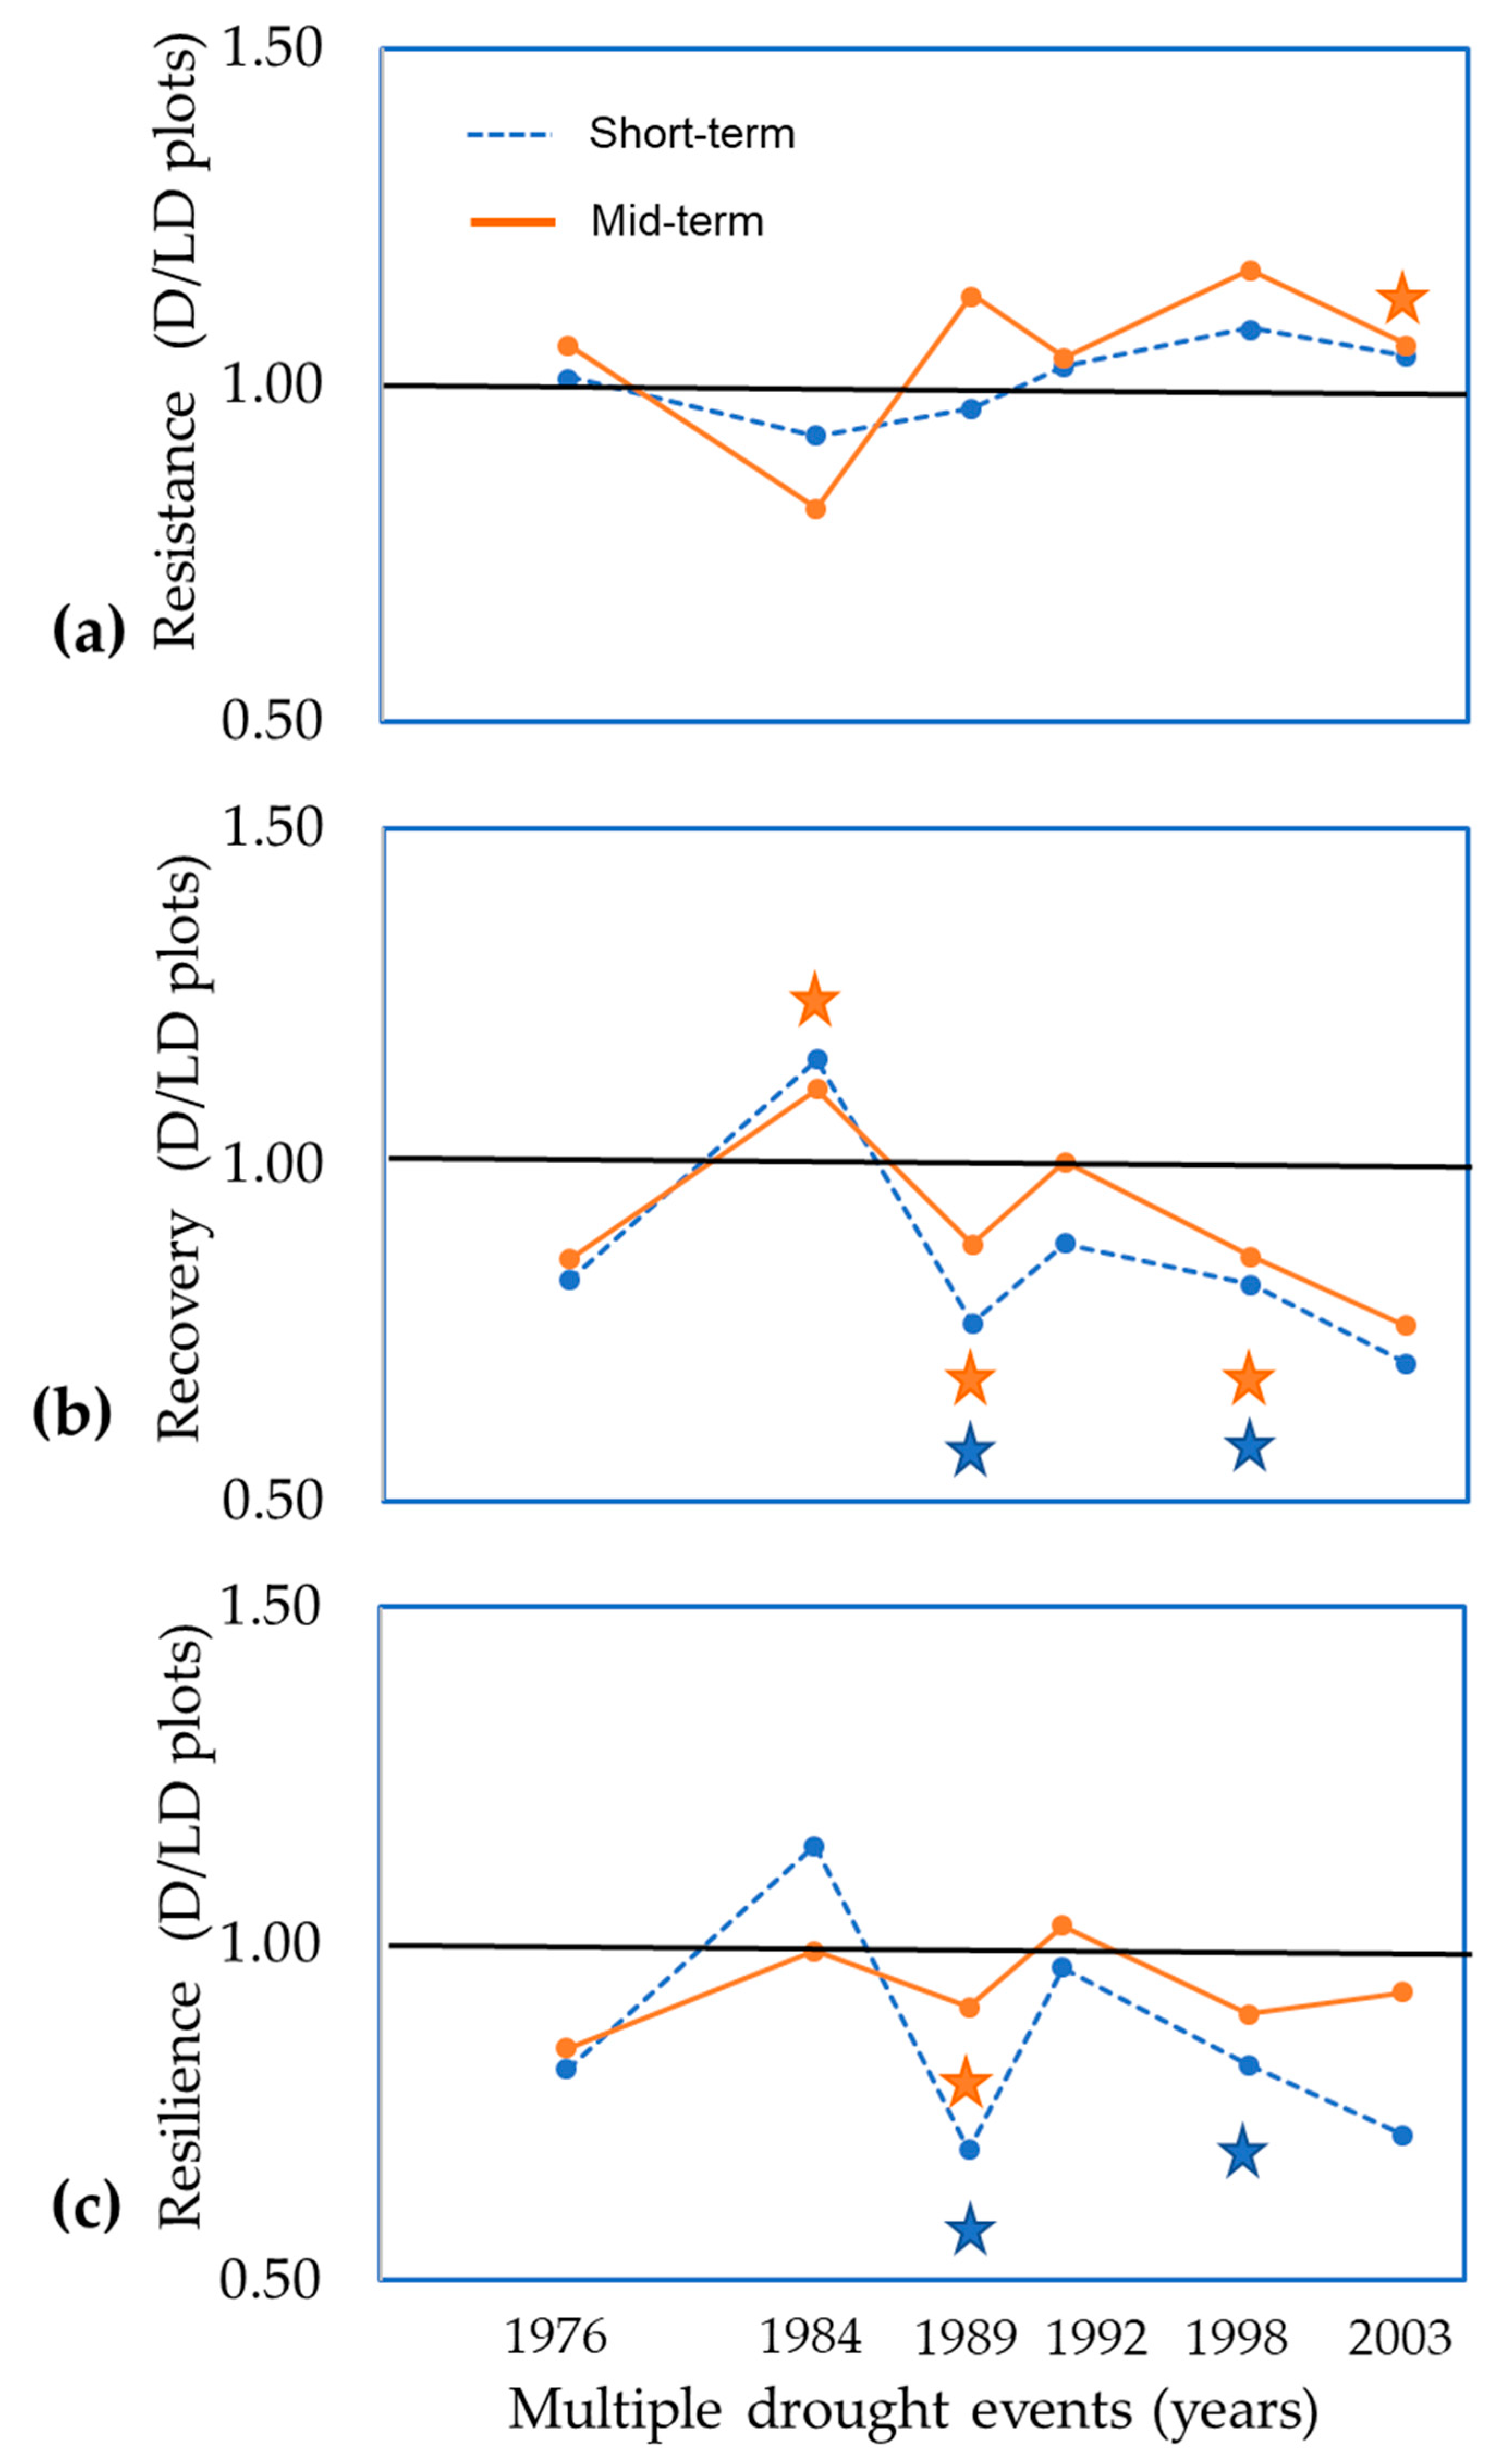
3.3. Comparisons of Resistance, Recovery, and Resilience of Trees

Both short- and mid-term resistance was higher (i.e., effect size above line 1.0) in dry plots than in less-dry plots for most of the drought years out of six events (Figure 9a). However, for most drought events, the effect sizes were not significant due to high variation except for the drought in 2003. In that year, mid-term resistance was significantly higher (by 6%) in dry plots than in less-dry plots.
Both short- and mid-term recovery was lower (i.e., effect size below line 1.0) in dry plots than in less-dry plots for most of the drought years (Figure 9b). In 2003, a high difference in recovery between dry and less-dry plots was observed, with short- and mid-term recoveries 30 and 24% lower in dry plots, respectively. However, this difference in 2003 is not significant. However, drought years of 1989 and 1998 showed significantly low recovery in dry plots for both short- and mid-term.
In the case of resilience, again, both short- and mid-term resilience were lower (i.e., effect size below line 1.0) in dry plots compared to the less-dry plots in most cases (Figure 9c). 1989, 1998, and 2003 showed a very high difference in resilience between dry and less-dry plots. Whereas 1989 and 1998 showed a significant difference in the short-term and 1989 in mid-term resilience.
The year-wise heterogeneity analysis had revealed the level of within and between site variations (Table S3 in the Supplementary document). In the year 1984, the heterogeneity was high in short and in mid-term resistance, recovery, and resilience. However, it varied among the other years of drought. For example, the heterogeneity of mid-term resilience was significant in 1976, 1992, and 2003. The mid-term recovery was heterogeneous in 2003. The heterogeneity for the short- and mid-term resistance was significant in the year 1992.

3.4. Stand Density and Composition of Study Locations, and Influence of Canopy Openness and Neighborhood Competition on Mean Basal Area Increment of Beech Trees

The stem density varied from 1628 to 3640 per hectare. The mean tree species richness and basal area ranged from 5 to 8 and 33 to 47 m2 per hectare, respectively. The forest was dominated by oak trees with a basal area proportion of 44 to 88 (Table 3).
We first analyzed the influence of canopy openness, competition (Hegyi’s index) and plot type (i.e., dry vs. less-dry) on the mean basal area increment (BAI) of each tree before doing the dendroecological analysis on climate and annual growth. We have found that competition significantly reduced the mean BAI of the trees, whereas the increased level of canopy openness was positively related to the mean BAI. The beech trees growing in dry plots had lower mean BAI than less-dry plots; however, not statistically significant with an importance level of 0.07 compared to 0.78 in competition and 0.15 in canopy openness. Overall, it can be stated that competition, light (measured as canopy openness), and dryness of the soil influence the mean BAI of the beech trees and explained 41% of the variation of the data (Table 4).

4. Discussion

This study was conducted at five forests in three locations in Germany and Switzerland to investigate beech trees’ relative growth response under a warming climate. All our study sites were on south-facing hill slopes with heterogeneous soil conditions (i.e., deep to shallow and less to high stony soil), resulting in moderate to low soil water storage capacity. The edaphic–climatic drought events in this region are created by extreme years with above-average temperature and evapotranspiration and below-normal precipitation coupled with site constraints such as low soil water storage capacity and high solar irradiation [19]. Since the 1980s, drought events have increased in frequency and severity in our study areas because of temperature, precipitation, and potential evapotranspiration components [40]. During the growing season, the water-deficit was three- to eightfold higher than the soil water storage capacity; therefore, beech trees experienced high stress from drought and responded with decreasing Growth [27,44]. Under such conditions, trees growing in the less-dry plots, where available soil water capacity was comparatively higher, were at an advantage and more likely to capture water than the trees growing in areas with a lower available soil water storage capacity in dry plots [24]. In a previous study, these locations with overall low available soil water capacity were defined as the “dry distribution limit” of beech trees [19]. Chakraborty et al. (2013) showed that beech trees could endure drought stress by persisting a long time under a shade with a stunted growth condition (e.g., 1 mm annual radial growth) [36]. With the considerations mentioned above, we will discuss the findings of this study.

4.1. Growth Difference in Beech Trees between Dry and Less-Dry Plots

The significantly lower size (DBH and height) and growth response (BAI) of trees in the dry plots demonstrated that the effect of drought stress was greater in those plots than in less-dry plots. Our result was consistent with that of the study by Weber et al. (2013) in which a lower growth rate was found among the beech trees in dry sites of southern aspects in Switzerland than among the trees in moist sites of northern aspects [12]. However, in this current study, notably, this difference in the growth of beech trees was found within small forests on drier southern aspects. One of the main reasons for this lower growth rate in dry plots could be the higher rate of branch mortality or crown die-back in the beech trees growing with lower soil water availability, as discussed by Chakraborty et al. (2017) in their study for the same study sites [27]. This is a strategy of persistence in beech trees to overcome stress from drought. Beech trees in dry plots may keep their stomata closed frequently, which results in less photosynthesis and transpiration and further inhibition of cell growth [60], with less active and smaller cells produced than those of trees from less-dry plots. To further confirm our finding, dendroecological studies have previously reported the dependence of beech growth on water availability in other regions [7,10]. Another reason for low growth could be that beech trees growing in dry plots may have less root biomass because of low root growth and higher magnitude of fine root death as mentioned by a previous study [61], which also restricts water uptake and overall photosynthesis of the trees resulting shoot biomass loss.

4.2. Climate-Growth Relationships

The higher temperature in the summer months of the preceding year growth negatively affected beech trees’ growth. This finding was consistent with previous studies [23,46]. The number of months of favorable growth related to precipitation was higher in less-dry plots than in dry plots, because, trees in less-dry plots could use the stored water in soils during the dry summers due to high soil water storage capacity. The favorable growth during the wet summer and warm spring of the current year confirmed findings from two previous studies [10,62]. Additionally, in previous studies, growth was positively correlated with water availability (i.e., P-PET) during the late summer (August and September) of the previous year [10,12]. By contrast, we found this relation starting in July and continuing until August of the previous year, further extending to the current year’s summer months, which demonstrated a prolonged dependency of current year growth on the previous year’s summer months in beech trees. This positive association of current year growth with previous year drought combined with negative temperature and positive precipitation strongly supports the importance of optimal temperature and water availability for carbohydrate storage [45]. Previous studies demonstrate the dependence of the current year’s growth on beech trees’ carbohydrate reserves [8], particularly in a water-stressed condition [46]. The higher relation between drought index and growth in less-dry plots is primarily because of the drought index’s precipitation component. Previous studies [23,44] showed that beech trees’ radial growth is more sensitive to climate with a strong influence from summer temperature and precipitation followed by soil moisture condition, which is consistent with our results. It might explain the greater climate-growth dependency of trees in less-dry plots in the Badenweiler and Schwäbische Alb in which precipitation was always higher, and PET was lower because of the high elevation, which corroborates results found by van der Maaten (2012) [46].
At the temporal scale, the growing dependency of beech trees to climatic drought showed a different decadal pattern between dry and less-dry plots for the months of previous and current years (Figure 7 and Figure 8). This climate-growth relation has been increasing in all study sites. Dorado-Liñán et al. (2017) found an overall growth decreasing pattern in the beech trees over several Mediterranean sites from 1980 onwards. They pointed out that the summer temperature and precipitation change is the main reason [44]. The increasing pattern of climate-growth relation in less-dry plots, notably higher for the months of current years, could be discussed based on the soil water availability factor. The contribution of AWC for the trees in less-dry plots became less beneficial with depletion of soil moisture with several drought events, and the growth reaction increased at a temporal scale. This finding could be supported by the results of Jump et al. (2006), who showed that effects of increasing temperature were not always nullified by precipitation in north-eastern Spain; hence, a shortage in soil water supply explained the growth decline of beech trees at the southern latitudinal distribution limit of the species [5]. The temporal shift in climate-growth relation from late summer to early summer for the last two decades is corroborated by the study of Weber et al. (2013). The precipitation in late spring and early summer was of increasing importance to beech growth, particularly during the last two decades. The combination of a reduction in precipitation and an increase in temperature for the last two decades increased the growth reaction of beech trees to drought.

4.3. Resistance, Recovery, and Resilience of Trees under Multiple Drought Events

Quantifying the resistance, recovery, and resilience in analyzing the effects of extreme years on a tree species’ growth can provide deeper insights into climate-growth relationships [2]. Under severe drought conditions, cavitation occurs in beech trees due to prolonged water stress [63] and cause higher above ground crown die-back [36], which could explain the lower recovery and resilience in trees of dry plots. Moreover, with more soil water reserves for buffering drought conditions, trees from less-dry plots faced a less severe drought than those in the dry plots (higher AWC in less-dry plots). Trees in the dry plots might have less root biomass than those in the less-dry plots because they grew in a smaller space due to higher proportions of stones and shallow soil (Figure 3), although this assumption could not be tested in our study. Those trees from dry plots might also be having smaller root diameter and higher root death caused by less available water [61]. Chakraborty et al. (2013) showed the carry-over effect on beech trees after the 2003 summer drought was longer in trees from drier areas, which might also explain the lower recovery of trees in our study’s dry plots [36]. Furthermore, the effect of drought on mid-term resilience in beech trees could be the result of a longer carry-over drought effect, as also found by Czajkowski et al. (2005). Hacket-Pain et al. (2015) showed that beech trees could have a carry-over effect of at least two years due to carbohydrate depletion during warm summer in their ‘carry-over effect model’ [64,65]. Moreover, in this study, beech trees from dry plots show higher climate-growth relation for the previous months than the less-dry plots (Figure 8), which might also support the carry-over effect of the growth decline is higher in the trees from dry plots than the less-dry plots. The mid-term resistance was higher in the dry plot during the drought of 2003. The reason was that the overall growth in trees from dry plots was low; the sudden depression in growth after an extreme year was also less for those trees than for the trees from less-dry plots, which showed higher growth during moist years. The 2003 summer drought was characterized by high temperature with heatwaves and reduced precipitation during the late spring and summer in central Europe [3], which caused severe depletion of soil water in the study areas. The severe depletion of the soil water created the most extreme conditions for the trees in the less-dry plots compared to the dry plots as those trees had shown higher precipitation dependency for the last few decades (Figure 4 and Figure 6) could be the cause of the lower resistance. Nevertheless, the declining precipitation during the summer months of 2003 reduced the trees’ advantage from less-dry plots in mitigating the effects of drought. As an indication of high resistance, trees from dry plots were more adapted to severe and prolonged droughts during their lifespan because of site constraints. A study by Cavin and Jump (2017) supported our findings and showed that local environments are mitigating drought effects in relict populations despite regional climatic drought and increasing the beech trees’ resistance at their range edges [13].
The high heterogeneity in resistance, recovery, and resilience in the year 1984 suggests that climatic drought and available soil water could not explain alone the variations among those components in that year. A large-scale die-back due to acid rain occurred during the 80s in southwest Germany [66]. A combination of acid rain and other environmental factors with low water availability (i.e., dry plots) had lowered beech trees’ growth at high-altitudinal sites in central Europe [7]. High variation of growth in trees between dry and less dry plots could be the reason for high heterogeneity in that year. It warrants a future study using sulfur, oxygen, and carbon isotopes on tree rings to decouple the effects of acid rain and drought on the growth decline of beech trees in the 1980s. The heterogeneity in resistance in 1992, recovery in 2003, and resilience in both of the years could be attributable to more site-level differences and mast years for beech trees [67], which often coincides with a wet and cold summer preceding a year hot and dry summer before the growing season [65]. Although getting regional data of seed production is very difficult, 2004 was a heavy mast year following the 2003 summer drought, for which post-drought depression was very high in central Germany [68]. Similarly, Scharnweber et al. (2011) were able to point out the year 1992 as a negative pointer year for regional beech chronology combining both masting events and drought year in some areas of Germany [10].

4.4. Growth Reaction of Beech Trees under Drought Stress

The stress tolerance limit and metabolic plasticity are higher in beech trees than in other temperate trees [69], which is typical for all trees growing at marginal sites that must adapt specific survival strategies [70]. Beech trees of our study areas are from the marginal populations of the xeric distribution limit, are showing local adaptations to drought [71], and these populations are at the margin because of variation in the site condition [72]. We showed that severe multiple drought events in a relatively shorter period could affect beech trees’ growth reaction at water-stressed sites, even within a small forest (size 0.3 to 0.9 ha), because of differences in soil water availability. It was demonstrated [73] that a prolonged recovery phase decreases the chances of reversibility, and permanent damage is caused after several extreme events by reducing the resilience based on physiological acclimatization [2], which might be happening in the trees of dry plots at our study areas. A previous study [47] showed that tree mortality in Ponderosa pine forests is associated with higher growth sensitivity to climate, with trees dying because of chronic water stress due to limited water availability, which was necessary as a buffer in forest soils for tree survival. Our study is consistent with the previous study as the beech trees from the dry plots showed higher growth reaction by lower growth, lower rate for both recovery and resilience; this happened because they are facing chronic water stress due to limited available water than those of less-dry plots.

4.5. Impact of Neighborhood Competition and Canopy Openness on the Mean Growth

We found that neighborhood competition, canopy openness, and trees’ location (i.e., dry or less-dry plots) could explain 41% of the variation in the mean basal area increment of beech trees. The mean basal area increment was the average values for the basal area increment from each year of the trees’ life span. However, the competition and canopy openness was measured at once during the time of field inventory. Our study sites were located in forests where commercial forest management (e.g., thinning, harvesting) has been ceased since the 1950s. Hence, the neighborhood of the target beech trees was not altered by human activities, instead of natural processes such as the mortality. Therefore, the neigbourhood composition of target beech trees and canopy openness during field data collection could still explain a significant amount of variation of the mean basal area increment measured over the trees’ lifetime. Vospernik (2021) [74] had shown that the basal area of beech trees could be impacted by the neigbourhood competition in dry sites where larger trees such as oaks dominate the basal area composition, which supports our finding.

5. Conclusions

With the increasing drought severity in forest ecosystems, we conclude that the soil water will play a crucial role in maintaining radial growth for the individual beech tree even within the smaller sized forests (0.3 to 0.9 ha) if they are located at the distribution limit of the trees. Trees growing in soils with low available soil water storage capacity had weak growth and greater temperature dependency than those trees growing in soil with high available soil water storage capacity. The pattern is the opposite of the precipitation dependency in which trees with higher soil water availability show higher growth dependency. We found that, under multiple drought events, trees in less-dry plots have higher resilience and recovery compared to the trees in dry plots. However, resistance is higher in the trees from dry plots. Beech trees, based on the soil water availability, have shown different acclimatization strategies under drought stress. Although the reduction in resistance, recovery, and resilience of beech tree growth exposes the vulnerability of trees to drought-induced die-back in dry parts of the forests, because of the multiple drought events, that warrants more field ecophysiological research. Our findings demonstrate that competition could reduce the mean basal area growth of beech trees in dry sites that are dominated by larger oak trees. We recommend that forest managers and researchers should monitor and preserve xeric forests to study the potential of the natural establishment of beech trees at their distribution limits.

Supplementary Materials

The following are available online at https://www.mdpi.com/1999-4907/12/2/129/s1.

Author Contributions

T.C. developed the concept of this article. T.C. did the field data collections and laboratory analyses. T.C. carried out all statistical analyses and wrote the paper. S.S. contributed to field data collections and statistical analyses. A.M. contributed to the quantification of drought. A.M. and A.R. provided doctoral supervision to T.C. S.S., A.M., and A.R. co-wrote the paper. All authors have read and agreed to the published version of the manuscript.

Funding

Thanks to Heinrich-Böll-Stiftung e.V for awarding the PhD scholarship to T.C. (Grant number P040244). We are also thankful to the following: The Graduate School “Environment, Society and Global Change” of the University of Freiburg, other foundations of the University of Freiburg (i.e., the Müller-Fahnenberg-Stiftung, the Wissenschaftliche-Gesellschaft-Freiburg, the Gesellschaft zur Förderung der forst und holzwirtschaftlichen Forschung an der Universität Freiburg im Breisgau e.V., the Badische Landesverein für Naturkunde und Naturschutz e.V., and Georg-Ludwig-Hartig-Stiftung for their financial supports. We thank Karlsruhe Institute of Technology for covering the article processing charge.

Institutional Review Board Statement

Not applicable.

Informed Consent Statement

Not applicable.

Data Availability Statement

The data used in this study can be accessed by contacting the corresponding authors.

Acknowledgments

We sincerely thank the forest administrations of Müllheim, Öschingen-Mössingen, Klettgau of Baden-Württemberg (Germany), and the community of Wilchingen of Canton Schaffhausen (Switzerland) for giving their permission for tree harvesting and conducting fieldwork. We are thankful to the German Weather Service (DWD) and Swiss Weather Service (MeteoSwiss) for providing long-term climate data. Many thanks to Jan, Georgios, and Nicolas for their help in field and laboratory work. S.S. thanks the International Union of Forest Research Organizations (IUFRO) Task Force “Transforming Forest Landscapes for Future Climates and Human Wellbeing” for fruitful discussions on drought impacts in forest decline. We acknowledge support by the KIT-Publication Fund of the Karlsruhe Institute of Technology.

Conflicts of Interest

The authors are declaring that they do not have any conflict of interest.

References

  1. Allen, C.D.; Breshears, D.D.; McDowell, N.G. On underestimation of global vulnerability to tree mortality and forest die-off from hotter drought in the Anthropocene. Ecosphere 2015, 6, 1–55. [Google Scholar] [CrossRef]
  2. Breda, N.; Huc, R.; Granier, A.; Dreyer, E. Temperate forest trees and stands under severe drought: A review of ecophysiological responses, adaptation processes and long-term consequences. Ann. Sci. 2006, 63, 625–644. [Google Scholar] [CrossRef] [Green Version]
  3. Ciais, P.; Reichstein, M.; Viovy, N.; Granier, A.; Ogee, J.; Allard, V.; Aubinet, M.; Buchmann, N.; Bernhofer, C.; Carrara, A.; et al. Europe-wide reduction in primary productivity caused by the heat and drought in 2003. Nature 2005, 437, 529–533. [Google Scholar] [CrossRef] [PubMed]
  4. Gessler, A.; Keitel, C.; Kreuzwieser, J.; Matyssek, R.; Seiler, W.; Rennenberg, H. Potential risks for European beech (Fagus sylvatica L.) in a changing climate. Trees-Struct. Funct. 2007, 21, 1–11. [Google Scholar] [CrossRef]
  5. Jump, A.S.; Hunt, J.M.; Penuelas, J. Rapid climate change-related growth decline at the southern range edge of Fagus sylvatica. Glob. Chang. Biol. 2006, 12, 2163–2174. [Google Scholar] [CrossRef] [Green Version]
  6. Ellenberg, H.; Leuschner, C. Vegetation Mitteleuropas mit den Alpen: In Ökologischer, Dynamischer und Historischer Sicht, 6., Überarb; Ulmer UTB: Stuttgart, Germany, 2010; p. 1357. [Google Scholar]
  7. Dittmar, C.; Zech, W.; Elling, W. Growth variations of Common beech (Fagus sylvatica L.) under different climatic and environmental conditions in Europe—A dendroecological study. For. Ecol. Manag. 2003, 173, 63–78. [Google Scholar] [CrossRef]
  8. Lebourgeois, F.; Breda, N.; Ulrich, E.; Granier, A. Climate-tree-growth relationships of European beech (Fagus sylvatica L.) in the French Permanent Plot Network (RENECOFOR). Trees-Struct. Funct. 2005, 19, 385–401. [Google Scholar] [CrossRef]
  9. Backes, K.; Leuschner, C. Leaf water relations of competitive Fagus sylvatica and Quercus petraea trees during 4 years differing in soil drought. Can. J. For. Res. 2000, 30, 335–346. [Google Scholar] [CrossRef]
  10. Scharnweber, T.; Manthey, M.; Criegee, C.; Bauwe, A.; Schröder, C.; Wilmking, M. Drought matters-Declining precipitation influences growth of Fagus sylvatica L. and Quercus robur L. in north-eastern Germany. For. Ecol. Manag. 2011, 262, 947–961. [Google Scholar] [CrossRef]
  11. Ammer, C.; Albrecht, L.; Borchert, H.; Brosinger, F.; Dittmar, C.; Elling, W.; Ewald, J.; Felbermeier, B.; von Gilsa, H.; Huss, J.; et al. Future suitability of beech (Fagus sylvatica L.) in Central Europe: Critical remarks concerning a paper of Rennenberg et al. (2004). Allg. Forst Jagdztg. 2005, 176, 60–67. [Google Scholar]
  12. Weber, P.; Bugmann, H.; Pluess, A.R.; Walthert, L.; Rigling, A. Drought response and changing mean sensitivity of European beech close to the dry distribution limit. Trees-Struct. Funct. 2013, 27, 171–181. [Google Scholar] [CrossRef] [Green Version]
  13. Cavin, L.; Jump, A.S. Highest drought sensitivity and lowest resistance to growth suppression are found in the range core of the tree Fagus sylvatica L. not the equatorial range edge. Glob. Chang. Biol. 2017, 23, 362–379. [Google Scholar] [CrossRef] [PubMed] [Green Version]
  14. Chakraborty, T.; Saha, S.; Reif, A. Biomass equations for European beech growing on dry sites. iForest-Biogeosci. For. 2016, 9, 751–757. [Google Scholar] [CrossRef] [Green Version]
  15. Pretzsch, H.; Roetzer, T.; Matyssek, R.; Grams, T.E.E.; Haeberle, K.H.; Pritsch, K.; Kerner, R.; Munch, J.C. Mixed Norway spruce (Picea abies [L.] Karst) and European beech (Fagus sylvatica [L.]) stands under drought: From reaction pattern to mechanism. Trees-Struct. Funct. 2014, 28, 1305–1321. [Google Scholar] [CrossRef]
  16. Schulze, E.-D.; Beck, E.; Muller-Hohenstein, K. Plant Ecology; Springer: Berlin/Heidelberg, Germany, 2005; p. 702. [Google Scholar]
  17. Bolte, A.; Czajkowski, T.; Kompa, T. The north-eastern distribution range of European beech—A review. Forestry 2007, 80, 413–429. [Google Scholar] [CrossRef]
  18. Bertness, M.D.; Callaway, R. Positive interactions in communities. Trends Ecol. Evol. 1994, 9, 191–193. [Google Scholar] [CrossRef]
  19. Gärtner, S.; Reif, A.; Xystrakis, F.; Sayer, U.; Bendagha, N.; Matzarakis, A. The drought tolerance limit of Fagus sylvatica forest on limestone in southwestern Germany. J. Veg. Sci. 2008, 19, 757–768. [Google Scholar] [CrossRef]
  20. Douglass, A.E. Evidence of climatic effects in the annual rings of trees. Ecology 1920, 1, 24–32. [Google Scholar] [CrossRef]
  21. Fritts, H.C. Tree Rings and Climate; Academic Press: San Diego, CA, USA, 1976; p. 567. [Google Scholar]
  22. Schweingruber, F.H. Tree Rings and Environment: Dendroecology; Paul Haupt AG: Bern, Switzerland, 1996. [Google Scholar]
  23. Garcia-Suarez, A.M.; Butler, C.J.; Baillie, M.G.L. Climate signal in tree-ring chronologies in a temperate climate: A multi-species approach. Dendrochronologia 2009, 27, 183–198. [Google Scholar] [CrossRef] [Green Version]
  24. Breda, N.; Badeau, V. Forest tree responses to extreme drought and some biotic events: Towards a selection according to hazard tolerance? Comptes Rendus Geosci. 2008, 340, 651–662. [Google Scholar] [CrossRef]
  25. IPCC. Climate Change 2014: Impacts, Adaptation, and Vulnerability. Part A: Global and Sectoral Aspects. Contribution of Working Group II to the Fifth Assessment Report of the Intergovernmental Panel on Climate Change; Field, C.B., Barros, V.R., Dokken, D.J., Mach, K.J., Mastrandrea, M.D., Bilir, T.E., Chatterjee, M., Ebi, K.L., Estrada, Y.O., Genova, R.C., et al., Eds.; Cambridge University Press: Cambridge, UK; New York, NY, USA, 2014; p. 1132. [Google Scholar]
  26. Metz, J.; Annighöfer, P.; Schall, P.; Zimmermann, J.; Kahl, T.; Schulze, E.-D.; Ammer, C. Site-adapted admixed tree species reduce drought susceptibility of mature European beech. Glob. Chang. Biol. 2016, 22, 903–920. [Google Scholar] [CrossRef] [PubMed]
  27. Chakraborty, T.; Saha, S.; Matzarakis, A.; Reif, A. Influence of multiple biotic and abiotic factors on the crown die-back of European beech trees at their drought limit. Flora-Morphol. Distrib. Funct. Ecol. Plants 2017, 229, 58–70. [Google Scholar] [CrossRef]
  28. Gauer, J.; Aldinger, E. Mitteilungen des Vereins für Forstliche Standortskunde und Forstpflanzenzüchtung; Verein für Forstliche Standortskunde und Forstpflanzenzüchtung e.V.: Freiburg, Germany, 2005; Volume 43. [Google Scholar]
  29. DWD. Wetter und Klima aus Einer Hand; Deutscher Wetterdienst: Offenbach, Germany, 2015.
  30. Federal Office of Meteorology and Climatology. MeteoSwiss; Federal Office of Meteorology and Climatology: Zürich, Switzerland, 2015.
  31. Turc, L. Estimation of irrigation water requirements, potential evapotranspiration: A simple climatic formula evolved up to date. Ann. Agron. 1961, 12, 13–49. [Google Scholar]
  32. Holmes, R.L. Computer-assisted quality control in tree-ring dating and measurement. Tree-Ring Bull. 1983, 43, 69–78. [Google Scholar]
  33. Biondi, F.; Qeadan, F. Inequality in paleorecords. Ecology 2008, 89, 1056–1067. [Google Scholar] [CrossRef] [PubMed] [Green Version]
  34. Cook, E.R.; Krusic, P.J. Program ARSTAN: A Tree-Ring Standardization Program Based on Detrending and Autoregressive Time Series Modeling, with Interactive Graphics; Tree-Ring Laboratory Lamont Doherty Earth Observatory of Columbia University Palisades: New York, NY, USA, 2007. [Google Scholar]
  35. Chakraborty, T. Effect of Soil Drought on Vitality and Growth on Juvenile and Understorey Beech (Fagus sylvatica L.) Trees: Case Study from a Rocky Gneiss Outcrop near Freiburg, Black Forest, Germany. Master’s Thesis, Albert-Ludwigs-University of Freiburg, Freiburg, Germany, 2010; p. 86. Available online: https://freidok.uni-freiburg.de/data/8066 (accessed on 1 January 2021).
  36. Chakraborty, T.; Saha, S.; Reif, A. Decrease in available soil water storage capacity reduces vitality of young understorey European beeches (Fagus sylvatica L.)—A case study from the Black Forest, Germany. Plants 2013, 2, 676–698. [Google Scholar] [CrossRef]
  37. FAO. Guidelines for Soil Description; FAO of the United Nations: Rome, Italy, 2006. [Google Scholar]
  38. Arbeitskreis Standortskartierung in der Arbeitsgemeinschaft Forsteinrichtung. Forstliche Standortsaufnahme: Begriffe, Definitionen, Einteilungen, Kennzeichnungen, Erläuterungen, 7th ed.; IHW-Verlag: Eching, Germany, 2016. [Google Scholar]
  39. Matzarakis, A.; Rutz, F.; Mayer, H. Modelling radiation fluxes in simple and complex environments—Application of the RayMan model. Int. J. Biometeorol. 2007, 51, 323–334. [Google Scholar] [CrossRef]
  40. Spinoni, J.; Naumann, G.; Vogt, J.; Barbosa, P. European drought climatologies and trends based on a multi-indicator approach. Glob. Planet. Chang. 2015, 127, 50–57. [Google Scholar] [CrossRef]
  41. Biondi, F.; Waikul, K. DENDROCLIM2002: A C++ program for statistical calibration of climate signals in tree-ring chronologies. Comput. Geosci. 2004, 30, 303–311. [Google Scholar] [CrossRef]
  42. Piovesan, G.; Biondi, F.; Di Filippo, A.; Alessandrini, A.; Maugeri, M. Drought-driven growth reduction in old beech (Fagus sylvatica L.) forests of the central Apennines, Italy. Glob. Chang. Biol. 2008, 14, 1265–1281. [Google Scholar] [CrossRef]
  43. Hacket-Pain, A.J.; Cavin, L.; Friend, A.D.; Jump, A.S. Consistent limitation of growth by high temperature and low precipitation from range core to southern edge of European beech indicates widespread vulnerability to changing climate. Eur. J. Res. 2016, 135, 897–909. [Google Scholar] [CrossRef] [Green Version]
  44. Dorado-Linan, I.; Zorita, E.; Martinez-Sancho, E.; Gea-Izquierdo, G.; Di Filippo, A.; Gutierrez, E.; Levanic, T.; Piovesan, G.; Vacchiano, G.; Zang, C.; et al. Large-scale atmospheric circulation enhances the Mediterranean East-West tree growth contrast at rear-edge deciduous forests. Agric. For. Meteorol. 2017, 239, 86–95. [Google Scholar] [CrossRef]
  45. Kozlowski, T.T.; Pallardy, S.G. Growth Control in Woody Plants; Academic Press: San Diego, CA, USA, 1997; p. 641. [Google Scholar]
  46. van der Maaten, E. Climate sensitivity of radial growth in European beech (Fagus sylvatica L.) at different aspects in southwestern Germany. Trees-Struct. Funct. 2012, 26, 777–788. [Google Scholar] [CrossRef] [Green Version]
  47. Lloret, F.; Keeling, E.G.; Sala, A. Components of tree resilience: Effects of successive low-growth episodes in old ponderosa pine forests. Oikos 2011, 120, 1909–1920. [Google Scholar] [CrossRef]
  48. Sohn, J.A.; Kohler, M.; Gessler, A.; Bauhus, J. Interactions of thinning and stem height on the drought response of radial stem growth and isotopic composition of Norway spruce (Picea abies). Tree Physiol. 2012, 32, 1199–1213. [Google Scholar] [CrossRef] [Green Version]
  49. Sohn, J.; Saha, S.; Bauhus, J. Potential of forest thinning to mitigate drought stress: A meta-analysis. For. Ecol. Manag. 2016, 380, 261–273. [Google Scholar] [CrossRef]
  50. Osenberg, C.W.; Sarnelle, O.; Cooper, S.D. Effect size in ecological experiments: The application of biological models in meta-analysis. Am. Nat. 1997, 150, 798–812. [Google Scholar] [CrossRef]
  51. Gurevitch, J.; Hedges, L.V. Statistical issues in ecological meta-analyses. Ecology 1999, 80, 1142–1149. [Google Scholar] [CrossRef]
  52. Saha, S.; Kuehne, C.; Kohnle, U.; Brang, P.; Ehring, A.; Geisel, J.; Leder, B.; Muth, M.; Petersen, R.; Peter, J. Growth and quality of young oaks (Quercus robur and Quercus petraea) grown in cluster plantings in central Europe: A weighted meta-analysis. For. Ecol. Manag. 2012, 283, 106–118. [Google Scholar] [CrossRef]
  53. Rosenberg, M.S.; Adams, D.C.; Gurevitch, J. MetaWin: Statistical Software for Meta-Analysis; Sinauer Associates: Sunderland, MA, USA, 2000. [Google Scholar]
  54. Dawkins, H.C.; Field, D.R.B. A Long-Term Surveillance System for British Woodland Vegetation; Commonwealth Forestry Institute: Oxford, UK, 1978. [Google Scholar]
  55. Clark, D.A.; Clark, D.B. Life history diversity of canopy and emergent trees in a neotropical rain forest. Ecol. Monogr. 1992, 62, 315–344. [Google Scholar] [CrossRef]
  56. Regent Instruments. WinSCANOPY: For Canopy Analysis; Regent Instruments Inc.: Quebec, QC, Canada, 2008. [Google Scholar]
  57. Coomes, D.A.; Allen, R.B. Effects of size, competition and altitude on tree growth. J. Ecol. 2007, 95, 1084–1097. [Google Scholar] [CrossRef]
  58. Hegyi, F. A simulation model for managing jack-pine stands. In Growth Models for Tree and Stand Simulation; Fries, J., Ed.; Royal College of Forestry: Stockh, Sweden, 1974; pp. 74–76. [Google Scholar]
  59. Pretzsch, H. Forest Dynamics, Growth, and Yield; Springer: Berlin/Heidelberg, Germany, 2009. [Google Scholar]
  60. Aranda, I.; Gil, L.; Pardos, J.A. Water relations and gas exchange in Fagus sylvatica L. and Quercus petraea (Mattuschka) Liebl. in a mixed stand at their southern limit of distribution in Europe. Trees-Struct. Funct. 2000, 14, 344–352. [Google Scholar] [CrossRef]
  61. Meier, I.C.; Leuschner, C. Belowground drought response of European beech: Fine root biomass and carbon partitioning in 14 mature stands across a precipitation gradient. Glob. Chang. Biol. 2008, 14, 2081–2095. [Google Scholar] [CrossRef]
  62. Cavin, L.; Mountford, E.P.; Peterken, G.F.; Jump, A.S. Extreme drought alters competitive dominance within and between tree species in a mixed forest stand. Funct. Ecol. 2013, 27, 1424–1435. [Google Scholar] [CrossRef]
  63. Barigah, T.S.; Charrier, O.; Douris, M.; Bonhomme, M.; Herbette, S.; Ameglio, T.; Fichot, R.; Brignolas, F.; Cochard, H. Water stress-induced xylem hydraulic failure is a causal factor of tree mortality in beech and poplar. Ann. Bot. 2013, 112, 1431–1437. [Google Scholar] [CrossRef]
  64. Czajkowski, T.; Kuhling, M.; Bolte, A. Impact of the 2003 summer drought on growth of beech sapling natural regeneration (Fagus sylvatica L.) in north-eastern Central Europe. Allg. Forst Jagdztg. 2005, 176, 133–143. [Google Scholar]
  65. Hacket-Pain, A.J.; Friend, A.D.; Lageard, J.G.A.; Thomas, P.A. The influence of masting phenomenon on growth-climate relationships in trees: Explaining the influence of previous summers’ climate on ring width. Tree Physiol. 2015, 35, 319–330. [Google Scholar] [CrossRef]
  66. Krahl-Urban, B.; Papke, H.; Peters, K.; Schimansky, C. Forest Decline: Cause-Effect Research in the United States of North America and the Federal Republic of Germany; Assessment Group for Biology, Ecology and Energy of the Juelich Research Center for the US Environmental Agency and German Ministery of Research and Technology: Jülich, Germany, 1988.
  67. Vacchiano, G.; Hacket-Pain, A.; Turco, M.; Motta, R.; Maringer, J.; Conedera, M.; Drobyshev, I.; Ascoli, D. Spatial patterns and broad-scale weather cues of beech mast seeding in Europe. New Phytol. 2017, 215, 595–608. [Google Scholar] [CrossRef] [Green Version]
  68. Mund, M.; Kutsch, W.L.; Wirth, C.; Kahl, T.; Knohl, A.; Skomarkova, M.V.; Schulze, E.D. The influence of climate and fructification on the inter-annual variability of stem growth and net primary productivity in an old-growth, mixed beech forest. Tree Physiol. 2010, 30, 689–704. [Google Scholar] [CrossRef] [Green Version]
  69. Garcia-Plazaola, J.I.; Esteban, R.; Hormaetxe, K.; Fernandez-Marin, B.; Becerril, J.M. Photoprotective responses of Mediterranean and Atlantic trees to the extreme heat-wave of summer 2003 in Southwestern Europe. Trees-Struct. Funct. 2008, 22, 385–392. [Google Scholar] [CrossRef]
  70. Aranda, I.; Gil, L.; Pardos, J. Seasonal water relations of three broadleaved species (Fagus sylvatica L, Quercus petraea (Mattuschka) Liebl and Quercus pyrenaica Willd) in a mixed stand in the centre of the Iberian Peninsula. For. Ecol. Manag. 1996, 84, 219–229. [Google Scholar] [CrossRef]
  71. Hampe, A.; Petit, R.J. Conserving biodiversity under climate change: The rear edge matters. Ecol. Lett. 2005, 8, 461–467. [Google Scholar] [CrossRef] [PubMed] [Green Version]
  72. Bolte, A.; Czajkowski, T.; Cocozza, C.; Tognetti, R.; de Miguel, M.; Psidova, E.; Ditmarova, L.; Dinca, L.; Delzon, S.; Cochard, H.; et al. Desiccation and mortality dynamics in seedlings of different European beech (Fagus sylvatica L.) populations under extreme drought conditions. Front. Plant Sci. 2016, 7, 12. [Google Scholar] [CrossRef] [PubMed] [Green Version]
  73. Gutschick, V.P.; BassiriRad, H. Extreme events as shaping physiology, ecology, and evolution of plants: Toward a unified definition and evaluation of their consequences. New Phytol. 2003, 160, 21–42. [Google Scholar] [CrossRef]
  74. Vospernik, S. Basal area increment models accounting for climate and mixture for Austrian tree species. For. Ecol. Manag. 2021, 480, 21. [Google Scholar] [CrossRef]
Figure 1. (a) Natural distribution area of European beech (Fagus sylvatica L.) (reproduced from the distribution map of Beech (Fagus sylvatica L.) by the European Forest Genetic Resources Program—EUFORGEN 2009) with the location of the study area; (b) location of the five forests as study areas in Germany and Switzerland.
Forests 12 00129 g001
Figure 2. Schematic diagram of continuous plots in the transect, starting from beech dominated forest in deep soil to oak-dominated forest in shallow soil through the transition zone with the heterogeneous soil depth, study site located at Schönberg in the Schwäbische Alb.
Forests 12 00129 g002
Figure 3. Chronology series of residual indices for the tree ring width of dry and less-dry plots for Badenweiler, Klettgau, and Schwäbische Alb. Chronology series are shown from 1951 to 2011 for Badenweiler and Klettgau, and from 1961 to 2011 for the Schwäbische Alb. The black dashed line through the value 1.0 indicates the control over the growth; values above the line mean higher growth, where below the line means depression. Black stars indicate six drought years (1976, 1984, 1989, 1992, 1998, and 2003) that were used for the resistance, recovery, and resilience analysis of the trees. Graphs in columns indicate data for Badenweiler, Klettgau, and Schwäbische Alb from left to right, respectively.
Forests 12 00129 g003
Figure 4. Picture of two soil profiles dug separately in dry and less-dry plots in the study area: (a) Soil profile at a dry plot in Seinbruch, Klettgau; soil depth: 34 cm; available soil water storage capacity: 46 mm; (b) soil profile at a less-dry plot in Schönberg, Schwäbische Alb; soil depth: 92 cm; available soil water storage capacity: 103.2 mm.
Forests 12 00129 g004
Figure 5. Mean temperature, measured in degree centigrade (°C), total precipitation, total potential evapotranspiration (PET), and precipitation–potential evapotranspiration (P-PET), all measured in millimeter (mm) for the three study locations from 1947 to 2011 with the separate trend line. All graphs on left-hand side, denoted by (a), are for the entire year, whereas all graphs on right hand side, denoted by (b), are for the growing season (May–September). Graphs in rows are for temperature, precipitation, potential evapotranspiration (PET), and drought index (P-PET) from top to bottom, respectively.
Forests 12 00129 g005
Figure 6. Significant correlations (p < 0.05) between tree ring width chronology and monthly climatic data for Badenweiler, Klettgau, and Schwäbische Alb. Residual tree ring width index was used as a dependent variable where preceding and current growing months’ temperature, precipitation, and drought index were used as an independent variable. Red bars indicate relations for dry plots and green bars for less-dry plots. Graphs in rows show relations for temperature, precipitation, and drought index from top to bottom; respectively, graphs in columns show relations for different locations from left to right.
Forests 12 00129 g006
Figure 7. Correlations between radial tree growth and climatic parameters at a temporal scale separately for dry and less-dry plots in (a) Badenweiler, (b) Klettgau, and (c) Schwäbische Alb. Residual tree ring width indices were used as the dependent variable, whereas monthly (May to October of the previous calendar year of the growth) temperature, precipitation, and drought index (P-PET) were used as the independent variables. Only months with significant relations are shown in the graphs. For Badenweiler and Klettgau, the correlation analysis was run for the period of 1951 to 2011 with the moving window base length of 30 years, which generated results for the period of 1981 to 2011; for Schwäbische Alb, the correlation analysis was run from 1961 to 2011 with the same moving window base length of 30 years which generated results for the period of 1991 to 2011.
Forests 12 00129 g007aForests 12 00129 g007bForests 12 00129 g007c
Figure 8. Correlations between radial tree growth and climatic parameters at a temporal scale separately for dry and less-dry plots in (a) Badenweiler, (b) Klettgau, and (c) Schwäbische Alb. Residual tree ring width indices was used as the dependent variable, whereas monthly (March to September of the current calendar year of the growth) temperature, precipitation drought index (P-PET) were used as the independent variables. Only months with significant relations are shown in the graphs. For Badenweiler and Klettgau, the correlation analysis was run for the period of 1951 to 2011 with the moving window base length of 30 years, which generated results for the period of 1981 to 2011; for Schwäbische Alb the correlation analysis was run for the period of 1961 to 2011 with the same moving window base length of 30 years which generated results for the period of 1991 to 2011.
Forests 12 00129 g008aForests 12 00129 g008bForests 12 00129 g008c
Figure 9. Comparison of short- and mid-term cumulative effect sizes for resistance (a), recovery (b), and resilience (c) between dry (D) and less-dry (LD) plots (three locations combined) by using response ratios for six multiple drought events. If the value is exactly 1, it means no difference between dry and less-dry plots. A bold straight line is added through the value 1 to highlight this. Values above 1 denote a higher response in dry plots, and values below 1 denote a lower response in dry plots than in less-dry plots. The difference between a response ratio value and 1 is the magnitude of difference (converted to %) in resistance, recovery, and resilience between dry and less-dry plots. Star marks indicate significant relationships among the six drought events. The orange and blue lines are only joining the values among the drought events.
Forests 12 00129 g009
Table 1. Topographic and climatic characteristics of five oak–beech forests on Jurassic limestone (rendzina soil) from three locations in southern Germany and northern Switzerland. m a.s.l: meters above sea level, ha: hectare, MAT: mean annual temperature, MTAP: mean total annual precipitation, MTAPET: mean total annual potential evapotranspiration, °: degree; 1 = after Gauer et al. [28], 2 = Average and sums were calculated from the climatic data collected from German [29] and Swiss [30] weather services for the study period, 3 = after Turc [31].
StandCountryRegion/LocalityGeographic Location (Long. E, Lat. N)Elevation (m a.s.l.)Size (ha)MAT (°C) 2MTAP (mm) 2MTAPET (mm) 2 3Days > 10 °C 1Slope Angle (°)Aspect (°)
InnerbergGermanyBadenweiler in Markgräflerland7.67, 47.815240.99.21000108517723155–180
SchönbergGermanySchwäbische Alb9.12, 48.427810.85.383191214331205–243
KätzlerGermanyKlettgau8.43, 47.625660.37.7966100616430185–228
SteimüriSwitzerlandKlettgau8.50, 47.655840.57.796699216424251–280
SteinbruchSwitzerlandKlettgau8.50, 47.676430.47.7966100416416210–220
Table 2. Descriptive statistics of the sampled trees and the basal area increment chronology based on dry and less-dry plots. DBH: diameter at the height of 1.3 m, St. dev.: standard deviation, BAI: basal area increment, Mean rbar: average inter-series correlation for the whole series, EPS: expressed population signal, AWC: available soil water storage capacity.
ParameterBadenweilerKlettgauSchwäbische Alb
Dry PlotsLess-Dry PlotsDry PlotsLess-Dry PlotsDry PlotsLess-Dry Plots
Number of trees (N)9912998
Mean DBH (cm)7.828.977.769.987.037.5
St. dev. of DBH3.13.222.22.952.73.59
Mean age (years)525681784647
St. Dev. Of age9162115107
Mean height (m)8.39.787.38.896.87.25
St. dev. of height1.92.112.32.652.31.25
Total timespan1948–20111939–20111908–20111910–20111958–20111959–2011
Reliable timespan1951–20111951–20111951–20111951–20111961–20111961–2011
Mean BAI (mm2)71.1093.3154.3887.3465.8286.62
St. dev. of BAI52.8944.7914.9028.0333.7137.52
Mean sensitivity0.4910.4960.2770.3130.3370.353
Mean rbar0.3960.4140.3530.4270.4660.416
EPS0.860.860.0.870.870.890.85
Mean AWC (mm)49.673.1442.2375.8348.62101.54
St. dev. of AWC1112.710.0513.0611.8937.09
Table 3. Tree species richness, basal area, stem density, and basal area proportion of oak, beech, and other tree species in study locations.
LocationsMean Tree Species RichnessBasal Area (m2/ha)Stem Density/haBasal Area Proportion (%) of Quercus sp.Basal Area Proportion (%) of Fagus SylvaticaBasal Area Proportion (%) of Other Tree Species
Badenweiler547364087.715.556.74
Klettgau542162843.5337.3619.11
Schwäbische Alb833359450.6521.1728.18
Table 4. Result of regression analysis on the influence of neighborhood competition, light availability, and water availability on mean basal area increment of the beech trees (SE = standard error, CI = confidence interval at 95%) (Adjusted R2 = 0.41, N = 56). Predictors’ importance ranged from 0 to 1, with higher values signifies higher importance. The predictor or explanatory variable’s importance is the residual sum of the squares with the predictor removed from the model, normalized so that the importance values sum to one.
Explanatory Variables CoefficientSE of Coefficient t Valuep ValueLower CIUpper CIPredictors’ Importance
Intercept98.8712.687.790.000173.401124.35
Hegyi’s index−2.290.41−5.480.0001−3.13−1.450.78
Canopy openness2.721.132.4060.020.455.080.15
AWC Class Dry vs. Less dry−14.339.34−1.530.131−33.14.430.07
Publisher’s Note: MDPI stays neutral with regard to jurisdictional claims in published maps and institutional affiliations.

