Article

Effects of Fertilization on Wood Formation in Naturally Regenerated Juvenile Silver Birch in a Norway Spruce Stand in South Sweden

Department of Forestry and Wood Technology, Linnaeus University, 351 95 Växjö, Sweden
*
Author to whom correspondence should be addressed.
Forests 2021, 12(4), 415; https://doi.org/10.3390/f12040415
Submission received: 16 February 2021 / Revised: 25 March 2021 / Accepted: 25 March 2021 / Published: 30 March 2021
(This article belongs to the Section Forest Ecology and Management)

Abstract

:
This study investigates wood density and anatomy of juvenile silver birch stems in Sweden, grown in mixed conifer stands. Our aim is to investigate if fertilization provides increased growth, as well as an eventual reduction in stem wood density. Measurements of basic density, ring width, cell wall thickness, and vessels are analyzed for 20 birch trees. Bark to pith radial sections are analyzed using a light microscope and the freeware ImageJ to compare treatments and ages. The results show that trees with fertilizer treatment have wider growth rings and thinner cell wall thickness compared to unfertilized trees. The fertilized trees also have a lower cambium age at the same height and the same diameter, and a slightly lower stem mean density (420 kg m−3) than the unfertilized stems (460 kg m−3). Fertilizer is a significant determinant of density and cell wall thickness in nonlinear models. The fertilized trees have increased growth and reached a fixed diameter earlier. The age difference between the trees likely explains some of the differences in cell wall thickness. This study supports the use of fertilizer as a silvicultural option for increasing the growth rate of silver birch for a relatively small reduction of wood density.

1. Introduction

In recent years, fertilization has been highlighted as a potential method to improve tree growth in boreal forests, increasing biomass production and providing more raw material for the bio-economy [1]. Despite this, limited attention has been paid to the self-regenerated broadleaf tree species which occur naturally in these stands, such as silver birch (Betula pendula Roth.) and downy birch (Betula pubescens Ehrh.), which are common in Sweden. The majority of these birches are commonly removed during pre-commercial thinning operations and left to decay, even though their diameters are large enough for further industrial processing to produce, for example, furniture or engineered wood products (EWP) [2]. Short-term forest growth is almost instantly increased through fertilization, which can be applied to both mature [3,4] and young forests [5]. Numerous studies in North American temperate broadleaved forests have found a positive growth response to fertilization [6], yet research about the growth response in boreal broadleaf forests is limited.
Conifers are evergreen, while broadleaved species are usually deciduous; they drop their leaves at the end of each growing season. This difference in plant phenology means deciduous birches must build up their canopies annually, while the native conifers retain needles between growing seasons and likely have a longer response time to fertilizer [7,8]. The response in wood formation should also differ since nutrient addition that drastically increases conifer growth can result in decreased density [9]. A diffuse-porous broadleaved species like birch can be expected to have a different growth response, both in increment and wood formation.
Adding nitrogen and mineral nutrients to enhance growth, i.e., fertilization, has been successfully demonstrated for various tree and forest types [10]. Studies of intensive forest management in Sweden have found that fertilizers can potentially increase the volume production by 26%–200% [1,11,12]. Previously published information about the response of birch to fertilization is inconsistent. Paavilainen [13] remarked that birch usually has a positive response to fertilization, but it was smaller than the response of conifers. Hoyle and Bjorkbom [14] also reported an increase in birch growth after fertilization. Viro [15] studied a fertilized mixed stand with pine, silver birch, and downy birch. Viro found that fertilization did not affect the total biomass, but instead, more biomass was allocated to branches and less to foliage in the fertilized stand than the unfertilized stand. Moilanen [16] reported a weak response to fertilizer treatment for silver birch growing on peat-lands relative to the stem growth and height growth for their control stand. Furthermore, Kaunisto [17] found that on mined peatlands, fertilization with nitrogen, phosphorus, and potassium, slightly increased the growth of birch seedlings.
The effects of increased growth rate on the structure of birch wood anatomy have seldom been studied [18]. For most wood species, an increased growth rate may change wood properties [19] as the growth rings become wider. The wood that is first formed in the tree, the juvenile wood, often has wide growth rings [20] associated with different, and less desirable, mechanical properties than mature wood (or ‘outer-wood’) [21]. Rapid growth in young trees can increase the total proportion of juvenile wood in the final product as the growth rings become wider [21]. As trees become older, the growth rate and ring width generally decreases [22].
Wood density, strongly correlated to wood mechanical properties, depends on the cellular ultrastructure, the amount of cell wall material, lumen cavities, vessel size and their frequency [23,24], as well as extractives and the wood’s moisture content. Wood density is, therefore, a commonly used wood quality indicator, related to wood properties, such as shrinkage and mechanical strength, as well as to pulp properties and yield [25]. The cell structure is mainly influenced by cambium age and ring width [26], and the within tree radial variations can be useful for distinguishing between age and growth effects [27]. In some conifers, wood density is directly affected by the tree growth rate, as shown for Pinus cooperi [28] and for Norway spruce (Picea abies Karst), where density is negatively correlated with ring width [29,30]. Generally, a wood fiber’s function is to support the tree, thus their ultrastructure is of great importance to define the mechanical properties of wood [24]. In some coniferous species, cell diameter can affect cell wall thickness, as found by Cuny et al. [31]. In their study, the amount of material deposited was almost constant, with the rate of cell expansion driving cell wall deposition and determining density.
Some research suggests that density is hardly affected by the growth rate in diffuse-porous trees [19,25,32], due to the uniform growth ring pattern. Beech, a diffuse-porous species with similar wood to birch, may experience a slight reduction in density as ring width increases [33], although Peters et al. [34] found a contradictory relationship, due to a reduction in the ratio of fibers to vessels. There is no consensus on how the growth rate affects the wood density in birch. Ollinmaa [35], according to Loustarinen and Verkasalo [36], reported no difference in density between slow and fast-growing silver birches. Velling [37] reported a weak correlation between growth rate and density in mature silver birch, while Bhat [38] found a significant negative relationship for similar material. A negative correlation was also found for juvenile silver birch by Liepiòð and Rieksts-Riekstiòð [39]. The studies mentioned here had no assessment of properties at the cellular level.
While there is evidence that a more mature cambium in silver birch produces denser wood [38,39,40,41,42], knowledge about the effect of increased growth on wood anatomy and subsequent wood density is scarce for silver birch. A better understanding of density variation as a function of radial growth is important for silver birch, as it is an important species for European industries [43,44]. Learning more about wood variation could facilitate the increased use of silver birch in products, such as furniture, flooring, and interior decorations. The objective of this study was to compare the growth-related changes in anatomical wood properties of young silver birch with and without fertilization, and to characterize the annual radial variation of wood anatomy. For this purpose, there were three main hypotheses;
Fertilization of young silver birch will:
(1)
increase growth ring width;
(2)
decrease cell wall thickness;
(3)
decrease wood density.

2. Materials and Methods

The material used for this study was from a site located at the Toftaholm estate, in south-west Sweden (57°0′ N, 14°3′ E). The climate is humid continental, and the mean annual temperature is 6.3 °C, with 766 mm mean annual precipitation [45]. The site is predominately mesic sandy moraine, and there are smaller wetter areas with a thin peat layer. Acid granite dominates the bedrock with a few additions of ultrabasic rock. The terrain is leveled with only minor variation in elevation. The site class index, according to Hägglund and Lundmark [46], is G32, corresponding to a mean annual increment of 11.3 m3 ha−1 potential yield of Norway spruce. The site was wind-felled by a storm in 2005 and then clear-cut. The site had soil scarification and was reforested with planted Norway spruce and natural birch regeneration. Pre-commercial thinning occurred once in 2017.
The fertilization experiment consists of two adjacent stands; one stand was fertilized (treated) by helicopter in April 2014 and April 2016. The amount of nitrogen (N) supplied on each occasion was 150 kg ha−1 of nitrogen, which was determined from leaf N-concentration. The supply of other macro and micronutrients was adjusted to initial target ratios of each element to N [47]. If the ratio of a nutrient element to N was below its target value, an extra amount was added on the next occasion. Threshold leaf concentrations and proportions of the essential nutrient elements for attaining unlimited growth were determined in the earlier laboratory [48] and field experiments [49]. These proportions correspond with recommendations given by Brække [50]. The mean C/N ratio in the top-soil (0–10 cm) prior to fertilization was 24.3 ± 0.6 and 24.5 ± 0.6 (±SE) at the fertilized and unfertilized stand, respectively.
The trees were sampled at the end of May 2018. In the fertilized and the unfertilized stand, ten silver birch (Betula pendula Roth.) trees were sampled, making a total of 20 trees. Table 1 presents some characteristics of the target trees. The trees were subjectively selected based on diameter at breast height (DBH, 1.3 m height from ground height). No damaged trees were accepted. The trees were 4–10 years old (at DBH), and all of the wood was therefore considered to be juvenile [51,52].
Two discs were removed from each tree at breast height (1.3 m), as samples from 1.3 m high generally provide a good estimate of the whole tree density value [53]. The wood samples were initially stored in a freezer (−20 °C) in plastic bags until further sample preparation occurred. From each stem disc, two cuboids were prepared with a knife and hammer. The cuboids measured 10 mm tangential, the full pith-to-bark radial length, and 15 mm longitudinal. Each sample was prepared from the south direction of the disc. The cuboids were cut from wood that was free from knots, cracks, or areas of reaction wood.
The first cuboid from each stem was measured using the water-displacement method as described by Siau [54] to determine basic density; calculated as the oven-dry matter (kg) divided by the green volume (m3) of the specimen. The second cuboid from each stem was used to determine the age, growth of each target tree, double cell wall thickness, and number of vessels per square millimeter. Micro-sections were prepared using a sledge microtome (WSL lab-microtome, Switzerland). Thin sections (≈20 µm) were cut, stained with 1% safranin solution, washed and dried in a stepwise alcohol procedure, and finally mounted in Canada balsam, following the procedures as described in von Arx et al. [55]. Disposable and high quality NT cutter blades were used to ensure clean and quality sections [56,57]. The semi-automated uplift function of the sledge microtome was used to ensure the constant thickness of the samples during the cutting procedure. The light microscope Olympus BX63 and the software program Olympus cellSens, were used for making measurements of ring width and for taking images on the mounted sections.
Measurements were performed along the radial axis, from the pith towards the bark. Mean ring width for the four years before treatment, 2010–2013, was measured to calculate the relative growth rate after treatment. Three of the fertilized trees were excluded in the analysis of growth before and after treatment since they were less than two years old when the treatment started. Basal area (BA) increase was calculated as an approximation of overall tree growth, and bark thickness was not included [22]. In addition, the increase in BA for a given year (BAyear) was estimated using tree ring widths (RW). The total BA for a given year (tBAyear) was calculated by summing any previous years’ RW values to estimate radius for the end of a year (RADyear). This radius then had the relevant year’s RW subtracted (RADyear−1). All radius values were converted to BA values using the formula for a circle’s area (π × RAD2). The BA growth for a given year (BAyear) was equal to tBAyear minus tBAyear−1 for 2015 to 2017.
All sampled trees had complete growth rings (excluding the pith) for 2015, 2016, and 2017, so growth rings were photographed for these years. The open-source freeware ImageJ 1.52j was used to measure wood anatomical properties, as this software has been successfully used in previous studies [58,59]. On each growth ring image, five 0.025 mm2 squares were assessed in the middle of each ring width. Latewood was excluded from the analysis as defined by Luostarinen and Möttönen [60]; the 3–4 layers of flattened cells at the end of each growth ring. The number of vessels and double cell wall thickness, hereafter called cell wall thickness, was measured in the radial direction in each square. The average number of vessels in the five sections was transformed so that vessels per mm2, was the result for one growth ring. Cell wall thickness was measured in micrometers for 30 walls per square, in total 150 measurements per growth ring.
The statistical software packages SPSS 25.0 statistical software (SPSS, Chicago, IL, USA) and R (R Core Team, 2019) were used for the following analyses of data. In SPSS, a linear regression model (Equation (1)) was used to analyze the results of the relationship between density and cell wall thickness and density and ring width.
A v e r a g e   d e n s i t y = α + β X + ε
where A v e r a g e   d e n s i t y (2015–2017) is the dependent variable, β is the regression coefficient, X is the independent variable (average cell wall thickness, or average ring width, 2015–2017), α is the intercept, and ε is any unexplained variance (the model error term).
Linear mixed models were built in R using the lme4 package (Bates, Maechler, and Bolker, 2012) and the ‘lmer’ function. This allowed for the use of binary variables, and the inclusion of fixed and random effects, to better suit the data set. The models were produced to predict average cell wall thickness per ring (CWt) and per tree average density (Dens) as a function of measured variables and treatment. The general model form (Equation (2)) was:
y = X β + Z u + ε
where y is the response vector (either Dens or CWt), β is a parameter matrix for the fixed effects (to be estimated), X is a design matrix which includes the measured traits or factors for each individual, Z is a design matrix of random effects, u is a vector of unobservable random variables (random effects), and ε is a vector of the residual variance not explained by the model. Random effects were used to show relatedness between values. The first random effect was for tree ID as observations were nested by tree. The second random effect in the model included an interaction term for age and year. Ring age and year were retained since they relate to stem age and growing season conditions.
The goodness of fit was assessed using output from R’s summary() function, type 3 ANOVA, and plotting the residual values against the fitted values. The predictor variables (RW, vessel number, BAyear, DBH, and treatment) were initially all added to a model. The summary output for each model in R provided model coefficients and p-values for each variable. The specified linear mixed models were fit by reduced maximum likelihood (REML), so output t-tests used Satterthwaite’s method. Variables were removed from the model as a more economical model is desirable, and to avoid errors associated with overfitting. The variable with the highest p-value was iteratively dropped (backwards selection) and the process repeated until all remaining factors had significant p-values (α = 0.05) in the model (Mod 1). This backward stepwise selection was then paired with forward stepwise selection [61] to build a model from the variables with the two highest p-values (Mod 2) and another with the highest p-value variable (Mod 3) for comparison. Model residuals were plotted as histograms and against predicted values. The anova() function was used to compare Mod 1 to Mod 2, Mod 2 to Mod 3, and Mod 1 to Mod 3, as it provided Akaike information criterion (AIC), Bayesian information criterion (BIC), and log likelihood (LL) values. For ANOVA tests comparing model fits, the models were refit using maximum likelihood (ML) instead of the REML. A model is generally considered the best if AIC, BIC, and LL values are low, and residuals are normally distributed, compared to other models.

3. Results

3.1. Differences in Anatomy between Treatments

The average ring width, for the years after treatment, was larger for trees that received fertilizer than for trees which were unfertilized (Table 2). The average ring width was slightly lower in 2016 (3.3 mm for fertilized, and 2.2 mm for unfertilized) than for 2017 (3.8 mm and 2.5 mm), which shows that the average ring width increased by 0.5 mm for the fertilized and 0.3 mm for the unfertilized trees. 2015 had the widest average ring width for both the fertilized (3.5 mm) and the unfertilized (2.5 mm) trees out of all the years in Table 2. After treatment, fertilized trees also had higher relative growth and increase in basal area than the unfertilized trees (Table 3).
Cell wall thickness also varied between years (Table 2), but was higher in unfertilized trees. The fertilized trees’ average cell wall thickness was 4.5 µm in 2015, 4.3 µm in 2016, and 4.7 µm in 2017. Fertilized cell wall thickness was lower than the unfertilized values of 5.1 µm, 5.3 µm, and 5.4 µm, respectively. The standard deviation for cell wall thickness in Table 2 was 0.9 regardless of year or treatment.
In Table 2, the average number of vessels per mm2 decreased between 2015 and 2017 for both the fertilized and the unfertilized trees. Fertilized trees had 140 in 2015, 143 in 2016, and 102 in 2017, which was more than the unfertilized group. For the same years, the unfertilized trees had vessel numbers of 120, 121, and 99. The standard deviations in Table 2 varied between groups and years, but the fertilized group usually had higher values than the unfertilized group, except 2017, where the values were close (29 and 28).

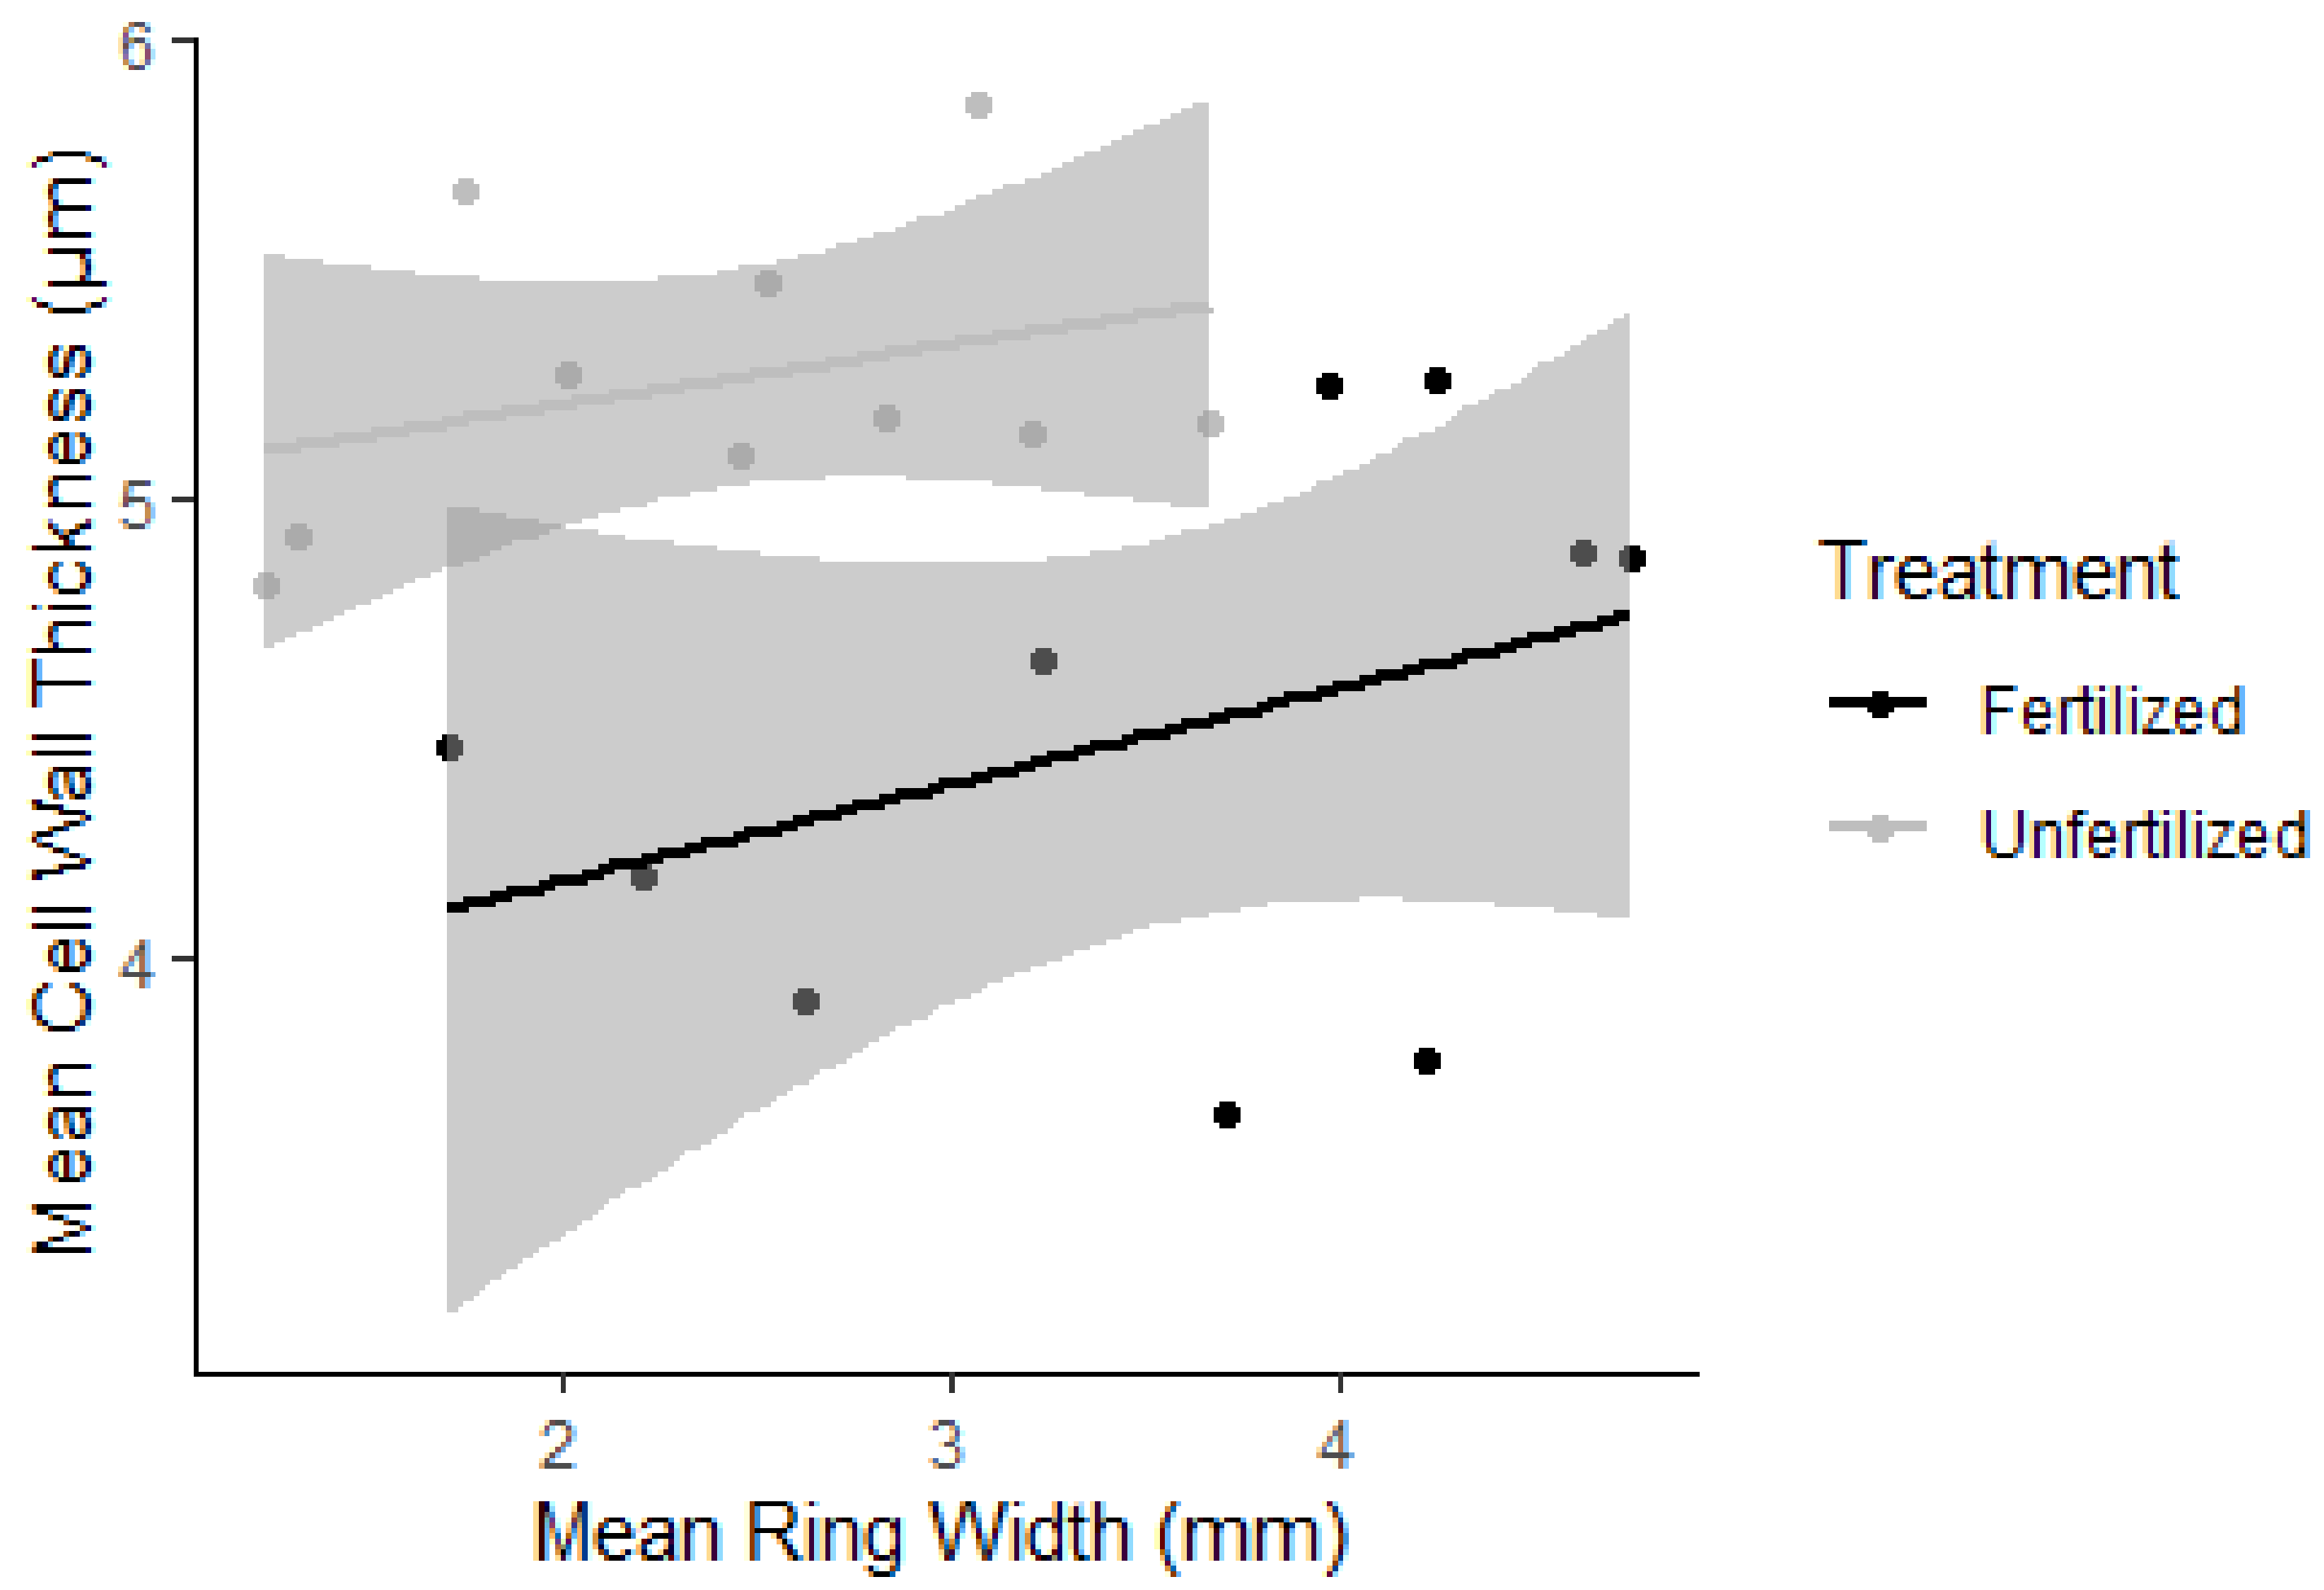
3.2. Growth Rate and Wood Anatomy

A plot (Figure 1) of average cell wall thickness (2015–2017) against average ring width (2015–2017) indicated that cell wall thickness was poorly explained by ring width (p > 0.05). The R2 value was higher for the unfertilized samples (R2 = 0.39) than for the fertilized samples (R2 = 0.11), indicating that either a weak correlation or no correlation existed between cell wall thickness and ring width.
The average wood density increased with the cambium age, for both the fertilized and the unfertilized trees (Figure 2). The graph also shows an absolute difference in age between the two sample groups since the fertilized stems were younger than the unfertilized stems.

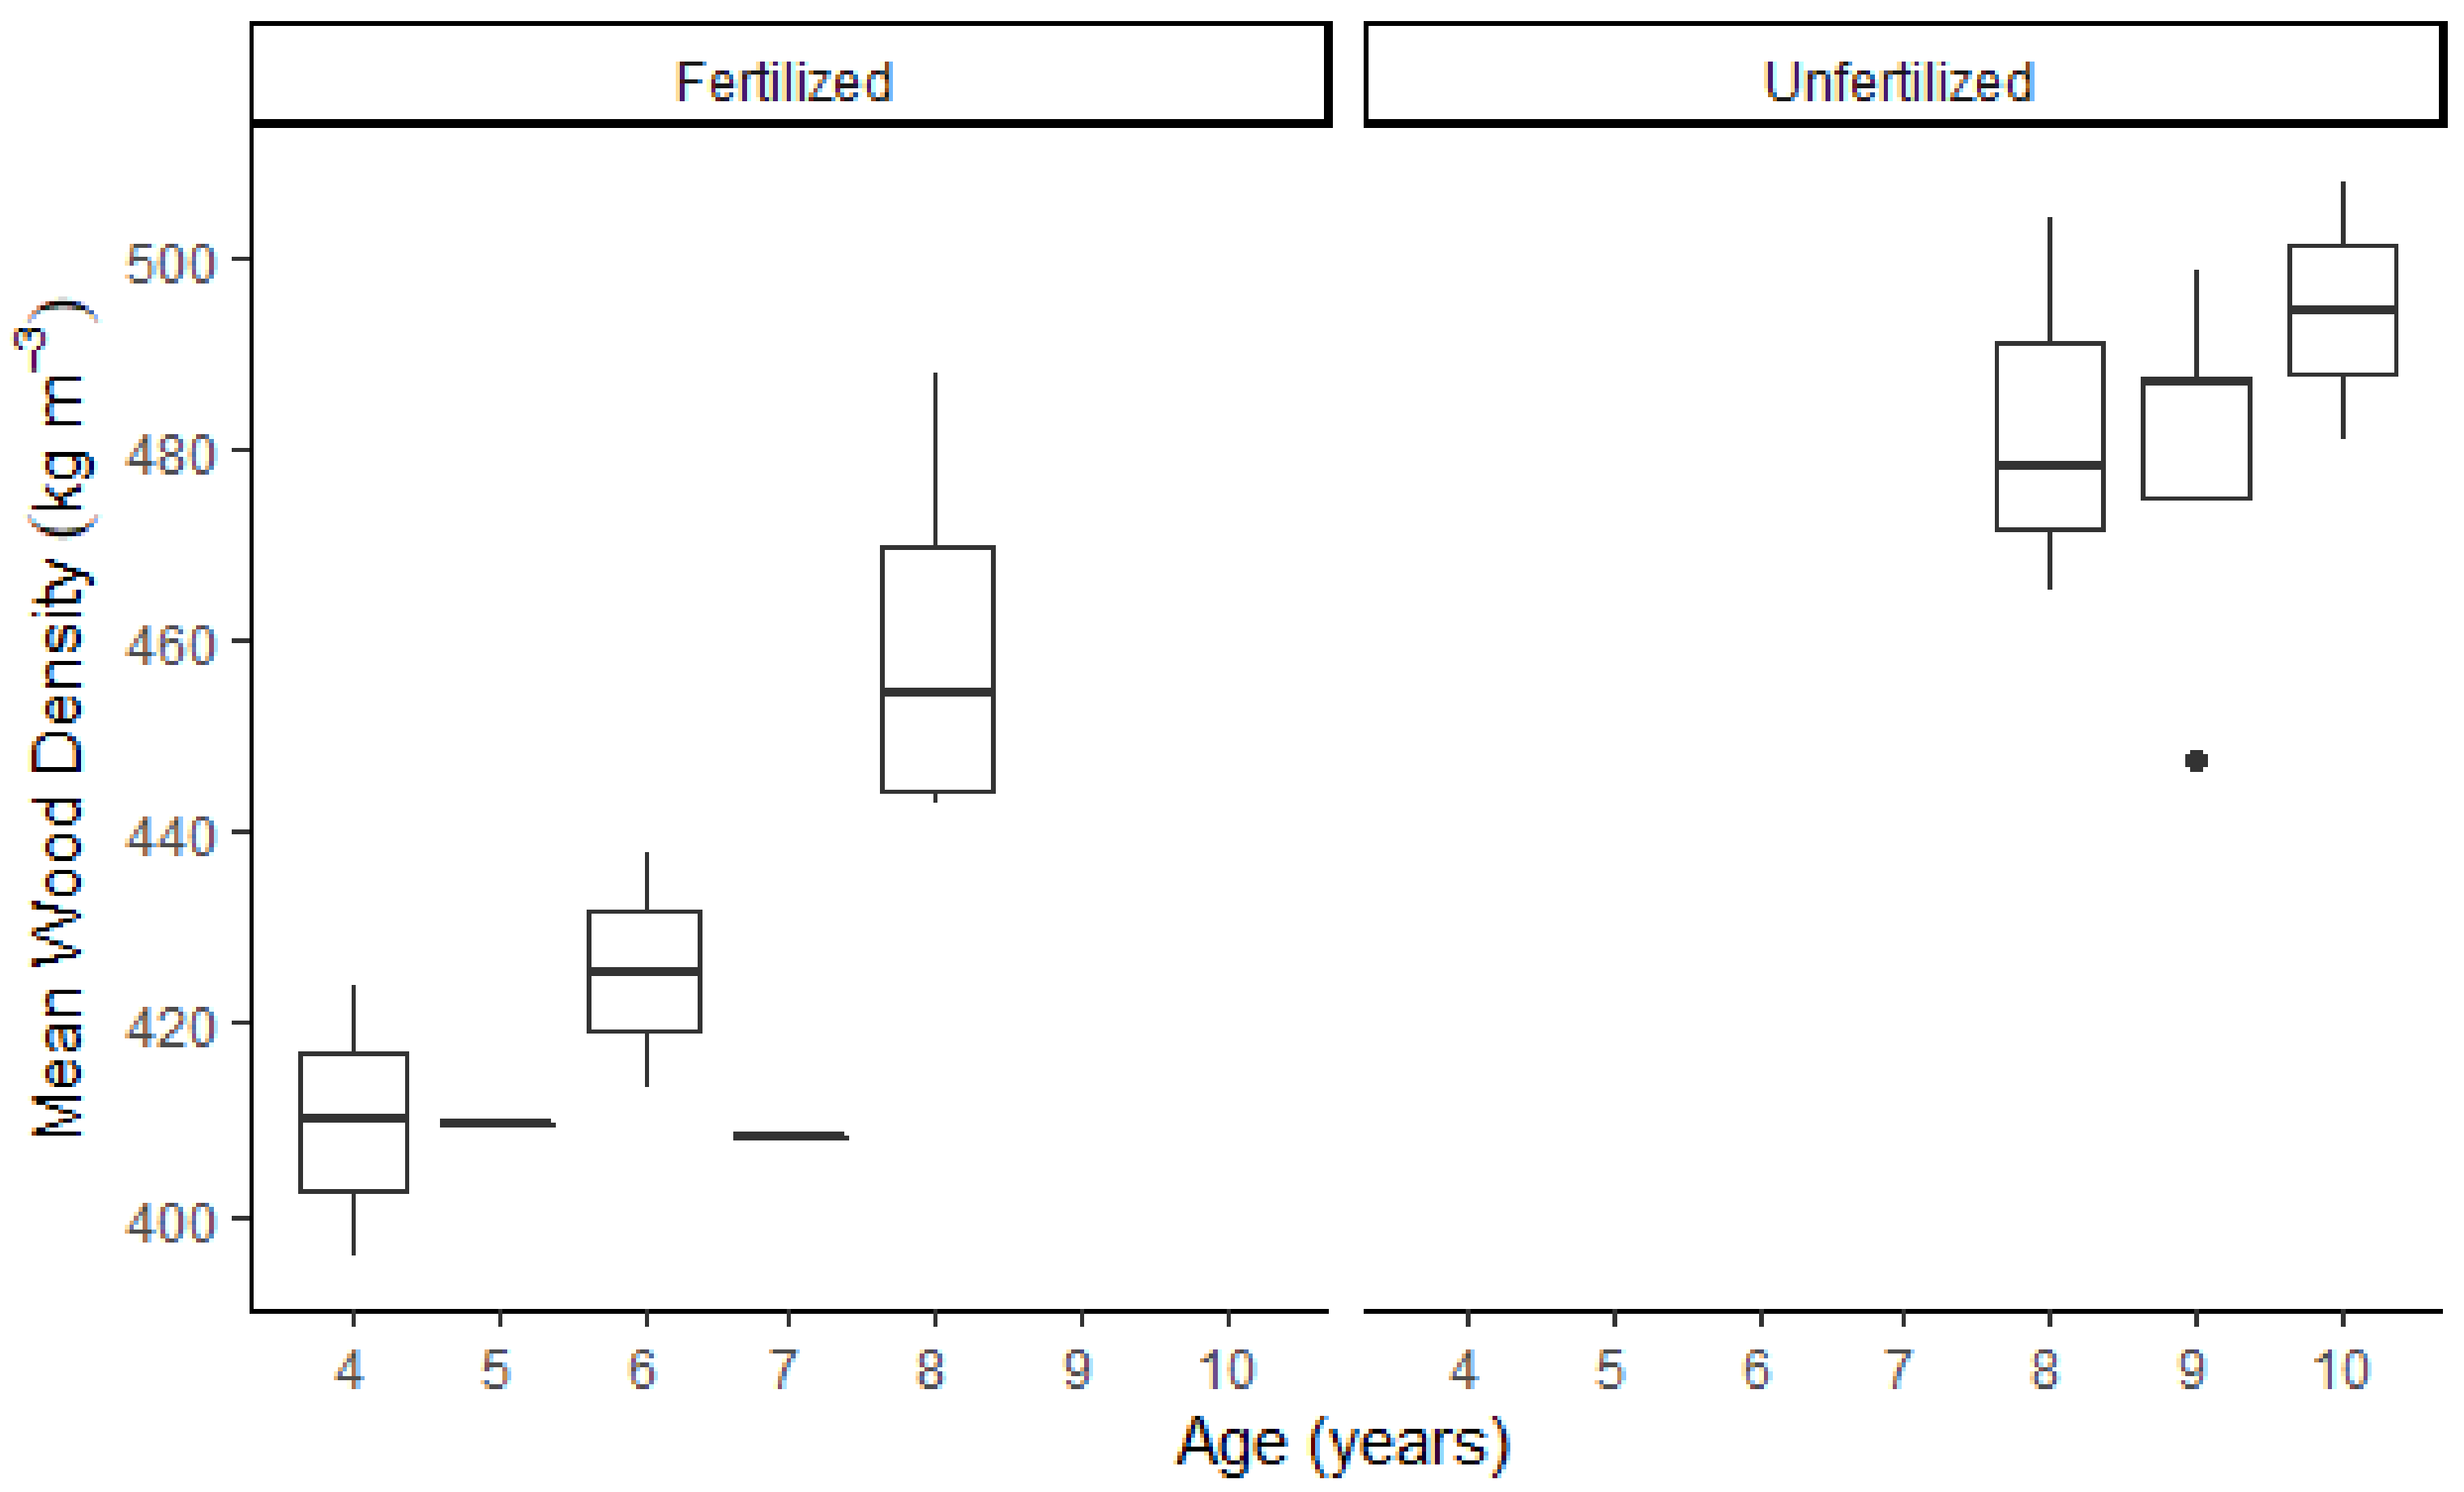
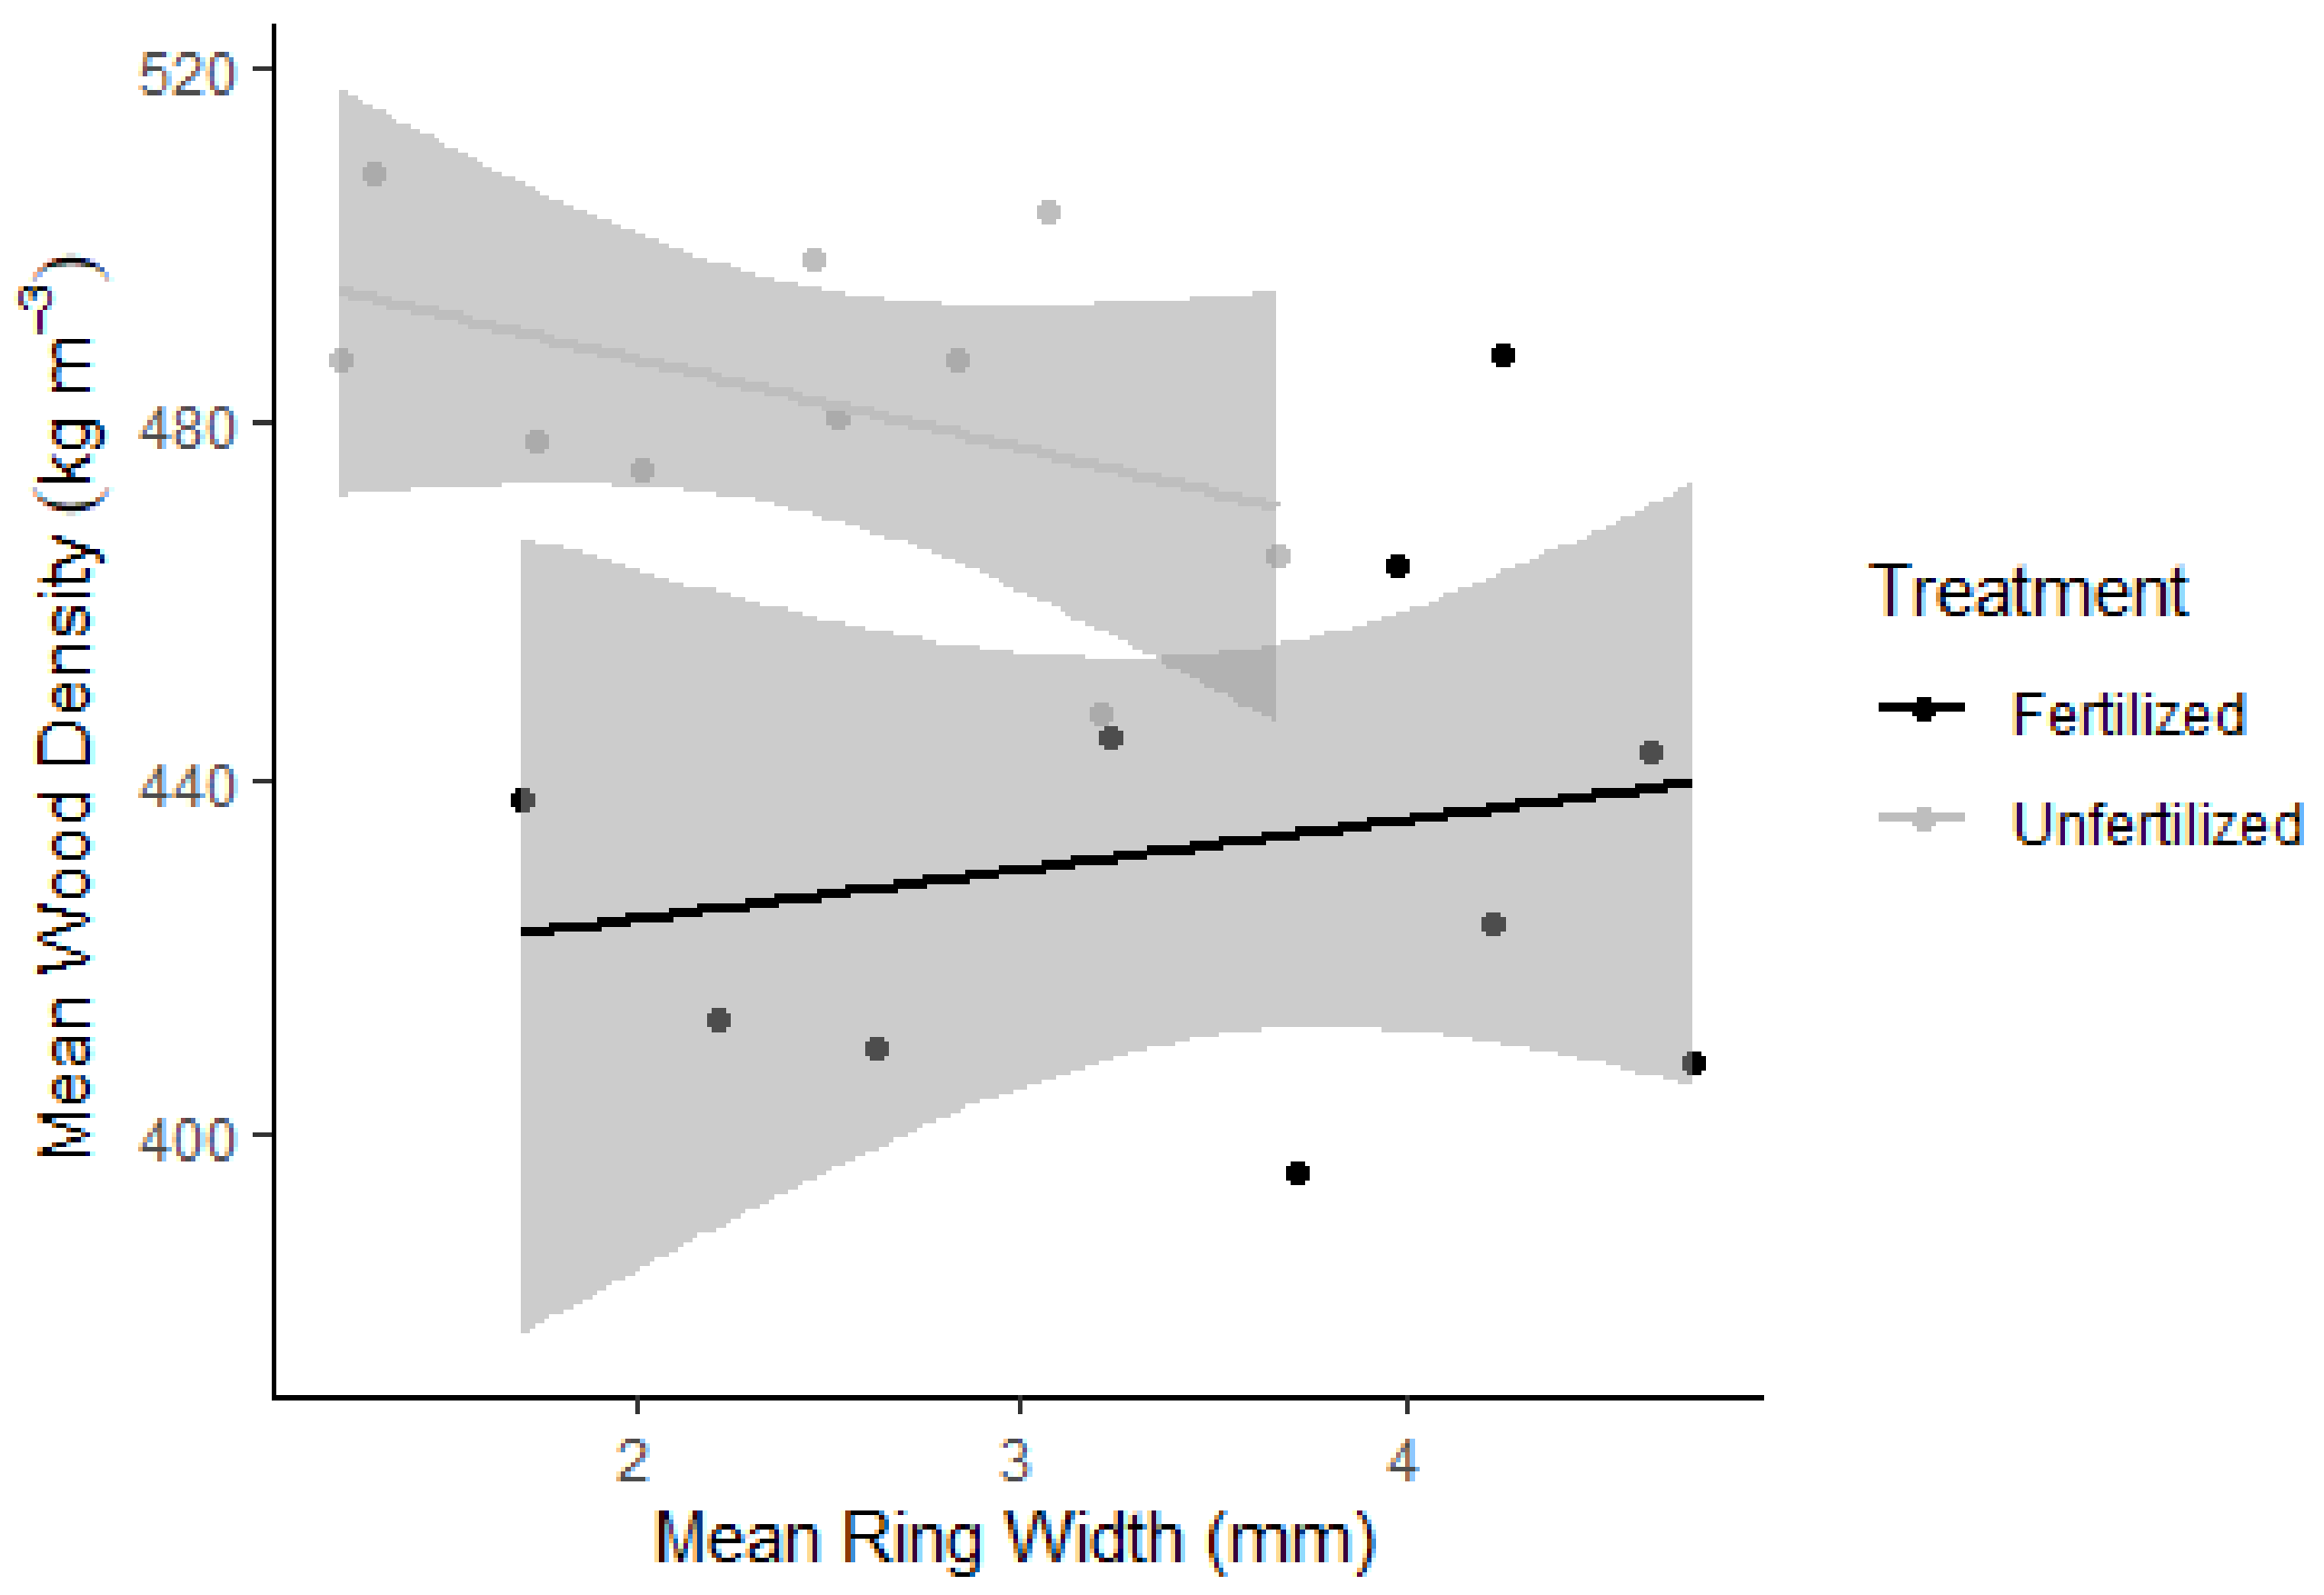
3.3. Growth Rate and Wood Density

Table 1 presents a higher whole tree mean ring width for the fertilized trees than for the unfertilized trees, 3.8 mm and 2.8 mm. The whole tree mean density was lower for the fertilized trees compared to the unfertilized trees, 420 kg m−3 and 460 kg m−3. Nonetheless, studies on specific growth rings (2015–2017) showed that wood density had no correlation between ring width in the fertilized trees or the unfertilized trees (Figure 3), where both the models had insignificant p-values. The model could, to some extent (R2 = 0.20), explain the negative correlation between density and ring width for the unfertilized trees. The model had no correlation between density and ring width for the fertilized trees (R2 = 0.04).

3.4. Model Comparisons

Models 1–3, for predicting ring average cell wall thickness (CWt), and Models 1–3, for predicting average stem density (Dens), were the models where every variable has a p-value below 0.05 (Table 4). No significant interactions were found between variables. Treatment is a factor with two levels where the baseline mean is for fertilized stems. For unfertilized stems, the coefficient for treatment is included in the model estimate, and since this is a positive coefficient, unfertilized stems will have higher model predictions when all variables are equal.
The models had close values for AIC, BIC, and LL, although generally, Mod 1 performed best (Table 5). For CWt models, there was a large difference between Mod 1 and the other models, where the ANOVA test output for Mod 1 was much lower for AIC, BIC, and LL. The best model for Dens is less clear; Mod 1 was slightly better than Mod 2 and Mod3, but the models have similar values for AIC, BIC, and LL values. The residuals were approximately normally distributed for all models. The best residual distributions were for Mod 1 for CWt and Mod 3 for Dens, although there is an obvious outlier in the Dens models’ residuals (see Appendix A, Figure A1 and Figure A2).

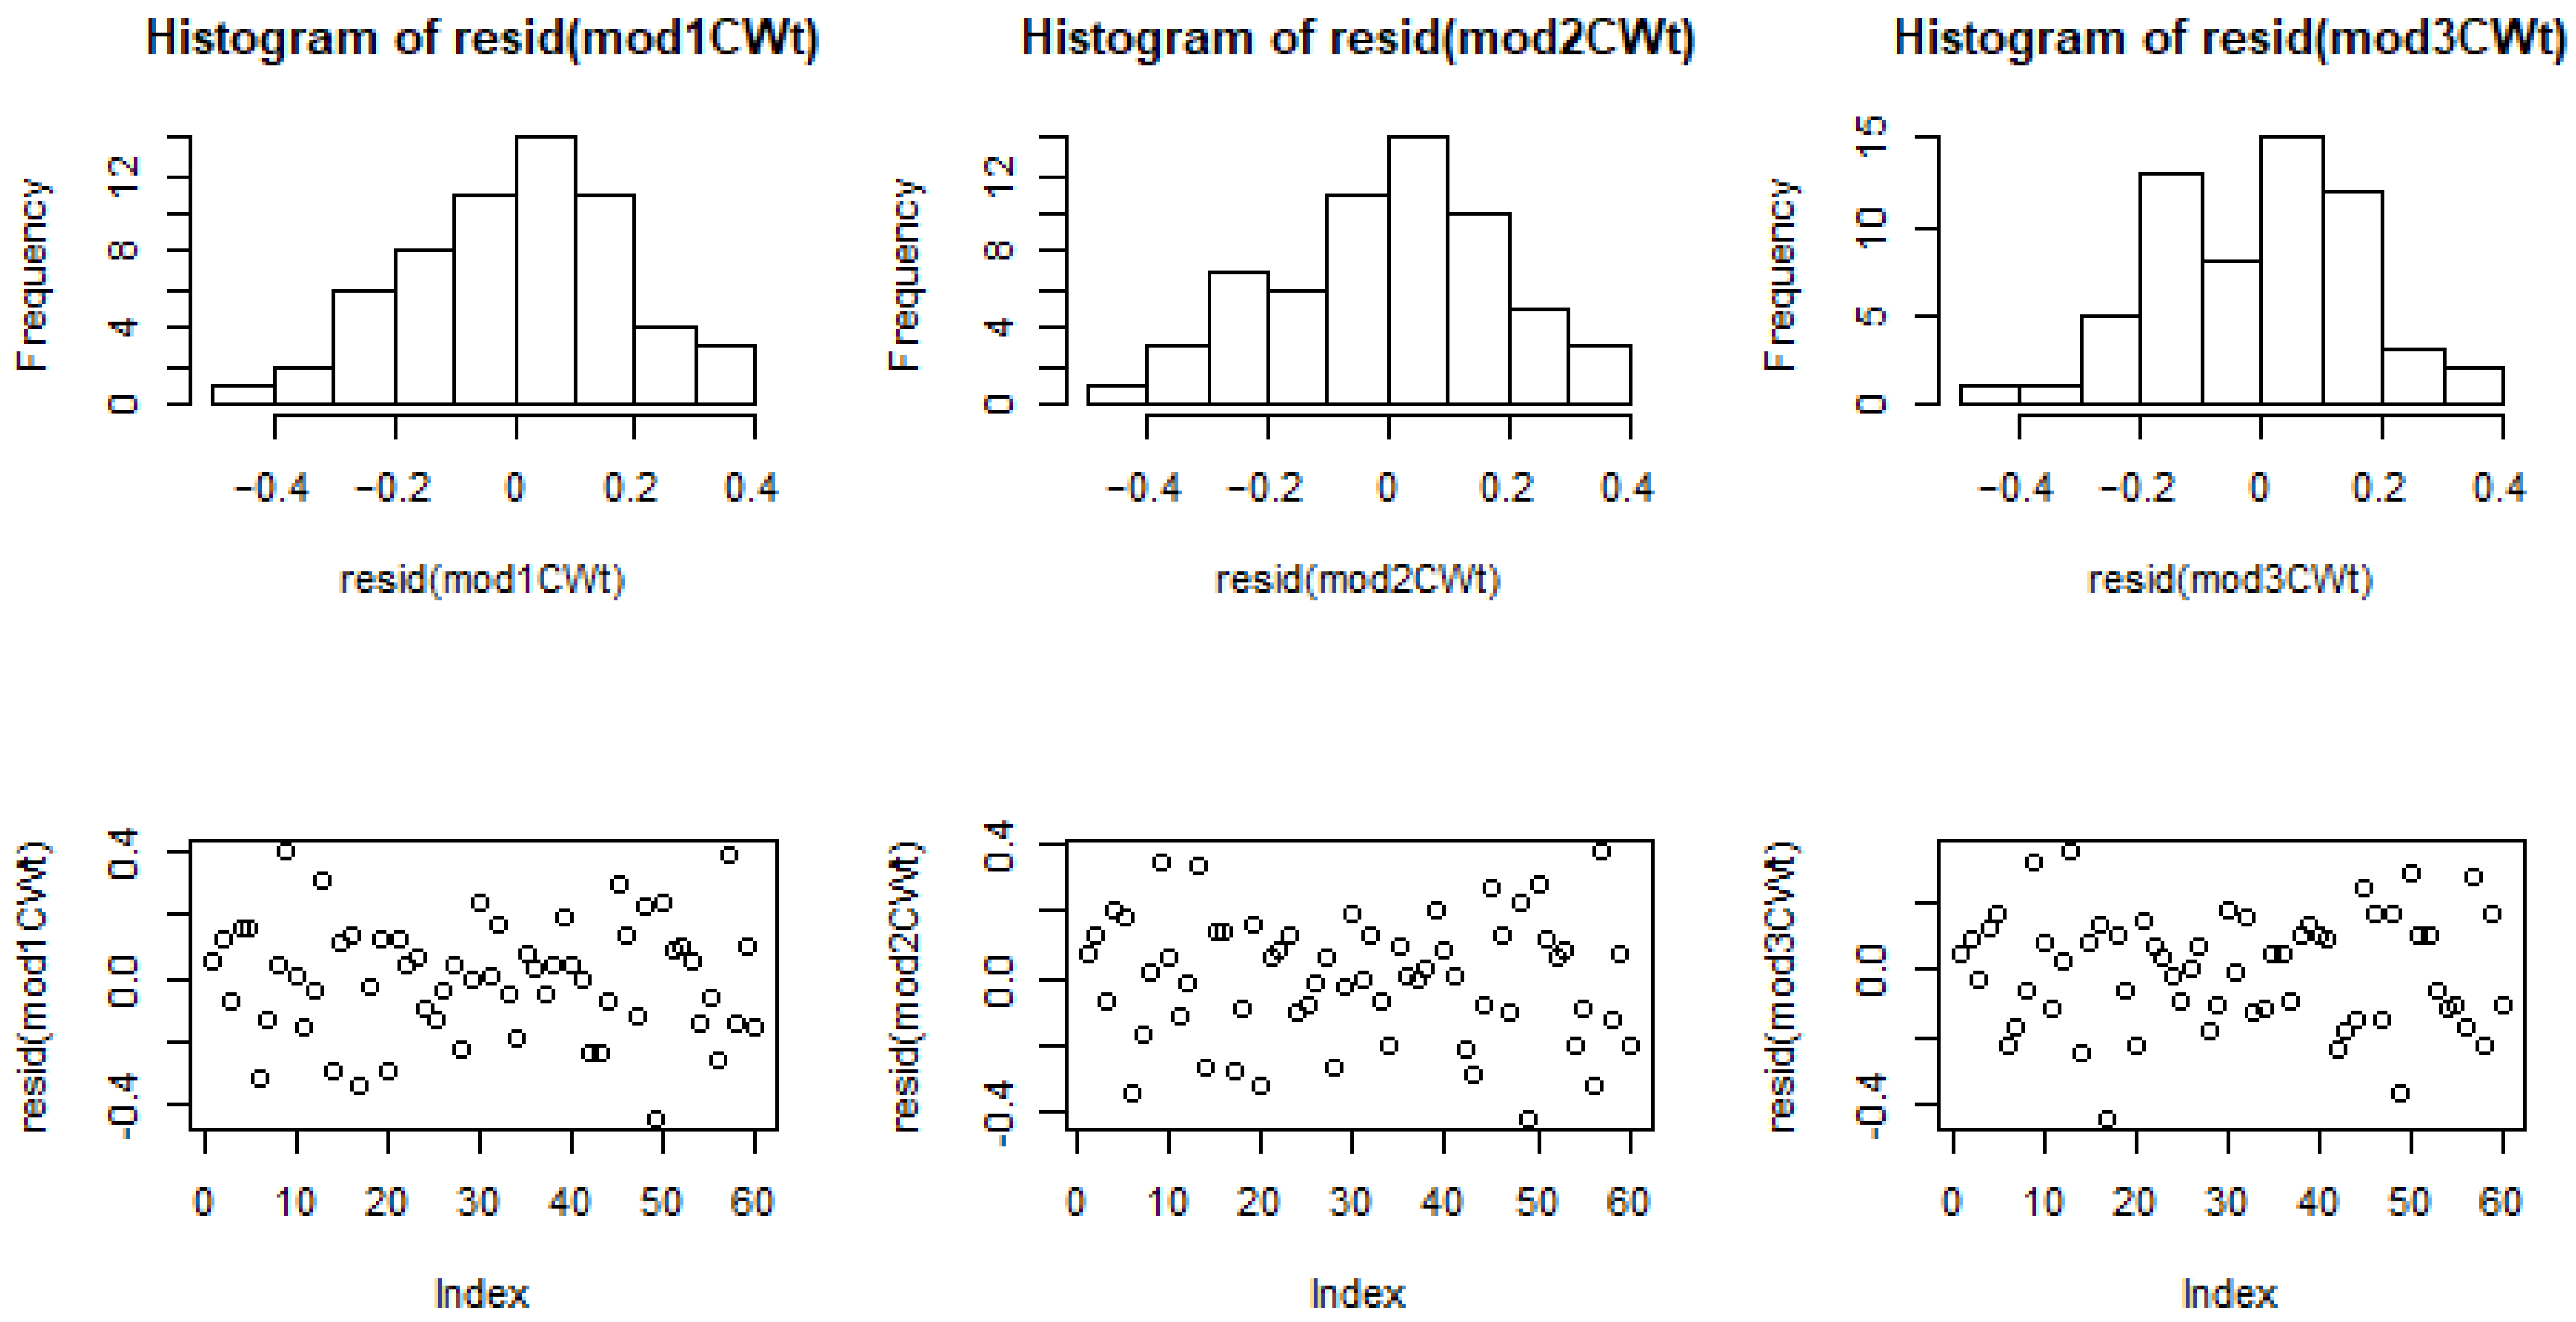
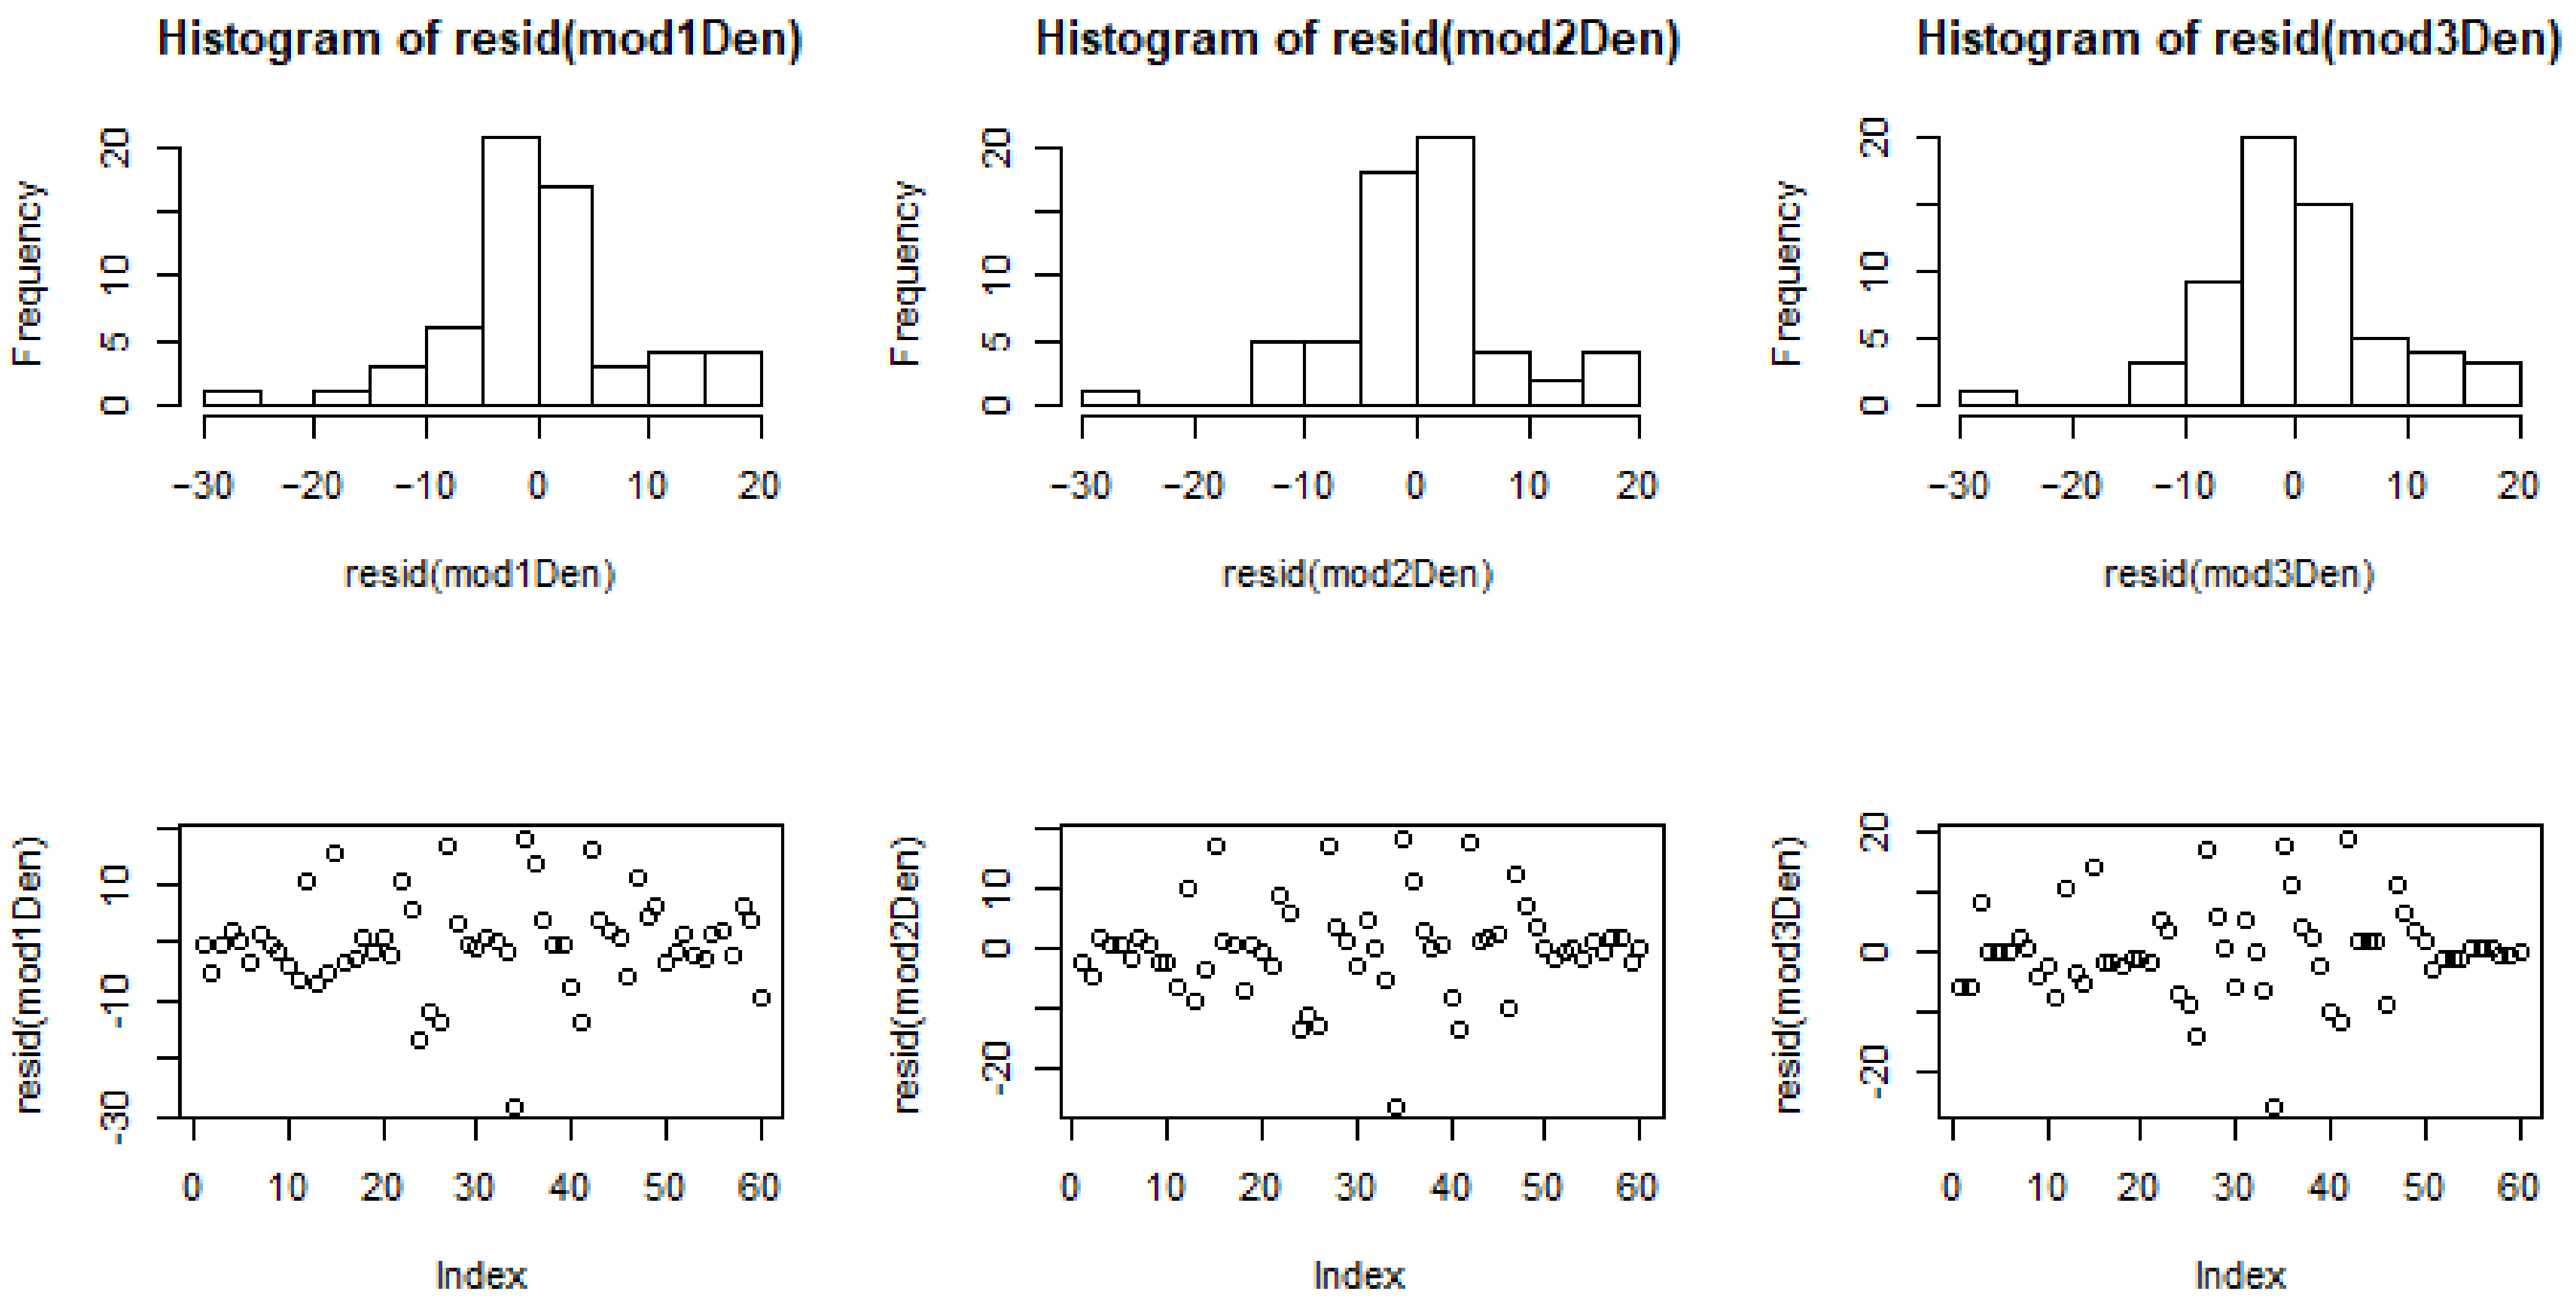
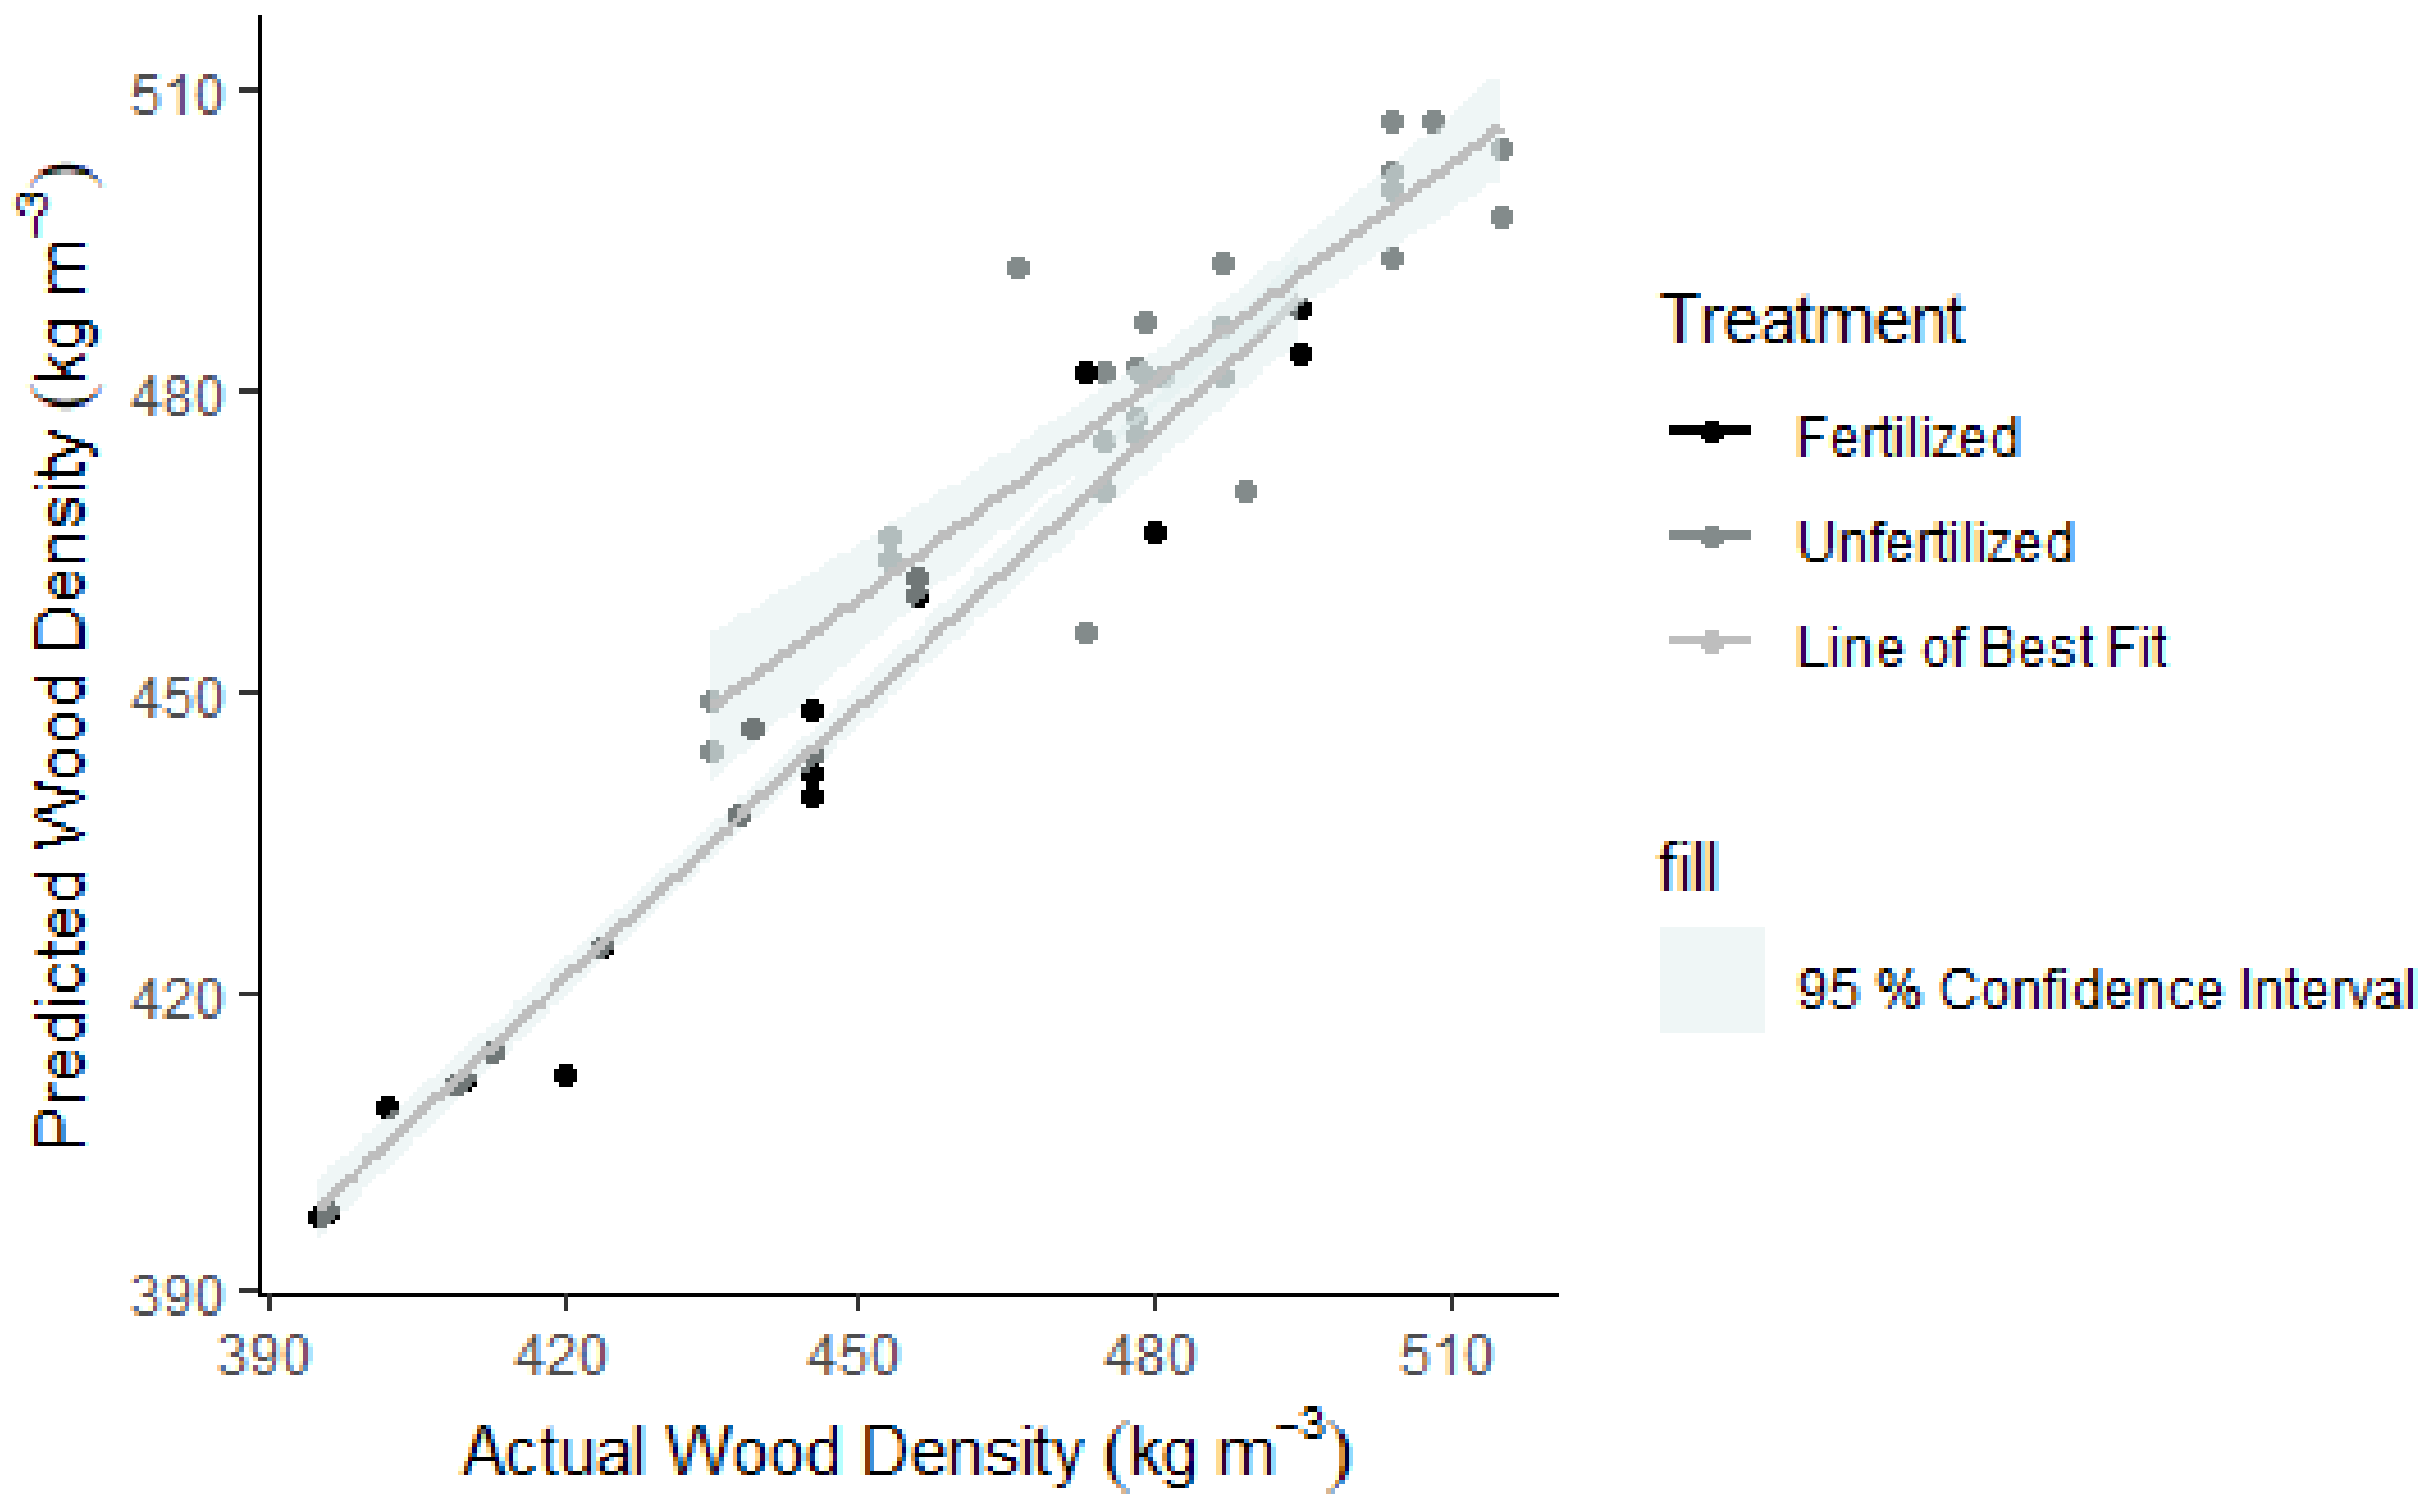
3.5. Modelling Cell Wall Thickness and Average Density

CWt Mod 1 predicts average cell wall thickness for a ring based on the treatment, DBH, vessel number, tree ID, ring age, and year of formation. Other tested variables had p-values above 0.05 in the ANOVA output, so were considered insignificant and not included in the final models. In all models, treatment was considered a significant determinant of average cell wall thickness (p < 0.05), yet no interaction effects were significant. The predicted values from this model were also regressed against the actual values in Figure 4, and the variance of the random effects tabulated (Table 6). A large proportion of the model variance was attributed to the individual tree (0.09), so the nested mixed models have accounted for this.
Dens Mod 3 predicts average tree basic density based on the treatment, the tree ID, ring age, and year of formation. A decision was made to select the model with the fewest variables as the residual distribution was improved, and including multiple variables can result in model overfitting, or artificially improved p-values. Most measured variables had p-values above 0.05 in the ANOVA output when treatment was included in the model, so these variables they were considered insignificant and excluded from the final model. Treatment should be considered a significant determinant of average tree density (p < 0.05). The predicted values from this model were also regressed against the actual values in Figure 5, and the variance of random effects tabulated (Table 6).

4. Discussion

More knowledge about juvenile wood mechanical properties is needed to better utilize material from early thinning [2,44]. Forest management activities can have both positive and negative consequences, which managers need to consider; for instance, the association between faster growth rates and reduced density [33]. Related to this is the juvenile response to fertilizer application, which is quite well understood for coniferous species’ [1,11,12]. However, little consideration is given to the fertilizer response of naturally regenerated birch, often growing in coniferous stands. Here, the results indicate how Swedish silver birch wood anatomy and density may be influenced by fertilizer, to assist managers who are considering fertilizing their mixed stands, or users of birch wood.
The results of this study suggest that fertilizing a mixed stand of silver birch can increase annual ring width. This is in line with hypothesis 1, as well as previous findings from greenhouse experiments [16,62]. Although the fertilized trees increased their basal area growth, it was only by 5% compared to the unfertilized trees (Table 3). This could be explained by the soil conditions, which were considered fertile. Therefore, it is possible that nutrients were not largely limiting growth, and that the fertilization had a less extreme effect than if applied to a nutrient-limited site [63]. This is in line with Paavilainen [13], who also encountered a weak response to fertilization of birch on a fertile site.
From the microscope analysis, it was apparent that fertilized stems had thinner cell walls, in line with hypothesis 2, and more and smaller vessels than the unfertilized stems. This supports the theory that higher nutrient availability can support more foliage, which requires a larger number of vessels to supply water to the crown, although not studied here. The differences in wood formed during the 2017 growing season between treatments are not due to differences in climate as the two sites were adjacent. The random effects in the mixed model included a term for a year, which interacted with age (Age:Year), so this model parameter would include any climate influence. Year and age accounted for a very small proportion of model variance, despite 2016 being a drier year for southern Sweden [45] and 2016 relative growth being lower than for 2014. It is likely that climate (Year) indirectly affected the modeled response variables by influencing other explanatory variables, like vessel number and ring width, or had limited influence when the effect of treatment was included in the model.
If another factor determined wood anatomy more than fertilizer status, then the unfertilized stems should have had more diameter growth in the pre-treatment years (before 2014) and would have been a similar size to the fertilized stems of the same age. The faster growth rate is associated with both younger stem vitality and as a response to fertilization. Vessel diameters were not fully studied here, yet from visual inspection, rings with more vessels tended to also have smaller vessels. This needs to be investigated further.
Regarding the variation in cell wall thickness, it was poorly explained by ring width. The initial linear model showed no correlation in the fertilized stand, but cell wall thickness was to some degree correlated to ring width for the trees from the unfertilized group. As this study was not a highly controlled laboratory experiment, it is hard to draw any direct conclusions. Density was slightly influenced by ring width, although the best fitting mixed model only included treatment. There could be a potential trade-off in the nutrient-limited stems so that an increase in ring width requires a reduction in cell wall thickness [31], which was not present in the fertilized stems.
The lowest number of vessels were found in the oldest cambial age growth rings in the unfertilized trees, and had an average value of 95 (std. dev: 28). Bhat [38] had a much lower number of vessels per mm2 of 75.2 (std. dev: 42.8) in mature silver birch, which could be explained by the difference in cambium age [64]. As the tree is growing and the distance from the pith increases, a reduction in the number of vessels, and an increase in the size of vessels, also occurs in other Betula spp. [64]. The number of vessels decreased with increasing age, so that 2017 values were lower than 2015 for both the fertilized and the unfertilized trees in this study. Although the vessels decrease in number, they increased in size, similar to the results of Fukazawa [27] in Asian Betula spp. This could be explained by the theory in Hacke et al. [65], that the fiber matrix is approximately proportional to that of the conduit system, hence the thickness of the cell wall must increase when the vessels increase in size to avoid implosion. A tree that grows more rapidly, such as the fertilized trees in this study, needs more voids according to theories of changes to the mechanical constraints in the growing tree [66,67]. Here, the best fitting model for cell wall thickness had a negative coefficient for vessel number, meaning that as the number of vessels increased, the cell wall thickness decreased.
For many species, ring width and density are negatively correlated [23], yet here this was not observed. In the simple linear fit, ring width also had lower correlations with both density and cell wall thickness for the fertilized stands, compared to the unfertilized stands. One explanation could be that the additional nutrients enabled the trees to increase growth without jeopardizing strength properties [68]. A negative correlation between ring width and wood density was also found for unfertilized juvenile silver birch in a study by Liepiòð and Rieksts-Riekstiòð [39], and in this study, the mixed models coefficient for ring width was also negative. However, since the models for average wood density as a function of ring width did not significantly improve model fit, it is likely that there are other factors that determine density. Fukazawa [27] also found growth rate had no effect on the wood density of diffuse-porous Japanese birches.
It is important to consider the effects of cambial age on stem wood density [52], as the relative fiber wall thickness increases in birch as the tree gets older [27,38]. The trees’ average density seemed to increase with increasing cambium age in Figure 2, yet including the random effect of age did not improve the predictive power of ring width or basal area in the mixed models. This indicates that once age is accounted for, growth could be increased without decreasing wood density, if conditions are improved with the addition of fertilizer. Hypothesis 3 was confirmed as a fertilizer treatment that had a negative coefficient with wood density, yet a controlled experimental site would help to remove the age effects.
The fertilized trees had a wider range of values (higher standard deviations) for most of the measured properties. This is likely due to the wider age range for the fertilized trees, 4–8 years, compared to 8–10 for the unfertilized trees. Another issue is that by selecting trees of a certain diameter class, the wider growth rings in the fertilized stems guaranteed the trees would be younger than the unfertilized trees. It is hard to remove the influence this sampling strategy had on age class distribution if the effect of fertilizer on ring width is a true effect. Naturally regenerated birch is common in Swedish forestry, but this method of establishment results in a diverse range of seedling conditions. More controlled conditions could help endorse these findings and further support the use of fertilizer to increase the growth rate of birch.
In line with other studies [69], the individual tree explained more of the model variance than age or year. Here, cell wall thickness was highly correlated with density and would result in a singular model fit if used as a predictor of density. The excluded variables, ring width, and BAyear, were not significant determinants of average cell wall thickness or stem average density, based on ANOVA output and model fit. In all models, the variable with the largest estimated coefficient was treatment. In line with this study’s hypotheses, these results indicate that a fertilizer treatment will slightly reduce the wood density and cell wall thickness, but increase the growth rate, of juvenile silver birch.

5. Conclusions

In this study concerning mixed stands of Norway spruce and birch, fertilized juvenile silver birches had increased growth ring widths and reduced density compared to unfertilized trees. The fertilized trees also had a younger cambium, thinner cell walls, and more vessels than the unfertilized stems. As these results concern only juvenile trees of natural origin, further studies are needed to generalize the results to cultivated birch trees.

Author Contributions

Conceptualization, J.A.N. and Å.B.; methodology, J.A.N., J.B. and C.H.; validation, J.A.N., J.B. and G.J.; formal analysis, J.A.N. and G.J.; investigation, C.H. and J.A.N.; resources, C.H. and Å.B.; writing—original draft preparation, J.A.N.; writing—review and editing, J.A.N., G.J., J.B., C.H. and Å.B.; visualization, J.A.N. and G.J.; supervision, Å.B. and J.B.; project administration, J.B., J.A.N. and Å.B.; funding acquisition, Å.B. and J.B. All authors have read and agreed to the published version of the manuscript.

Funding

This research was funded by The Bridge, a multidisciplinary research and education collaboration between Linnaeus University and IKEA of Sweden.

Data Availability Statement

Not applicable.

Acknowledgments

This experiment has also been possible thanks to the cooperation between Linnaeus University, Swedish University of Agricultural Sciences and Södra allowing research at the Toftaholm estate. The authors are grateful to Editors and anonymous reviewers for their useful comments and suggestions. Thanks also to Maria Ulan and Thomas Holgersson who provided assistance with setting up and interpreting the mixed models.

Conflicts of Interest

The authors declare no conflict of interest.

Appendix A

Figure A1. Residual distributions for models 1–3 for cell wall thickness (CWt).
Forests 12 00415 g0a1
Figure A2. Residual distributions for models 1–3 for density (Den).
Forests 12 00415 g0a2

References

  1. Poudel, B.C.; Sathre, R.; Bergh, J.; Gustavsson, L.; Lundström, A.; Hyvönen, R. Potential effects of intensive forestry on biomass production and total carbon balance in north-central Sweden. Environ. Sci. Policy 2012, 15, 106–124. [Google Scholar] [CrossRef]
  2. Heräjärvi, H.; Jouhiaho, A.; Tammiruusu, V.; Verkasalo, E. Small-diameter Scots Pine and Birch timber as raw materials for engineered wood products. Int. J. For. Eng. 2004, 15, 23–34. [Google Scholar] [CrossRef]
  3. Nohrstedt, H.-Ö. Response of coniferous forest ecosystems on mineral soils to nutrient additions: A review of Swedish experiences. Scand. J. For. Res. 2001, 16, 555–573. [Google Scholar] [CrossRef]
  4. Jacobson, S.; Pettersson, F. Growth responses following nitrogen and NPK Mg additions to previously N-fertilized Scots pine and Norway spruce stands on mineral soils in Sweden. Can. J. For. Res. 2001, 31, 899–909. [Google Scholar]
  5. Bergh, J.; Nilsson, U.; Grip, H.; Hedwall, P.-O.; Lundmark, T. Effects of frequency of fertilisation on production, foliar chemistry and nutrient leaching in young Norway spruce stands in Sweden. Silva Fenn. 2008, 42, 721–733. [Google Scholar] [CrossRef] [Green Version]
  6. Vadeboncoeur, M.A. Meta-analysis of fertilization experiments indicates multiple limiting nutrients in northeastern deciduous forests. Can. J. For. Res. 2010, 40, 1766–1780. [Google Scholar] [CrossRef] [Green Version]
  7. Muukkonen, P.; Lehtonen, A. Needle and branch biomass turnover rates of Norway spruce (Picea abies). Can. J. For. Res. 2004, 34, 2517–2527. [Google Scholar] [CrossRef]
  8. Kouki, J.; Tatu, H. Long-Term Needle Litterfall of a Scots Pine Pinus sylvestris Stand: Relation to Temperature Factors. Oecologia 1992, 89, 176–181. [Google Scholar] [CrossRef] [PubMed]
  9. Bergh, J.; Linder, S.; Lundmark, T.; Elfving, B. The effect of water and nutrient availability on the productivity of Norway spruce in northern and southern Sweden. For. Ecol. Manag. 1999, 119, 51–62. [Google Scholar] [CrossRef]
  10. Landsberg, J.; Sands, P. Physiological Ecology of Forest Production: Principles, Processes and Models; Elsevier Academic Press: Amsterdam, The Netherlands, 2011. [Google Scholar]
  11. Lundmark, T.; Bergh, J.; Hofer, P.; Lundstrom, A.; Nordin, A.; Poudel, B.C.; Sathre, R.; Taverna, R.; Werner, F. Potential Roles of Swedish Forestry in the Context of Climate Change Mitigation. Forests 2014, 5, 557–578. [Google Scholar] [CrossRef]
  12. Bergh, J. Climatic and Nutritional Constraints to Productivity in Norway Spruce; Swedish University of Agricultural Sciences: Uppsala, Sweden, 1997. [Google Scholar]
  13. Paavilainen, E. Effect of Refertilization of Pine and Birch Stands on a Drained Fertile Mire; Silva Fennica: Helsinki, Finland, 1990; Volume 24. [Google Scholar] [CrossRef] [Green Version]
  14. Hoyle, M.C.; Bjorkbom, J.C. Birch nutrition. In Proceedings of the Birch Symposium, Durham, NH, USA, 19–21 August 1969; Doolittle, W.T., Bruns, P.E., Eds.; US Department of Agriculture, Forest Service, Northeastern Forest Experiment Station: Upper Darby, PA, USA, 1969; pp. 102–105. [Google Scholar]
  15. Viro, P.J. Fertilization of Birch. Commun. Inst. For. Fenn. 1974, 81, 1–38. [Google Scholar]
  16. Moilanen, M. Lannoituksen ja Harvennuksen Vaikutus Hieskoivun Kasvuun Ohutturpeisilla Ojitetuilla rämeillä. Commun. Inst. For. Fenn. 1985, 629, 1–29, (In Finnish with English Summary). [Google Scholar]
  17. Kaunisto, S. Lannoituksen ja Muokkauksen Vaikutus Männyn ja Rauduskoivun Istutustaimien Kasvuun Suonpohjilla. Commun. Inst. For. Fenn. 1987, 681, 1–23, (In Finnish with English Summary). [Google Scholar]
  18. Sellin, A.; Rohejärv, A.; Rahi, M. Distribution of vessel size, vessel density and xylem conducting efficiency within a crown of silver birch (Betula pendula). Trees 2008, 22, 205–216. [Google Scholar] [CrossRef]
  19. Zobel, B.J.; van Buijtenen, J.P. Wood Variation: Its Causes and Control; Springer: Berlin/Heidelberg, Germany, 1989. [Google Scholar]
  20. Dinwoodie, J.M. Timber, Its Nature and Behaviour; E & FN Spon: London, UK, 2000. [Google Scholar]
  21. Moore, J.R.; Cown, D.J. Corewood (Juvenile Wood) and Its Impact on Wood Utilisation. Curr. For. Rep. 2017, 3, 107–118. [Google Scholar] [CrossRef]
  22. Biondi, F.; Qeadan, F. A Theory-Driven Approach to Tree-Ring Standardization: Defining the Biological Trend from Expected Basal Area Increment. Tree Ring Res. 2008, 64, 81–96. [Google Scholar] [CrossRef] [Green Version]
  23. Kollmann, F.F.P.; Côté, W.A. Principles of Wood Science and Technology; Springer: Berlin/Heidelberg, Germany, 1968. [Google Scholar]
  24. Funada, R.; Yamagishi, Y.; Begum, S.; Kudo, K.; Nabeshima, E.; Nugroho, W.D.; Hasnat, R.; Oribe, Y.; Nakaba, S. Xylogenesis in trees: From cambial cell division to cell death. In Secondary Xylem Biology; Elsevier: Amsterdam, The Netherlands, 2016; pp. 25–43. [Google Scholar]
  25. Panshin, A.J.; De Zeeuw, C. Textbook of Wood Technology: Structure, Identification, Properties and Uses of the Commercial Woods of the United States and Canada; McGraw-Hill: New York, NY, USA, 1980. [Google Scholar]
  26. Saranpää, P. Wood density and growth. In Wood Quality and Its Biological Basis; Barnett, J.R., Jeronimidis, G., Eds.; Blackwell Publishing: Oxford, UK, 2003; Volume 87. [Google Scholar]
  27. Fukazawa, K. Juvenile wood of hardwoods judged by density variation. IAWA J. 1984, 5, 65–73. [Google Scholar] [CrossRef]
  28. Pompa-García, M.; Venegas-González, A. Temporal Variation of Wood Density and Carbon in Two Elevational Sites of Pinus cooperi in Relation to Climate Response in Northern Mexico. PLoS ONE 2016, 11, e0156782. [Google Scholar] [CrossRef]
  29. Sjökvist, T.; Niklewski, J.; Blom, Å. Effect of wood density and cracks on the moisture content of coated Norway spruce (Picea abies (L.) Karst.). Wood Fiber Sci. 2019, 51, 160–172. [Google Scholar] [CrossRef]
  30. Lundgren, C.J.S.F. Cell wall thickness and tangential and radial cell diameter of fertilized and irrigated Norway spruce. Silva Fenn. 2004, 38, 95–106. [Google Scholar] [CrossRef] [Green Version]
  31. Cuny, H.E.; Rathgeber, C.B.; Frank, D.; Fonti, P.; Fournier, M. Kinetics of tracheid development explain conifer tree-ring structure. New Phytol. 2014, 203, 1231–1241. [Google Scholar] [CrossRef]
  32. Hoadley, R.B. Identifying Wood: Accurate Results with Simple Tools; Taunton: Newtown, CT, USA, 1990. [Google Scholar]
  33. Pretzsch, H.; Biber, P.; Schütze, G.; Kemmerer, J.; Uhl, E. Wood density reduced while wood volume growth accelerated in Central European forests since 1870. For. Ecol. Manag. 2018, 429, 589–616. [Google Scholar] [CrossRef]
  34. Peters, R.L.; von Arx, G.; Nievergelt, D.; Ibrom, A.; Stillhard, J.; Trotsiuk, V.; Mazurkiewicz, A.; Babst, F. Axial changes in wood functional traits have limited net effects on stem biomass increment in European beech (Fagus sylvatica). Tree Physiol. 2020, 40, 498–510. [Google Scholar] [CrossRef] [PubMed]
  35. Ollinmaa, P.J. Eräistä ojitetuilla soilla kasvavan puun fysikaalisista ominaisuuksista. Acta For. Fenn. 1960, 72, 1–24, (In Finnish with English summary). [Google Scholar] [CrossRef] [Green Version]
  36. Loustarinen, K.; Verkasalo, E. Birch as sawn timber and in mechanical further processing in Finland. A literature Study. Silva Fenn. 2000, 1, 40. [Google Scholar]
  37. Velling, P. Wood density in two Betula pendula Roth. Progeny trials. Folia For. 1979, 416, 1–24. [Google Scholar]
  38. Bhat, K.M. Variation in structure and selected properties of finnish birch wood: I. Interrelationships of some structural features, basic density and shrinkage. Silva Fenn. 1980, 14, 384–396. [Google Scholar] [CrossRef]
  39. Liepiòð, K.; Rieksts-Riekstiòð, J. Stemwood Density of Juvenile Silver Birch Trees (Betula pendula Roth.) From Plantations on Former Farmlands. Balt. For. 2013, 19, 179–186. [Google Scholar]
  40. Heräjärvi, H. Properties of Birch (Betula Pendula, B. Pubescens) for Sawmilling and Further Processing in Finland. Ph.D. Thesis, Finnish Forest Research Institute, Joensuu Research Centre, Joensuu, Finland, 2002. [Google Scholar]
  41. Hakkila, P. Investigations on the Basic Density of Finnish Pine, Spruce and Birch Wood. Commun. Inst. For. Fenn. 1966, 61, 1–98. [Google Scholar]
  42. Liepiņš, R. Die Technischen Eigenschaften der Birke Lettlands; Finska forstsamfundet, Commentationes Forestalis: Helsinki, Finland, 1933; pp. 1–15. [Google Scholar]
  43. Hynynen, J.; Niemistö, P.; Viherä-Aarnio, A.; Brunner, A.; Hein, S.; Velling, P. Silviculture of birch (Betula pendula Roth. and Betula pubescens Ehrh.) in northern Europe. Forestry 2010, 83, 103–119. [Google Scholar] [CrossRef]
  44. Dubois, H.; Verkasalo, E.; Claessens, H. Potential of Birch (Betula pendula Roth. and B. pubescens Ehrh.) for Forestry and Forest-Based Industry Sector within the Changing Climatic and Socio-Economic Context of Western Europe. Forests 2020, 11, 336. [Google Scholar] [CrossRef] [Green Version]
  45. SMHI. Swedish Meteorological and Hydrological Institute. Available online: http://www.smhi.se/klimatdata/meteorologi/nederbord (accessed on 5 July 2018).
  46. Hägglund, B.; Lundmark, J.-E. Site Index Estimation by Means of Site Properties; Studia Forestalia Suecica: Stockholm, Sweden, 1977; pp. 1–34. [Google Scholar]
  47. Linder, S. Foliar Analysis for Detecting and Correcting Nutrient Imbalances in Norway Spruce. Ecol. Bull. 1995, 44, 178–190. [Google Scholar]
  48. Ericsson, T.; Kähr, M. Growth and nutrition of birch seedlings in relation to potassium supply rate. Trees 1993, 7, 78–85. [Google Scholar] [CrossRef]
  49. Linder, S. Nutritional control of forest yield. In Proceedings of the Marcus Wallenberg Foundation Symposia, Saltsjöbaden, Sweden, 9–13 August 1977. [Google Scholar]
  50. Brække, F.H. Diagnostiske Grenseverdier for Naeringselementer i Gran-Og Furunaaler; Aktuelt fra Skogforsk Nr.: Ås, Norway, 1994; pp. 15–94. (In Norwegian) [Google Scholar]
  51. Bonham, V.; Barnett, J. Fibre length and microfibril angle in silver birch (Betula pendula Roth.). Holzforschung 2001, 55, 159–162. [Google Scholar] [CrossRef]
  52. Dobrowolska, E.; Wroniszewska, P.; Jankowska, A. Density Distribution in Wood of European Birch (Betula pendula Roth.). Forests 2020, 11, 445. [Google Scholar] [CrossRef] [Green Version]
  53. Zobel, B.J.; Jett, J.B. Genetics of Wood Production; Springer: Berlin/Heidelberg, Germany, 1995. [Google Scholar]
  54. Siau, J.F. Wood: Influence of Moisture on Physical Properties; Deptartment of Wood Science and Forest Products, Virginia Polytechnic Institute and State University: Blacksburg, VA, USA, 1995. [Google Scholar]
  55. Von Arx, G.; Crivellaro, A.; Prendin, A.L.; Čufar, K.; Carrer, M. Quantitative Wood Anatomy-Practical Guidelines. Front. Plant Sci. 2016, 7, 781. [Google Scholar] [CrossRef] [PubMed] [Green Version]
  56. Gärtner, H.; Nievergelt, D. The core-microtome: A new tool for surface preparation on cores and time series analysis of varying cell parameters. Dendrochronologia 2010, 28, 85–92. [Google Scholar] [CrossRef]
  57. Fujii, T. Application of the “NT-cutter” knife blade to microtome sectioning of wood. IAWA J. 2003, 24, 241–245. [Google Scholar] [CrossRef] [Green Version]
  58. Ahmed, S.A.; Morén, T.; Hagman, O.; Cloutier, A.; Fang, C.-H.; Elustondo, D. Anatomical properties and process parameters affecting blister/blow formation in densified European aspen and downy birch sapwood boards by thermo-hygro-mechanical compression. J. Mater. Sci. 2013, 48, 8571–8579. [Google Scholar] [CrossRef]
  59. Tng, D.Y.P.; Apgaua, D.M.G.; Ishida, Y.F.; Mencuccini, M.; Lloyd, J.; Laurance, W.F.; Laurance, S.G.W. Rainforest trees respond to drought by modifying their hydraulic architecture. Ecol. Evol. 2018, 8, 12479–12491. [Google Scholar] [CrossRef] [Green Version]
  60. Luostarinen, K.; Möttönen, V. Radial variation in the anatomy of Betula pendula wood from different growing sites. Balt. For. 2010, 16, 209–316. [Google Scholar]
  61. James, G.; Witten, D.; Hastie, T.; Tibshirani, R. An Introduction to Statistical Learning; Springer: Berlin/Heidelberg, Germany, 2013; Volume 112. [Google Scholar]
  62. Mutikainen, P.; Walls, M.; Ovaska, J.; Keinanen, M.; Julkunen-Tiitto, R.; Vapaavuori, E. Herbivore Resistance in Betula pendula: Effect of Fertilization, Defoliation, and Plant Genotype. Ecology 2000, 81, 49–65. [Google Scholar] [CrossRef]
  63. Lumme, I. Early effects of peat ash on growth and mineral nutrition of the silver birch (Betula pendula) on a mined peatland. Silva Fenn. 1988, 22, 5344. [Google Scholar] [CrossRef] [Green Version]
  64. Han, C.-S. Study on the Radial Variation of Structural Element in the Diffuse-Porous Woods. J. Korean Wood Sci. Technol. 1987, 15, 26–52. [Google Scholar]
  65. Hacke, U.G.; Sperry, J.S.; Pockman, W.T.; Davis, S.D.; McCulloh, K.A.J.O. Trends in wood density and structure are linked to prevention of xylem implosion by negative pressure. Oecologia 2001, 126, 457–461. [Google Scholar] [CrossRef]
  66. Schniewind, A.P. Horizontal specific gravity variation in tree stems in relation to their support function. For. Sci. 1962, 8, 111–118. [Google Scholar]
  67. Woodcock, D.; Shier, A. Wood specific gravity and its radial variations: The many ways to make a tree. Trees 2002, 16, 437–443. [Google Scholar] [CrossRef]
  68. Dunham, R.; Cameron, A.; Petty, J. The effect of growth rate on the strength properties of sawn beams of silver birch (Betula pendula Roth.). Scand. J. For. Res. 1999, 14, 18–26. [Google Scholar] [CrossRef]
  69. Bouriaud, O.; Breda, N.; Le Moguedec, G.; Nepveu, G. Modelling variability of wood density in beech as affected by ring age, radial growth and climate. Trees 2004, 18, 264–276. [Google Scholar] [CrossRef]
Figure 1. Mean double cell wall thickness correlation to average ring width for 2015–2017 for the fertilized (black) and the unfertilized (grey) groups. Linear trend lines have shaded 95% confidence intervals.
Forests 12 00415 g001
Figure 2. Mean wood density (for 2015–2017) plotted against the 2017 cambial age for the fertilized and unfertilized trees.
Forests 12 00415 g002
Figure 3. Mean wood density against mean ring width for 2015–2017 for the fertilized (black) and the unfertilized (grey) groups. Linear trend lines have shaded 95% confidence intervals.
Forests 12 00415 g003
Figure 4. Linear regression line (grey) for predicted against actual cell wall thickness (CWt) with a 95% confidence interval (highlighted region). Points are black (fertilized) or grey (unfertilized), depending on the treatment type.
Forests 12 00415 g004
Figure 5. Linear regression line (grey) for predicted against actual density values with a 95% confidence interval (highlighted region). Points are black (fertilized) or grey (unfertilized), depending on the treatment type.
Forests 12 00415 g005
Table 1. Characteristics of the two group’s trees, fertilized and unfertilized (n: 10 for each group).
FertilizedUnfertilized
MeanMinMaxMeanMinMax
Diameter 1 (mm)533179603383
Height (m)5.83.38.26.84.78.3
Number of growth rings6.44.08.08.98.010.0
Whole tree mean ring width 2 (mm)3.82.66.82.81.54.0
Whole tree mean density (kg m−3)420390470460430490
1 fresh stem diameter including bark; 2 measured on microscope slide excluding bark.
Table 2. Mean values and standard deviation (Std. Dev) are presented for three years. Measurements per group are n = 10 (ring width and basal area), n = 1500 (cell wall thickness), and n = 50 (vessels).
FertilizedUnfertlized
YearMeanStd. DevMeanStd. Dev
Ring width (mm)20153.51.42.50.7
20163.31.02.20.9
20173.81.92.51.1
Basal Area Increment (mm2)2015433355392212
2016438230401243
2017614408492297
Cell wall thickness (µm)20154.50.95.10.9
20164.31.05.30.9
20174.70.95.40.9
Vessels (No mm−2)20151405412020
20161434212131
2017102299928
Table 3. Growth ring width for the two years of fertilization, 2014 and 2016, given as a ratio of average growth ring width before treatment (2010–2013). Mean values and standard deviation are presented for n = 7 for the fertilized and n = 10 for the unfertilized as trees younger than two years at the time of fertilization were not included.
FertilizedUnfertilized
MeanStd. DevMeanStd. Dev
Growth before treatment (mm year−1)1.70.72.40.7
Relative growth year—2014 (%)4.01.51.40.4
Relative growth year—2016 (%)2.10.81.00.3
Increase in basal area since treatment (%)7.33.52.10.6
Table 4. Model names (Mod 1–3), intercepts, and fixed effects with summary output for coefficients (estimates) and p-values. Variables are all significant at the level α = 0.05 based on p-values.
CWt (µm)Dens (kg m−3)
ModelVariableEstimatesp-ValueVariableEstimatesp-Value
Mod 1Intercept4.28<0.0001Intercept432.83<0.0001
Vessel Number−0.010.0269Ring width−7.440.0164
DBH0.110.0175BAyear0.050.0019
Treatment0.650.0005Treatment45.520.0002
Mod 2Intercept5.04<0.0001Intercept424.40<0.0001
Vessel Number−0.020.0013BAyear0.020.0654
Treatment0.700.0007Treatment51.460.0001
Mod 3Intercept4.46<0.0001Intercept432.50<0.0001
Treatment0.780.0012Treatment50.340.0002
Table 5. Model names (Mod 1–3) and Anova output for two-way analysis.
CWt (µm)Dens (kg m−3)
ANOVA ValueMod 1Mod 2Mod 3Mod 1Mod 2Mod 3
AIC46.9651.7059.36510.71514.36515.72
BIC61.6264.2769.84525.37526.93526.19
LL−16.48−19.85−24.68−248.35−251.18−252.86
Table 6. Model names (CWt Mod 1 and Dens Mod3) and random effects.
CWt Mod 1Dens Mod 3
Random EffectVarianceStandard DeviationVarianceStandard Deviation
Age:Year0.010.1121.384.62
Tree0.090.30523.5422.88
Residual0.050.3095.909.79
Publisher’s Note: MDPI stays neutral with regard to jurisdictional claims in published maps and institutional affiliations.

