Article

Assessing Landsat Images Availability and Its Effects on Phenological Metrics

by
Jean-François Mas
1,* and
Francisca Soares de Araújo
2
1
Laboratorio de análisis espacial, Centro de Investigaciones en Geografía Ambiental, Universidad Nacional Autónoma de México (UNAM), Morelia, 58090 Michoacán, Mexico
2
Centro de Ciências, Departamento de Biologia, Universidade Federal do Ceará, Fortaleza 60440-900, Brazil
*
Author to whom correspondence should be addressed.
Forests 2021, 12(5), 574; https://doi.org/10.3390/f12050574
Submission received: 3 January 2021 / Revised: 16 February 2021 / Accepted: 18 February 2021 / Published: 3 May 2021

Abstract

:
Landsat imagery offers the most extended continuous land surface observation at 30 m spatial resolution and is widely used in land change studies. On the other hand, the recent developments on big data, such as cloud computing, give new opportunities for carrying out satellite-based continuous land cover monitoring including land use/cover change and more subtle changes as forest degradation, agriculture intensification and vegetation phenological patterns alterations. However, in the range 0–10 south latitude, especially in the summer and autumn, there is a high rainfall and high clouds presence. We hypothesise that it will be challenging to characterise vegetation phenology in regions where the number of valid (cloud-free) remotely-sensed observation is low or when the observations are unevenly distributed over the year. This paper aims to evaluate whether there is sufficient availability of Landsat 7 and 8 images over Brazil to support the analysis of phenodynamics of vegetation. We used Google Earth Engine to assess Landsat data availability during the last decades over the Brazilian territory. The valid observations (excluding clouds and shadow areas) from Landsat 4/5/7/8 during the period 1984–2017 were determined at pixel level. The results show a lower intensity of Landsat observations in the northern and northeastern parts of Brazil compared to the southern region, mainly due to clouds’ presence. Taking advantage of the overlapping areas between satellite paths where the number of observations is larger, we modelled the loss of information caused by a lower number of valid (cloud free) observations. We showed that, in the deciduous woody formations of the Caatinga dominium, the scarcity of valid observations has an adverse effect on indices’ performance aimed at describing vegetation phenology. However, the combination of Landsat data with satellite constellation such as Sentinel will likely permit to overcome many of these limitations.

1. Introduction

In the context of global change, information on the magnitude and spatio-temporal patterns of land changes is needed to assess the relationships between changes, their causes and consequences. Remote sensing is a cheap and efficient tool to obtain consistent information about the spatio-temporal land cover dynamics. Change detection techniques were usually based on the comparison between images acquired in different years to depict land cover changes as deforestation [1,2,3]. With the advent of Sentinel-2 and Landsat constellations, dense optical satellite image time series, with a high spatial resolution, are available nowadays. Time series of remotely sensed data, particularly vegetation indices, are valuable data sets in many Earth science fields. Atzberger et al. [4] reported nine essential applications based on time series of vegetation indices including vegetation dynamics, environmental monitoring and climate change, mapping, biodiversity, yield production estimates, drought monitoring, land change detection and vegetation’s biophysical variables retrieval. Recently, studies that analyze dynamic phenomena such as vegetation phenology use a large number of intra-annual observations [5,6,7]. The seasonal pattern of the variation in reflectance of vegetated land surfaces observed from remote sensing is called land surface phenology and reflects vegetation’s response to changes in the climate and hydrologic cycle [8,9]. For instance, the seasonal variation in vegetation greenness described by vegetation indices’ temporal dynamics proved to be useful for vegetation types and tree species mapping [10,11,12,13]. Moreover, the greenness curve analysis allows computing phenological metrics that describe annual dynamics of the vegetation and can be related to plants productivity and aboveground carbon stored in vegetation [14]. Phenology is also essential for understanding ecosystems’ responses and feedback to the climate system and is a reliable bioindicator of climate change [15,16,17].
Landsat and Copernicus (Sentinel) are two critical remote sensing programs because they freely provide multi-spectral images with a relatively high spatial resolution (10 to 60 m). The Landsat program started in 1972 and allowed the acquisition of millions of images. The data acquired from the Landsat 4 satellite (1982) have improved spatial resolution (30 m) and a 16-day temporal resolution. Landsat imagery has been widely used in land change assessment [18,19]. Currently, two satellites, Landsat 7 and 8, are in operation. The Sentinel-2 mission consists of a constellation of two identical satellites (Sentinel-2A and Sentinel-2B) launched, respectively, in 2015 and 2017 [20].
Although the temporal resolution from Landsat 4 onwards is sixteen days and Sentinel-2 constellation is five days at the equator, the spatio-temporal availability of these images is not homogeneous due to acquisition policies and atmospheric conditions (presence of clouds). It is worth noting that in the range 0 –10 south latitude, especially in the summer and autumn, there is a high rainfall and high clouds presence [21]. In a previous study, we assessed the availability of Landsat images during the period 1984–2019 and found that the number of valid data was low in some Brazilian biomes such Amazonia (tropical rain forests) and Caatinga (mosaic deciduous woody formations) due to clouds presence [22].
This study aims to evaluate the availability of Landsat 7 and 8 images over the Brazilian territory, seeking to verify whether there is sufficient availability to support studies of the analysis of phenodynamics of vegetation. We hypothesise that it will be challenging to characterise vegetation phenology in regions where the number of valid (cloud-free) remotely-sensed observation is low or when the observations are unevenly distributed over the year.
This paper is organised as follows. Section 2 describes the materials and the methods to map Landsat imagery availability and the modelling of the effect of valid observations scarcity on phenological metrics estimation. Section 3 presents (i) the Spatio-temporal patterns of image availability at the national level and for an area of the Brazilian Northeast semi-arid and, (ii) the uncertainty of phenological metrics related with the different patterns of availability in the semi-arid area. We discuss the impacts of remotely-sensed observation scarcity on land studies in Section 4. Finally, Section 5 presents our conclusions.

2. Materials and Methods

A survey of available Landsat 7 and 8 surface reflectance data for Brazil was carried out using the cloud computing platform Google Earth Engine (GEE) because it possesses a public data archive including all available Landsat and Sentinel imagery and allows parallel processing [23,24,25,26]. GEE has been used successfully used to carry out remote sensing-based studies over huge areas at the global level [19,27] and national level [28,29,30].
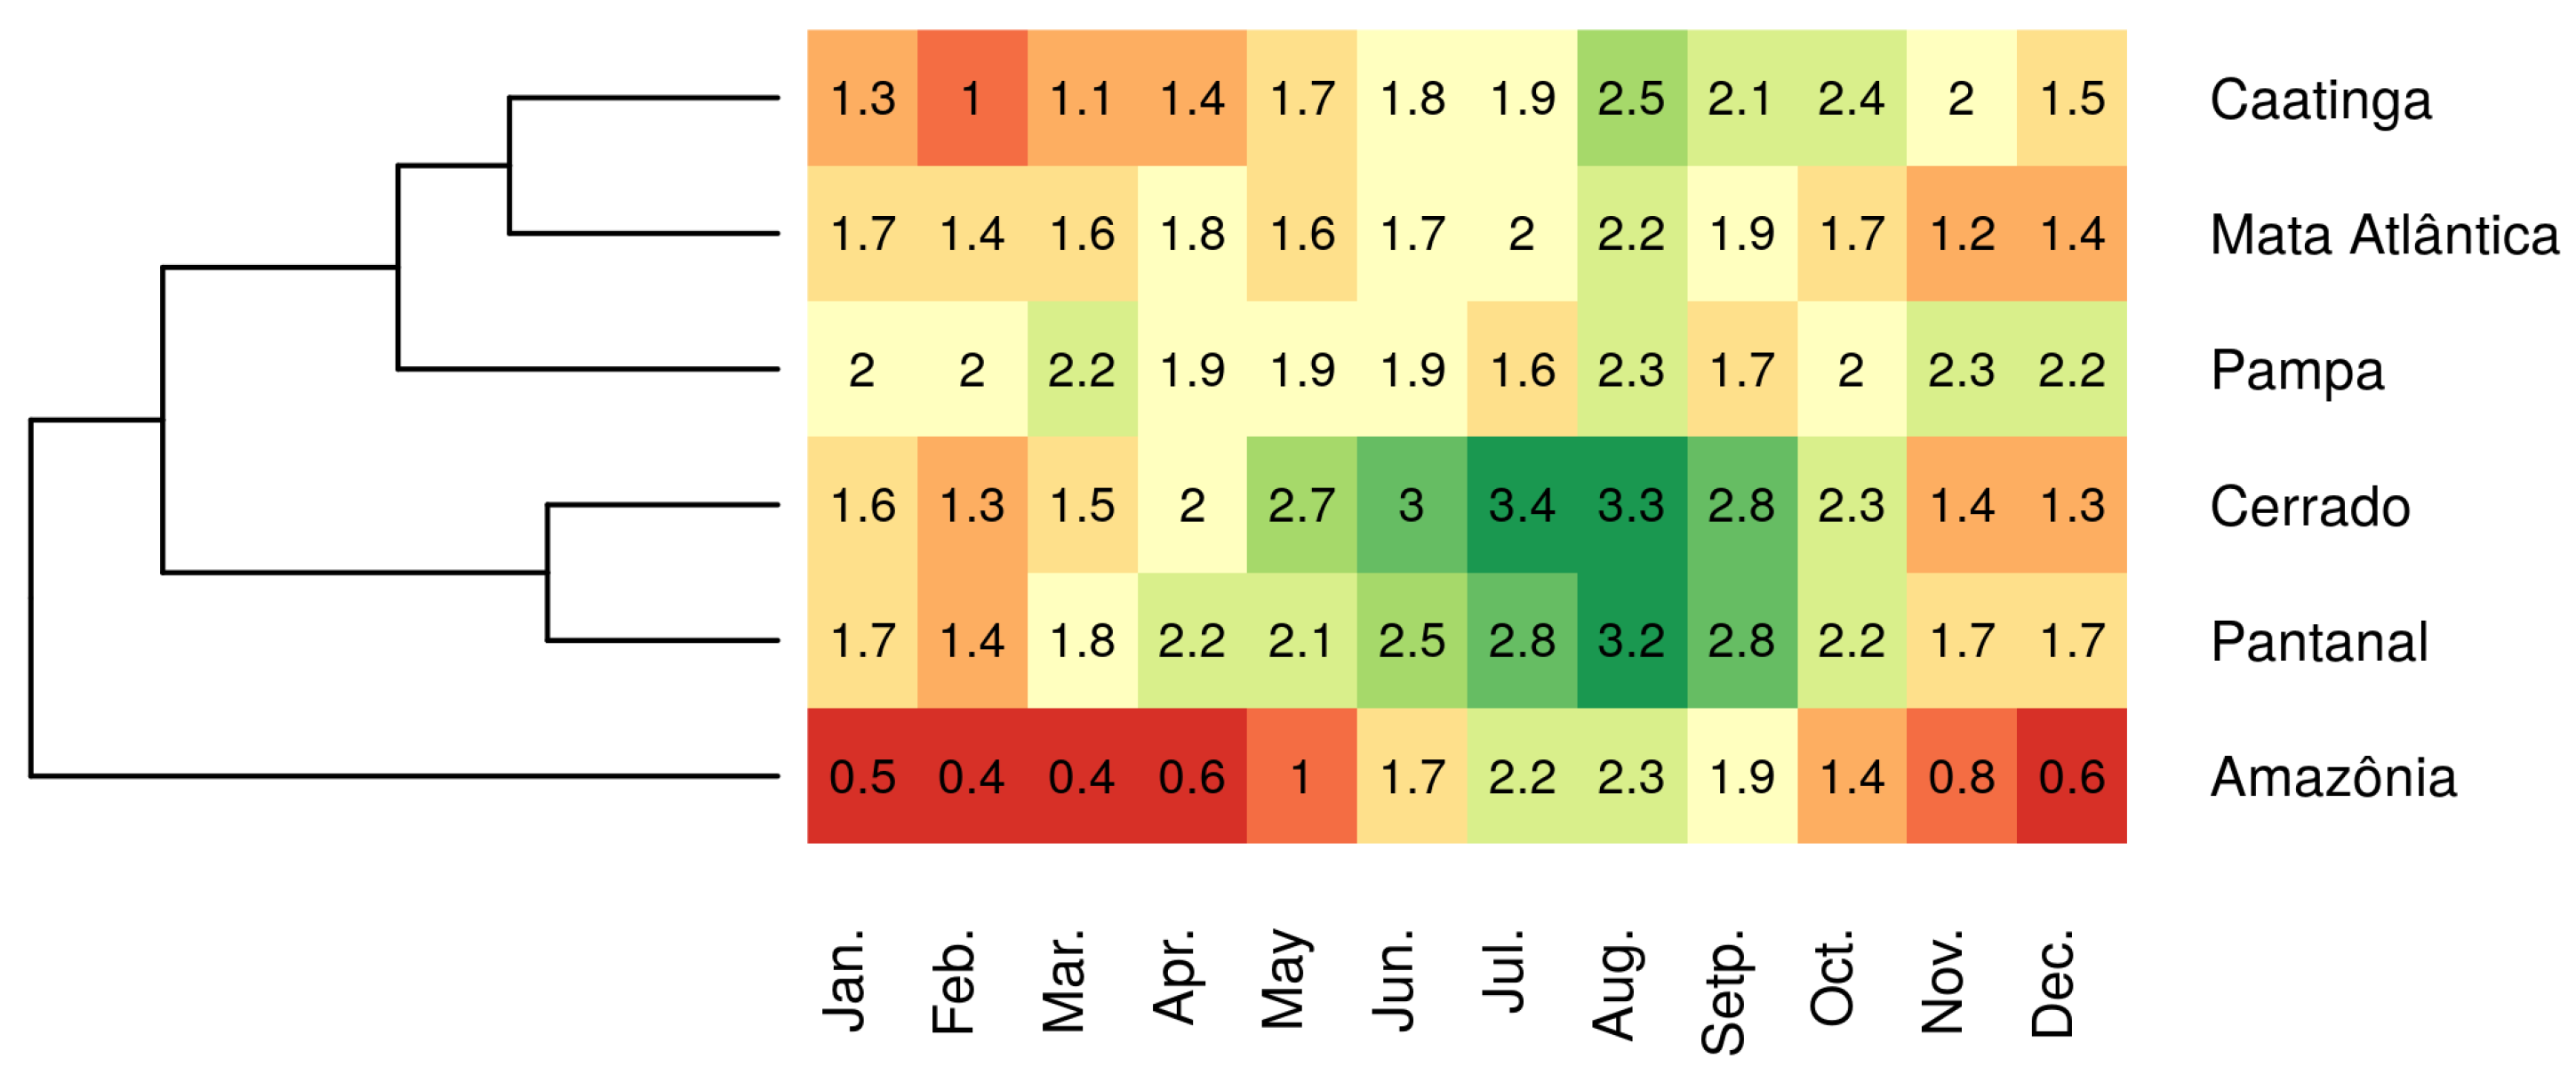
Landsat Collection Level 1 data are organized into three tier categories (Real-Time, Tier 1, and Tier 2) based on data quality and processing level. This assessment was limited to the Tier 1 collection, which contains the highest radiometric and geometric quality images. These data are intercalibrated between Landsat sensors and recommended by the United States Geological Survey (USGS) for time series analysis. The number of valid observations, at pixel level, was computed using the cloud mask information. The availability of valid observations (without clouds) by biome and the spatial and temporal distribution of valid observations were evaluated. Heat maps were elaborated to show the distribution of valid observations throughout the year in the different biomes. The heat maps were combined with a hierarchical cluster to show the similarity of temporal distribution pattern between biomes (see upper part of Figure 1).
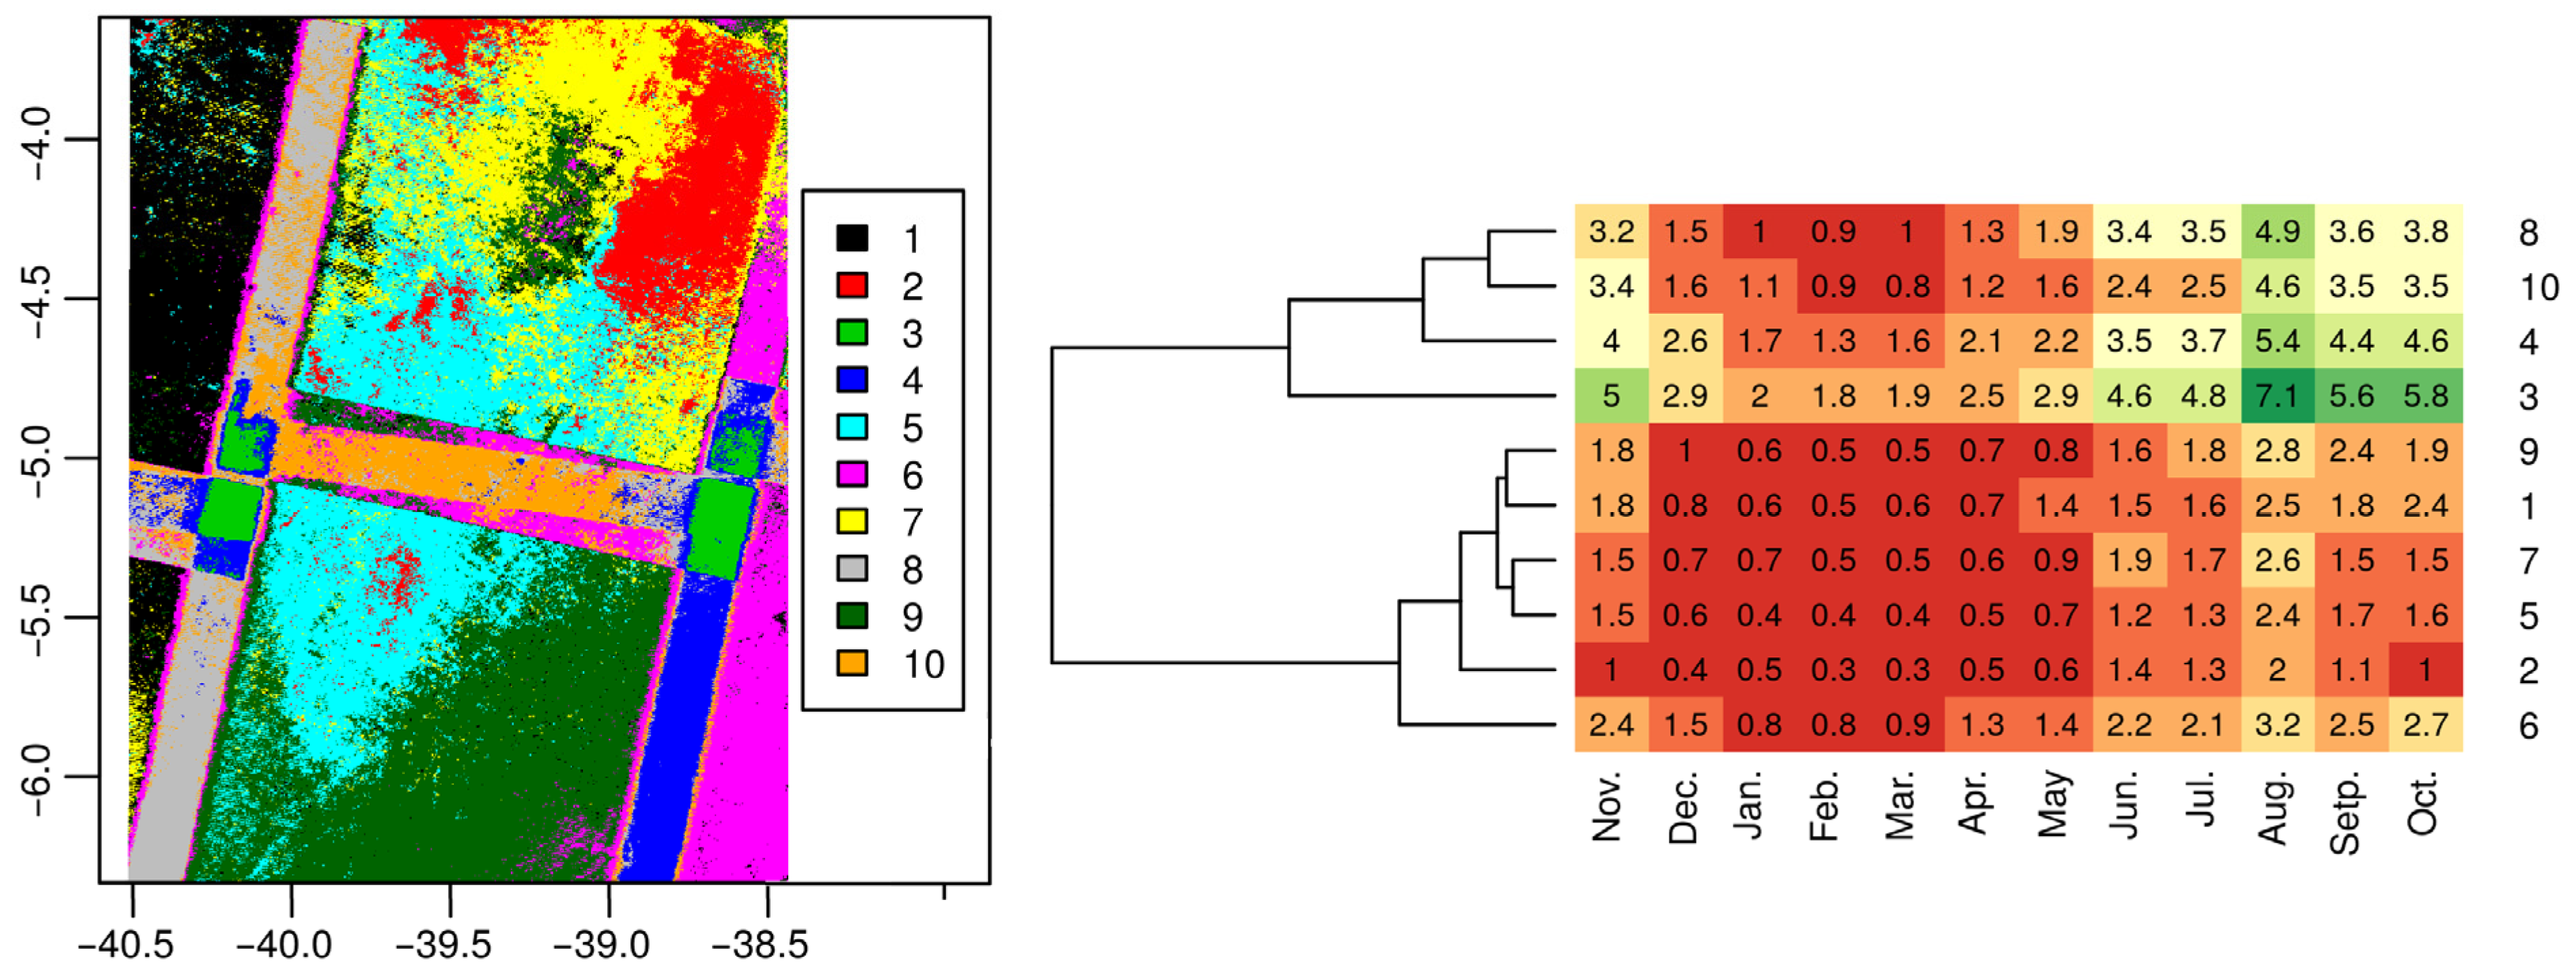
In the next step, the study focused on an area encompassing a large portion of the State of Ceará (Red rectangle in Figure 2) that belongs to the Brazilian Northeast semi-arid, known as the Caatingas Dominium [31]. This ecoregion of deserts and xeric shrublands [32], belongs to the Köppen–Geiger Bsh climate dominium semi-arid with summer and autumn rainfalls and dry winter [33]. A stack of twelve maps representing the number of valid monthly observations was classified using the K-means algorithm. K-means is one of the most common clustering algorithms, is simple to implement, guarantees convergence and scales to large data sets. It carries out clustering, making the intra-cluster observations similar while keeping the clusters as different as possible. In this study, each resulting cluster represents a different temporal pattern of data availability. The average and the variance of the number of monthly available valid observations were computed for each cluster.
As the following step, we modelled the effect of the lack of valid observations on phenological metrics estimation. For that, a curve fitting method proposed by Klosterman et al. [34] was applied to a high temporal resolution Sentinel Normalized Difference Vegetation Index (NDVI) dataset obtained from an overlapping area between two paths of the Sentinel satellites. We chose the Klosterman method because Zhou [35] identified it as the most robust among four models to determine the phenological metrics for vegetation, presenting a single growth season. This enables us to obtain NDVI curves for dry tropical forest plots that we used as references.
Incomplete data were generated from the reference curves following the different availability patterns observed in the Northeast semi-arid area. For this, likely acquisition dates were modelled for each pattern of image availability (cluster) by computing the expected number of valid monthly observations in a given availability pattern generating random numbers from a Gaussian distribution based on the average and standard deviation previously calculated. Then, time series of NDVI values were generated using the reference curve equation and adding random noise to consider the degradation of received radiance at the sensor due to atmospheric effects and instrumental (sensor) noises. A curve was fitted to these incomplete NDVI data, and phenological metrics were extracted according to Klosterman et al. [34]. The curvature rate was calculated and inflection points were evaluated on its derivative, which enabled the identification of greenup, maturity, senescence and dormancy dates. The uncertainty of phenological metrics was evaluated according to the bootstrap approach proposed by Filippa et al. [36] and implemented in the phenopix R package [36]. Fitting was applied recursively to randomly-noised original data, providing an ensemble of fitted curves and derived metrics, allowing an uncertainty estimate of both fitting parameters and phenological metrics. The uncertainty measure was the width of the interval, which contains 95% of the metric values. Two hundred NDVI time series were modelled for each availability pattern, and the uncertainty values were averaged (see lower part of Figure 1).
Image search and processing in the Google Earth database was performed through the Earth Engine Code Editor (https://code.earthengine.google.com/; accessed on 16 February 2021) [23]. Statistical analyzes, graphs and maps elaboration were made using the R software [37]. The R packages raster [38], RStoolbox [39] and phenopix [36] were particularly useful.

3. Results

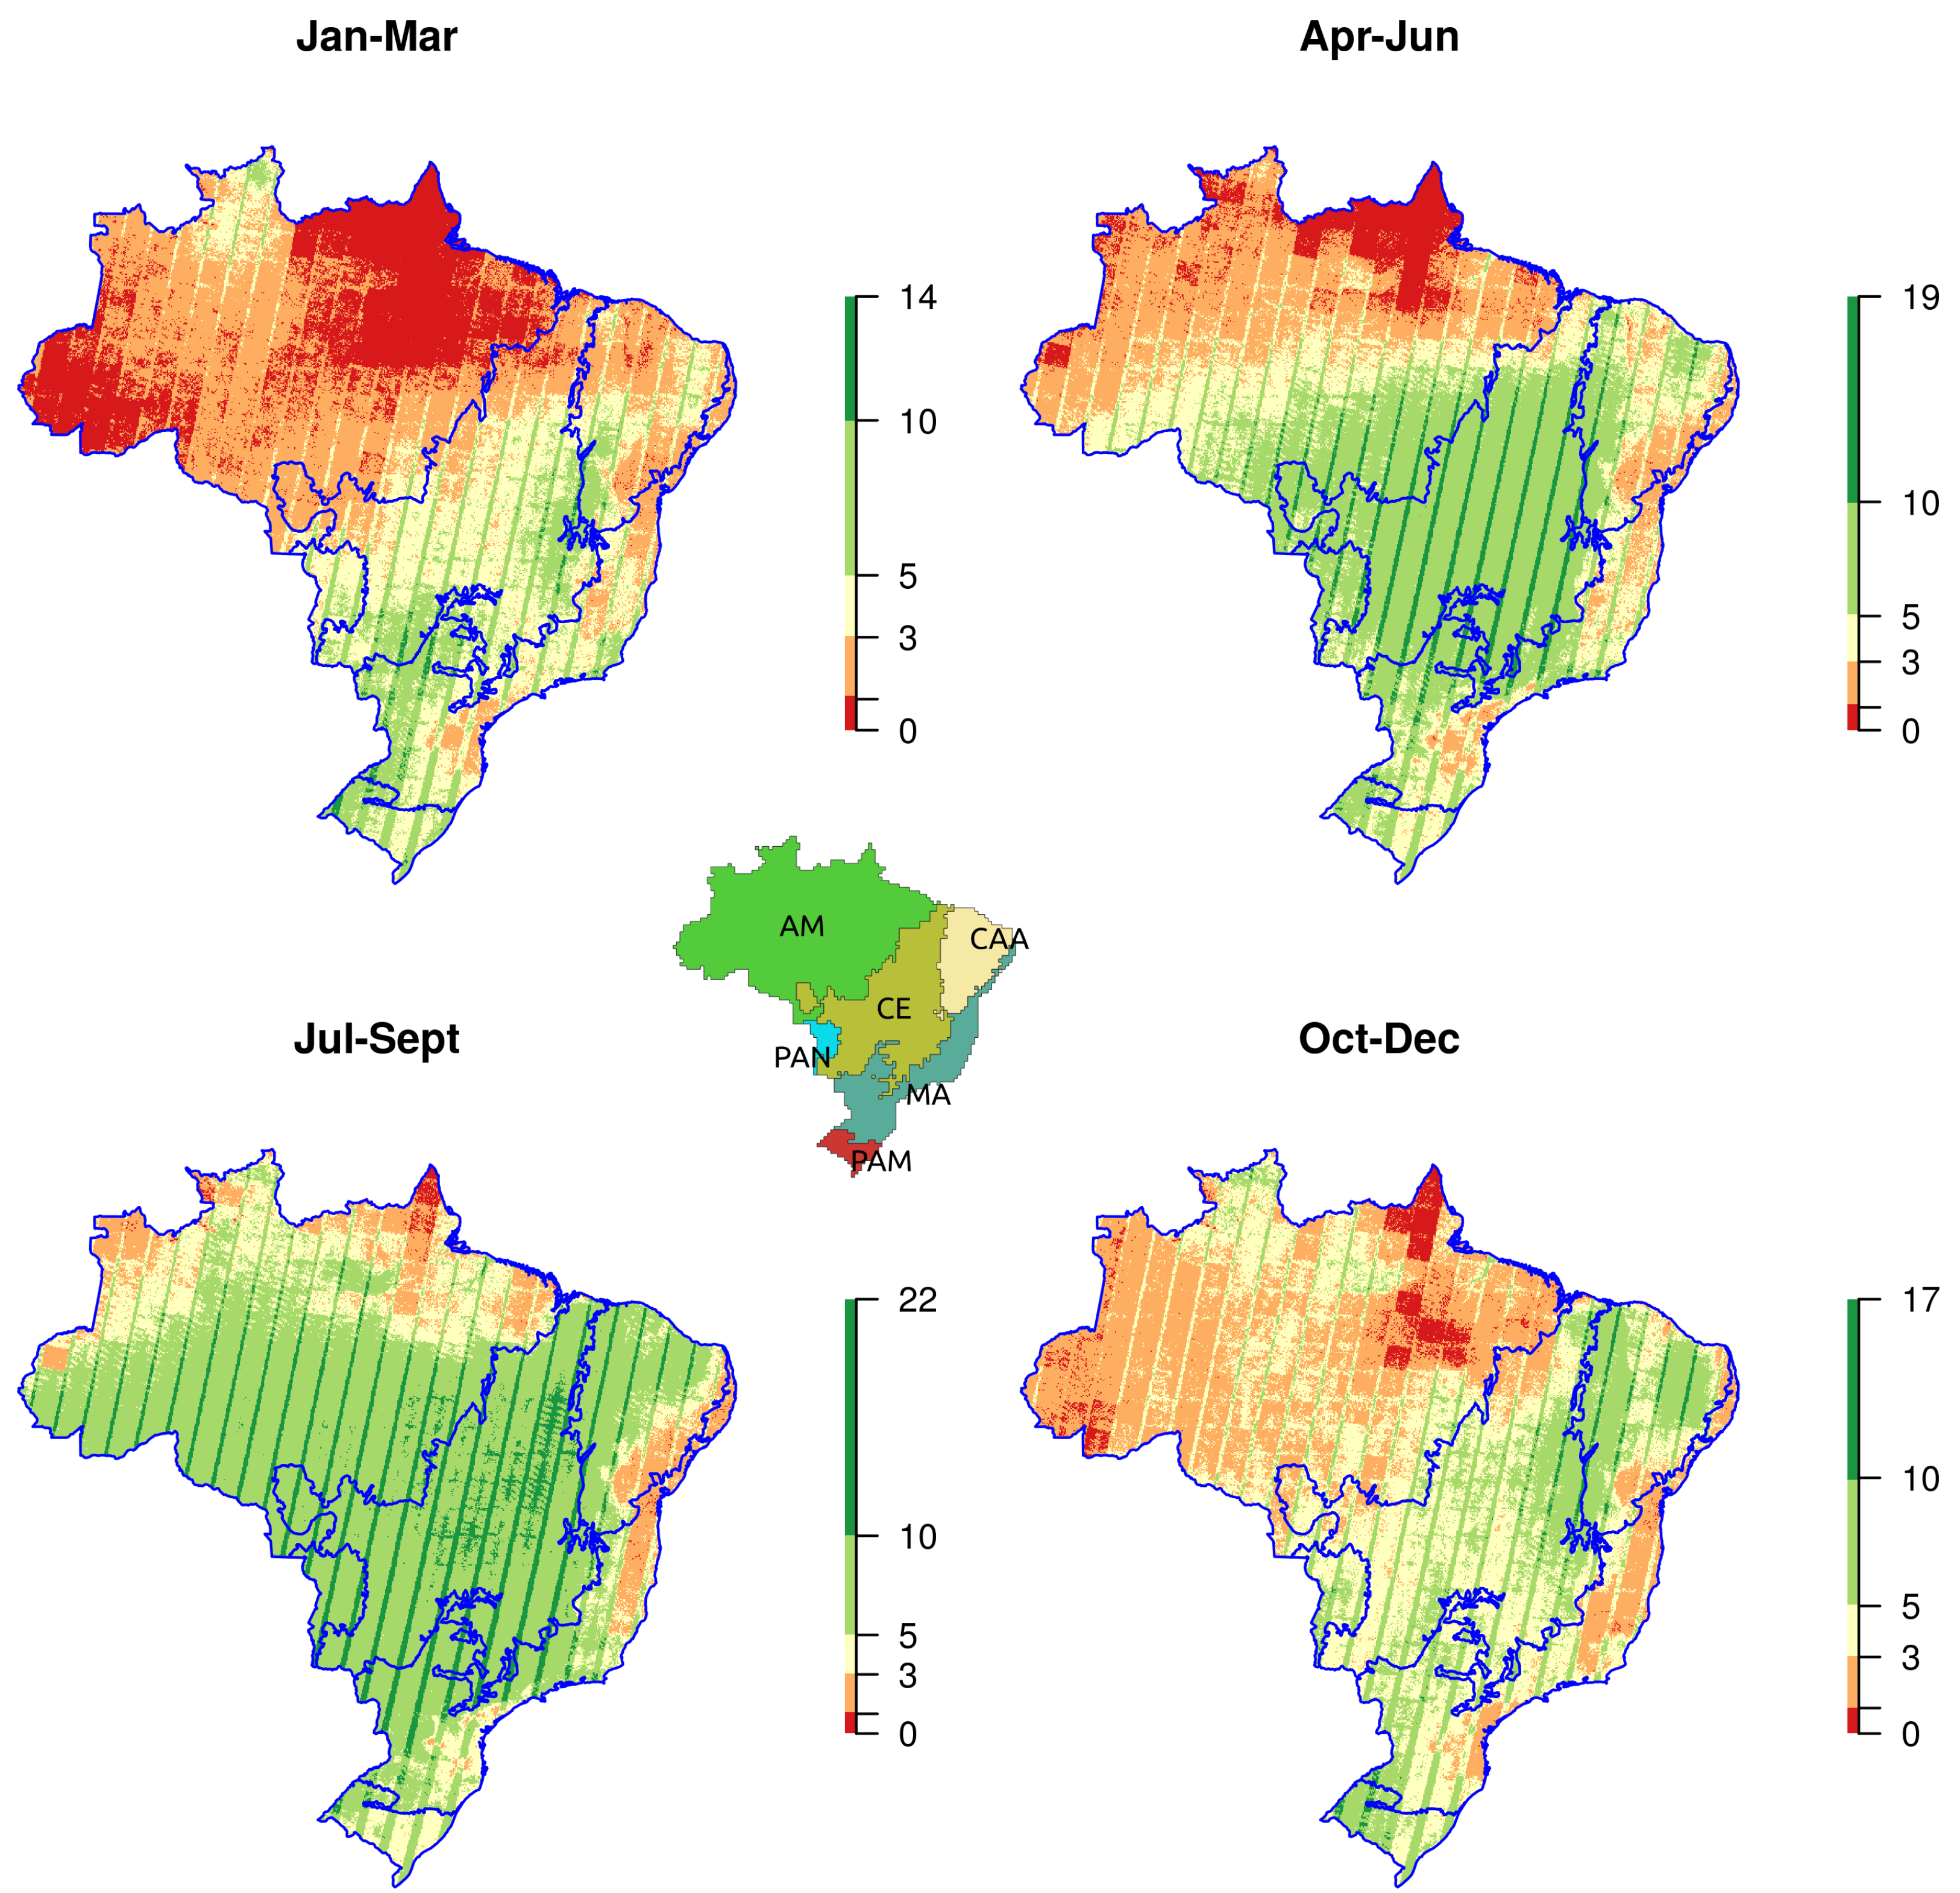
Figure 3 shows the total number of valid observations (pixel without clouds) by trimester for the period 2014–2019 (Landsat 7 and 8) over the Brazilian territory, that is, how many times each pixel was presented in an image without cloud interference. It can be observed that data availability varies significantly in space and time. In the Amazon, it is worth noting the lack of valid observations during a large part of the year (November to May). To a lesser extent, Caatinga and Mata Altântica biomes also present a similar pattern (Figure 4).
Another interesting aspect observed in Figure 3 is the presence of north–south oriented strips in which there are approximately twice as many valid observations. These areas correspond to the overlap between two satellite paths and are narrower at the equator (approximately 20 km wide) and wider at high latitudes (60 km in the south of Brazil).
Figure 5 shows the image classified using the number of valid monthly observations. The clusters 3, 4, 8 and 10 correspond to overlapping areas between Landsat scenes and have a larger number of data during the period 2014–2019.
In order to employ a realistic phenological curve to model the effect of the lack of valid information on metrics, we constructed a reference curve from a dry tropical forest plot located on the overlapping of two Sentinel paths. The reference curve was obtained fitting the Sentinel derived NDVI values using the generalized sigmoid formula proposed by Klosterman et al. [34], and equation parameters were determined (Figure 6). The variability of Landsat NDVI values around the reference curve enables us to evaluate the noise related to data acquisition (standard deviation of the residuals). Then acquisition dates were modelled for each pattern of image availability (cluster), and time series of NDVI values were generated using the equation of the reference curve and adding the random noise.
Phenological metrics, along with their uncertainty, were computed from the NDVIs. Table 1 shows the confidence interval of metrics for each pattern of image availability. It can be observed that the unique pattern of observation availability which enables the method to estimate the four metrics with confidence is pattern 3 which corresponds to the “exceptional” case of overlapping between two satellite paths with frequent observations. The dates of senescence and dormancy, which correspond to the dry season and a larger number of observations, are determined without uncertainty. At the opposite, greenup and maturity dates based on a lower number of observations (rainy season) and the steeper part of the curve present a considerable uncertainty.

4. Discussion

Phenological data obtained from remote sensing present a large and growing resource for monitoring global change and vegetation interaction. However, in tropical regions, the presence of clouds often limits the availability of remotely sensed observations during a part of the year. This study assessed the effect of the lack of available observations taking into account different temporal pattern of images availability over a semi-arid region in northeast Brazil. Our preliminary results indicate that the lack of valid observations has an adverse impact on the phenological metrics’ certainty. The availability of Landsat data (two satellites with a 16 days revisiting period), in the climatic conditions of the Caatinga biome limits the accurate estimate of these metrics strongly. It is worth noting that the uncertainty of a remote sensing product accumulates and propagates over and over through the processing flow and ultimately affects the final results’ reliability [40,41]. The Sentinel constellation, which has a better temporal resolution, can be useful in improving these estimates. Moreover, the combination of different sensors such as the Harmonized Landsat Sentinel-2 Surface Reflectance Product [42] will permit to overcome many of these limitations [43,44]. Another option can be using MODIS data, which permits a high temporal resolution but at the expense of spatial resolution [11,45,46]. However, MODIS and Sentinel 2 provided data from 1999 and 2015, respectively, (2002 and 2017 as two satellites based constellations). Therefore, studies aiming at monitoring vegetation over more extended periods to reveal long term land surface dynamics at a relatively high spatial resolution should use Landsat data.
A similar impact of observation scarcity will likely be observed on land change detection techniques based on time series of vegetation indices such as, for example, BFAST. This algorithm decomposes the time series into seasonal, trend and remainder components to detect abrupt changes [47]. In further researches, a similar modelling approach will be used to assess this impact.
Klosterman et al. [34] found that the choice of analysis method affects the error, the magnitude of bias, and in some cases, the direction of the bias of the estimate of the metrics. Zhou [35] realised growth curve fitting using different methods and found that double logistic method, as Klosterman’, is adapted to model the vegetation growing process with a single growth peak. The spline method presents a good performance for fitting growth curves of vegetation with multiple growth seasons. In this sense, in further researches, other fitting methods and metrics should be explored in the case of Caatinga vegetation. For instance, as it can be noted in Figure 6, that the fitted curve does not follow the rapid steep greenup at the beginning of the rainy season.
This article assessed the impact of observations’ scarcity on vegetation phenology metrics obtained using a NDVI Landsat time series and a specific fitting method. However, there are additional sources of errors. Helman [9] discussed the principal limitations that could lead to the misinterpretation of the remotely sensed data. First, the different vegetation indexes have distinct responses to greenness dynamics and changes in wetness conditions and surface brightness. For instance, the enhanced vegetation index (EVI) presents little response to soil exposure and less saturation over dense vegetation than the NDVI. This author suggests using different vegetation indexes for different biomes. Remotely sensed imagery provides information at aggregated spatial resolutions. Therefore, signals may contain information plant species with different phenologies or even from vegetated and non-vegetated covers. The signal can also be affected by changes in multi-canopy layers and by the sun-sensor-target geometry. Furthermore, there are many smoothing and curve-fitting methods, resulting in significantly different estimates of metrics’ values [48].
Finally, in the present study, we do not treat a critical dimension of land surface phenology which is the relationship of the metrics with ground-based observations, ecological processes such as carbon uptake, photosynthesis, gross primary production or sap flow density [49,50,51] and anthropic actions as fire and land use management [52].

5. Conclusions

The recent developments on big data allow carrying out satellite-based continuous land cover monitoring over huge areas using high temporal resolution data. Such monitoring systems can give insights into the study of forest deforestation and degradation, agriculture intensification and vegetation alterations in response to climatic change. Due to the tremendous amount of information, monitoring systems are increasingly based on automatized algorithms and indices computing. Therefore, particular attention has to be played concerning the accuracy of the obtained products and the propagation of error.
In this study, we show that the availability of intra-annual satellite observations varies significantly over space and that the scarcity of valid observations during a part of the year has an adverse effect on the certainty of the estimate of indices such as phenological metrics. However, the minimum number of valid observations needed to adequately capture the phenological curve is not absolute and depends on the timing (temporal pattern) of the cloud-free observations and the type of vegetation. Therefore, the modelling approach proposed in this paper enables the evaluation of the uncertainty of each availability temporal pattern. Further research has to be done in order to determine the most robust methods and metrics using this modelling approach.
Additionally, the combination of Landsat data with satellite constellations such as Gaofen, PlanetScope and Sentinel will improve the frequency of the observations and permit to overcome many of these limitations.
Phenological metrics derived from remotely sensed data must be interpreted with caution, in particular when the number of observations is limited. The use of situ sensors and phenocams and the knowledge of the plant species’ phenological behaviour obtained from field and laboratory studies can be critical to carry out this task. The evaluation procedure proposed in this study can provide guidance for further evaluation of the certainty of any metrics using data sets from other sensors.

Author Contributions

Conceptualization, methodology, script writing and processing, J.-F.M.; Results analysis, writing, review and editing, J.-F.M. and F.S.d.A. All authors have read and agreed to the published version of the manuscript.

Funding

The first author thanks the Programa de Apoyos para la Superación del Personal Académico (Dirección General de Asuntos del Personal Académico, Universidad Nacional Autónoma de México) for financial support for a sabbatical semestre at the Federal University of Ceará. This research was supported by the Project PAPIME PE117519 Herramientas para la enseñanza de la Geomática con programas de código abierto (Dirección General de Asuntos del Personal Académico, Universidad Nacional Autónoma de México).

Institutional Review Board Statement

Not applicable.

Informed Consent Statement

Not applicable.

Data Availability Statement

GEE code is available at: https://github.com/JonathanVSV/Landsat-Sentinel-Obs; accessed on 16 February 2021. Landsat and Sentinel images are available at sites as https://glovis.usgs.gov/; accessed on 16 February 2021 and https://scihub.copernicus.eu/; accessed on 16 February 2021.

Acknowledgments

We thank DGAPA-UNAM for supporting the study and Jonathan V. Solórzano for writing the GEE scripts.

Conflicts of Interest

The authors declare no conflict of interest.

References

  1. Lu, D.; Mausel, P.; Brondízio, E.; Moran, E. Change detection techniques. Int. J. Remote Sens. 2004, 25, 2365–2401. [Google Scholar] [CrossRef]
  2. Mas, J.F. Monitoring land-cover changes: A comparison of change detection techniques. Int. J. Remote Sens. 1999, 20, 139–152. [Google Scholar] [CrossRef]
  3. Panuju, D.R.; Paull, D.J.; Griffin, A.L. Change Detection Techniques Based on Multispectral Images for Investigating Land Cover Dynamics. Remote Sens. 2020, 12, 1781. [Google Scholar] [CrossRef]
  4. Atzberger, C.; Klisch, A.; Mattiuzzi, M.; Vuolo, F. Phenological Metrics Derived over the European Continent from NDVI3g Data and MODIS Time Series. Remote Sens. 2014, 6, 257–284. [Google Scholar] [CrossRef] [Green Version]
  5. Künzer, C.; Dech, S.; Wagner, W. Remote Sensing Time Series: Revealing Land Surface Dynamics, 1st ed.; Remote Sensing and Digital Image Processing 22; Springer International Publishing: Cham, Switzerland, 2015; p. 441. [Google Scholar]
  6. Melaas, E.K.; Friedl, M.A.; Zhu, Z. Detecting interannual variation in deciduous broadleaf forest phenology using Landsat TM/ETM+ data. Remote Sens. Environ. 2013, 132, 176–185. [Google Scholar] [CrossRef]
  7. Zeng, L.; Wardlow, B.D.; Xiang, D.; Hu, S.; Li, D. A review of vegetation phenological metrics extraction using time-series, multispectral satellite data. Remote Sens. Environ. 2020, 237, 111511. [Google Scholar] [CrossRef]
  8. Hanes, J.; Liang, L.; Morisette, J. Land Surface Phenology. In Biophysical Applications of Satellite Remote Sensing; Hanes, J., Ed.; Springer: Berlin/Heidelberg, Germany, 2014; pp. 99–125. [Google Scholar] [CrossRef]
  9. Helman, D. Land surface phenology: What do we really ‘see’ from space? Sci. Total Environ. 2018, 618, 665–673. [Google Scholar] [CrossRef]
  10. Alcaraz-Segura, D.; Cabello, J.; Paruelo, J. Baseline characterization of major Iberian vegetation types based on the NDVI dynamics. Plant Ecol. 2009, 202, 13–29. [Google Scholar] [CrossRef]
  11. Aragones, D.; Rodriguez-Galiano, V.F.; Caparros-Santiago, J.A.; Navarro-Cerrillo, R.M. Could land surface phenology be used to discriminate Mediterranean pine species? Int. J. Appl. Earth Obs. Geoinf. 2019, 78, 281–294. [Google Scholar] [CrossRef]
  12. Karami, M.; Westergaard-Nielsen, A.; Normand, S.; Treier, U.A.; Elberling, B.; Hansen, B.U. A phenology-based approach to the classification of Arctic tundra ecosystems in Greenland. ISPRS J. Photogramm. Remote Sens. 2018, 146, 518–529. [Google Scholar] [CrossRef]
  13. Kollert, A.; Bremer, M.; Löw, M.; Rutzinger, M. Exploring the potential of land surface phenology and seasonal cloud free composites of one year of Sentinel-2 imagery for tree species mapping in a mountainous region. Int. J. Appl. Earth Obs. Geoinf. 2021, 94, 102208. [Google Scholar] [CrossRef]
  14. Schwieder, M.; Leitão, P.J.; Pinto, J.R.R.; Teixeira, A.M.C.; Pedroni, F.; Sanchez, M.; Bustamante, M.M.; Hostert, P. Landsat phenological metrics and their relation to aboveground carbon in the Brazilian Savanna. Carbon Balance Manag. 2018, 13, 7. [Google Scholar] [CrossRef] [PubMed] [Green Version]
  15. Gordo, O.; Sanz, J.J. Impact of climate change on plant phenology in Mediterranean ecosystems. Glob. Chang. Biol. 2010, 16, 1082–1106. [Google Scholar] [CrossRef]
  16. Kalisa, W.; Igbawua, T.; Henchiri, M.; Ali, S.; Zhang, S.; Bai, Y.; Zhang, J. Assessment of climate impact on vegetation dynamics over East Africa from 1982 to 2015. Sci. Rep. 2019, 9, 16865. [Google Scholar] [CrossRef] [PubMed] [Green Version]
  17. Richardson, A.D.; Keenan, T.F.; Migliavacca, M.; Ryu, Y.; Sonnentag, O.; Toomey, M. Climate change, phenology, and phenological control of vegetation feedbacks to the climate system. Agric. For. Meteorol. 2013, 169, 156–173. [Google Scholar] [CrossRef]
  18. Hansen, M.C.; Loveland, T.R. A review of large area monitoring of land cover change using Landsat data. Remote Sens. Environ. 2012, 122, 66–74. [Google Scholar] [CrossRef]
  19. Hansen, M.C.; Potapov, P.V.; Moore, R.; Hancher, M.; Turubanova, S.A.; Tyukavina, A.; Thau, D.; Stehman, S.V.; Goetz, S.J.; Loveland, T.R.; et al. High-resolution global maps of 21st-century forest cover change. Science 2013, 342, 850–853. [Google Scholar] [CrossRef] [PubMed] [Green Version]
  20. ESA (European Space Agency). Sentinel-2 MSI User Guide. 2020. Available online: https://sentinel.esa.int/web/sentinel/user-guides/sentinel-2-msi (accessed on 28 February 2021).
  21. Rao, V.B.; Hada, K. Characteristics of rainfall over Brazil: Annual variations and connections with the Southern Oscillation. Theor. Appl. Climatol. 1990, 42, 81–91. [Google Scholar] [CrossRef]
  22. Mas, J.F.; Sopchaki, C.H.; Rabelo, F.D.B.; Soares de Araújo, F.; Solórzano, J.V. Análise da disponibilidade de imagens Landsat e Sentinel para o Brasil. Geogr. Ensino Pesqui. 2020, 24, 47. [Google Scholar] [CrossRef]
  23. Gorelick, N.; Hancher, M.; Dixon, M.; Ilyushchenko, S.; Thau, D.; Moore, R. Google Earth Engine: Planetary-scale geospatial analysis for everyone. Remote Sens. Environ. 2017, 202, 18–27. [Google Scholar] [CrossRef]
  24. Perilla, G.A.; Mas, J.F. Google Earth Engine (GEE): Una poderosa herramienta que vincula el potencial de los datos masivos y la eficacia del procesamiento en la nube. Investig. Geogr. 2020. [Google Scholar] [CrossRef]
  25. Tamiminia, H.; Salehi, B.; Mahdianpari, M.; Quackenbush, L.; Adeli, S.; Brisco, B. Google Earth Engine for geo-big data applications: A meta-analysis and systematic review. ISPRS J. Photogramm. Remote Sens. 2020, 164, 152–170. [Google Scholar] [CrossRef]
  26. Wang, L.; Diao, C.; Xian, G.; Yin, D.; Lu, Y.; Zou, S.; Erickson, T.A. A summary of the special issue on remote sensing of land change science with Google earth engine. Remote Sens. Environ. 2020, 248, 112002. [Google Scholar] [CrossRef]
  27. Pekel, J.F.; Cottam, A.; Gorelick, N.; Belward, A.S. High-resolution mapping of global surface water and its long-term changes. Nature 2016, 540, 418–422. [Google Scholar] [CrossRef]
  28. Calderón-Loor, M.; Hadjikakou, M.; Bryan, B.A. High-resolution wall-to-wall land-cover mapping and land change assessment for Australia from 1985 to 2015. Remote Sens. Environ. 2021, 252, 112148. [Google Scholar] [CrossRef]
  29. Perilla, G.A.; Mas, J.F. High-resolution mapping of protected agriculture in Mexico, through remote sensing data cloud geoprocessing. Eur. J. Remote Sens. 2019, 52, 532–541. [Google Scholar] [CrossRef] [Green Version]
  30. Souza, C.M.; Shimbo, J.Z.; Rosa, M.R.; Parente, L.L.; Alencar, A.A.; Rudorff, B.F.; Hasenack, H.; Matsumoto, M.; Ferreira, L.G.; Souza-Filho, P.W.; et al. Reconstructing Three Decades of Land Use and Land Cover Changes in Brazilian Biomes with Landsat Archive and Earth Engine. Remote Sens. 2020, 12, 2735. [Google Scholar] [CrossRef]
  31. de Andrade Lima, D. The Caatingas dominium. Rev. Bras. Bot. 1981, 4, 149–153. [Google Scholar]
  32. Olson, D.M.; Dinerstein, E.; Wikramanayake, E.D.; Burgess, N.D.; Powell, G.V.; Underwood, E.C.; D’Amico, J.A.; Itoua, I.; Strand, H.E.; Morrison, J.C.; et al. Terrestrial ecoregions of the world: A new map of life on Earth. BioScience 2001, 51, 933–938. [Google Scholar] [CrossRef]
  33. Peel, M.C.; Finlayson, B.L.; McMahon, T.A. Updated world map of the Köppen-Geiger climate classification. Hydrol. Earth Syst. Sci. 2007, 11, 1633–1644. [Google Scholar] [CrossRef] [Green Version]
  34. Klosterman, S.T.; Hufkens, K.; Gray, J.M.; Melaas, E.; Sonnentag, O.; Lavine, I.; Mitchell, L.; Norman, R.; Friedl, M.A.; Richardson, A.D. Evaluating remote sensing of deciduous forest phenology at multiple spatial scales using PhenoCam imagery. Biogeosciences 2014, 11, 4305–4320. [Google Scholar] [CrossRef] [Green Version]
  35. Zhou, Y. Comparative study of vegetation phenology extraction methods based on digital images. Prog. Geogr. 2018, 37, 1031. [Google Scholar] [CrossRef]
  36. Filippa, G.; Cremonese, E.; Migliavacca, M.; Galvagno, M.; Forkel, M.; Wingate, L.; Tomelleri, E.; Morra di Cella, U.; Richardson, A.D. Phenopix: A R package for image-based vegetation phenology. Agric. For. Meteorol. 2016, 220, 141–150. [Google Scholar] [CrossRef] [Green Version]
  37. R Core Team. A Language and Environment for Statistical Computing; Technical Report; R Foundation for Statistical Computing: Vienna, Austria, 2020. [Google Scholar]
  38. Hijmans, R.J.; van Etten, J.; Mattiuzzi, M.; Sumner, M.; Greenberg, J.A.; Lamigueiro, O.P.; Bevan, A.; Racine, E.B.; Shortridge, A. Raster: Geographic Data Analysis and Modeling. 2020. Available online: http://cran.stat.unipd.it/web/packages/raster/ (accessed on 28 February 2021).
  39. Leutner, B.; Horning, N. Tools for Remote Sensing Data Analysis. 2019. Available online: https://cran.r-project.org/web/packages/RStoolbox/RStoolbox.pdf (accessed on 28 February 2021).
  40. Xu, H.; Twine, T.E.; Yang, X. Evaluating Remotely Sensed Phenological Metrics in a Dynamic Ecosystem Model. Remote Sens. 2014, 6, 4660–4686. [Google Scholar] [CrossRef] [Green Version]
  41. Zhang, Q.; Zhang, P. An uncertainty descriptor for quantitative measurement of the uncertainty of remote sensing images. Remote Sens. 2019, 11, 1560. [Google Scholar] [CrossRef] [Green Version]
  42. Claverie, M.; Ju, J.; Masek, J.G.; Dungan, J.L.; Vermote, E.F.; Roger, J.C.; Skakun, S.V.; Justice, C. The Harmonized Landsat and Sentinel-2 surface reflectance data set. Remote Sens. Environ. 2018, 219, 145–161. [Google Scholar] [CrossRef]
  43. Kowalski, K.; Senf, C.; Hostert, P.; Pflugmacher, D. Characterizing spring phenology of temperate broadleaf forests using Landsat and Sentinel-2 time series. Int. J. Appl. Earth Obs. Geoinf. 2020, 92, 102172. [Google Scholar] [CrossRef]
  44. Nguyen, M.D.; Baez-Villanueva, O.M.; Bui, D.D.; Nguyen, P.T.; Ribbe, L. Harmonization of Landsat and Sentinel 2 for Crop Monitoring in Drought Prone Areas: Case Studies of Ninh Thuan (Vietnam) and Bekaa (Lebanon). Remote Sens. 2020, 12, 281. [Google Scholar] [CrossRef] [Green Version]
  45. Caparros-Santiago, J.A.; Rodríguez-Galiano, V.F. Vegetation phenology from satellite imagery: The case of the Iberian Peninsula and Balearic Islands (2001–2017). Rev. Teledetec. 2020, 25–36. [Google Scholar] [CrossRef]
  46. Pastor-Guzman, J.; Dash, J.; Atkinson, P.M. Remote sensing of mangrove forest phenology and its environmental drivers. Remote Sens. Environ. 2018, 205, 71–84. [Google Scholar] [CrossRef] [Green Version]
  47. Verbesselt, J.; Hyndman, R.; Zeileis, A.; Culvenor, D. Phenological change detection while accounting for abrupt and gradual trends in satellite image time series. Remote Sens. Environ. 2010, 114, 2970–2980. [Google Scholar] [CrossRef] [Green Version]
  48. Misra, G.; Buras, A.; Menzel, A. Effects of different methods on the comparison between Land Surface and Ground Phenology—A methodological case study from South-Western Germany. Remote Sens. 2016, 8, 753. [Google Scholar] [CrossRef] [Green Version]
  49. Bórnez, K.; Richardson, A.D.; Verger, A.; Descals, A.; Peñuelas, J. Evaluation of VEGETATION and PROBA-V Phenology Using PhenoCam and Eddy Covariance Data. Remote Sens. 2020, 12, 3077. [Google Scholar] [CrossRef]
  50. Paloschi, R.A.; Ramos, D.M.; Ventura, D.J.; Souza, R.; Souza, E.; Morellato, L.P.C.; Nóbrega, R.L.B.; Coutinho, Í.A.C.; Verhoef, A.; Körting, T.S.; et al. Environmental Drivers of Water Use for Caatinga Woody Plant Species: Combining Remote Sensing Phenology and Sap Flow Measurements. Remote Sens. 2020, 13, 75. [Google Scholar] [CrossRef]
  51. Shen, M.; Tang, Y.; Desai, A.R.; Gough, C.; Chen, J. Can EVI-derived land-surface phenology be used as a surrogate for phenology of canopy photosynthesis? Int. J. Remote Sens. 2014, 35, 1162–1174. [Google Scholar] [CrossRef]
  52. Gessner, U.; Knauer, K.; Kuenzer, C.; Dech, S. Land Surface Phenology in a West African Savanna: Impact of Land Use, Land Cover and Fire. In Remote Sensing Time Series; Kuenzer, C., Dech, S., Wagner, W., Eds.; Springer: Berlin/Heidelberg, Germany, 2015; Chapter 10; pp. 203–224. [Google Scholar] [CrossRef]
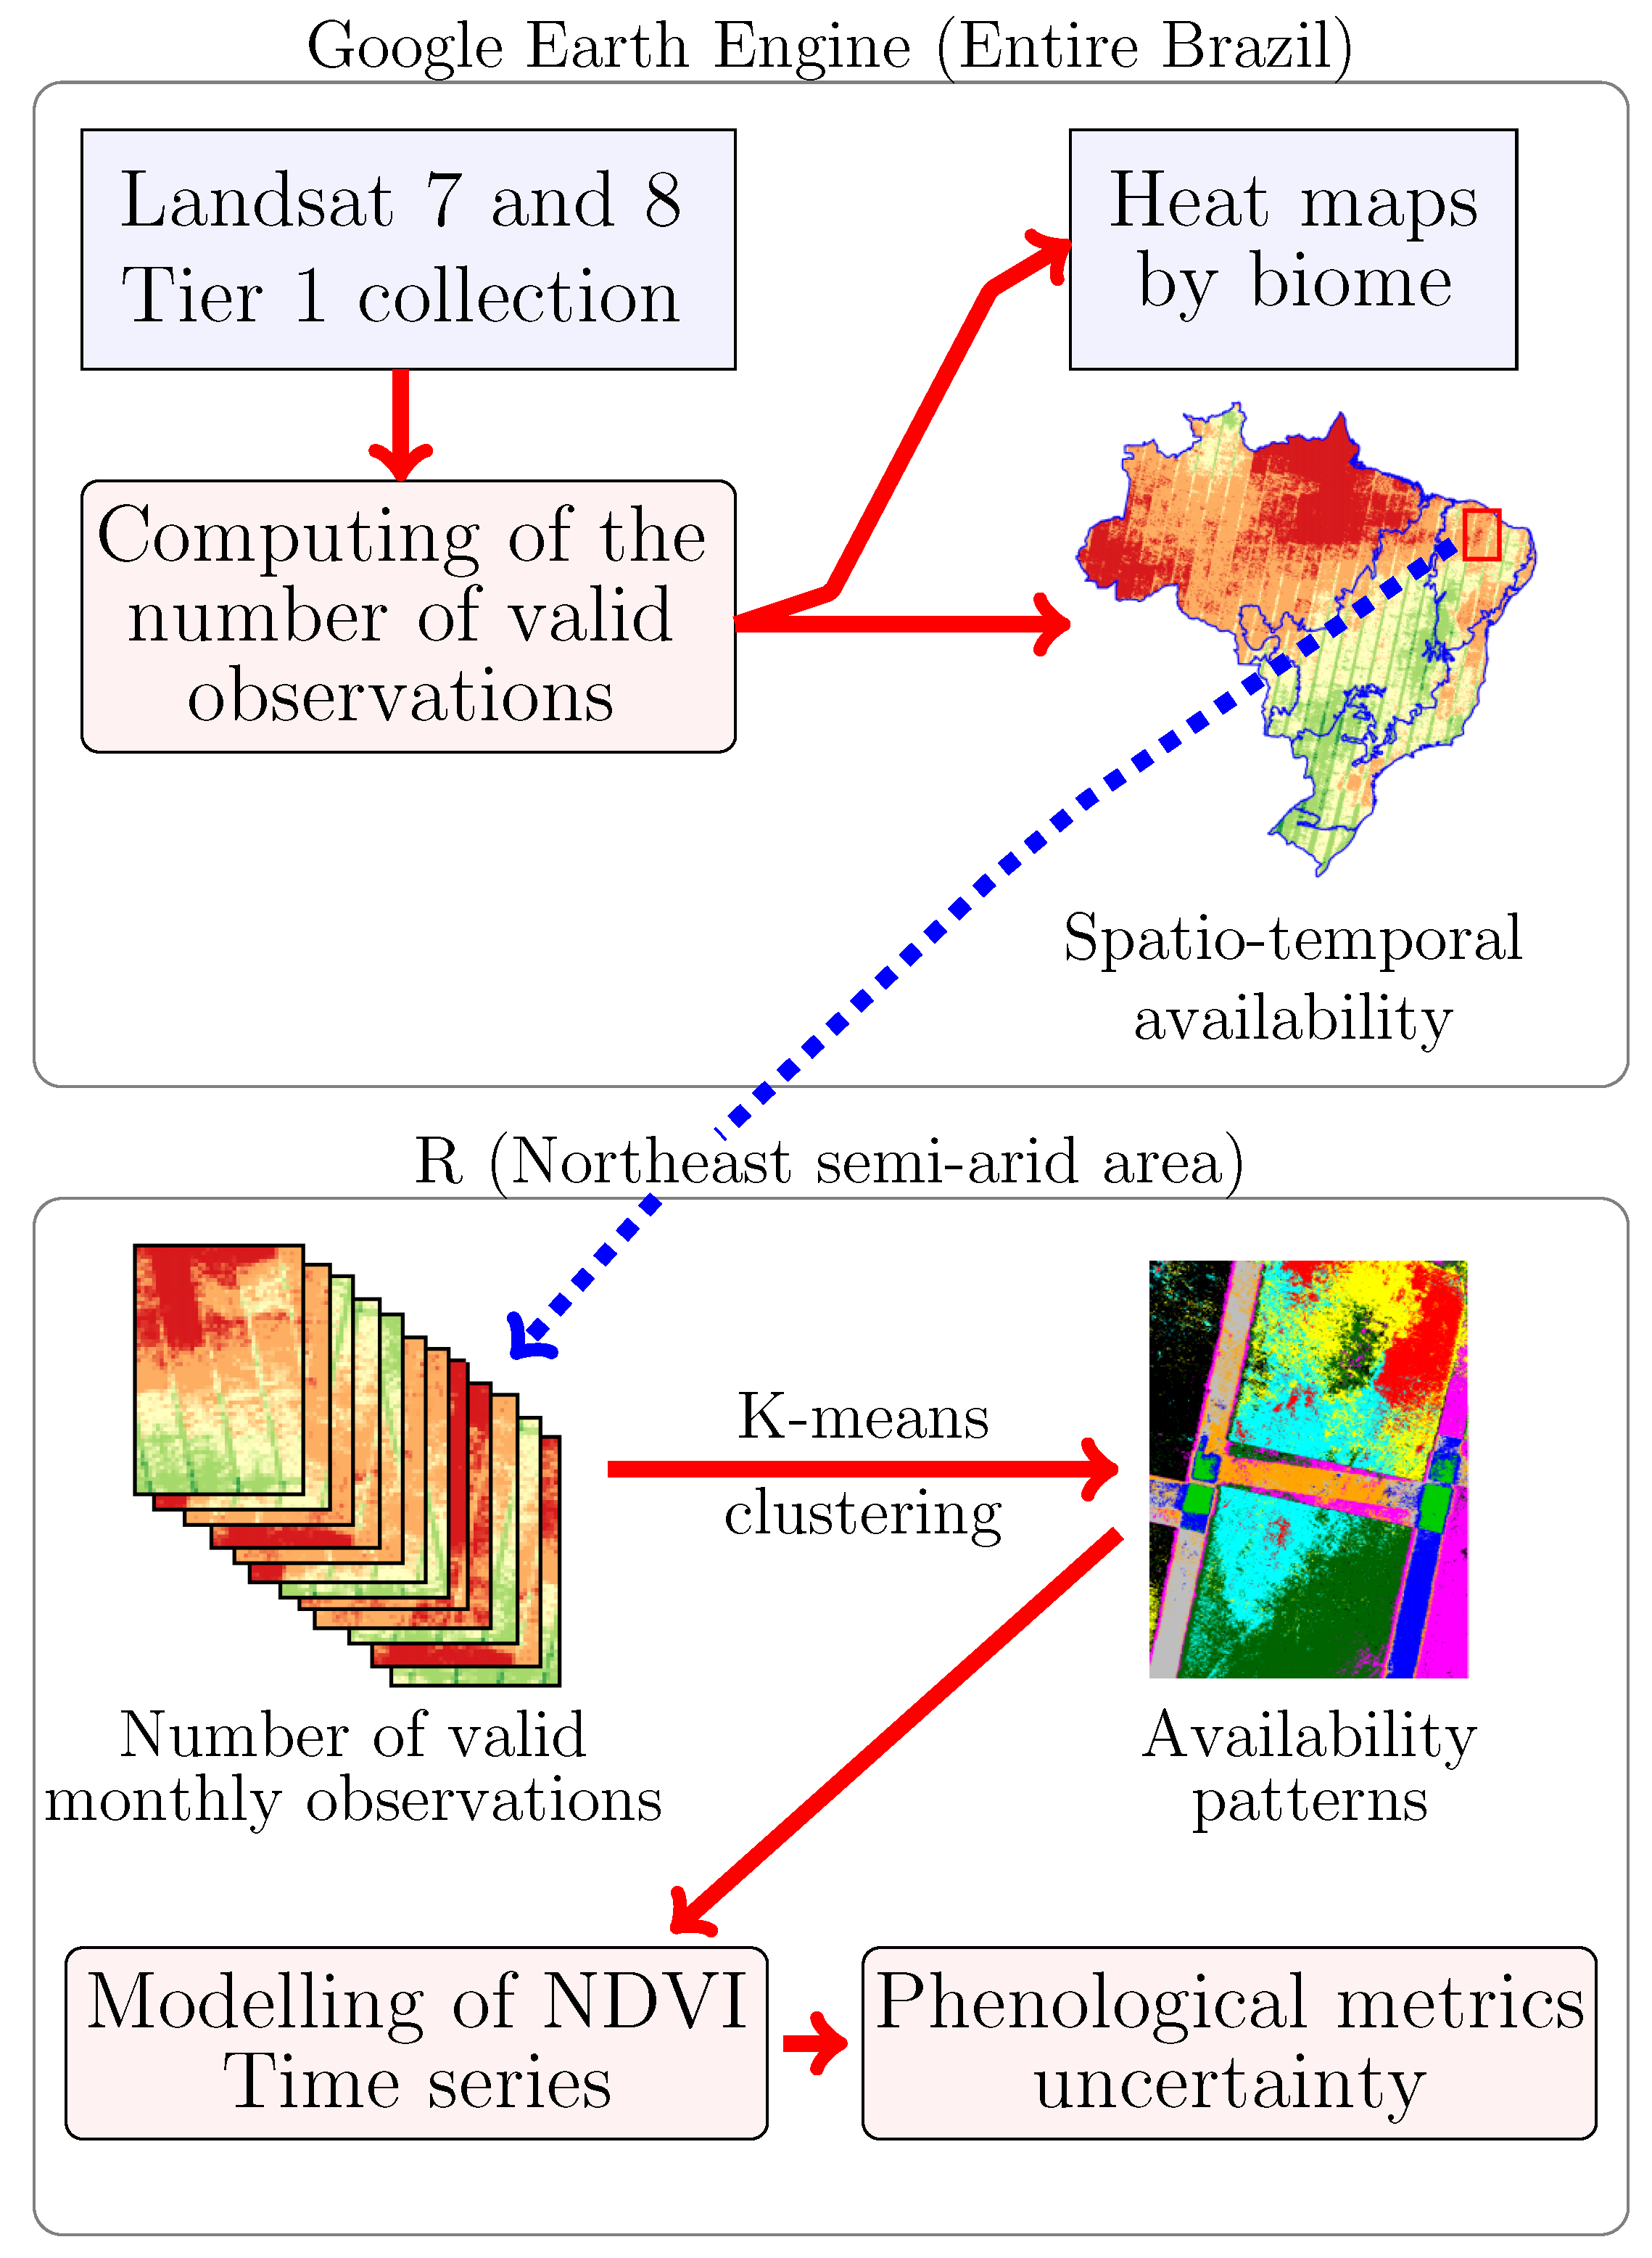
Figure 1. Flowchart showing Landsat imagery processing in GEE for entire Brazil (upper part) and availability patterns and phenological metrics assessment for the Northeast area in R (lower part).
Forests 12 00574 g001
Figure 2. Brazilian biomes.
Forests 12 00574 g002
Figure 3. Number of valid observations by trimester during the period 2014–2019.
Forests 12 00574 g003
Figure 4. Average number of valid monthly observations by Brazilian biome (2014–2019).
Forests 12 00574 g004
Figure 5. Map of clusters based on monthly availability of valid observations (left), heatmap showing the average availability pattern for each cluster (right). Each cluster represents a different pattern of valid observations availability over the year.
Forests 12 00574 g005
Figure 6. NDVI curve fitted from Sentinel observations (black circles) and four phenological metrics used in this study (1 November 2018–30 October 2019).
Forests 12 00574 g006
Table 1. Uncertainty of phenological metrics (width of the confidence intervals including 95% of the estimated values expressed as a number of days).
ClusterGreenupMaturitySenescenceDormancy
158.550.400
284.954.800
313.422.70.14.1
420.434.600.1
544.846.900
628.155.200
742.446.500
847.855.500
938.855.800
1032.255.800
Publisher’s Note: MDPI stays neutral with regard to jurisdictional claims in published maps and institutional affiliations.