Abstract
High N depositions of past decades brought changes to European forests including impacts on forest soil nutrition status. However, the ecosystem responses to declining atmospheric N inputs or moderate N depositions attracted only less attention so far. Our study investigated macronutrient (N, S, Ca2+, Mg2+, K+) pools and fluxes at forest conversion sites over 80 years old in Central Germany with European beech (so-called “Green Eyes” (GE)). The GE are embedded in large spruce and pine stands (coniferous stands: CS) and all investigated forest stands were exposed to moderate N deposition rates (6.8 ± 0.9 kg ha−1 yr−1) and acidic soil conditions (pHH2O < 4.7). Since the understanding of forest soil chemical and macronutrient status is essential for the evaluation of forest conversion approaches, we linked patterns in water-bound nutrient fluxes (2001–2018) and in predicted macronutrient storage in the herbaceous and tree layer to patterns in litter fall (2016–2017) and in forest floor and mineral soil macronutrient stocks at GE and CS assessed in 2018. Our results exhibited 43% (Nt) and 21% (S) higher annual throughfall fluxes at CS than at GE. Seepage water at 100 cm mineral soil depth (2001–2018) of CS is characterized by up to fivefold higher NO3− (GE: 2 ± 0.7 µmolc L−1; CS: 9 ± 1.4 µmolc L−1) and sevenfold higher SO42− (GE: 492 ± 220 µmolc L−1; CS: 3672 ± 2613 µmolc L−1) concentrations. High base cation (∑ Ca2+, Mg2+, K+) concentrations in CS mineral soil seepage water (100 cm depth: 2224 ± 1297 µmolc L−1) show significant positive correlations with SO42−. Tree uptake of base cations at GE is associated especially with a Ca2+ depletion from deeper mineral soil. Foliar litter fall turns out to be the main pathway for litter base cation return to the topsoil at GE (>59%) and CS (>66%). The litter fall base cation return at GE (59 ± 6 kg ha−1 yr−1) is almost twice as large as the base cation deposition (30 ± 5 kg ha−1 yr−1) via throughfall and stemflow. At CS, base cation inputs to the topsoil via litter fall and depositions are at the same magnitude (24 ± 4 kg ha−1 yr−1). Macronutrient turnover is higher at GE and decomposition processes are hampered at CS maybe through higher N inputs. Due to its little biomass and only small coverage, the herbaceous layer at GE and CS do not exert a strong influence on macronutrient storage. Changes in soil base cation pools are tree species-, depth- and might be time-dependent, with recently growing forest floor stocks. An ongoing mineral soil acidification seems to be related to decreasing mineral soil base cation stocks (through NO3− and especially SO42− leaching as well as through tree uptake).
1. Introduction
Large amounts of nitrogen (N) and sulfur (S) were emitted and deposited in Central Europe, mainly due to fossil fuel power stations, industrial productivity, traffic, agriculture, and livestock farming especially since the 1950s [1,2]. High N depositions caused various changes in European forests including impacts on the tree productivity, on the tree resilience against diseases [3,4], on the organic matter (OM) decomposition rate [5] and on the diversity of the herbaceous layer [6]. The latter is known to fulfil important ecosystem functions in macronutrient cycle regulation [7,8].
The deposition of acids, related to N and S emissions, and the deposition of protons (H+) contributed to soil acidification [9] caused decreases in soil acid neutralizing capacity. Over 80% of German forest sites—investigated between 2006–2008—were characterized by an acidic pH < 6.2 in mineral soil (0–90 cm depth) [10]. Those forest soils are less resilient against additional acid inputs and are at a greater risk to macronutrient losses. Nitrate (NO3−) and sulphate (SO42−) anions influenced the mineral soil cation exchange complex [11] by their neutralization through counter ions like calcium (Ca2+), magnesium (Mg2+) or potassium (K+). As expressed by a pronounced NO3− leaching with soil solution, a high N deposition has also caused a N saturation of European forest sites [12]. In this context, the process of mineral soil base cation depletion was regional strengthened by losses as counter ions [13] due to N leaching via seepage water [14].
For Central Europe, joint monitoring programs (e.g., EMEP: Co-operative Programme for Monitoring and Evaluation of the Long-range Transmission of Air Pollutants in Europe or ICP Forests: International Co-operative Programme on Assessment and Monitoring of Air Pollution Effects on Forests) have impressively demonstrate the drastic decrease in SO2 emissions (and to a lesser extend NOx and NHx) between 1990 and 2018 (Figure 1; SO2 decreased by almost 95%, NO2 by 58% and NH3 by 16%) due to international conventions and stringent air pollution regulations [15]. Nevertheless, the trend of NH3 deposition in bulk precipitation is stagnating over the last decade in Central Europe and the cumulative fluxes of N compounds in throughfall (TF) are often at a moderate (7–13 kg N ha−1 yr−1) or even high (20–40 kg N ha−1 yr−1) level [3,16]. Critical loads for forest ecosystem eutrophication and acidification [17] are reached or exceeded nearly at 65% of the area of European ecosystems in 2018 [15] and high exceedances at forest sites were found in Western Europe and Germany [18].
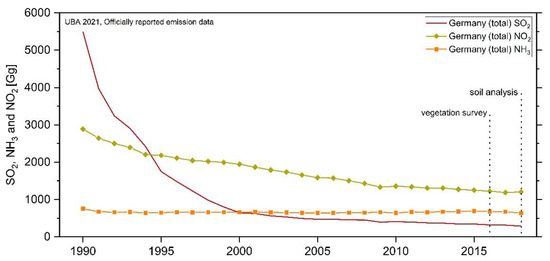
Figure 1.
Trends in emissions of main eutrophying/acidifying air pollutants and years of vegetation and soil investigations, presented in this study. Total national emissions of NOx (as NO2), NHx (as NH3), and SOx (as SO2) from 1990 to 2018 at the area of Germany. Datasource: UBA 2021, officially reported emission data.
Although S depositions decreased strongly over the last decades, even today their legacies are found accumulated in the mineral soil as SO42−, predominantly specific adsorbed to iron (Fe) and aluminum (Al) sesquioxides [19]. The desorption and the release of SO42− into soil solution is held responsible for mineral soil base cation leaching losses with seepage water [10,20,21,22], which might decrease pH at deeper mineral soil layers and delay a recovery from formerly induced soil acidification through air pollutants, especially of acidic soils [23].
Tree species differ in their throughfall and consequently in their seepage flux at similar site conditions [24]. Coniferous forests are characterized by higher throughfall N and S fluxes, leading to on average 12 times higher NO3− and 1.6 times higher SO42− leaching of macronutrients from mineral soil [25,26]. Trees link the below- and aboveground areas of an ecosystem by their water, macronutrient, and biomass cycling [27]. A characteristic usually of deciduous tree species like European beech (Fagus sylvatica L.) is the so-called “base pump effect” [28], expressed in the root uptake of Ca2+, Mg2+ or K+ from mineral soil, their storage in tree biomass and their partially return to the forest floor by a base cation-rich litter fall. The base cation sequestration into the tree biomass is associated with a mineral soil acidification (“bio-acidification”) [29,30] as long as the assimilated cations are not released to the upper soil horizons by litter degradation [11,31]. Contrarily, the annual litter fall at deciduous stands contributes to higher forest floor pH values [32] and an enhanced organic matter turnover compared to coniferous reference stands [32,33,34,35]. As observed for German and Austrian forest stands, a recovery from acidification appears depth-depended, with increasing pH in the forest floor and upper soil horizons [10,20], whereas the deeper mineral soil remains acidified [20,36]. For Switzerland [37] no signs of a recovery resulting from decreasing acid depositions in mineral forest soils were found, whereas the trend on the European scale is non-uniform and appears to depend on the base saturation stage of investigated soil profiles [38]. In Central Europe, the conversion of Norway spruce (Picea abies L.) and Scots pine (Pinus sylvestris L.) forests into mixed forests is one primary aim of a sustainable forestry [39] and is assumed to mitigate the atmospheric input of eutrophying and potentially acidifying compounds to forest soils [26]. A major goal is the avoidance of unstable and disturbance-prone forest ecosystems with a decreasing forest vitality [4,12] under a changing climate with higher risks to drought and storm events in Central Europe [40,41]. Related aims for a forest conversion, for example with European beech, are numerous and include the improvement of soil functionality as expressed by the soil chemical and macronutrient status [42].
In the early 20th century, small groups (<1000 m2) of European beech were planted, within Norway spruce- and Scots pine-stands (CS), across Central Germany to mitigate soil acidity stress (e.g., H+ and Al toxicity or Mg2+ deficiency) under pure coniferous stands [43] and to improve decomposition processes in the respective forest floors [36,44]. The beech plantings were called “Grüne Augen” in German, hereinafter “Green Eyes” (GE). GE, established on former forested coniferous areas, offer the rare possibility of examining long-term forest conversion effects on soil functionality and associated ground vegetation communities without the influence of other soil-forming factors [36]. Since the understanding of forest soil chemical and macronutrient status is essential for the evaluation of forest conversion approaches, our study investigated important macronutrient pools and fluxes after about > 80 years of stand development at GE and CS.
The aim of our study was to compare input and output fluxes of N, S, Ca2+, Mg2+, and K+ as well as the macronutrient stocks in forest floor and mineral soil at GE and CS, both subjected to moderate N depositions and decreasing mineral soil pH under acidic soil conditions. A further aim of this study was to identify the driving factors, internal (e.g., tree uptake) and external (e.g., air pollutant depositions), that are currently causing soil acidification. We investigated whether coniferous and deciduous forest stands differ in the explanatory processes and which factors favor or delay a soil recovery from acidification under declining atmospheric deposition of acidifying air pollutants.
2. Materials and Methods
2.1. Study Area
The study area (Figure 2, Table 1) is located in Eastern Thuringia (Thuringian Holzland, Central Germany) and the geological bedrock consists of quartz-rich lithologies [45] of the Triassic and Quaternary, which mainly comprises sandstones and silt-mud-stones (East Thuringian Buntsandstein Territory) [46]. Detailed site descriptions and pictures of the study sites are given in a previous study [36].
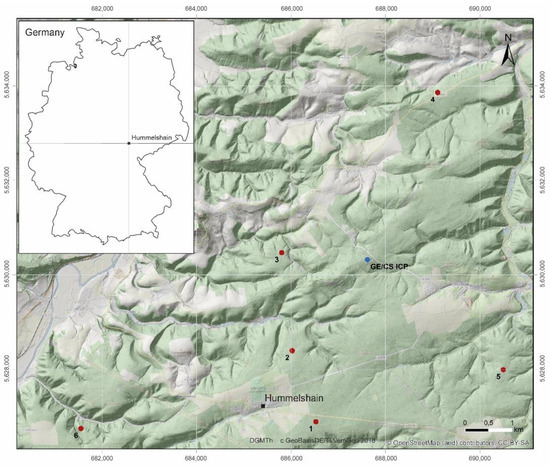
Figure 2.
Location of the study area “Hummelshain” in Eastern Thuringia in Central Germany with the locations of the different exploration sites (red points, GE-CS pairs, 1–6) and the monitoring site (blue point, GE/CS ICP). GE: Groups of European beech within stands of Norway spruce and Scots pine (CS).

Table 1.
Basic characteristics of investigated sites in Thuringia, Germany. GE: Groups of European beech within stands of Norway spruce and Scots pine (CS).
2.2. Forest History and Stand Description
In 2018, the mean stand age of the investigated beech groups was 82 years, whereas the surrounding coniferous stands were approximately 77 years old (Table 2). The younger age of CS arises from timber harvest of former coniferous stands during and after the Second World War. The clear-cut areas around the emergent GE stands, which were planted in the 1930s, were immediately replanted with spruce and pine.
Table 2.
Stand description. GE: Groups of European beech within stands of Norway spruce and Scots pine (CS).
For this study, plot-pairs each consisting of a European beech plantation of 800–1000 m2 in size and the surrounding forest stands of Norway spruce and Scots pine (mainly mixtures of both species, Table 2), were investigated. The CS plots were selected with regard to comparable site conditions (topography, geology, soil development), macronutrient status, water availability, and forest management (Table 1). One plot-pair (GE/CS ICP) forms part of the Level II Intensive Monitoring network of ICP Forests Programme (International Co-operative Programme on Assessment and Monitoring of Air Pollution Effects on Forests) and is operated by the Thuringian State Forestry Institution (ThüringenForst) since the early 2000s. The GE/CS ICP plot-pair serves as a monitoring site, which provides exemplary information on the hydrology and water-bound element fluxes and complements the investigation of further input–output fluxes and pools of the forest macronutrient cycle, which were investigated at the exploration sites GE/CS 1–6. We assume that patterns in the different parts of the element cycle were transferable between the six exploration sites and one monitoring site due to strong similarities concerning the site and forest stand conditions of the respective GE or CS. In the cases of three sites, the soil of both the GE and CS was limed (CaCO3 with 30% MgCO3). This was done in 1988/1989 at site 2 and 4, in 1993 at GE/CS ICP and in case of site 4 again in 2007 [36,48].
Forest yield classes of the investigated tree stands (Table 2) were determined in 2018 [36,49]. Leaf area index (LAI), solar direct (DirRad [MJ m−2 yr−1]), and solar diffuse (DifRad [MJ m−2 yr−1]) radiation below the tree canopy were quantified at the exploration sites using the equipment of Hemiview (Delta-T devices Ltd., Cambridge, UK). The measurements were carried out at five representative points on each plot (GE/CS 1–6) under conditions of diffuse skylight at twilight in summer 2019, when deciduous trees were full in leaf. Digital hemispherical photos were taken with a fisheye lens attached to a digital camera (Canon EOS 70 D, Canon Inc., Tokyo, Japan) clamped in a self-levelling camera mount (Delta T Devices Ltd., Cambridge, UK). The camera mount was oriented to magnetic north at 1.3 m above ground level on a tripod. The camera settings followed the manufacturer’s recommendations (Delta T Devices Ltd., Cambridge, UK). Canopy cover pictures were processed (minimum algorithm, blue color plane) in ImageJ [50] using the plugin Hemispherical 2.0 [51].
2.3. ICP Forests Monitoring between 2001–2018
The bulk deposition data analyzed in this study, originated from measurements (pooled samples of 5 precipitation collectors) under the framework of the ICP Forests Intensive Monitoring Programme (Level-II) at a cleared area (non-forested, UTM 32 U: 687560/5630027) at 250 m distance to the monitoring plot-pair GE/CS ICP. The deposition of NH4-N, NO3-N, Norg, SO4-S, and base cations was determined according to the ICP Forests [54] protocol. Throughfall deposition of N and S compounds and base cations at GE/CS ICP was measured using pooled samples from 20 throughfall collectors in summer time and 10 collectors in winter (100 cm2 sampling area), respectively. Stemflow was collected for European beech at GE ICP in compliance with the guidelines of the Level-II-program [54]. Soil solution was collected at GE/CS ICP at the interface between forest floor and mineral soil (zero-tension plate lysimeters to collect forest floor solution), within the rooting zone in mineral soil (at 20 cm and 50 cm depth; 5 suction cups each) and below the rooting zone (100 cm depth; 5 suction cups) with tension lysimeters. Soil solution chemistry (pH, electrical conductivity (EC), ion concentrations) was determined following the standard protocols given in ICP Forests [54]. The biweekly deposition and solution data (2001–2018) were provided by the Thuringian State Forestry Institution (ThüringenForst FFK, Gotha, Germany). Critical loads for N (CLeutN) and S (CLmaxS) at GE/CS ICP were calculated as mass depositions by [55] using the simple mass balance equation for managed woodland habitats [56] to allow for comparison with measured fluxes and investigated macronutrient pools.
2.4. Vegetation Survey
Forest vegetation (tree, shrub, herb, and bryophyte layer) was assessed according to Braun-Blanquet [57] in June 2016 at the exploration sites [36]. If possible, the elongated length of flowering and non-flowering shoots of 15 individuals of each herbaceous plant species were measured to calculate their mean shoot length (cm). The relationship between plant species biomass, cover, and mean shoot length was used to estimate macronutrient stocks for 13 morphological growths groups (see Section 2.7.1) [52,58].
2.5. Litter Fall, Forest Floor, and Soil Sampling
To quantify annual litter fall, litter collectors with an area of 616 cm2 were installed in February 2016 in five replicates at each exploration plot. Litter was collected quarterly over one year until March 2017. The base of the litter traps was perforated allowing the litter to dry rapidly after rainfall. We therefore assumed that litter decomposition within the collectors was reduced to a negligible level.
In April 2018, forest floor was sampled in seven spatial replicates for each of the exploration plots. Humus classification was done according to Zanella, et al. [59] in accordance to the German standard protocol [60] and each forest floor replicate was morphologically divided into characteristic diagnostic horizons (Oi, Oe, Oa) [59]. Soil types were classified according to the Ad-Hoc-AG-Boden [61] and converted to WRB [62] nomenclature at representative soil pits from an earlier study [63]. Soil samples from three depth increments (0–10 cm, 10–20 cm and 20–40 cm) were taken by a soil corer (diameter 5.3 cm) at the same locations of forest floor sampling.
2.6. Laboratory Methods
The collected litter samples were oven-dried at 50 °C to constant weight and bulked to annual samples across the sampling dates per litter trap. The annual litter samples were sorted for leaves of beech, needles, bark, small twigs, reproductive parts (beechnuts, beech husks, cones), fine material (bud scales, flowers), and miscellaneous components. Non-plant components were discarded. The litter fractions considered in our study correspond to 79.8% (GE) and 76.1% (CS) of the total annual litter fall in the respective forest stands (we disregarded the fine material and the litter related to the admixed tree species). The dry-weight of each litter fraction was determined and the sorted samples were shredded separately to a final particle size < 5 mm. The oven-dried material (50 °C) of the Oi, Oe, and Oa layers was shredded to a final particle size < 5 mm. The mineral soil was oven dried (50 °C) and passed through a 2-mm sieve. An aliquot of the obtained fine forest floor material and fine-earth samples, respectively, was used to measure pH (WTW pH/Cond 340i with SenTix 41-3, Weilheim, Germany) and electrical conductivity (WTW pH/Cond 340i with TetraCon 325, Weilheim, Germany) in deionized water according to DIN ISO 10390:2005–12. Soil texture was determined on fine-earth samples by a Laser Particle Sizer (Particle Sizer LS 13,320–Laser Diffraction Particle Size Analyzer, Beckman Coulter, Brea, CA, USA).
For elemental analysis, an aliquot of each litter- (leaves, needles, beechnuts), forest floor- (Oi, Oe, Oa), and mineral soil- (0–10 cm, 10–20 cm, and 20–40 cm depth increments) sample was pulverized to 0.04 mm (Mixer Mill MM200 Retsch, Hahn, Germany) and analyzed for total N and S contents (CNS-analyser, vario EL cube, elementar, Langenselbod, Germany). The concentration of base cations in pulverized samples was determined after microwave digestion (ETHOS 1; Milestone S.r.l., Milano, Italy) in aqua regia-extracts by inductively coupled plasma optical emission spectrometry (725 ICP-OES system; Agilent Technologies, Santa Clara, CA, USA).
Macronutrient stocks of the different litter fractions were calculated by multiplying element contents and the dry mass weight of each litter fraction. Macronutrient contents of beech leaves and needles (pine and spruce) were measured plot-specific per litter collector, whereas contents of reproductive parts were based on measured data for beechnuts as well as literature values for beech husks and cones [64,65]. Macronutrient stocks of twigs and bark were calculated by multiplying the measured dry mass of the litter components and element contents based on literature values [66]. The assumptions made, are accessible in Table S1. Macronutrient stocks of single forest floor layers were calculated by multiplying element contents and the dry mass of the respective layer. The dry mass was determined by weighting the oven-dried forest floor material (sampled in a defined area of 255 cm2) after sorting out living roots. Macronutrient stocks per mineral soil depth increment were calculated based on the fine-earth fraction (<2 mm) by multiplication of element contents and fine-earth stocks (determined by weighting the oven-dried mineral soil of each subsample, sampled in a defined area of 22.1 cm2).
2.7. Data Analysis
2.7.1. Vegetation Data
Mean weighted (by coverage) ecological indicator values (EIV) for nutrient availability/eutrophication (N), soil reaction (R), and light (L) were calculated according to Ellenberg, et al. [67]. To predict the herbaceous aboveground biomass and macronutrient stocks of the herbaceous layer of GE and CS plots, we used the estimation model PhytoCalc 1.4 [52,58]. The estimations by PhytoCalc have been validated in independent studies for several German forest types [68,69,70]. The model is based on data from biomass harvests of 46 plant species of deciduous and coniferous forests and uses the relationship between plant species biomass, cover, and mean shoot length to estimate macronutrient stocks for 13 morphological growth groups [52,58]. We assigned the herbaceous plant species (vegetation survey in 2016) to that groups (Table S2) and estimated herbaceous layer biomass (dry matter; kg ha−1) as well as macronutrient stocks for each exploration plot (GE/CS 1–6) using the growth group-specific functions of PhytoCalc 1.4.
The aboveground-tree-biomass and macronutrient stocks of the whole-tree (∑ small wood, stemwood, and bark) of European beech (GE 1–6) and Scots pine or Norway spruce (CS 1–6) were estimated using the relationship of the respective forest stand age according to yield tables [53,60]. The predicted annual macronutrient uptake into stemwood and bark was calculated in accordance with Schlutow and Ritter [55] only for the intensively monitored plot-pair GE/CS ICP. The macronutrient uptake resulted from the derived annual tree increment [55], multiplied by the element contents of stemwood and bark based on De Vries et al. [71] and Jacobsen et al. [72].
2.7.2. Litter Fall, Soil Solution, Forest Floor, and Mineral Soil Data
Total forest floor stocks (dry matter and macronutrients) were analyzed as the sum of the Oi, Oe, and Oa layer stocks per exploration site and total mineral soil stocks were calculated as the sum of the single depth increment stocks per site. Correlations between macronutrient concentrations (NO3−, SO42−, K+, Ca2+, Mg2+), pH, and electrical conductivity in seepage water of forest floor and mineral soil at the plot-pair GE/CS ICP were analyzed using generalized pairs plots (Pearson correlation) in the R statistical environment, R 3.6.0 [73] with contributed package GGally (ggpairs function) [74]. Group wise summary statistics were used in R with the contributed package doBy (summaryBy function) to check litter fall and associated macronutrient return as well as forest floor and mineral soil data for differences between forest types (GE, CS) and sites. Differences in DirRad and DifRad between GE and CS were analyzed using a t-test (package car).
Interactions of forest type were analyzed as fixed effects with linear mixed effect models (LMM) [75] in R [73] with the package nlme [76] with site as random effect. All variables were described as the mean value with standard deviation (SD) or standard error (SE) as derived from the estimates of statistical models. Estimates were generated using emmeans package [77] and the model summary was extracted by stargazer package [78]. Data were checked for normality and homogeneity of model residues and, if necessary, were transformed using log10. The random effect term considers nested sampling within forest floor/soil cores and sites. The final model includes variance heterogeneity among sites and between forest type. Model parameters were estimated by Maximum-likelihood estimation [75,79]. The effect of improvement of random effect structure was tested based on residual plots and on Akaike Information Criteria [80]. The final model estimates (Table S3) were based on Restricted Maximum Likelihood estimates. Marginal and conditional coefficients of determination (r2 m and r2 c) were calculated with the package MuMIn [81].
To predict the annual base cation release from weathering processes in the main rooting zone of the soil matrix, we followed the soil type-texture approximation for non-calcareous soil profiles given in CLRTAP [56]. This method is based on the plot-specific soil texture and parent material (combination of both into a weathering rate class), the depth of the main rooting zone and the mean annual temperature [82]. The assignments made, are accessible in Table S4. As conversion factors between equivalent and molar mass we used: 0.02004 (Ca2+), 0.01215 (Mg2+), and 0.0391 (K+). Forest stand input–output balances for Ca2+, Mg2+, and K+ were calculated for GE and CS regarding important pathways of forest macronutrient cycling (e.g., extrapolated deposition, litter fall, estimated weathering release, and estimated tree uptake).
2.7.3. Fractional Annual Losses and Macronutrient Residence Time in Forest Floor
The fractional annual loss (FAL) or turnover rate of forest floor material was estimated after Olson [83] and Hobbie, et al. [84] per exploration plot based on the ratio between litter fall and forest floor mass under the assumption that the forest stands are in steady state (annual decomposition equals annual litter input; Vesterdal, et al. [85]). Although steady state assumptions in ecosystems can be prone to errors, the calculation of fractional annual losses still provides a useful indicator for comparative purposes of the fraction of material that leaves the forest floor pool. The investigated stands of GE and CS have already reached canopy closure in the late 1990s [86] and nearly steady state conditions were assumed due to relative constant litter fall data of the monitoring plot CS ICP ranging between 2750–3050 kg ha−1 for the years 2006–2010, except 2007 (caused by the European windstorm Kyrill). Fractional annual losses at CS were estimated for continuous litter fall by Equation (1) and in the case of GE for discrete litter fall in autumn by Equation (2) [85]. L is the dry mass of annual litter fall (kg ha−1 yr−1) and F is the dry mass of total forest floor material (∑ Oi, Oe, Oa) (kg ha−1 yr−1). The residence time is the inverse of fractional annual losses.
k1 = L/F
k2 = L/(L + F)
Subsequently, based on the macronutrient stocks of the analyzed litter fractions, we estimated fractional annual losses and residence time of N, S, Ca2+, Mg2+, and K+ stored in total forest floor per plot (GE/CS 1–6) referred to Equations (1) and (2) in case of continuous litter fall and discrete litter fall according to Cole and Rapp [87], Likens, et al. [88], and Hansen, et al. [89] by Equations (3) and (4). Lx is the annual amount of litter fall of element x (kg ha−1 yr−1) and Fx is the amount of element x in total forest floor (kg ha−1 yr−1). Because the analyzed litter fractions cover 79.8% of annual total litter fall at GE and 76.1% at CS, it is therefore possible that we slightly underestimated the fractional annual losses of macronutrients from forest floor in this study.
k1 x = Lx/Fx
k2 x = Lx/(Lx + Fx)
3. Results
3.1. Macronutrient Fluxes at the Monitoring Sites in Bulk Precipitation, Throughfall, and Stemflow between 2001–2018
Hydrological data recorded between 2001 and 2018 exhibited that throughfall at GE ICP amounts to 76% and at CS ICP to 65% of mean annual bulk precipitation (680 ± 141 mm), causing an annual interception loss of 24% (GE ICP) and 35% (CS ICP). Total nitrogen (∑ NH4-N, NO3-N and Norg) depositions in bulk precipitation remained relatively constant at a moderate level of 6.8 ± 0.9 kg ha−1 yr−1 since 2011 (Figure 3A). The throughfall Nt flux between 2001 and 2018 decreased (−4.2 kg ha−1) for GE ICP, whereas it slightly increased (+1.4 kg ha−1) for CS ICP. The forest-type-specific critical loads for N (CLeutN; kg ha−1 yr−1) were exceeded for throughfall fluxes over the whole investigation period at CS ICP but not after 2012 at GE ICP. The mean flux of Nt in stemflow (GE ICP) decreased over time (Figure 3C). Mean bulk precipitation Nt fluxes were mostly composed of NH4-N and NO3-N in equal parts until 2008, turning into a slight dominance of NH4-N afterwards. As shown in Figure 3, throughfall Nt fluxes at GE ICP as well as at CS ICP were dominated by NO3-N (GE ICP: 51.5%; CS ICP: 49.2% of Nt), followed by NH4-N (GE ICP: 32.7%; CS ICP: 38.9%). The mean annual throughfall Nt flux was 43% higher at CS ICP (18.4 ± 1.7 kg ha−1 yr−1) compared to GE ICP (12.9 ± 2.6 kg ha−1 yr−1) (Figure 3E,G). The SO4-S fluxes (bulk precipitation and throughfall at GE/CS ICP) decreased clearly over time by a third to a half and even by 92% in stemflow of GE ICP (Figure 3A,E,G). Although the throughfall SO4-S flux in 2001 at CS ICP was still 32% higher than at GE ICP, it decreased sharper over time and reached similar levels of about 3.6 kg ha−1 yr−1 at GE and CS since 2015 (Figure 3E,G). The forest-type-specific critical loads for S (CLmaxS; kg ha−1 yr−1) were clearly below the thresholds considering throughfall fluxes (Figure 3). In summary, there was a higher annual input of N and S compounds at CS ICP than at GE ICP between 2001–2018 with 67.4% more NH4-N (4.3 to 7.2 kg ha−1), 36.4% more NO3-N (6.6 to 9.0 kg ha−1), 10.0% more Norg (2.0 to 2.2 kg ha−1), and 20.9% more SO4-S (4.3 to 5.2 kg ha−1). At GE ICP an additional annual input of in average 0.4 kg ha−1 NH4-N, 0.6 kg ha−1 NO3-N, 0.3 kg ha−1 Norg, and 0.7 kg ha−1 SO4-S must be taken into account due to stemflow fluxes (Figure 3C). Nevertheless, total input of N and S compounds was even higher at CS ICP.
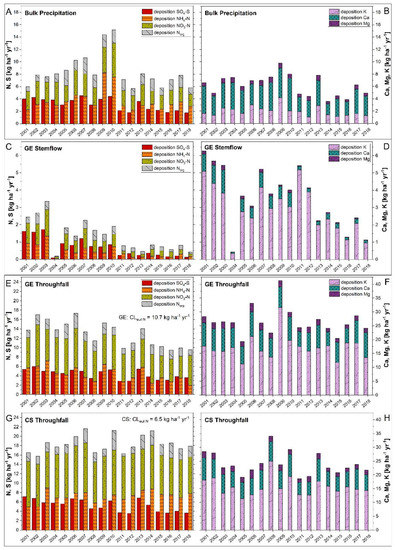
Figure 3.
Deposition patterns of NH4-N, NO3-N, Norg, SO4-S and base cations (K+, Ca2+, Mg2+) of bulk precipitation (A,B), stemflow (C,D), and throughfall (E–H) within the forest hydrological cycle at the plot-pair GE/CS ICP between 2001 and 2018. The site was observed in the framework of the ICP Forests Intensive Monitoring Programme (Level-II; ThüringenForst). Forest-type-specific critical loads [17] for eutrophying nitrogen (CLeutN; kg ha−1 yr−1) and acidifying sulfur (CLmaxS; kg ha−1 yr−1) were calculated after the simple mass balance model [55,56]. Total N-depositions in throughfall reach ecological relevant values (CLeutN is exceeded mostly before 2012 for GE and is exceeded in the whole investigation period for CS), whereas SO4-depositions are permanently clearly below the CLmaxS (GE CLmaxS: 17.5 kg ha−1 yr−1; CS CLmaxS: 26.0 kg ha−1 yr−1). GE: Groups of European beech within stands of Norway spruce and Scots pine (CS) near Hummelshain (Thuringia, Central Germany).
Total base cation (∑ K+, Ca2+, Mg2+) deposition via bulk precipitation decreased since 2001 to a level of 4.9 kg ha−1 in 2018 (Figure 3B). The yearly throughfall fluxes of base cations decreased for GE ICP (−4.1 kg ha−1) as well as for CS ICP (−6.7 kg ha−1) (Figure 3). Stemflow base cation fluxes of GE ICP also showed a decreasing trend (−5.1 kg ha−1). Annual fluxes of base cations in bulk precipitation were mostly composed of Ca2+ and to a lesser extent of K+ and Mg2+ (Figure 3B). The throughfall fluxes of GE ICP as well as of CS ICP were dominated clearly by K+ (64.9% and 65.0%), followed by Ca2+ (27.9% and 26.7%) and Mg2+ (7.2% and 8.3%). The throughfall and stemflow base cation flux (2001–2018) was slightly higher at GE ICP (30.1 ± 5.3 kg ha−1) than at CS ICP (24.0 ± 4.2 kg ha−1).
3.2. Solution Chemistry at the Monitoring Sites
3.2.1. pH and Electrical Conductivity
The bulk precipitation (2001–2018: pH 5.8 ± 0.4) was classified as moderately acidic [90], as well as the stemflow of GE ICP (pH 5.6 ± 0.4; Table 3). The pH of throughfall solution was slightly acidic (GE ICP) and strongly acidic (CS ICP) (Table 3). While forest floor seepage water showed no differences in pH between GE ICP and CS ICP (pH < 4.4 ± 0.4), mineral soil solutions of GE ICP (slightly decreasing with depth) were less acidic with 34.2% (20 cm), 17.1% (50 cm), and 14.6% (100 cm) higher pH values compared to CS ICP (Table 3). The electrical conductivity of throughfall between 2001–2018 at GE ICP was 32% lower compared to CS ICP, while the electrical conductivity of forest floor seepage water was similar between GE ICP and CS ICP (electrical conductivity < 84.2 ± 21.6). Differences between the forest type became apparent with depth (up to 65–79% lower electrical conductivity values at GE ICP than at CS ICP), especially below the rooting zone (100 cm depth; Table 3).
Table 3.
Solution data (amount, pH, electrical conductivity) of bulk precipitation, stemflow (GE) and throughfall (GE and CS) as well as seepage water of forest floor and mineral soil (20 cm, 50 cm and 100 cm depth) at the plot-pair GE/CS ICP between 2001 and 2018. The site was observed in the framework of the ICP Forests Intensive Monitoring Programme (Level-II; ThüringenForst). GE: Groups of European beech within stands of Norway spruce and Scots pine (CS) near Hummelshain (Thuringia, Central Germany).
3.2.2. Macronutrient Concentrations in Forest Floor and Soil Solution between 2001–2018
The NO3− concentration of GE ICP cascaded downwards with highest values in forest floor (2.8 µmolc L−1) and lowest at 100 cm depth (1.8 µmolc L−1). NO3− only reached a level of 0.4–2.7% of the SO42− concentration at GE ICP, which showed an increasing concentration with depth with highest concentrations (100 cm: 491.9 µmolc L−1) below the main rooting zone (Figure 4A). Compared to GE ICP, the seepage water of CS ICP was characterized by up to sixfold higher NO3− concentrations (except of 20 cm depth with slightly higher concentrations at GE ICP). NO3− concentrations at CS ICP were highest in forest floor and lowest at 20 cm depth with increasing concentrations from 50 cm to 100 cm depth. Nevertheless, the NO3− concentration at CS ICP was small compared to SO42− (forest floor: 14.9%, mineral soil: 0.2–0.3% of the SO42− concentration). SO42− at CS ICP showed lowest concentrations in forest floor (115.4 µmolc L−1) and highest at 100 cm depth (3672.0 µmolc L−1) (Figure 4B). The mineral soil depth trend in SO42− concentration of CS ICP was similar to GE ICP, but the SO42− concentration was five to sevenfold (755–3672 µmolc L−1) higher at CS ICP (Figure 4A,B). High SO42− concentrations in the mineral soil solution of CS ICP were mainly caused by the time period between 2001–2010 (mostly > 1000 µmolc L−1), whereas a decrease in SO42− concentrations was observable between 2011–2018 (mostly < 1000 µmolc L−1) (Figure S1). For GE ICP, no clear trend was noticeable over time for NO3− or SO42− mineral soil solution concentrations (Figure S1).
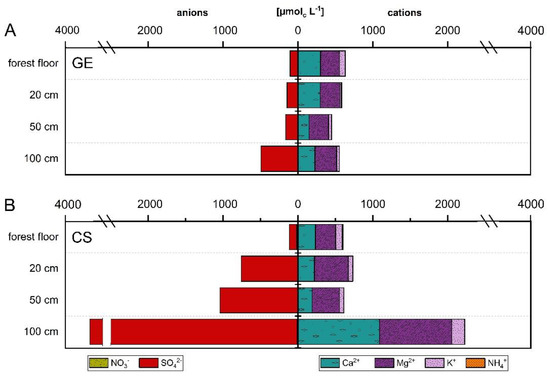
Figure 4.
Depth patterns in macronutrient concentration (µmolc L−1) of forest floor and soil solution (20 cm, 50 cm, 100 cm depth) divided into anions (NO3−, SO42−) and cations (NH4+, K+, Ca2+, Mg2+) at the plot-pair GE/CS ICP. (A): GE; (B): CS. The rooting zone of main tree species covers a depth of 70 cm (GE) and 55 cm (CS) [47]. Nitrate (GE: < 3.5 µmolc L−1; CS: < 17.2 µmolc L−1) and ammonium (GE: < 7.4 µmolc L−1; CS: < 12.6 µmolc L−1) concentrations are low and not feasible. The site was observed in the framework of the ICP Forests Intensive Monitoring Programme (Level-II; ThüringenForst). GE: Groups of European beech within stands of Norway spruce and Scots pine (CS) near Hummelshain (Thuringia, Central Germany).
Mean total base cation concentrations in seepage water of forest floor and mineral soil at GE ICP stayed predominantly constant with depth (ranging between 446.0–632.0 µmolc L−1) and showed highest concentrations in forest floor solution (Figure 4A). Contrary to GE ICP, base cation concentrations in seepage water of CS ICP were lowest in the forest floor solution, followed by slightly increased concentrations in the upper mineral soil and threefold higher total base cation concentrations (2224.0 µmolc L−1) below the rooting zone at 100 cm depth (Figure 4B). This increase in mineral soil solution at CS ICP was highest for the Ca2+ concentration, which was nearly sixfold higher at 100 cm than at 50 cm depth (Figure 4B). Compared to GE ICP, the concentration of base cations was similar at CS ICP in forest floor and upper mineral soil solution (20–50 cm depth). At 100 cm depth, concentrations were threefold higher for Mg2+ and up to nearly five times higher for K+ and Ca2+ at CS ICP (Figure 4). The base cation concentrations in mineral soil solution at GE/CS ICP showed lower concentrations in the last decade (Figure S1). High total base cation concentrations in seepage water were mainly caused by the time period between 2001–2009/10 (mostly > 600 µmolc L−1), whereas afterwards a decrease was observable (mostly < 600 µmolc L−1) (Figure S1).
Total base cation concentrations in seepage water between 2001–2018, showed a negative—but insignificant—correlation with NO3− concentrations (Figures S2–S5, except for GE at 100 cm depth). They were significantly positive correlated at most depth increments with SO42− concentrations, especially in mineral soil of CS ICP (Figures S2–S5). At CS ICP and GE ICP, electrical conductivity (GE ICP: r > 0.696 and CS ICP: r > 0.766) was significantly (p < 0.01) positively correlated with base cation concentrations (primarily Ca2+ and Mg2+) as well as SO42− concentrations (Figures S2–S5). SO42− concentrations correlated negatively with pH of forest floor and soil solution at GE ICP and CS ICP (Figures S2–S5, except for GE at 20 cm depth). Positive correlations between SO42− and the sum of K+, Ca2+, and Mg2+ concentrations in mineral soil were stronger for CS ICP (r = 0.948–0.979) than for GE ICP (r = 0.288–0.937). They were mainly caused by Ca2+ and Mg2+, whereas K+ concentrations showed no clear trend and were even negatively correlated with SO42− concentrations (e.g., GE ICP: 20 cm and 50 cm depth).
3.3. Canopy Characteristics and Litter Fall at the Exploration Sites
The investigated forest stands exhibited closed canopies conditions in the late 1990s, resulting in a dense foliage cover in 2018, especially for GE. Mean weighted (by coverage) ecological indicator values for light classified the CS as partly shaded and the GE as shady. The leaf area index (LAI) and the related solar direct (DirRad [MJ m−2 yr−1]) and solar diffuse (DifRad [MJ m−2 yr−1]) radiation below the tree canopy showed, that brighter conditions occurred at CS (Table 2). During the growing season DirRad (t F: 37 = 4.9, p < 0.001) was significantly lower at GE (474 ± 171 MJ m−2 yr−1) than at CS (925 ± 470 MJ m−2 yr−1), as well as DifRad (t F: 57 = 8.9, p < 0.001), which was significantly stronger at CS (283 ± 51 MJ m−2 yr−1) than at GE (133 ± 74 MJ m−2 yr−1).
The total annual litter fall at GE was dominated by beech leaves (43.7%), beech husks (20.7%) and beechnuts (10.8%), whereas twigs and bark had only a minor proportion (dry matter; Figure S6). At CS, total annual litter fall was mainly composed of needles of Scots pine and Norway spruce (33.9%), followed by cones (27.3%), twigs (9.8%), and bark (5.1%). Based on the analyzed litter, the annual input of organic matter via litter fall at GE (5.47 Mg ha−1) was twice as high as at CS (2.67 Mg ha−1) (p < 0.0001; Table S3). The annual macronutrient return at GE exceeded double or threefold the input at CS for Ca2+ and N and was even five to six times higher for K+ and S (p < 0.0001; Figure S7). These patterns occurred at all investigated sites. The limed plots (GE/CS 2, GE/CS 4) showed no anomalies, except a slightly higher base cation litter flux at CS 4. The macronutrient input fluxes to forest floor via litter fall at GE were highest for N (61.7 ± 5.0 kg ha−1 yr−1) and descended in the order N > Ca2+ > K+ > S > Mg2+ (CS: N with 16.9 ± 1.4 kg ha−1 yr−1 > Ca2+ > K+ > Mg2+ > S). Most of the nitrogen returned through leave litter (53%) and reproductive parts (46%) at GE as well as through needle litter fall (79%) at CS (Table S5). Foliar litter fall (leaves or needles) turned out to be the main pathway for litter base cation return at GE (>59%) and at CS (>66%) (Table S5). Reproductive parts were important for Ca2+ (15.8% of considered litter fall Ca fluxes), Mg2+ (31.1%) and K+ (39.3%) fluxes at GE (Table S5).
3.4. Macronutrient Stocks in Tree and Herb Layer Biomass, Forest Floor and Mineral Soil at the Exploration Sites
The predicted above-ground biomass of the whole-tree was higher at GE than at CS (Table 2). European beech stored more N in above-ground biomass than the coniferous tree species (median GE: 559 ± 286 kg ha−1; median CS: 368 ± 137 kg ha−1), while predicted whole-tree S stocks were on a similar level for GE and CS (Table S6). On average, the predicted total base cation stocks in above-ground biomass were higher for GE, but they varied with site (Table S6). The predicted whole-tree stocks of Ca2+ were similar in both forest types, but predicted K+ and Mg2+ storage was higher for GE (Table S6). The share of K+ (GE: 43.9%; CS: 35.0%) in total base cation stocks was almost as big as the share of Ca2+ at GE (GE: 45.6%; CS: 55.5%). GE stored proportionally more K+ in above-ground biomass than CS, whereas Ca2+ storage was higher at CS.
In most GE, ground vegetation was missing or consisted of only a few species in the herbaceous layer with a low biomass (GE: 3.7 kg ha−1; CS: 245.1 kg ha−1). At CS, the predicted above-ground biomass of the herbaceous layer was 0.11% of the predicted tree biomass, whereas at GE, the proportion was substantially lower (0.01%). Thus, the predicted macronutrient storage in the herbaceous layer was considerably higher at CS (Table S6). The predicted herbaceous layer base cation stocks of GE as well as of CS were dominated by K+ (GE: 70.0%; CS: 75.5%).
The cumulative forest floor organic matter stock (∑ Oi, Oe, Oa) at GE (51 ± 7 Mg ha−1) was half of the stock of CS (104 ± 14 Mg ha−1) (p < 0.0001; Figure S8). The same was hold true for forest floor N stocks (GE: 641 ± 89 kg ha−1; CS: 1358 ± 188 kg ha−1; p < 0.0001), whereas S stocks were nearly threefold higher at CS (GE: 57 ± 8 kg ha−1; CS: 157 ± 23 kg ha−1; p < 0.0001) (Table S6). Forest floor stocks of Ca2+, Mg2+, and K+ were higher at CS, following the trend of dry matter stocks (Table S6). Forest floor base cation stocks were highly affected by the site (Table S6). Omitting the limed exploration plots (GE/CS 2, GE/CS 4), forest floor Ca2+ and Mg2+ stocks of the un-limed plots were slightly higher at GE than at CS (Table S6). There were no differences between the forest types for mineral soil macronutrient stocks (∑ 0–10 cm, 10–20 cm, 20–40 cm) (Tables S6 and S7; Figure S8). Furthermore, they showed no clear trend between the different sites, except at the limed plots (GE/CS 2, GE/CS 4), which were characterized—contrary to the trend in mineral soil nitrogen stocks—by higher N stocks at GE (Table S6).
3.5. Forest Floor Organic Matter Turnover and Related Macronutrient Residence Time at the Exploration Sites
The calculated turnover rates (k) of forest floor organic matter (Table S8) were higher for GE with a mean k value of 0.09 (0.09 ± 0.02 yrs−1) and smaller for CS with k < 0.03 (0.03 ± 0.01 yrs−1) (p < 0.01). The related fractional annual losses of N (p < 0.0001) and base cations (p < 0.01) stored in the forest floor showed a similar trend with nearly three to six times higher loss rates at GE (Figure S9). The turnover of S was even 14 times higher at GE (but differs stronger with site than the other nutrients; Table S8; p < 0.0001). The mean residence time for forest floor material and macronutrients was < 13 years at GE and lasted longer (>21 years) at CS (Table S8; Figure S9). The high residence time for S at CS was mainly affected by the site and caused by forest floor organic matter stocks (Table S9). Organic matter and macronutrients were retained nearly three times longer at CS 1, CS 2, and CS 6 than at the other coniferous sites. The respective sites were classified as the wettest (CS 1/2; seasonal wet) or the driest (CS 6; moderately dry) sites [36]. The accumulation of organic matter and related S stocks (and other macronutrients) at these sites was highest in the Oe and Oa horizons (Table S9). In general, dry matter stocks of Oi and Oa at CS were at a similar magnitude than at GE, but mean Oe DM stocks at GE were quite different with half of the stock of the CS (GE Oe: 23.0 ± 5.8 kg ha−1; CS Oe: 54.6 ± 13.6 kg ha−1).
3.6. Predicted Weathering Rate, Predicted Tree Uptake, and Input–Output Balances
The predicted annual base cation release from weathering processes in the main rooting zone of the soil matrix was similar between the forest types (Table S10). Nevertheless, slightly higher amounts of base cations—dominated by K+—were released at GE (median: 21 ± 5 kg ha−1 yr−1) compared to CS (median: 17 ± 6 kg ha−1 yr−1). The estimated annual macronutrient uptake into tree stemwood and bark at the monitoring plot-pair GE/CS ICP, showed a twofold higher N (GE: 6.9 kg ha−1 yr−1; CS: 3.4 kg ha−1 yr−1) and an up to threefold higher base cation uptake at GE than at CS (Table S10). The uptake was higher for Ca2+ and K+ than for Mg2+ (Table S10).
Forest stand input–output balances for N, Ca2+, Mg2+, and K+ indicated, that tree macronutrient uptake at GE and CS was balanced by mean annual deposition (throughfall and stemflow), mean annual weathering of soil matrix and especially yearly macronutrient return via litter fall (Table S10). In case of Ca2+, balances considering the input due to deposition or weathering and the output via tree uptake were negative for GE (Table S10). Nevertheless, in summary the approximately calculated budget was positive for N, Ca2+, Mg2+, and K+ at GE and CS, indicating growing macronutrient pools, especially in forest floor and topsoil. Due to missing seepage fluxes, the possible macronutrient storage can be overestimated, although forest floor and mineral soil solution data (e.g., depth patterns in macronutrient concentration) showed no pronounced leaching losses.
4. Discussion
4.1. Moderate N Deposition at GE and CS
Results from joint European monitoring programs [15,91] and other studies [12] express concern, that moderate to high N bulk depositions still threaten soil chemistry and quality, alter herbaceous flora and may lead to declines in forest productivity. Since 2011, Nt bulk deposition in the studied area was relatively constant at a moderate level of 6.8 ± 0.9 kg ha−1 yr−1. The higher mean annual throughfall Nt deposition between 2001–2018 at CS ICP can be explained by the stronger filtering effect of coniferous canopies [32] and throughfall at CS is more enriched with N compounds due to canopy exchange processes like the leaching of accumulated deposits or the leaching from internal plant tissues [92,93] than at GE.
Our results offer only little evidence for herbaceous layer diversity losses or distinct mineral soil base cation losses concerning the moderate N bulk deposition at the investigated forest stands. The present study may have a certain validity for Central European forests under comparable climatic, topographic and geological settings as well as under a similar atmospheric deposition and forest history. The GE and CS form part of a contiguous forest area (Thuringian Holzland) and our results are in line with recent studies, which reviewed the influence of N deposition on European forests [3,9,12,94]. There it was reported that low to moderate N bulk depositions (<7–13 kg N ha−1 yr−1) currently do not affect most European forests on a large-scale in terms of tree growth, tree vitality, soil chemistry, or soil water quality [9,94,95,96].
A strong effect of N deposition on the herbaceous layer of GE and CS cannot be exhibited by plant species occurrence or richness as well as ecological indicator values (EIV N). An increase in eutrophication indicators such as Urtica dioica, Galium aparine, and Epilobium angustifolium was limited to CS 4 and not widespread, indicating a response to site-specific regeneration-oriented liming rather than to extensive eutrophication through N depositions. The herbaceous layer plays an important role for the forest ecosystem stability and within the macronutrient cycle, besides its small biomass [7]. The importance for regulating forest ecosystem processes is in detail unknown [97], but the herbaceous layer seems to enhance forest floor organic matter decomposition rates, due to its production of short-lived (often with annual turnover) and easily degradable aboveground biomass [7,98]. Depending on the species composition and the degree of cover, the herbaceous layer can represent a significant source or even a sink of macronutrients (e.g., for moderate or high N deposition) [99]. Most of the GE are characterized by a low to very low predicted herb layer biomass and at some GE the herbaceous layer is even missing (Table 2). Thus, the macronutrient regulatory function is rather low at GE and the predicted nutrient storage in the herbaceous layer is greater at CS (Table S6), expressed, for example, by a 23-fold higher predicted N storage in the herbaceous biomass at CS. Nevertheless, compared to the predicted macronutrient storage in the tree biomass (Table S6), the predicted storage in the herbaceous layer is low and the predicted herbaceous biomass at GE is only 0.01% of the predicted tree biomass and 0.11% at CS, respectively. This proportion is typically higher (~0.1–1%) for northern hemisphere deciduous forests [7], indicating that the herbaceous layer at GE and CS do not exert a strong influence on macronutrient storage (or N retention) there.
4.2. Forest Floor Organic Matter and Macronutrient Turnover
GE are characterized by more bioactive humus forms than CS (mull, moder at GE and moder, mor at CS) [36], underlined by half of the size of forest floor organic matter stocks (Table S6) and despite a litter fall that is twice as high than at CS (Table S10). A low residence time of organic matter and macronutrients, also expressed in higher turnover rates (fractional annual losses; Table S8) at GE, indicate a higher biomass or activity of decomposers and detritivores as well as better decomposition conditions at GE. A less acidic pH in forest floor [36], topsoil, and soil seepage water (Table 3), probably favored the presence of a decomposing soil fauna at GE (e.g., epigeic/endogeic earthworms) [100,101]. The forest type effect can be masked by site as well as forest management, visible in case of the fractional annual loss of organic matter at GE 1, GE 6, and CS 4 (Table S8). GE 1 (Dystric Planosol) is one of the wettest, whereas GE 6 (Podzol) is one of the driest sites and both site conditions may delay decomposition [102], even under deciduous tree species [28]. Conversely, lime applications can favor the organic matter turnover at CS, leading to a higher fractional annual loss similar to that of the GE (Table S8). The degradation of organic matter is diminished at CS, although the amount of light during the growing season is higher at CS (Table 2). The soil-biological activity, as well as the rate of litter decomposition during the vegetation period, is a function of temperature at the local scale [103] and thereby of solar direct radiation below the tree canopy [104]. A lower water supply within the CS (higher mean annual interception loss at CS, Table 3) and a high polyphenol content of the needle litter [105] may hamper turnover at CS. The needle litter is not per se decay resistant, but the biochemical transformations during the decomposition process form novel stable compounds [106], that contribute to recalcitrant forest floor organic matter stocks. In CS, the litter decomposition is expected to be facilitated primarily through microorganisms like fungi or bacteria [102], since the abundance of earthworms at CS might be very low due to soil acidity [33,101]. Coinciding, the annual throughfall Nt flux is increasing at CS and higher than under the canopy of European beech (Figure 3). Knorr, et al. [107] showed, that litter decomposition is stimulated by minor N fluxes (<5 kg ha−1 yr−1), but hampered by higher N depositions (>5 kg ha−1 yr−1). It is at least conceivable that the decomposition of the coniferous litter is further inhibited at the CS due to the higher throughfall N fluxes, leading to a suppressed activity of fungal and microbial extracellular oxidative enzymes (lignolytic enzymes) [5,108,109].
4.3. Soil Acidification and Its Modulation at GE and CS
4.3.1. The Role of Litter Fall, Forest Hydrology and Weathering Processes
In a former study [36] we observed no significant change in forest floor pH values between 1999 and 2018, in both the GE and CS. We suggested, that in the case of GE, the supply of base cation-rich litter buffer forest floor acidification, which may occur during decomposition and organic matter turnover processes [32]. The present study supports this hypothesis and shows that GE are characterized by twofold (Ca2+) to even fivefold (K+) higher annual macronutrient return via litter fall than CS (Table S10), especially due to leaves and reproductive parts (Table S5). This annual return of base cations likely feedbacks to the forest floor and topsoil acid neutralizing capacity. Additionally, throughfall fluxes directly provide base cations to the available macronutrient pool of the forest floor [93,110] and hence buffering decreasing pH values. Between 2001 and 2018, the mean annual base cation input via throughfall and stemflow was slightly higher at GE (30.1 ± 5.3 kg ha−1) than at CS (24.0 ± 4.2 kg ha−1) and the mean throughfall fluxes are dominated by K+ and Ca2+ (Figure 3).
In contrast to the forest floor, the mineral soil of GE and CS acidified during the last 19 years by 0.2 to 0.5 pH units [36]. Weathering processes of the soil matrix in the main rooting zone of GE and CS contribute to a higher acid neutralizing capacity in the mineral soil and the predicted annual base cation flux (Table S10) is almost similar between the forest types with slightly higher amounts at GE. The base cation release is dominated by K+ (Table S10). Nevertheless, we found slightly lower total base cation stocks in mineral soil of GE (Table S6; Figure S8), matching the result of a stronger mineral soil acidification. Independently, Großherr [48] found that the exchangeable base cation mineral soil pool in a depth of 15–28 cm, is also smaller at the plot GE ICP (234.0 kg ha−1) than at CS ICP (334.4 kg ha−1). This is especially true for Ca2+ and K+.
4.3.2. The Role of Seepage Water and Nitrate
Nitrate is considered as a critical ion for the process of base cation depletion (counter ion for Ca2+, Mg2+, and K+ in soil solution) through leaching from the mineral soil via seepage water [13]. Nevertheless, our results suggest an existing, but minor risk for base cation leaching losses associated with NO3− at GE and CS. Unfortunately, macronutrient seepage fluxes were not determined at the investigated monitoring sites in the past and we estimate the role of NO3− for mineral soil acidification with the use of different predictors for N seepage fluxes at GE and CS in our study.
The depth curve of the NO3− seepage water concentration cascades downwards for GE with highest concentrations in the forest floor (Figure 4), indicating that most of the NO3− from mineral soil solution is consumed by European beech. N is required in large amounts by higher plants as a constituent of proteins, nucleic acids, coenzymes or secondary metabolites [111] and it is taken up by tree roots as NO3− as one major inorganic N source [11,111,112]. The NO3− seepage water concentration is up to sixfold higher at CS, increases below 50 cm depth and it seems, that at CS—where throughfall Nt fluxes are higher—not all of the deposited NO3− is consumed by Norway spruce and Scots pine. The N uptake rate into tree coarse wood and bark is only half the size of GE (Table S10). The remaining NO3− may reduce soil base cation stocks, but nevertheless the base cation concentration in seepage water, show a negative correlation with NO3− concentration (Figures S2–S5). Other indicators for NO3− leaching in European forests confirm a lower risk for nitrate seepage water losses at CS. The forest floor C:N ratio can function as such an indicator for coniferous stands [113,114]. The mean forest floor C:N ratio at the exploration sites is between 26–36 (Oa-Oi) at CS and between 22–35 (Oa-Oi) at GE [36], pointing on an intermediate N status with a low or at most moderate risk for NO3− leaching [113]. Throughfall Nt fluxes can serve additionally predictive, using a relationship relating N leaching fluxes to throughfall N fluxes, which provide good overall predictions of seepage N fluxes for European forest sites [115]. However, throughfall fluxes are a weak predictor at sites with low leaching fluxes [115] but throughfall Nt fluxes at GE and at CS indicate possible seepage Nt fluxes of 2 kg ha−1 yr−1 (GE) respectively 4 kg ha−1 yr−1 (CS). As annual leaching rates of 2–4 kg N ha−1 yr−1 (temperate deciduous forests) and 1–3 kg N ha−1 yr−1 (intensive coniferous plantations) are set as a threshold for acceptable leaching of inorganic N [56], the estimated seepage Nt fluxes at CS might be sometimes above the critical limits and may be an indicator for nutrient imbalances caused by nitrate leaching. Nevertheless, an assignment of the investigated GE and CS to the N accumulation type with growing N stocks or at least unchanged N stocks (quasi-steady-state Type) in forest floor and mineral soil [116] seems plausible based on the predicted N input–output balance (Table S10) and the estimated seepage N fluxes [114,115,117]. A synthesis of the predicted N status classification [116] and the N saturation stage [94] supply evidence that GE and CS are not N saturated hence being of minor risk for N-induced distinct herbaceous layer biodiversity losses, strong soil acidification, soil base cation losses, and soil water quality degradation [94]. Plausible N seepage water fluxes of < 4 kg ha−1 yr−1, group in the lower range of N fluxes usual for Europe (1–30 kg ha−1 yr−1) [114].
4.3.3. The Role of Seepage Water and Sulphate
Besides NO3−, SO42− function as a counter ion for base cations in soil solution and can contribute to strong mineral soil base cation losses [10,20,21]. In some European and North American forested catchments, SO42− accounts even for 68–100% of the acid leaching from forest soils [118]. Because atmospheric S deposition decreased strongly over time (Figure 3), the desorption of water-soluble SO42− from Fe and Al sesquioxides seems to be responsible for the high SO42− concentrations in mineral soil seepage water at GE and CS, with higher concentrations at CS (Figure 4). The desorption process in acidic mineral soil is probably stimulated through dissolved organic matter seepage fluxes [22,119]. Organic anions and dissolved organic carbon (DOC) compete with SO42− for adsorption sites [120] at acidic soil pH with DOC adsorption being preferred over that of SO42− [120]. This assumption is confirmed by lower DOC concentrations in mineral soil solutions at GE and CS at 50 cm and 100 cm depth, than at 20 cm depth, which may indicate DOC adsorption (GE/CS ICP, data not shown). In contrast to NO3−, base cation concentrations are significantly positive correlated with SO42− concentrations in seepage water of most mineral soil depth increments, especially in those of the CS (Figures S2–S5), suggesting a remobilization of previously retained historic SO42− which in turn causes base cation leaching losses. This process might decrease pH at the deeper mineral soil and delay a recovery from soil acidification. Nevertheless, a decrease in SO42− concentrations is observable between 2011–2018 (Figure S1). Base cation concentrations in mineral soil solution at the GE and the CS also show a similar trend over time like SO42−, with lower concentrations in the last decade (Figure S1).
4.3.4. The Role of the Tree Species: Base Pump Effect and Base Cation Depletion
Tree macronutrient uptake affect the chemical conditions and nutrient distribution in forest soils [11]. At sites under nutrient deficiency and acidic soil conditions, this process contributes to a further mineral soil acidification, as free acid is produced during the base cation uptake via the tree fine root system and the acid neutralizing capacity of the mineral soil is depleted [29,121]. This “bio-acidification” [30] is a main process for decreasing pH values in forest mineral soil [29] as long as the sequestrated cations are not returned to the topsoil by litter and wood decomposition [11] and mineral soil base cation stock losses are not balanced. At GE and CS, mineral soil acidification traces the main rooting zone typical for European beech, Norway spruce, and Scots pine and the strongest acidification occurred for GE, which were characterized by an up to threefold higher estimated annual uptake of base cations into tree stemwood and bark than CS (Table S10). Although our study did not directly determine the fate of base cations from mineral soil via root uptake and biomass formation to the forest floor, the base pump effect serves as one explanation for the observed soil acidification combined with a relatively low base cation pool restoration by rock weathering (Table S10). Recent input–output balances for Ca2+, Mg2+, and K+ indicate, that the calculated budgets for GE and CS are positive (Table S10). Nevertheless, the base cation balance seems to be depth-dependent with growing stocks in forest floor and topsoil contrary to base cation losses from deeper mineral soil.
5. Conclusions
Our results offer no evidence for herb layer diversity losses and little evidence for distinct mineral soil base cation losses resulting from the moderate N bulk deposition at the investigated forest stands. The application of predictors for NO3− leaching showed, that neither GE nor CS are N saturated and that both only bear low risks for soil base cation (Ca2+, Mg2+, K+) depletion or soil water quality degradation induced by N depositions. Nevertheless, processes like nitrification can contribute to a soil acidification and thus to a decrease in base cation saturation. An ongoing pressure from N deposition inputs on the forest soil at GE and CS can change the role of nitrogen compounds to become the main driver for forest soil acidification at the investigated stands.
In contrast to NO3−, SO42− seems to be more important for the status of soil base cation pools at GE and CS, although S depositions decreased strongly over the last decades. The remobilization of previously specifically adsorbed SO42− into soil solution causes base cation leaching losses at the investigated forest stands. This process might decrease the pH at deeper mineral soil and delay a recovery from soil acidification. Nevertheless, high SO42− concentrations in mineral soil solution mainly occurred in the time period between 2001–2010, whereas a decrease in SO42− and base cation concentrations is observable between 2011–2018. Based on this observation, base cation leaching losses from mineral soil as counter ions for SO42− associated with an acid neutralizing capacity depletion and mineral soil acidification may be of lesser relevance for GE and CS, today. This points to tree growth and the uptake of Ca2+, Mg2+, and K+ into tree biomass, likely before sulphate and nitrate leaching occur, as one main driver for recent mineral soil acidification under the current N deposition conditions at GE and CS. The “bio-acidification” traces the main rooting zone typical for European beech, Norway spruce and Scots pine at GE and CS. The base cation balance as well as soil acidification seems to be depth-dependent with growing base cation stocks and unchanged pH values over time in forest floor and topsoil contrary to base cation losses and decreasing pH values at deeper mineral soil. Due to the natural process of soil acidification and tree macronutrient uptake, it is questionable whether the investigated soils will recover in the long-term if the assimilated cations are not released to the topsoil by litter decomposition, even if the input of acidifying air pollutants is reduced.
The plantation of Green Eyes provides positive effects on the forest floor quality. The high rate of nutrient return via litter fall and the intensified turnover processes at GE may contribute to vital and stable forest ecosystems due to the activated nutrient cycling in forest floor and topsoil. Nevertheless, our results suggest that the bio-acidification of the mineral soil at 20–40 cm depth is higher at GE, which can affect future ecosystem dynamics and processes. In a wider sense and to predict nutrient imbalances (especially for Ca2+, Mg2+, and K+), we recommend to forest managers that fine and coarse woody debris should remain in the forest and accumulate to function as a temporary reservoir or even a base cation source during its decomposition and as a hotspot for biodiversity at the forest sites. It remains a field of further research to determine the extent to which the effects of GE impinge on the surrounding CS and in which ways GE can be a part of future, vital forests in Germany and Central Europe.
Supplementary Materials
The following are available online at https://www.mdpi.com/article/10.3390/f12050573/s1, Figure S1. Macronutrient concentration (NO3−, SO42−, Ca2+, Mg2+, K+; µmolc L−1) in seepage water of forest floor (A, B), as well as of mineral soil at 20 cm (C, D), 50 cm (E, F) and 100 cm (G, H) depth at the plot-pair GE/CS ICP. Figure S2. Correlations between element concentrations (NO3−, SO42−, K+, Ca2+, Mg2+), pH and electrical conductivity in seepage water of forest floor at the plot-pair GE/CS ICP. Figure S3. Correlations between element concentrations (NO3−, SO42−, K+, Ca2+, Mg2+), pH and electrical conductivity in seepage water of mineral soil (20 cm depth) at the plot-pair GE/CS ICP. Figure S4. Correlations between element concentrations (NO3−, SO42−, K+, Ca2+, Mg2+), pH and electrical conductivity in seepage water of mineral soil (50 cm depth) at the plot-pair GE/CS ICP. Figure S5. Correlations between element concentrations (NO3−, SO42−, K+, Ca2+, Mg2+), pH and electrical conductivity in seepage water of mineral soil (100 cm depth) at the plot-pair GE/CS ICP. Figure S6. Composition of total annual litter fall (dry matter, %) at GE (A) and CS (B) as well as analyzed litter (79.8% at GE and 76.1% at CS of the total annual litter fall). Figure S7. Dry matter and macronutrient fluxes in annual litter fall for Green Eyes and coniferous sites. Figure S8. Dry matter stocks (in forest floor) and macronutrient stocks (in forest floor and mineral soil) for Green Eyes and coniferous sites. Figure S9. Fractional annual loss (turnover rate) and residence time in years of the forest floor organic material and of macronutrients stored in forest floor (∑ Oi, Oe, Oa) for Green Eyes and coniferous sites. A steady state condition was assumed. Table S1. Macronutrient concentration of litter fall fractions. Table S2. Vegetation data used for the prediction of the herbaceous aboveground biomass and macronutrient stocks with the estimation model PhytoCalc 1.4 at GE and CS. Table S3. Summary statistics and ANOVA results of the linear mixed-effects models. Table S4. Soil data used for the prediction of the annual base cation release (Ca2+, Mg2+, K+; kg ha−1) from weathering processes in the main rooting zone of the soil matrix at GE and CS according to the soil type-texture approximation for non-calcareous soil profiles given in CLRTAP (2017). Table S5. Litter fractions and their share in the macronutrient return within the analyzed litter at GE and CS. Table S6. Macronutrient stocks (in above-ground-tree-biomass, herbaceous ground vegetation, forest floor, and mineral soil) for Green Eyes and coniferous sites. Table S7. Macronutrient stocks in mineral soil (∑ 0–10 cm, 10–20 cm, 20–40 cm) and divided into single depth increments for Green Eyes and coniferous sites. Table S8. Fractional annual loss (turnover rate) and residence time in years of the forest floor organic matter (OM) and of macronutrients stored in forest floor (∑ Oi, Oe, Oa) for Green Eyes and coniferous sites. A steady state condition was assumed. Table S9. Forest floor organic matter (OM) stocks (dry matter) at Green Eyes and coniferous sites. Table S10. Macronutrient fluxes (deposition, litter fall, predicted weathering in soil matrix) and predicted macronutrient budgets for Green Eyes and coniferous sites.
Author Contributions
Conceptualization, F.A., A.T., and B.M.; methodology, F.A., B.M., and I.C.; investigation, F.A. and M.A.; formal analysis, F.A. and A.T.; visualization, F.A. and M.A.; validation, F.A., A.T., and M.B.-R.; writing—original draft preparation, F.A.; writing—review and editing, B.M., A.T., M.B.-R., M.A., and I.C.; resources, B.M.; supervision, B.M.; funding acquisition, B.M. All authors have read and agreed to the published version of the manuscript.
Funding
The research of F.A. was supported by the scholarship “Landesgraduiertenstipendium 2018” (Friedrich-Schiller-University Jena, State of Thuringia, Germany) as well as budgetary resources of the Department of Soil Science of the FSU Jena. A.T. and M.A. were supported by budgetary resources of the Department of Soil Science of the FSU Jena.
Data Availability Statement
The data presented in this study are available in the Supplementary Materials as a R-project. Forests data of the Level II Intensive Monitoring Site (International Co-operative Programme on Assessment and Monitoring of Air Pollution Effects on Forests-ICP Forests) is available for use upon request: Bundesministerium für Ernährung, Landwirtschaft und Verbraucherschutz, National Focal Centre (NFC), E-Mail: 535@bmel.bund.de.
Acknowledgments
The authors are thankful to Bernhard Zeiss from the Thuringian forest office Jena-Holzland (Germany) for field work permits. We thank also Nico Frischbier and Sven Merten from the forest research institution “FFK Gotha” for providing location-, regional climate-, and air pollutant deposition data. We thank the two anonymous reviewers for their valuable comments and notes which clearly improved the manuscript quality.
Conflicts of Interest
The authors declare no conflict of interest.
References
- Engardt, M.; Simpson, D.; Schwikowski, M.; Granat, L. Deposition of sulphur and nitrogen in Europe 1900–2050. Model calculations and comparison to historical observations. Tellus B Chem. Phys. Meteorol. 2017, 69. [Google Scholar] [CrossRef]
- Kopáček, J.; Veselý, J. Sulfur and nitrogen emissions in the Czech Republic and Slovakia from 1850 till 2000. Atmos. Environ. 2005, 39, 2179–2188. [Google Scholar] [CrossRef]
- Binkley, D.; Högberg, P. Tamm Review: Revisiting the influence of nitrogen deposition on Swedish forests. For. Ecol. Manag. 2016, 368, 222–239. [Google Scholar] [CrossRef]
- Puhe, J.; Ulrich, B. Global Climate Change and Human Impacts on Forest Ecosystems; Springer: Berlin/Heidelberg, Germany, 2001; Volume 143. [Google Scholar]
- Bonner, M.T.L.; Castro, D.; Schneider, A.N.; Sundström, G.; Hurry, V.; Street, N.R.; Näsholm, T. Why does nitrogen addition to forest soils inhibit decomposition? Soil Biol. Biochem. 2019, 137. [Google Scholar] [CrossRef]
- Dirnböck, T.; Grandin, U.; Bernhardt-Romermann, M.; Beudert, B.; Canullo, R.; Forsius, M.; Grabner, M.T.; Holmberg, M.; Kleemola, S.; Lundin, L.; et al. Forest floor vegetation response to nitrogen deposition in Europe. Glob Chang. Biol. 2014, 20, 429–440. [Google Scholar] [CrossRef] [PubMed]
- Gilliam, F.S. The Ecological Significance of the Herbaceous Layer in Temperate Forest Ecosystems. BioScience 2007, 57, 845–858. [Google Scholar] [CrossRef]
- Knapp, S. The Link Between Diversity, Ecosystem Functions, and Ecosystem Services. In Atlas of Ecosystem Services Drivers, Risks, and Societal Responses; Schröter, M., Bonn, A., Klotz, S., Seppelt, R., Baessler, C., Eds.; Springer International Publishing: Cham, Switzerland, 2019; pp. 13–15. [Google Scholar] [CrossRef]
- De Vries, W.; Dobbertin, M.H.; Solberg, S.; van Dobben, H.F.; Schaub, M. Impacts of acid deposition, ozone exposure and weather conditions on forest ecosystems in Europe: An overview. Plant Soil 2014, 380, 1–45. [Google Scholar] [CrossRef]
- Wellbrock, N.; Bolte, A. Status and Dynamics of Forests in Germany-Results of the National Forest Monitoring; Springer Open: Berlin/Heidelberg, Germany, 2019; Volume 237, p. 388. [Google Scholar]
- Binkley, D.; Fisher, R.F. Ecology and Management of Forest Soils, 5th ed.; Wiley-Blackwell: Hoboken, NJ, USA, 2019. [Google Scholar] [CrossRef]
- De Vries, W.; Schulte-Uebbing, L. Impacts of Nitrogen Deposition on Forest Ecosystem Services and Biodiversity. In Atlas of Ecosystem Services: Drivers, Risks, and Societal Responses; Schröter, M., Bonn, A., Klotz, S., Seppelt, R., Baessler, C., Eds.; Springer International Publishing: Cham, Switzerland, 2019; pp. 183–189. [Google Scholar] [CrossRef]
- Reuss, J.; Johnson, D. Effect of Soil Processes on the Acidification of Water by Acid Deposition. J. Environ. Qual. 1985, 14, 26–31. [Google Scholar] [CrossRef]
- Rothe, A.; Kreutzer, K.; Küchenhoff, H. Influence of tree species composition on soil and soil solution properties in two mixed spruce-beech stands with contrasting history in Southern Germany. Plant Soil 2002, 240, 47–56. [Google Scholar] [CrossRef]
- Fagerli, H.; Tsyro, S.; Jonson, J.E.; Nyíri, A.; Simpson, D.; Wind, P.; Benedictow, A.; Klein, H.; Mu, Q.; Rolstad Denby, B.; et al. EMEP-Status Report 1/2020-Transboundary Particulate Matter, Photo-Oxidants, Acidifying and Eutrophying Components; Norwegian Meteorological Institute: Oslo, Norway, 2020; p. 270. [Google Scholar]
- Köchy, M.; Bråkenhielm, S. Separation of effects of moderate N deposition from natural change in ground vegetation of forests and bogs. For. Ecol. Manag. 2008, 255, 1654–1663. [Google Scholar] [CrossRef]
- Nilsson, J.; Grennfelt, P. Critical Loads for Sulphur and Nitrogen. Report from a Workshop Held at Skokloster, Sweden 19-24 March, 1988; Nordic Council of Ministers; Nordisk Ministerraad: Koebenhavn, DK, USA, 1988; p. 418. [Google Scholar]
- Lorenz, M.; Nagel, H.D.; Granke, O.; Kraft, P. Critical loads and their exceedances at intensive forest monitoring sites in Europe. Environ. Pollut. 2008, 155, 426–435. [Google Scholar] [CrossRef] [PubMed]
- Walker, T.A.B.; McMahon, R.C.; Hepburn, A.; Ferrier, R. Sulphate dynamics of podzols from paired impacted and pristine catchments. Sci. Total Environ. 1990, 92, 235–247. [Google Scholar] [CrossRef]
- Berger, T.W.; Turtscher, S.; Berger, P.; Lindebner, L. A slight recovery of soils from Acid Rain over the last three decades is not reflected in the macro nutrition of beech (Fagus sylvatica) at 97 forest stands of the Vienna Woods. Environ. Pollut. 2016, 216, 624–635. [Google Scholar] [CrossRef]
- Růžek, M.; Myška, O.; Kučera, J.; Oulehle, F. Input-Output Budgets of Nutrients in Adjacent Norway Spruce and European Beech Monocultures Recovering from Acidification. Forests 2019, 10, 68. [Google Scholar] [CrossRef]
- Näthe, K.; Levia, D.F.; Tischer, A.; Potthast, K.; Michalzik, B. Spatiotemporal variation of aluminium and micro- and macronutrients in the soil solution of a coniferous forest after low-intensity prescribed surface fires. Int. J. Wildland Fire 2018, 27, 471–489. [Google Scholar] [CrossRef]
- Iwald, J. Acidification of Swedish Forest Soils-Evaluation of Data from the Swedish Forest Soil Inventory; Licentiate Swedish University of Agricultural Sciences: Uppsala, Sweden, 2016. [Google Scholar]
- De Schrijver, A.; Staelens, J.; Wuyts, K.; Van Hoydonck, G.; Janssen, N.; Mertens, J.; Gielis, L.; Geudens, G.; Augusto, L.; Verheyen, K. Effect of vegetation type on throughfall deposition and seepage flux. Environ. Pollut. 2008, 153, 295–303. [Google Scholar] [CrossRef]
- De Schrijver, A.; Geudens, G.; Augusto, L.; Staelens, J.; Mertens, J.; Wuyts, K.; Gielis, L.; Verheyen, K. The Effect of Forest Type on Throughfall Deposition and Seepage Flux: A Review. Oecologia 2007, 153, 663–674. [Google Scholar] [CrossRef]
- Lorenz, M.; Clarke, N.; Paoletti, E.; Bytnerowicz, A.; Grulke, N.; Lukina, N.; Sase, H.; Staelens, J. Air Pollution Impacts on Forests in Changing Climate. In Forest and Society–Responding to Global Drivers of Change; IUFRO World Series; Mery, G.E.A., Ed.; International Union of Forest Research Organizations: Vienna, Austria, 2010; pp. 55–74. [Google Scholar]
- Binkley, D.; Giardina, C. Why do tree species affect soils? The Warp and Woof of tree soil interactions. Biogeochemistry 1998, 42, 89–106. [Google Scholar] [CrossRef]
- Wittich, W. Die Heutigen Grundlagen der Holzartenwahl. Dargestellt am Beispiel des Nordwestdeutschen Waldgebietes, 2nd ed.; M. & H. Schaper: Hannover, Germany, 1948. [Google Scholar]
- Hallbäcken, L. Long Term Changes of Base Cation Pools in Soil and Biomass in a Beech and a Spruce Forest of Southern Sweden. Z. Pflanz. Bodenk. 1992, 155, 51–60. [Google Scholar] [CrossRef]
- Westman, C.J.; Jauhiainen, S. Soil acidity in 1970 and 1989 in a coniferous forest in southwest Finland. Can. J. Soil Sci. 1998, 78, 477–479. [Google Scholar] [CrossRef]
- Johnson, D.W.; Cresser, M.S.; Nilsson, S.I.; Turner, J.; Ulrich, B.; Binkley, D.; Cole, D.W. Soil changes in forest ecosystems: Evidence for and probable causes. Proc. R. Soc. Edinb. Sect. B. Biol. Sci. 1991, 97, 81–116. [Google Scholar] [CrossRef]
- Binkley, D. The influence of Tree Species on Forest Soils: Processes and Patterns. Agron. Soc. N. Z. Spec. Publ. 1995, 7, 1–33. [Google Scholar]
- Ammer, S.; Weber, K.; Abs, C.; Ammer, C.; Prietzel, J. Factors influencing the distribution and abundance of earthworm communities in pure and converted Scots pine stands. Appl. Soil Ecol. 2006, 33, 10–21. [Google Scholar] [CrossRef]
- Bens, O.; Buczko, U.; Sieber, S.; Hüttl, R.F. Spatial variability of O layer thickness and humus forms under different pine beech–forest transformation stages in NE Germany. J. Plant Nutr. Soil Sci. 2006, 169, 5–15. [Google Scholar] [CrossRef]
- Zederer, D.P.; Talkner, U.; Spohn, M.; Joergensen, R.G. Microbial biomass phosphorus and C/N/P stoichiometry in forest floor and A horizons as affected by tree species. Soil Biol. Biochem. 2017, 111, 166–175. [Google Scholar] [CrossRef]
- Achilles, F.; Tischer, A.; Bernhardt-Römermann, M.; Heinze, M.; Reinhardt, F.; Makeschin, F.; Michalzik, B. European beech leads to more bioactive humus forms but stronger mineral soil acidification as Norway spruce and Scots pine–Results of a repeated site assessment after 63 and 82 years of forest conversion in Central Germany. For. Ecol. Manag. 2021, 483, 118769. [Google Scholar] [CrossRef]
- Aherne, J.; Braun, S.; Tresch, S.; Augustin, S. Soil solution in Swiss forest stands: A 20 year’s time series. PLoS ONE 2020, 15. [Google Scholar] [CrossRef]
- Johnson, J.; Graf Pannatier, E.; Carnicelli, S.; Cecchini, G.; Clarke, N.; Cools, N.; Hansen, K.; Meesenburg, H.; Nieminen, T.M.; Pihl-Karlsson, G.; et al. The response of soil solution chemistry in European forests to decreasing acid deposition. Glob Chang. Biol. 2018, 24, 3603–3619. [Google Scholar] [CrossRef]
- Ammer, C.; Bickel, E.; Kölling, C. Converting Norway spruce stands with beech-A review of arguments and techniques. Austrian J. For. Sci. 2008, 125, 3–26. [Google Scholar]
- DWD. German Climate Atlas-Thuringia. Available online: https://www.dwd.de/EN/ourservices/germanclimateatlas/germanclimateatlas.html (accessed on 6 March 2020).
- Kirilenko, A.; Sedjo, R.A. Climate change impacts on forestry. Proc. Natl. Acad. Sci. USA 2007, 104, 19697–19702. [Google Scholar] [CrossRef]
- Augusto, L.; Ranger, J.; Binkley, D.; Rothe, A. Impact of several common tree species of European temperate forests on soil fertility. Ann. Sci. 2002, 59, 233–253. [Google Scholar] [CrossRef]
- Graser, H. Die Bewirtschaftung des Erzgebirgischen Fichtenwaldes. Erster Band; Hofbuchhandlung H.Burdach: Dresden, Germany, 1928; Volume 1, p. 98. [Google Scholar]
- Bärthel, E. Holzart und Betriebsart im Gebiete des Ehemaligen Herzogtums Sachsen-Altenburg-Eine Darstellung und Untersuchung der Ursachen der Mannigfachen Verschiebungen der Holzartenverteilung und des Wechsels der Betriebsart; Ludwigs-Universität Gießen: Gießen, Germany, 1926. [Google Scholar]
- Hoppe, W.; Seidel, G. Geologie von Thüringen: [Bezirke Erfurt, Gera, Suhl]; Haack: Gotha, Germany, 1974. [Google Scholar]
- Burse, K.; Neumann, T. Die Forstlichen Wuchsbezirke Thüringens. Mitt. 37/2019 ThüringenForst 2019, 37, 129–139. [Google Scholar]
- Veckenstedt, T. Vergleich von Buchenhorsten Mit Standortsgleichen Kiefern-Fichten-Mischbeständen Hinsichtlich der Wuchsleistungen, des Bodenzustandes und der Durchwurzelung im Forstamt Hummelshain; Thüringer Fachhochschule für Forstwirtschaft: Schwarzburg, Germany, 1999. [Google Scholar]
- Großherr, M. Auswirkungen des Waldumbaus auf Bodenchemische Eigenschaften (KAK und Acidität) in Bodenprofilen des Thüringer Forstreviers Leuchtenburg; Friedrich-Schiller-Universität Jena: Jena, Germany, 2011. [Google Scholar]
- Schober, R. Ertragstafeln Wichtiger Baumarten bei Verschiedener Durchforstung; J.D. Sauerländer’s Verlag: Frankfurt a. Main, Germany 1995. [Google Scholar]
- Glatthorn, J.; Beckschäfer, P. Standardizing the protocol for hemispherical photographs: Accuracy assessment of binarization algorithms. PLoS ONE 2014, 9, e111924. [Google Scholar] [CrossRef] [PubMed]
- Beckschäfer, P. Hemispherical_2.0–Batch Processing Hemispherical and Canopy Photographs with Imagej–User Manual; Georg-August-Universität Göttingen: Göttingen, Germany, 2015; pp. 1–6. [Google Scholar]
- Bolte, A. Biomasse-und Elementvorräte der Bodenvegetation auf Flächen des Forstlichen Umweltmonitorings in Rheinland-Pfalz (BZE, Level II); Universität Göttingen: Göttingen: Göttingen, Germany, 2006; p. 81. [Google Scholar]
- Block, J.; Dieler, J.; Gauer, J.; Greve, M.; Moshammer, R.; Schuck, J.; Schwappacher, V.; Wunn, U. Gewährleistung der Nachhaltigkeit der Nährstoffversorgung bei der Holz- und Biomassenutzung im Rheinland-Pfälzischen Wald; Forschungsanstalt für Waldökologie und Forstwirtschaft Rheinland-Pflaz (FAWF): Trippstadt, Germany, 2016. [Google Scholar]
- ICP Forests. Manual on Methods and Criteria for Harmonized Sampling, Assessment, Monitoring and Analysis of the Effects of Air Pollution on Forests; Thünen Institute of Forest Ecosystems: Eberswalde, Germany, 2016. [Google Scholar]
- Schlutow, A.; Ritter, A. Aktualisierung der Berechnung von Ökologischen Belastungsgrenzen (Critical Loads) und Ihren Überschreitungen für 14 Thüringer Wald-und Hauptmessstationen; FFK Gotha-Forstliches Forschungs-und Kompetenzzentrum Gotha: Gotha, Germany, 2018; pp. 1–54. [Google Scholar]
- CLRTAP. Latest Update of Guidance on Mapping Concentrations Levels and Deposition Levels-Manual on Methodologies and Criteria for Modelling and Mapping Critical Loads and Levels and Air Pollution Effects, Risks and Trends. 2017. Available online: https://www.umweltbundesamt.de/en/manual-for-modelling-mapping-critical-loads-levels (accessed on 10 March 2021).
- Braun-Blanquet, J. Pflanzensoziologie-Grundzüge der Vegetationskunde; Springer: Berlin/Heidelberg, Germany, 1928; p. 330. [Google Scholar]
- Bolte, A. Abschätzung von Trockensubstanz-, Kohlenstoff-und Nährelementvorräten der Waldbodenflora-Verfahren, Anwendung und Schätztafeln (Assessment of Dry Weight and Storage of Carbon and Nutrients in Forest Ground Vegetation in the North-Eastern German Lowlands–Method, Application and Classification Tables); Tharandt: Saxony, Germany, 1999; Volume 7, p. 320. [Google Scholar]
- Zanella, A.; Ponge, J.-F.; Jabiol, B.; Sartori, G.; Kolb, E.; Le Bayon, R.-C.; Gobat, J.-M.; Aubert, M.; De Waal, R.; Van Delft, B.; et al. Humusica 1, article 5: Terrestrial humus systems and forms-Keys of classification of humus systems and forms. Appl. Soil Ecol. 2018, 122, 75–86. [Google Scholar] [CrossRef]
- AK-Standortskartierung. Forstliche Standortsaufnahme: Begriffe, Definitionen, Einteilung, Kennzeichnungen, Erläuterungen; IHW: Eiching, Germany, 2016; p. 400. [Google Scholar]
- Ad-Hoc-AG-Boden. Bodenkundliche Kartieranleitung (KA5); Schweizerbart: Hannover/Stuttgart, Germany, 2005; p. 438. [Google Scholar]
- WRB, I.W.G. World Reference Base for Soil Resources 2014, Update 2015 International Soil Classification System for Naming Soils and Creating Legends for Soil Maps; FAO: Rome, Italy, 2015. [Google Scholar]
- Kunze, A. Bodenkundlicher Vergleich von Buchen-Laubholzinseln (sog. "Grünen Augen") mit gleichaltrigen Nadelholzreinbeständen im Wuchsbezirk „Ostthüringer Buntsandstein“; Technische Universität Dresden: Dresden, Germany, 2000. [Google Scholar]
- Hågvar, S. From Litter to Humus in a Norwegian Spruce Forest: Long-Term Studies on the Decomposition of Needles and Cones. Forests 2016, 7, 186. [Google Scholar] [CrossRef]
- Lim, M.T.; Cousens, J.E. The Internal Transfer of Nutrients in a Scots Pine Stand 2. The Patterns of Transfer and the Effects of Nitrogen Availability. Forestry 1986, 59, 17–27. [Google Scholar]
- Lyr, H.; Fiedler, H.J.; Tranquillini, W. Physiologie und Ökologie der Gehölze; Gustav Fischer Verlag Jena: Stuttgart, Germany, 1992; p. 620. [Google Scholar]
- Ellenberg, H.; Weber, H.; Düll, R.; Wirth, V.; Werner, W.; Paulißen, D. Zeigerwerte von Pflanzen in Mitteleuropa; Goltze: Göttingen, Germany, 2001; Volume 18, p. 262. [Google Scholar]
- Mölder, A.; Bernhardt-Römermann, M.; Schmidt, W. Herb-layer diversity in deciduous forests: Raised by tree richness or beaten by beech? For. Ecol. Manag. 2008, 256, 272–281. [Google Scholar] [CrossRef]
- Schulze, I.M.; Bolte, A.; Schmidt, W.; Eichhorn, J. Phytomass, Litter and Net Primary Production of Herbaceous Layer. In Functioning and Management of European Beech Ecosystems. vol. 208 ed.; Brumme, R., Khanna, P.K., Eds.; Springer: Berlin/Heidelberg, Germany, 2009. [Google Scholar]
- Heinrichs, S.; Bernhardt-Römermann, M.; Schmidt, W. The estimation of aboveground biomass and nutrient pools of understorey plants in closed Norway spruce forests and on clearcuts. Eur. J. For. Res. 2010, 129, 613–624. [Google Scholar] [CrossRef]
- De Vries, W.; Hol, A.; Tjalma, S.; Voogd, J.C. Literatuurstudie Naar Voorraden en Verblijftijden van Elementen in Bosecosystemen (Amounts and Turnover Rates of Elements in Forest Ecosystems: A Literature Study); Winand Staring Center: Wageningen, The Netherlands, 1990. [Google Scholar]
- Jacobsen, C.; Rademacher, P.; Meesenburg, H.; Meiwes, K.-J. Gehalte Chemischer Elemente in Baumkronenkompartimenten. Literaturstudie und Datensammlung; Forschungszentrum Waldökosysteme der Universität Göttingen: Göttingen, Germany, 2003. [Google Scholar]
- R Core Team. R: A Language and Environment for Statistical Computing; R Foundation for Statistical Computing: Vienna, Austria, 2020. [Google Scholar]
- Emerson, J.W.; Green, W.A.; Schloerke, B.; Crowley, J.; Cook, D.; Hofmann, H.; Wickham, H. The Generalized Pairs Plot. J. Comput. Graph. Stat. 2012, 22, 79–91. [Google Scholar] [CrossRef]
- Pinheiro, J.; Bates, D.M. Mixed-Effects Models in Sand S-PLUS; Springer: New York, NY, USA, 2000. [Google Scholar]
- Pinheiro, J.; Bates, D.; DebRoy, S.; Sarkar, D. Nlme: Linear and Nonlinear Mixed Effects Models. R package Version 3.1-142; R Core Team. 2019. Available online: https://svn.r-project.org/R-packages/trunk/nlme/ (accessed on 10 March 2021).
- Lenth, R.V. Least-Squares Means: The R Package lsmeans. J. Stat. Softw. 2016, 69, 1–33. [Google Scholar] [CrossRef]
- Hlavac, M. Stargazer: Well-Formatted Regression and Summary Statistics Tables. R package version 5.2.2.; R Core Team. 2018. Available online: https://cran.r-project.org/web/packages/stargazer/stargazer.pdf (accessed on 10 March 2021).
- Zuur, A.F.; Ieno, E.N.; Walker, N.; Saveliev, A.A.; Smith, G.M. Mixed Effects Models and Extensions in Ecology with R.; Springer: New York, NY, USA, 2009. [Google Scholar] [CrossRef]
- Akaike, H. A new look at the statistical model identification. IEEE Trans. Autom. Control. 1974, 19, 716–723. [Google Scholar] [CrossRef]
- Bartoń, K. MuMIn: Multi-Model Inference, R Package Version 0.12.0; R Core Team. 2009. Available online: https://cran.r-project.org/web/packages/MuMIn/index.html (accessed on 10 March 2021).
- Sverdrup, H. The Kinetics of base Cation Release due to Chemical Weathering; Lund University Press: Lund, Sweden, 1990. [Google Scholar]
- Olson, J.S. Energy storage and the balance of producers and decomposers in ecological systems. Ecology 1963, 44, 322–331. [Google Scholar] [CrossRef]
- Hobbie, S.E.; Reich, P.B.; Oleksyn, J.; Ogdahl, M.; Zytkowiak, R.; Hale, C.; Karolewski, P. Tree species effects on decomposition and forest floor dynamics in a common garden. Ecology 2006, 87, 2288–2297. [Google Scholar] [CrossRef]
- Vesterdal, L.; Schmidt, I.K.; Callesen, I.; Nilsson, L.O.; Gundersen, P. Carbon and nitrogen in forest floor and mineral soil under six common European tree species. For. Ecol. Manag. 2008, 255, 35–48. [Google Scholar] [CrossRef]
- Huhn, J.; Reinhardt, F. Vegetationsaufnahmen im Forstamt Hummelshain. 2000; unpublished. [Google Scholar]
- Cole, D.W.; Rapp, M. Elemental cycling in forest ecosystems. In Dynamic Properties of Forest Ecosystems; Reiche, D.E., Ed.; Cambridge University Press: Cambidge, UK, 1981; pp. 341–409. [Google Scholar]
- Likens, G.E.; Drsicoll, C.T.; Buso, D.C.; Mitchell, M.J.; Lovett, G.M.; Bailey, S.W.; Siccama, T.G.; Reiners, W.A.; Alewell, C. The biogeochemistry of sulfur at Hubbard Brook. Biogeochemistry 2002, 60, 235–316. [Google Scholar] [CrossRef]
- Hansen, K.; Vesterdal, L.; Schmidt, I.K.; Gundersen, P.; Sevel, L.; Bastrup-Birk, A.; Pedersen, L.B.; Bille-Hansen, J. Litterfall and nutrient return in five tree species in a common garden experiment. For. Ecol. Manag. 2009, 257, 2133–2144. [Google Scholar] [CrossRef]
- Soil Science Division Staff. Soil Survey Manual; Government Printing Office: Washington, DC, USA, 2017; Volume 18. [Google Scholar]
- Sutton, M.A.; Howard, C.M.; Erisman, J.W.; Billen, G.; Bleeker, A.; Grennfelt, P.; van Grinsven, H.; Grizzetti, B. The European Nitrogen Assessment: Sources, Effects and Policy Perspectives; Sutton, M.A., Howard, C.M., Erisman, J.W., Billen, G., Bleeker, A., Grennfelt, P., van Grinsven, H., Grizzetti, B., Eds.; Cambridge University Press: Cambridge, UK, 2011. [Google Scholar] [CrossRef]
- Berger, T.W.; Untersteiner, H.; Schume, H.; Jost, G. Throughfall fluxes in a secondary spruce (Picea abies), a beech (Fagus sylvatica) and a mixed spruce–beech stand. For. Ecol. Manag. 2008, 255, 605–618. [Google Scholar] [CrossRef]
- Levia, D.F.; Carlyle-Moses, D.; Iida, S.; Michalzik, B.; Nanko, K.; Tischer, A. Forest-Water Interactions; Springer: Berlin/Heidelberg, Germany, 2020; Volume 240, p. 624. [Google Scholar]
- Schmitz, A.; Sanders, T.G.M.; Bolte, A.; Bussotti, F.; Dirnbock, T.; Johnson, J.; Penuelas, J.; Pollastrini, M.; Prescher, A.K.; Sardans, J.; et al. Responses of forest ecosystems in Europe to decreasing nitrogen deposition. Env. Pollut. 2019, 244, 980–994. [Google Scholar] [CrossRef]
- Forsmark, B.; Nordin, A.; Maaroufi, N.I.; Lundmark, T.; Gundale, M.J. Low and High Nitrogen Deposition Rates in Northern Coniferous Forests Have Different Impacts on Aboveground Litter Production, Soil Respiration, and Soil Carbon Stocks. Ecosystems 2020, 23, 1423–1436. [Google Scholar] [CrossRef]
- Bobbink, R.; Hicks, K.; Galloway, J.; Spranger, T.; Alkemade, R.; Ashmore, M.; Bustamante, M.; Cinderby, S.; Davidson, E.; Dentener, F.; et al. Global assessment of nitrogen deposition effects on terrestrial plant diversity: A synthesis. Ecol. Appl. 2010, 20, 30–59. [Google Scholar] [CrossRef]
- Elliott, K.J.; Vose, J.M.; Knoepp, J.D.; Clinton, B.D.; Kloeppel, B.D. Functional Role of the Herbaceous Layer in Eastern Deciduous Forest Ecosystems. Ecosystems 2014, 18, 221–236. [Google Scholar] [CrossRef]
- Welch, N.T.; Belmont, J.M.; Randolph, J.C. Summer Ground Layer Biomass and Nutrient Contribution to Above-ground Litter in an Indiana Temperate Deciduous Forest. Am. Midl. Nat. 2007, 157, 11–26. [Google Scholar] [CrossRef]
- Bolte, A.; Lambertz, B.; Steinmeyer, A.; Kallweit, R.; Meesenburg, H. Zur Funktion der Bodenvegetation im Nährstoffhaushalt von Wäldern-Studien auf Dauerbeobachtungsflächen des EU Level II-Programms in Norddeutschland. Forstarchiv 2004, 75, 207–220. [Google Scholar]
- Muys, B.; Granval, P. Earthworms as bio-indicators of forest site quality. Soil Biol. Biochem. 1997, 29, 323–328. [Google Scholar] [CrossRef]
- Heinze, M.; Tomczyk, S.; Nicke, A. Vergleich von Rot-Buche (Fagus sylvatica L.) in sogennanten Grünen Augen mit benachbarten standortsgleichen Fichtenbeständen (Picea abies [L.] KARST.) des Thüringer Vogtlandes bezüglich Eigenschaften und Durchwurzelung des Bodens sowie Baumwachstum. Forstw. Cbl. 2001, 120, 139–153. [Google Scholar] [CrossRef]
- Berg, B.; McClaugherty, C. Plant Litter. Decomposition, Humus Formation, Carbon Sequestration; Springer: Berlin/Heidelberg, Germany, 2014. [Google Scholar] [CrossRef]
- Wang, L.; D’Odorico, P. Decomposition and Mineralization. In Encyclopedia of Ecology, 2nd ed.; Fath, B., Ed. Elsevier: Oxford, UK, 2013; pp. 280–285. [Google Scholar] [CrossRef]
- Nihlgård, B. Pedological Influence of Spruce Planted on Former Beech Forest Soils in Scania, South Sweden. Oikos 1971, 22, 302–314. [Google Scholar] [CrossRef]
- Albers, D.; Migge, S.; Schaefer, M.; Scheu, S. Decomposition of beech leaves (Fagus sylvatica) and spruce needles (Picea abies) in pure and mixed stands of beech and spruce. Soil Biol. Biochem. 2004, 36, 155–164. [Google Scholar] [CrossRef]
- Prescott, C.E. Litter decomposition: What controls it and how can we alter it to sequester more carbon in forest soils? Biogeochemistry 2010, 101, 133–149. [Google Scholar] [CrossRef]
- Knorr, M.; Frey, S.D.; Curtis, P.S. Nitrogen Additions and Litter Decomposition: A Meta-Analysis. Ecology 2005, 86, 3252–3257. [Google Scholar] [CrossRef]
- Carreiro, M.M.; Sinsabaugh, R.L.; Repert, D.A.; Parkhurst, D.F. Microbial Enzyme Shifts Explain Litter Decay Responses to Simulated Nitrogen Deposition. Ecology 2000, 81, 2359–2365. [Google Scholar] [CrossRef]
- Janssens, I.A.; Dieleman, W.; Luyssaert, S.; Subke, J.A.; Reichstein, M.; Ceulemans, R.; Ciais, P.; Dolman, A.J.; Grace, J.; Matteucci, G.; et al. Reduction of forest soil respiration in response to nitrogen deposition. Nat. Geosci. 2010, 3, 315–322. [Google Scholar] [CrossRef]
- Salehi, M.; Zahedi Amiri, G.; Attarod, P.; Salehi, A.; Brunner, I.; Schleppi, P.; Thimonier, A. Seasonal variations of throughfall chemistry in pure and mixed stands of Oriental beech (Fagus orientalis Lipsky) in Hyrcanian forests (Iran). Ann. For. Sci. 2015, 73, 371–380. [Google Scholar] [CrossRef]
- Marschner, H. Mineral Nutrition of Higher Plants, 3rd ed.; Academic Press: San Diego, CA, USA, 2012; p. 672. [Google Scholar]
- Schulze, E.D. Carbon and Nitrogen Cycling in European Forest Ecosystems; Springer: Berlin/Heidelberg, Germany, 2000; Volume 142, p. 506. [Google Scholar]
- Gundersen, P.; Callesen, I.; De Vries, W. Nitrate leaching in forest ecosystems is related to forest floor C/N ratios. Environ. Pollut. 1998, 102, 403–407. [Google Scholar] [CrossRef]
- MacDonald, J.A.; Dise, N.B.; Matzner, E.; Armbruster, M.; Gundersen, P.; Forsius, M. Nitrogen input together with ecosystem nitrogen enrichment predict nitrate leaching from European forests. Glob. Chang. Biol. 2002, 8, 1028–1033. [Google Scholar] [CrossRef]
- Van der Salm, C.; De Vries, W.; Reinds, G.J.; Dise, N.B. N leaching across European forests: Derivation and validation of empirical relationships using data from intensive monitoring plots. For. Ecol. Manag. 2007, 238, 81–91. [Google Scholar] [CrossRef]
- Brumme, R.; Khanna, P.K. Functioning and Management of European Beech Ecosystems; Springer: Berlin/Heidelberg, Germany, 2009; Volume 208, p. 501. [Google Scholar]
- Gundersen, P.; Emmet, B.A.; Kjonaas, O.J.; Koopmans, C.J.; Tietema, A. Impact of nitrogen deposition on nitrogen cycling in forests: A synthesis of NITREX data. For. Ecol. Manag. 1998, 101, 37–55. [Google Scholar] [CrossRef]
- Watmough, S.A.; Aherne, J.; Alewell, C.; Arp, P.; Bailey, S.; Clair, T.; Dillon, P.; Duchesne, L.; Eimers, C.; Fernandez, I.; et al. Sulphate, nitrogen and base cation budgets at 21 forested catchments in Canada, the United States and Europe. Env. Monit Assess 2005, 109, 1–36. [Google Scholar] [CrossRef]
- Gmach, M.R.; Cherubin, M.; Kaiser, K.; Cerri, C.E. Processes that influence dissolved organic matter in the soil: A review. Sci. Agric. 2020, 77, e20180164. [Google Scholar] [CrossRef]
- Vance, G.F.; David, M.B. Dissolved organic carbon and sulfate sorption by spodosol mineral horizons. Soil Sci. 1992, 154, 136–144. [Google Scholar] [CrossRef]
- Berger, T.W.; Swoboda, S.; Prohaska, T.; Glatzel, G. The role of calcium uptake from deep soils for spruce (Picea abies) and beech (Fagus sylvatica). For. Ecol. Manag. 2006, 229, 234–246. [Google Scholar] [CrossRef]


Publisher’s Note: MDPI stays neutral with regard to jurisdictional claims in published maps and institutional affiliations. |
© 2021 by the authors. Licensee MDPI, Basel, Switzerland. This article is an open access article distributed under the terms and conditions of the Creative Commons Attribution (CC BY) license (https://creativecommons.org/licenses/by/4.0/).