
Evaluating Plantation Forest vs. Natural Forest Regeneration for Biodiversity Enhancement in Hong Kong


Abstract
:1. Introduction
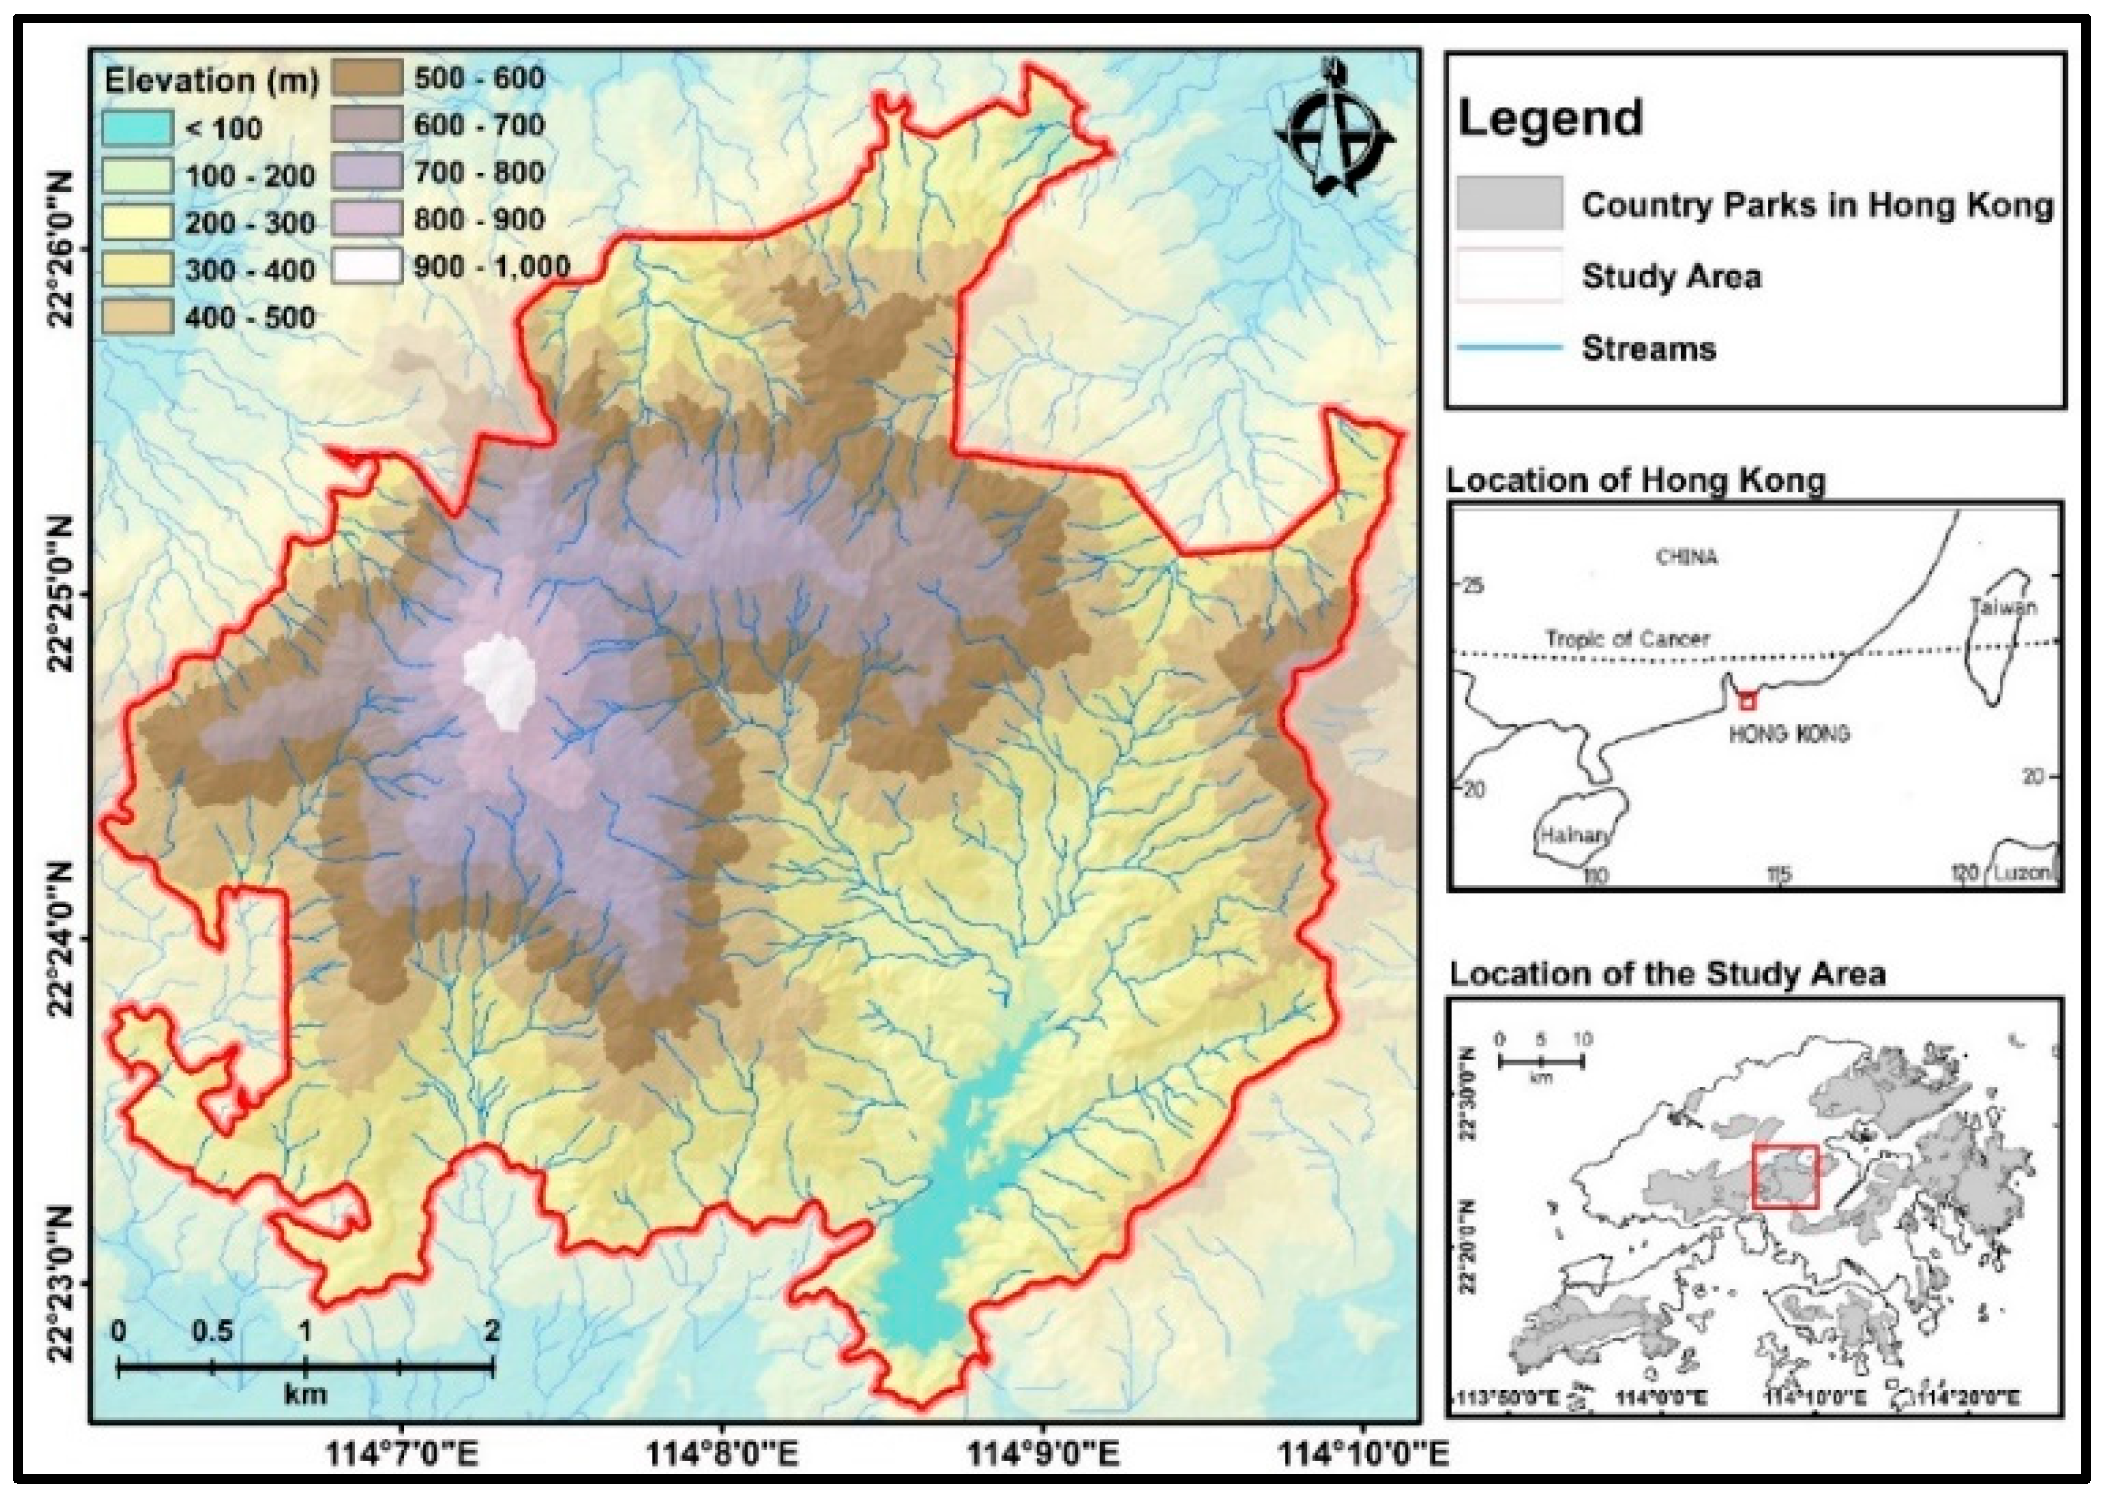
2. The Study Area
3. Methods
3.1. Remote Sensing Data
3.2. Habitat Classification
3.3. Multi-Scale Image Segmentation and Habitat Classification
3.4. Field Data Collection
4. Results
4.1. Landscape Change Over Time
4.2. Species Richness and Woody Biomass in Secondary Forest and Plantations
5. Discussion
6. Conclusions
Author Contributions
Funding
Acknowledgments
Conflicts of Interest
References
- FAO. Global Forest Resources Assessment 2020: Main Report; FAO: Remote, Itlay, 2020; ISBN 978-92-5-132974-0. [Google Scholar]
- FAO; UNEP. The State of the World’s Forests 2020; FAO and UNEP: Rome, Italy, 2020; ISBN 978-92-5-132419-6. [Google Scholar]
- Hansen, M.C.; Potapov, P.V.; Moore, R.; Hancher, M.; Turubanova, S.A.; Tyukavina, A.; Thau, D.; Stehman, S.V.; Goetz, S.J.; Loveland, T.R.; et al. High-Resolution Global Maps of 21st-Century Forest Cover Change. Science 2013, 342, 850–853. [Google Scholar] [CrossRef] [Green Version]
- Waller, L.P.; Allen, W.J.; Barratt, B.I.P.; Condron, L.M.; França, F.M.; Hunt, J.E.; Koele, N.; Orwin, K.H.; Steel, G.S.; Tylianakis, J.M.; et al. Biotic interactions drive ecosystem responses to exotic plant invaders. Science 2020, 368, 967–972. [Google Scholar] [CrossRef] [PubMed]
- Xu, J. China’s new forests aren’t as green as they seem. Nature 2011, 477, 371. [Google Scholar] [CrossRef] [PubMed] [Green Version]
- Vogler, K.; Ager, A.; Day, M.; Jennings, M.; Bailey, J. Prioritization of Forest Restoration Projects: Tradeoffs between Wildfire Protection, Ecological Restoration and Economic Objectives. Forests 2015, 6, 4403–4420. [Google Scholar] [CrossRef] [Green Version]
- Sainge, M.N.; Nchu, F.; Townsend Peterson, A. Diversity, above-ground biomass, and vegetation patterns in a tropical dry forest in Kimbi-Fungom National Park, Cameroon. Heliyon 2020, 6, e03290. [Google Scholar] [CrossRef] [Green Version]
- Sagar, R.; Singh, J.S. Tree density, basal area and species diversity in a disturbed dry tropical forest of northern India: Implications for conservation. Environ. Conserv. 2006, 33, 256–262. [Google Scholar] [CrossRef]
- Liu, X.; Trogisch, S.; He, J.-S.; Niklaus, P.A.; Bruelheide, H.; Tang, Z.; Erfmeier, A.; Scherer-Lorenzen, M.; Pietsch, K.A.; Yang, B.; et al. Tree species richness increases ecosystem carbon storage in subtropical forests. Proc. R. Soc. B Biol. Sci. 2018, 285, 20181240. [Google Scholar] [CrossRef] [PubMed] [Green Version]
- Jones, H.P.; Jones, P.C.; Barbier, E.B.; Blackburn, R.C.; Rey Benayas, J.M.; Holl, K.D.; McCrackin, M.; Meli, P.; Montoya, D.; Mateos, D.M. Restoration and repair of Earth’s damaged ecosystems. Proc. R. Soc. B Biol. Sci. 2018, 285, 20172577. [Google Scholar] [CrossRef]
- Carnus, J.-M.; Parrotta, J.; Brockerhoff, E.; Arbez, M.; Jactel, H.; Kremer, A.; Lamb, D.; O’Hara, K.; Walters, B. Planted Forests and Biodiversity. J. For. 2006, 104, 65–77. [Google Scholar] [CrossRef]
- Parrotta, J.A.; Turnbull, J.W.; Jones, N. Catalyzing native forest regeneration on degraded tropical lands. For. Ecol. Manag. 1997, 99, 1–7. [Google Scholar] [CrossRef]
- Corlett, R.T. Environmental forestry in Hong Kong: 1871–1997. For. Ecol. Manag. 1999, 116, 93–105. [Google Scholar] [CrossRef]
- Rey-Benayas, J.M.; Galván, I.; Carrascal, L.M. Differential effects of vegetation restoration in Mediterranean abandoned cropland by secondary succession and pine plantations on bird assemblages. For. Ecol. Manag. 2010, 260, 87–95. [Google Scholar] [CrossRef] [Green Version]
- Horák, J.; Brestovanská, T.; Mladenović, S.; Kout, J.; Bogusch, P.; Halda, J.P.; Zasadil, P. Green desert?: Biodiversity patterns in forest plantations. For. Ecol. Manag. 2019, 433, 343–348. [Google Scholar] [CrossRef]
- Brockerhoff, E.G.; Jactel, H.; Parrotta, J.A.; Quine, C.P.; Sayer, J. Plantation forests and biodiversity: Oxymoron or opportunity? Biodivers. Conserv. 2008, 17, 925–951. [Google Scholar] [CrossRef]
- Piiroinen, T.; Valtonen, A.; Roininen, H. Exotic plantations can ignite forest succession in the Afrotropics where natural forest regeneration is slow. Afr. J. Ecol. 2016, 54, 524–528. [Google Scholar] [CrossRef]
- Silva, C.V.J.; Aragão, L.E.O.C.; Barlow, J.; Espirito-Santo, F.; Young, P.J.; Anderson, L.O.; Berenguer, E.; Brasil, I.; Foster Brown, I.; Castro, B.; et al. Drought-induced Amazonian wildfires instigate a decadal-scale disruption of forest carbon dynamics. Philos. Trans. R. Soc. B Biol. Sci. 2018, 373, 20180043. [Google Scholar] [CrossRef] [PubMed] [Green Version]
- Kanowski, J.; Catterall, C.P.; Wardell-Johnson, G.W. Consequences of broadscale timber plantations for biodiversity in cleared rainforest landscapes of tropical and subtropical Australia. For. Ecol. Manag. 2005, 208, 359–372. [Google Scholar] [CrossRef] [Green Version]
- Beiroz, W.; Barlow, J.; Slade, E.M.; Borges, C.; Louzada, J.; Sayer, E.J. Biodiversity in tropical plantations is influenced by surrounding native vegetation but not yield: A case study with dung beetles in Amazonia. For. Ecol. Manag. 2019, 444, 107–114. [Google Scholar] [CrossRef]
- Mang, S.L.; Brodie, J.F. Impacts of non-oil tree plantations on biodiversity in Southeast Asia. Biodivers. Conserv. 2015, 24, 3431–3447. [Google Scholar] [CrossRef]
- Meli, P.; Holl, K.D.; Rey Benayas, J.M.; Jones, H.P.; Jones, P.C.; Montoya, D.; Moreno Mateos, D. A global review of past land use, climate, and active vs. passive restoration effects on forest recovery. PLoS ONE 2017, 12, e0171368. [Google Scholar] [CrossRef]
- IPCC. IPCC, 2014: Climate Change 2014: Synthesis Report. Contribution of Working Groups I, II and III to the Fifth Assessment Report of the Intergovernmental Panel on Climate Change; Core Writing Team, Pachauri, R., Meyer, L., Eds.; IPCC: Geneva, Switzerland, 2014; ISBN 978-92-9169-143-2. [Google Scholar]
- Lee, E.W.S.; Hau, B.C.H.; Corlett, R.T. Natural regeneration in exotic tree plantations in Hong Kong, China. For. Ecol. Manag. 2005, 212, 358–366. [Google Scholar] [CrossRef] [Green Version]
- Liu, T.; Lin, K.; Vadeboncoeur, M.A.; Chen, M.; Huang, M.; Lin, T. Understorey plant community and light availability in conifer plantations and natural hardwood forests in Taiwan. Appl. Veg. Sci. 2015, 18, 591–602. [Google Scholar] [CrossRef] [Green Version]
- Su, X.; Li, S.; Wan, X.; Huang, Z.; Liu, B.; Fu, S.; Kumar, P.; Chen, H.Y.H. Understory vegetation dynamics of Chinese fir plantations and natural secondary forests in subtropical China. For. Ecol. Manag. 2021, 483, 118750. [Google Scholar] [CrossRef]
- Abbas, S.; Nichol, J.E.; Wong, M.S. Object-based, multi-sensor habitat mapping of successional age classes for effective management of a 70-year secondary forest succession. Land Use Policy 2020, 99, 103360. [Google Scholar] [CrossRef]
- Abbas, S.; Nichol, J.E.; Fischer, G.A. A 70-year perspective on tropical forest regeneration. Sci. Total Environ. 2016, 544, 544–552. [Google Scholar] [CrossRef]
- Dudgeon, D.; Corlett, R. The Ecology and Biodiversity of Hong Kong (Revised Ed.); Cosmos Books & Lions Nature Education Foundation: Hong Kong, China, 2011; ISBN 9789882113985. [Google Scholar]
- Ashworth, J.M.; Corlett, R.T.; Dudgeon, D.; Melville, D.S.; Tang, W.S.M. Hong Kong Flora and Fauna: Computing Conservation; World Wide Fund for Nature Hong Kong: Hong Kong, China, 1993. [Google Scholar]
- Gregorio, A.D.; Janson, J.M.L. Land Cover Classification System Concepts and User MANUAL Software Version 2; Food and Agricultural Organization of the United Nations: Rome, Italy, 2005. [Google Scholar]
- Congalton, R.; Gu, J.; Yadav, K.; Thenkabail, P.; Ozdogan, M. Global Land Cover Mapping: A Review and Uncertainty Analysis. Remote Sens. 2014, 6, 12070–12093. [Google Scholar] [CrossRef] [Green Version]
- Sarker, M.L.R. Estimation of Forest Biomass Using Remote Sensing; Dept. of Land Surveying and Geo-Informatics, The Hong Kong Polytechnic University: Hong Kong, China, 2010. [Google Scholar]
- Nichol, J.; Wong, M.S. Habitat Mapping in Rugged Terrain Using Multispectral Ikonos Images. Photogramm. Eng. Remote Sens. 2008, 74, 1325–1334. [Google Scholar] [CrossRef]
- Puyravaud, J.-P. Standardizing the calculation of the annual rate of deforestation. For. Ecol. Manag. 2003, 177, 593–596. [Google Scholar] [CrossRef]
- Abbas, S.; Nichol, J.E.; Zhang, J.; Fischer, G.A. The accumulation of species and recovery of species composition along a 70 year succession in a tropical secondary forest. Ecol. Indic. 2019, 106, 105524. [Google Scholar] [CrossRef]
- Abbas, S.; Nichol, J.E.; Fischer, G.A. Mapping and assessment of impacts of cold and frost on secondary forest in the marginally tropical landscape of Hong Kong. Agric. For. Meteorol. 2017, 232, 543–549. [Google Scholar] [CrossRef]
- Abbas, S.; Nichol, J.E.; Fischer, G.A.; Wong, M.S.; Irteza, S.M. Impact assessment of a super-typhoon on Hong Kong’s secondary vegetation and recommendations for restoration of resilience in the forest succession. Agric. For. Meteorol. 2020, 280, 107784. [Google Scholar] [CrossRef]
- Hau, B.C.H.; Corlett, R.T. A survey of trees and shrubs on degraded hillsides in Hong Kong. Mem. Hong Kong Nat. Hist. Soc. 2002, 25, 83–94. [Google Scholar]
- Cusack, D.; Montagnini, F. The role of native species plantations in recovery of understory woody diversity in degraded pasturelands of Costa Rica. For. Ecol. Manag. 2004, 188, 1–15. [Google Scholar] [CrossRef]
- Corlett, R.T.; Turner, I.M. Long term survival in tropical forest remnants in Singapore and Hong Kong. In Tropical Forest Remnants: Ecology, Management and Conservation of Fragmented Communities; Laurance, W.F., Bierregaard, R.O., Eds.; University of Chicago Press: Chicago, IL, USA, 1997; pp. 333–345. ISBN 0-226-46899-2. [Google Scholar]


| Habitat Class (Structural Stage) | Description (Based on LCCS Definitions) |
|---|---|
| Forest | Broadleaved, evergreen trees, with >60–70% canopy cover |
| Open Forest | Tree/shrub/grass mosaic: open tree canopy (15–60%) with shrubland and/or grassland |
| Shrubland | Broadleaved, evergreen shrubland, with closed canopy >60–70% |
| Open Shrubland (Shrubby Grassland) | Shrub/grass mosaic: open canopy of shrubs (>15–60%) with grassland |
| Grassland | Ground story of grasses (>70%) as dominant vegetation form as well as <15% shrubs/trees |
| Plantation Forest | Monocultural plantation stands: Lophostemon confertus, Acacia confusa, Melaleuca quinquenervia, as well as mixed spp. |
| Habitat Class | 1945 | 1963 | 1989 | 2001 | 2014 | |||||
|---|---|---|---|---|---|---|---|---|---|---|
| (ha) | (%) | (ha) | (%) | (ha) | (%) | (ha) | (%) | (ha) | (%) | |
| Forest | 4.82 | 0.17 | 19.85 | 0.71 | 140.03 | 5.01 | 579.04 | 20.70 | 1019.23 | 36.44 |
| Open Forest | 0.22 | 0.01 | 27.69 | 0.99 | 38.09 | 1.36 | 108.32 | 3.87 | 27.54 | 0.98 |
| Shrubland | 24.03 | 0.86 | 175.05 | 6.26 | 464.18 | 16.59 | 418.70 | 14.97 | 650.43 | 23.25 |
| Open Shrubland | 170.99 | 6.11 | 203.57 | 7.28 | 245.27 | 8.77 | 261.49 | 9.35 | 421.29 | 15.06 |
| Grassland | 2203.17 | 78.74 | 1805.62 | 64.53 | 1479.82 | 52.90 | 969.92 | 34.68 | 219.92 | 7.86 |
| Bare Area | 336.95 | 12.04 | 71.76 | 2.56 | 52.57 | 1.88 | 52.16 | 1.86 | 51.23 | 1.83 |
| Built-up Area | 0.41 | 0.01 | 5.21 | 0.19 | 8.80 | 0.31 | 12.51 | 0.45 | 12.51 | 0.45 |
| Water | 57.21 | 2.04 | 57.21 | 2.04 | 57.21 | 2.05 | 57.21 | 2.05 | 57.21 | 2.05 |
| Plantation Forest | 0.00 | 0.00 | 431.85 | 15.43 | 311.20 | 11.13 | 337.81 | 12.08 | 337.81 | 12.08 |
| Total (ha) | 2798 | |||||||||
| Age (Years) | n | Secondary Forest | Plantation Forest | 2-Sample t-test between Species Richness | |||||
|---|---|---|---|---|---|---|---|---|---|
| No of Species | Basal Area | Monoculture Plantation Stand | n | No of Species | Basal Area | t-Value | P-Value | ||
| 7 | 5 | 26 (6.8) | 25 | ||||||
| 20 | 6 | 33 (11.53) | 36 | ||||||
| 25 * | 6 | 34 (11.53) | 37 | Acacia confusa | 4 | 15 (3.6) | 18 | 3.77 | 0.009 |
| 33 * | 8 | 36 (13.97 | 39 | Lophostemon confertus | 4 | 11 (4.6) | 25 | 4.59 | 0.001 |
| 39 | 8 | 37 (13.97) | 40 | ||||||
| 45 * | 8 | 37 (13.97) | 41 | Melaleuca quinquinervia | 4 | 25 (8.7) | 61 | 1.82 | 0.102 |
| 61 | 5 | 38 (6.16) | 43 | ||||||
| 70 | 4 | 28 (10.72) | 69 | ||||||
Publisher’s Note: MDPI stays neutral with regard to jurisdictional claims in published maps and institutional affiliations. |
© 2021 by the authors. Licensee MDPI, Basel, Switzerland. This article is an open access article distributed under the terms and conditions of the Creative Commons Attribution (CC BY) license (https://creativecommons.org/licenses/by/4.0/).
Share and Cite
Nichol, J.E.; Abbas, S. Evaluating Plantation Forest vs. Natural Forest Regeneration for Biodiversity Enhancement in Hong Kong. Forests 2021, 12, 593. https://doi.org/10.3390/f12050593
Nichol JE, Abbas S. Evaluating Plantation Forest vs. Natural Forest Regeneration for Biodiversity Enhancement in Hong Kong. Forests. 2021; 12(5):593. https://doi.org/10.3390/f12050593
Chicago/Turabian StyleNichol, Janet E., and Sawaid Abbas. 2021. "Evaluating Plantation Forest vs. Natural Forest Regeneration for Biodiversity Enhancement in Hong Kong" Forests 12, no. 5: 593. https://doi.org/10.3390/f12050593