Article

Effects of Moisture Content and Grain Direction on the Elastic Properties of Beech Wood Based on Experiment and Finite Element Method

1
Faculty of Furnishings and Industrial Design, Nanjing Forestry University, Nanjing 210037, China
2
Research Faculty of Agriculture, Hokkaido University, Sapporo 060-08589, Japan
*
Author to whom correspondence should be addressed.
Forests 2021, 12(5), 610; https://doi.org/10.3390/f12050610
Submission received: 19 April 2021 / Revised: 7 May 2021 / Accepted: 9 May 2021 / Published: 12 May 2021
(This article belongs to the Section Wood Science and Forest Products)

Abstract

:
Beech wood (Fagus sylvatica L.) is used in a wide range of wood products. However, the influence of the wood’s moisture content on its mechanical functions will affect its structural strength. It would be complicated and time-consuming to experimentally measure wood’s mechanical functions under different moisture contents. Therefore, it is necessary to establish a prediction formula between the moisture content and elastic constants, and then verify whether its mechanical functions within a wide range of moisture content can be studied by using FEM (finite element method). In this study, which was based on experimentation, we studied the influence of a wide range of moisture contents and grain direction on the compressive yield strength, modulus of elasticity and shear modulus of beech wood. The relationship between the moisture content and elastic constants was established; the moisture sensitivities of different elastic parameters were obtained. Ultimately, compression curves under different moisture contents were plotted out, using both FEM and experimentation. According to the results, the interaction of moisture with the grain direction had a significant effect on the elastic constants of wood, with grain direction having a greater effect on the elastic properties than the moisture content. Moreover, the decay function can be used to fit these experimental results well. The elastic constants of beech wood responded differently to the moisture content, depending on whether it was in the longitude or transverse directions. Finally, this study proved the feasibility of using FEM to simulate wood’s compressive performance with a wide range of moisture contents.

1. Introduction

As an anisotropic bio-porous material, wood largely depends on the moisture content and grain direction for its mechanical properties [1,2,3]. The wooden material at the joints of the structure is always under compression or shearing. Therefore, the moisture content and grain direction has an impact on the strength of wood products [4,5,6,7]. In that case, it is necessary to investigate the effects of moisture content and grain direction on the compressive and shear properties of wood.
Several studies on the influence of moisture on the mechanical of wood have been proposed. Aydin and Ozveren [8] implemented a compressive experimental test and obtained the elastic constants of fir wood (Abies cilicica Carr.) under three levels of moisture content (45%, 65% and 85%) using the biaxial extensometer. It was reported that moisture had a negative effect on the measured properties except for Poisson’s ratio. Báder and Németh [9] studied the influence of moisture (0–40%) on the compressive and bending properties of longitudinally compressed wood and suggested that the moisture had a significant influence on the compressive modulus of elasticity (MOE), compressive strength and bendability coefficient. Jang et al. [10] measured the mechanical properties (axial tensile modulus, bending modulus, axial shear strength and axial compression strength) of bamboo with different moisture content (0.5%–50.9%); as per the results, different mechanical properties corresponding to different sensitivities to moisture, and moisture had the greatest influence on axial compression strength and axial shear strength. This is mainly because the moisture content has different effects on cellulose, hemicellulose and lignin, respectively; these being the three main components of bamboo’s cell wall plant. Among these, hemicellulose and lignin play a greater role in the tests on compression and shear ultimate strength of the bamboo [11]. Hering et al. [12] measured the elastic constants of European beech wood at the different moisture content (8.7%–18.6%) with an acoustic method and non-contact optical surface deformation measurement method based on digital-image correlation (DIC). It can be seen from the results that, except for some of Poisson’s ratio, all the elastic stiffness decreases with the increase of moisture contents below the fiber saturation point.
It is also observed previously that the mechanical properties of wood with diverse grain directions are different. The mechanical properties of wood in longitude direction are greater than that in transverse direction [13,14]. The yield mechanism of wood in diverse directions is different. Specifically, the yield mechanism of wood in the direction of longitude is mainly based on the yield and fold of wood fiber itself, but in the case of transverse direction, the slippage damage between wood fibers is the primary cause. Previous studies also showed different mechanical properties which vary between radial direction and tangential direction of the transverse surface. According to the report of Hering et al. [12], the compressive MOE of European beech wood in the radial direction was larger than that in the tangential direction. Aydin and Ozveren [8] obtained the same results of MOE of fir wood, but in terms of compressive ultimate strength, the value of tangential direction was greater than in the radial. The research conducted by Yang and Zhang [15] showed that, for Korea pine wood, both the compressive MOE and the ultimate strength in the radial direction were higher than tangential. The compressive ultimate strength in radial and tangential directions are not consistent between these two wood species, which might be depending on fir wood, has a higher latewood ratio, while Korea pine wood has more wood rays [16].
The mechanical properties of wood have been studied by using the finite element method (FEM), without the consideration of moisture content [17]. There was no detailed investigation of the effects of a wide range of moisture content, as well as the interactive effects of moisture and grain direction, on the mechanical properties of beech wood based on electrometric measuring method and FEM. In this study, we focused on obtaining the yield strength (σl, σr and σt), modulus of elasticity (El, Er and Et), Poisson’s ratio (Ulr, Ult, Urt, Url, Utr and Utl) and shear modulus (Glr, Glt and Grt) with different moisture contents (5%, 8.5%, 11.25%, 15.5%, 20%, 30% and 60%), using the experiment method, building the relationship between the moisture content and elastic constant. The abbreviation of l, r and t represented that the grain direction of longitude, radial and tangential. The moisture sensitivities with different elastic constants were summarized and analyzed. Then we verified the feasibility of using FEM to simulate the compressive performance under different moisture contents and three grain directions. It is hoped that this study will contribute to an in-depth understanding of the effect of moisture on anisotropic wood, and conducive to the numerical calculation and design optimization of outdoor beech wooden products.

2. Materials and Methods

2.1. Materials

The material used in this study was beech wood (Fagus orientails L.) brought from the local commercial store (Nanjing, China) that had an average air-dry density of 0.68 g/cm3, and the moisture content held at 11.25% before humidity conditioning.

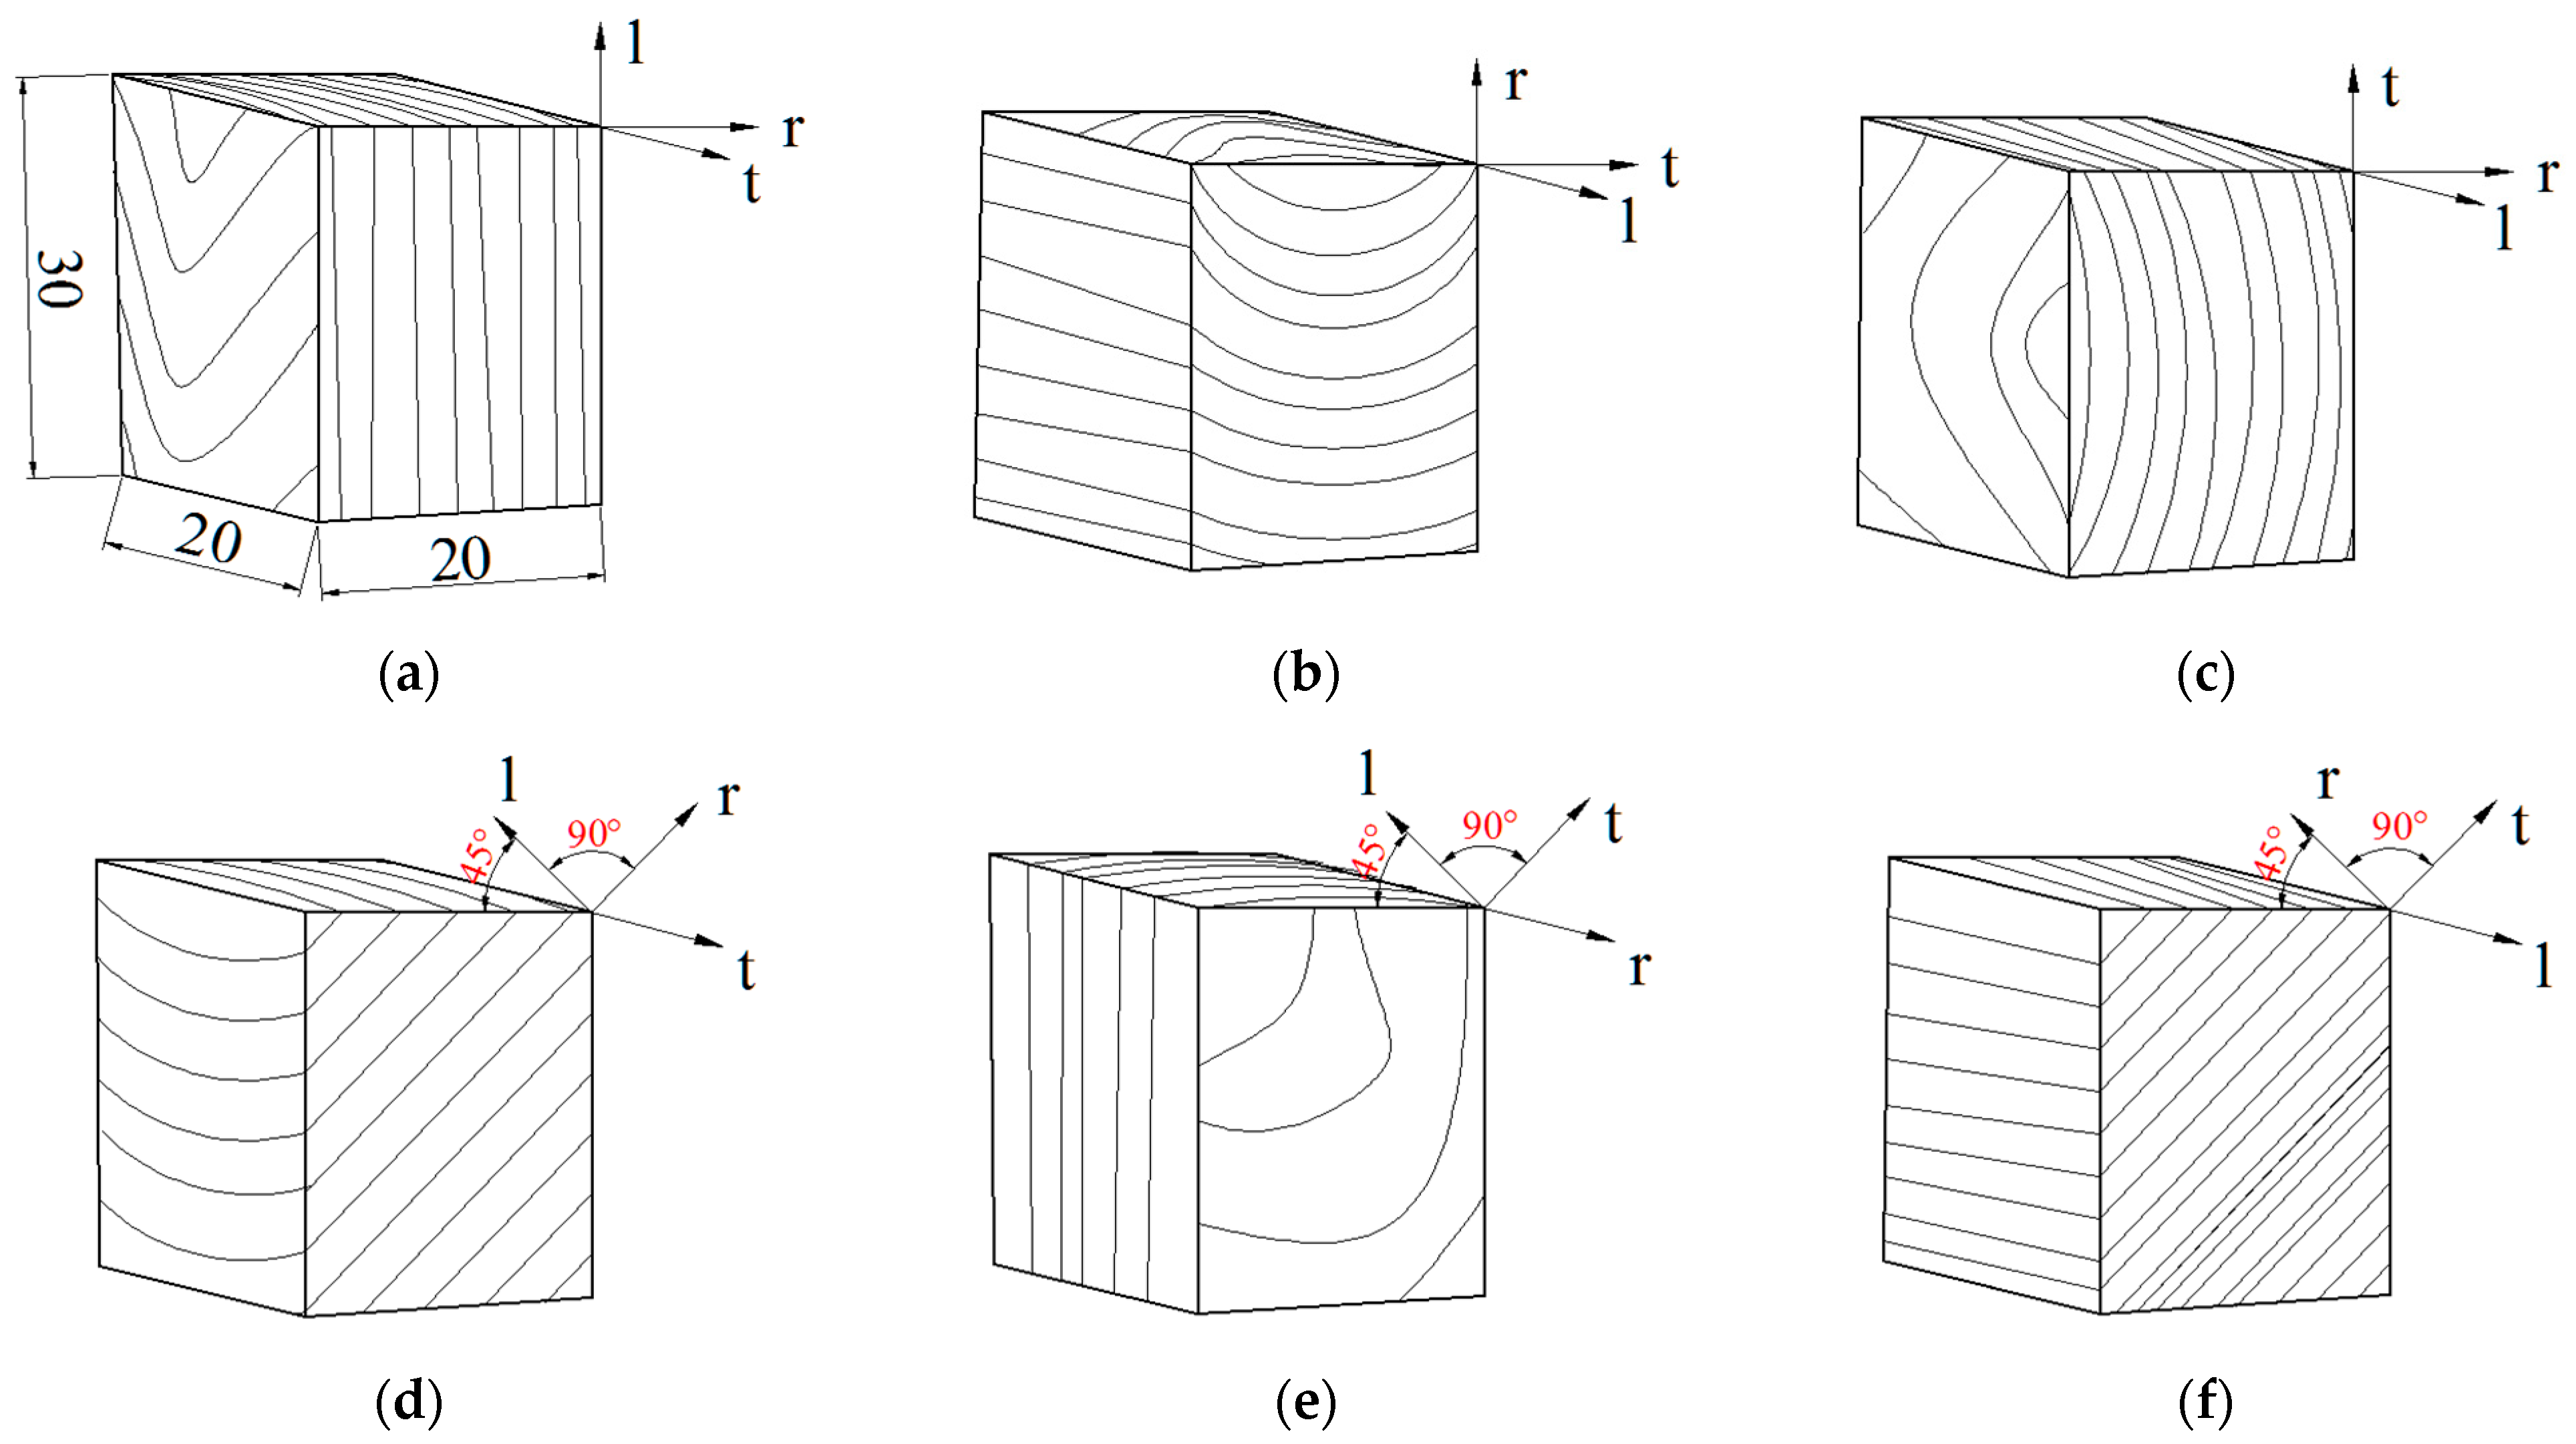
2.2. Configuration of Testing Specimens

The configurations of different testing specimens are shown in Figure 1. The dimension of testing specimen was 20 mm × 20 mm × 30 mm (width × depth × height).

2.3. Moisture Conditioning of Testing Specimens According to Different Targeted Moisture Contents

According to the humidity conditioning method of ASTM-D104 [18], and the moisture content-relative humidity relationship curve [19], the testing specimens of targeted moisture content of 5%, 8.5%, 15.5%, 20% and 30% were conditioned by placing them in desiccators. The temperature of those desiccators was kept at 25 °C. The specimen’s weight was regularly measured until it was stable. Table 1 shows each saturated salt solution’s corresponding targeted moisture content, as well as the measured value. The specimens with targeted moisture content of 11.25% were get directly from raw materials and left in indoor with 70% relative humidity and 25 °C for one week.
The testing specimens with the target moisture content of 60% were in a sealed bag filled with distilled water. The water temperature was 25 °C and the pH value was 7. Based on the preliminary experiment, these testing specimens were soaked water for 3 days and then balanced for 7 days in the climate chamber (98%, 25 °C), so the uniform moisture distribution of specimen could be achieved.

2.4. Testing Methods

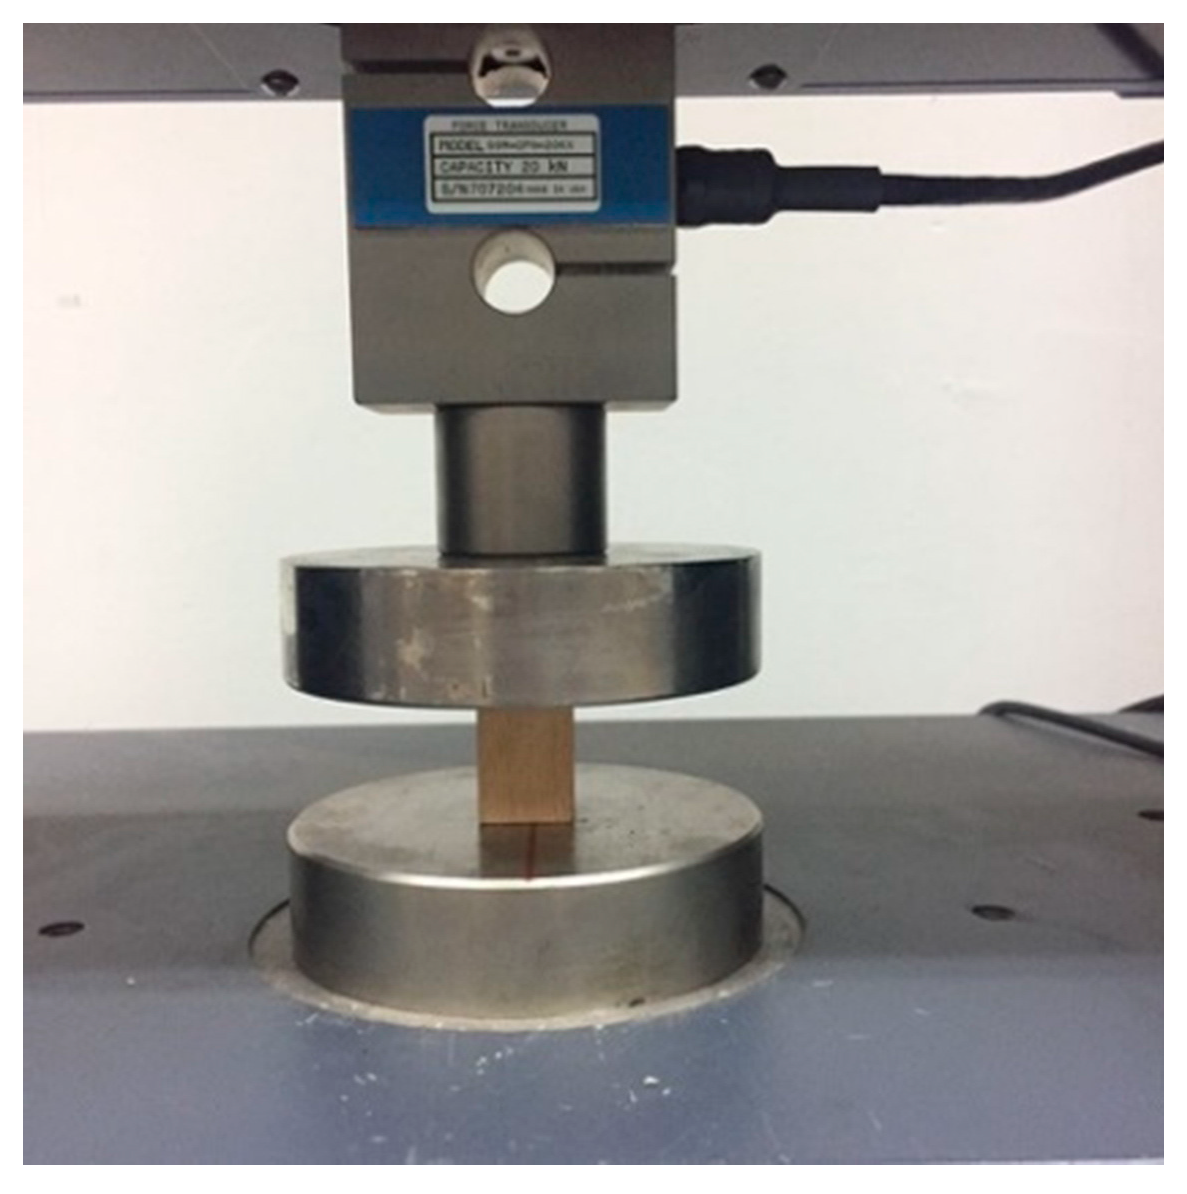
2.4.1. Measurement of Compressive Yield Strength of Beech Wood

The compressive yield strength of beech wood was measured according to the standard of GB/T1939-2009 [20]. The test was carried out using the AG-X type universal mechanical testing machine as shown in Figure 2. The yield point was determined by the strain compensation method, and the compensation value was 0.2% [16]. The compressive yield strength could be obtained by Equation (1).
σi = Fi/A (i = l; r; t),
where σi, Fi and A are the compressive yield strength, the compressive yield force and contact area.

2.4.2. Measurement of Elastic Constants Based on the Electrometric Method

The electrometric method was used to investigate the mechanical properties of wood of equilibrium moisture content [21,22]. In this study, it was adopted to measuring the compressive and shear modulus of beech wood under different moisture contents. The TDS-530 type data logger for determination the deformation of the sample with the highest resolution of 0.1 με was used in the study. The strain gauge was the type of BFH120-3AA-130 D100 with a sensitivity coefficient of 2.0 ± 1%. The AG-X type universal mechanical testing machine was used for the determination of compressive force. Figure 3a shows the specific strain gauge stick positions, and Figure 3b was the connection method of the quarter bridge two-wire between device of TDS-530 and the strain gauge.
The compressive MOE Ei, Poisson’s ratio Uij and the shear modulus Gij could be obtained by the Equations (2)–(4). The test and calculation methods of Gij were referred to the previous studies [8,22].
Ei = ∆Fi/ (A × ∆εi) (i= l, r, t),
Uij = ∆εj/∆εi (i = l, r, t; j = l, r, t),
Gij = ∆Fij/(2A(∆εh + ∆εv)) (i = l, r, t; j = l, r, t),
where the ∆Fi is the change value of compressive force within the elastic range, A was the contact area and ∆εi is the change value of strain along with the compressive direction within the elastic range. Uij is the Poisson’s ratio, and ∆εj is the change value of strain perpendicular to the compressive direction within the elastic range. Gij is the shear modulus; ∆Fij is the change value of force parallel to the compressive direction; ∆εh and ∆εv are the change value of strain in the horizontal direction and the vertical direction within the elastic range. Based on the preliminary experiment, the upper and lower limit forces used for the calculation of different types of the specimen within the elastic range were determined as shown in Table 2.
To verify the accuracy of the results obtained through the experiment method, Maxwell’s theorem was used to verify the results, as shown in Equations (5) and (6) [23].
Uij/Ei = Uji/Ej (i = l, r, t; j = l, r, t)
|Uij| < |Ei/Ej|1/2 (i = l, r, t; j = l, r, t)

2.4.3. Simulation of Wood’s Compressive Performance Based on FEM

The model was established through Solid Work and poured into ABAQUS. Static analysis section was used for wood compression simulation. The basic data (compressive MOE, shear modulus, yield strength and Poisson’s ratio) used to simulate the compression performance of beech wood were obtained from the decay fitting curves of each elastic constants, and the unit type used in this study was the C4D10R element. Then the compression performance curves derived from the simulation would compare with the curve obtained experimentally.

2.5. Experimental Design

The testing specimens were conditioned to the targeted moisture contents according to the ASTM-D104. [18] and soaking water treatment. Then, the compressive yield strength (σl, σr and σt) of different moisture contents was obtained, the replicates were 10 and a total of 210 tests. The test of elastic constants (El, Er, Et, Ulr, Ult, Urt, Url, Utr and Utl) and shear modulus (Glr, Glt and Grt) under varying moisture contents were obtained base on the electrometric method. There were 10 replicates under each condition, and 420 tests in total. The moisture sensitivities of different mechanical parameters were carried out to get a deep understanding of the effects of moisture on the mechanical properties of beech wood. Ultimately, the simulated compressive curves with varying moisture contents and three grain directions were obtained by FEM, comparing with the curves by experiment. The yield strength of wood was also obtained from FEM, which was compared with the experimental results to verify the accuracy of the results of FEM.

2.6. Statistical Analysis

Two-way analysis of variance (ANOVA) general line model (GLM) procedure was performed by SPSS software to determine the primary effects and their interaction in terms of grain direction and moisture content on the compressive yield strength, compressive MOE and shear modulus, separately. The Duncan test was carried out to determine the significant difference within the moisture content group and grain direction group for each mechanical property mentioned above, separately. All statistical analyses were performed at the 5% significance level. Based on the decay function of Origin software, the fitting relationship between moisture content and compressive yield strength, moisture content and compressive MOE, as well as moisture content and shear modulus of each grain direction were obtained separately. Functions (5) and (6) were carried out to make sure the accuracy of the experimental results. Within the moisture content of 8%–20%, moisture sensitivities of all mentioned mechanical parameters of beech wood were obtained; those values were also compared with the previous literature. Eventually, the compressive force–displacement curve obtained by FEM and experiment was generated by Origin software; the relative error between compressive yield strength obtained by FEM to that by experiment method was also achieved.

3. Results and Discussions

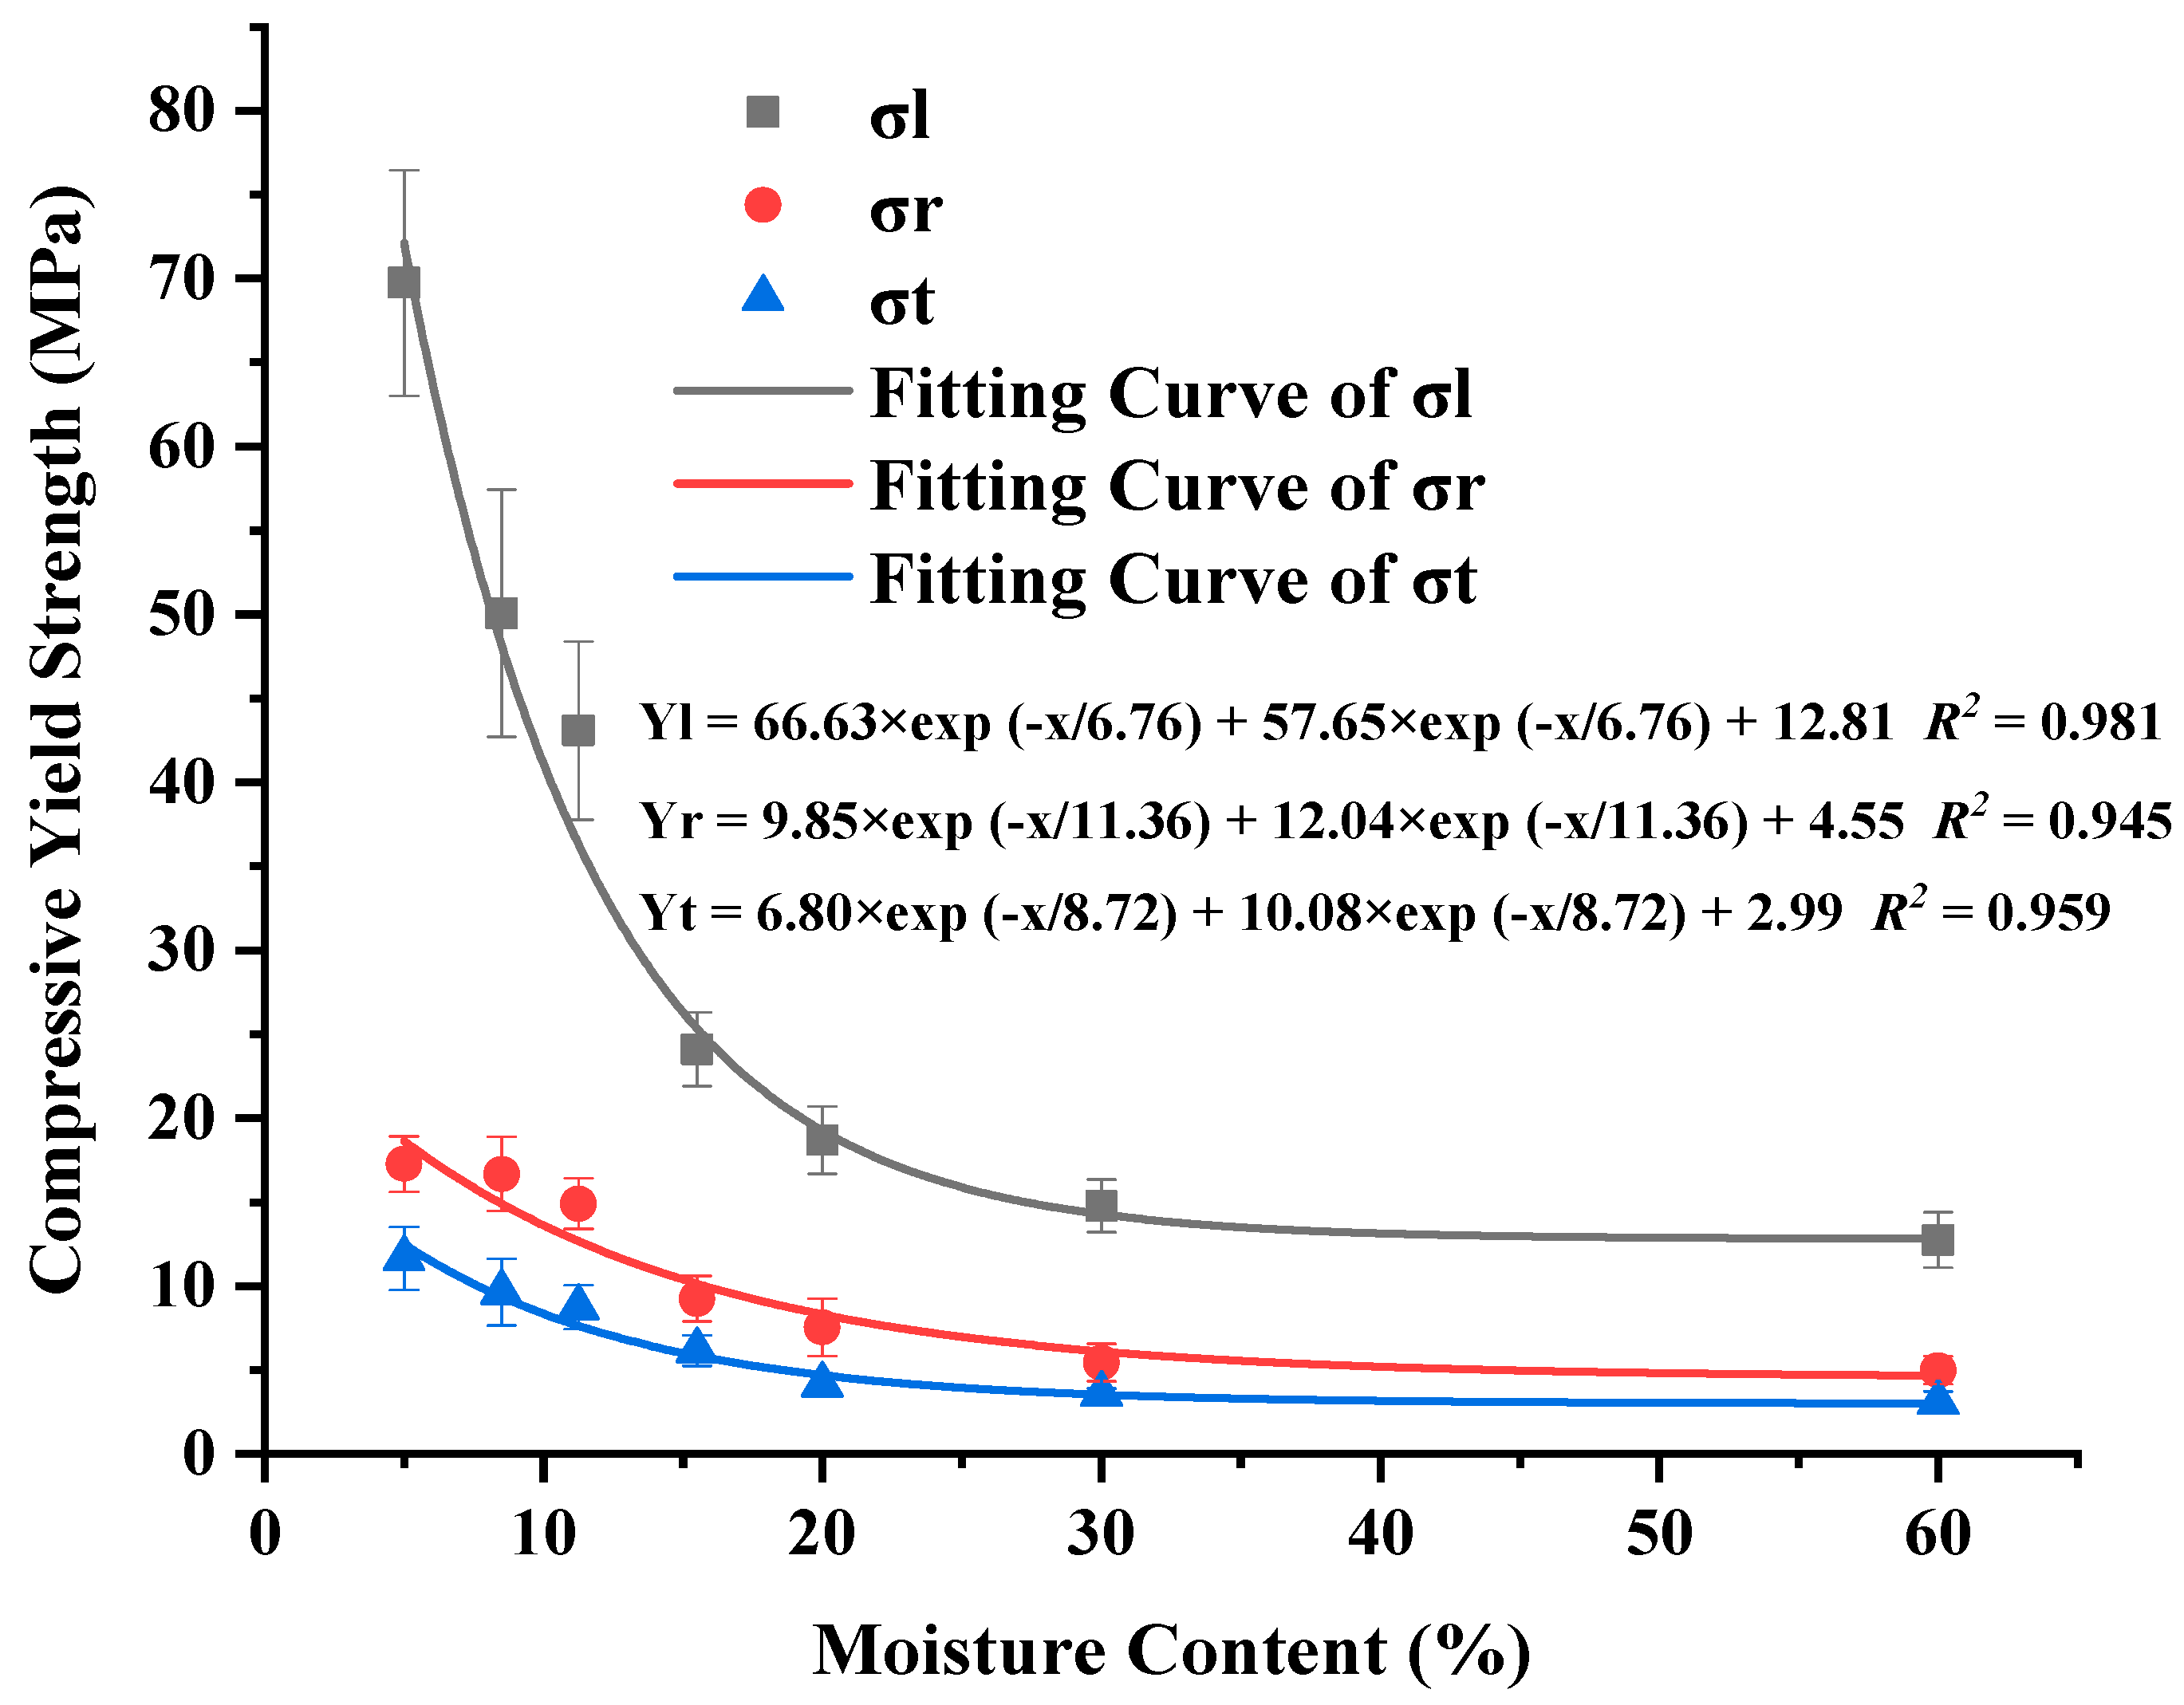
3.1. Compressive Yield Strength of Beech Wood with Different Moisture Contents and Grain Directions

Table 3 shows the moisture content (p < 0.05) and grain direction (p < 0.05) both have a significant effect on compressive yield strength. Meanwhile, the F value of grain direction was larger than that of moisture content, which suggested the anisotropy of beech wood played a more important role in the compressive yield strength than the moisture content. Closer inspection of Table 3, which shows its interactive effect (p < 0.05) also has a significant effect on the yield strength. The result indicated that the influence of moisture on diverse grain direction’s compressive yield strength was different. It is due to the anisotropy of shrinking and swelling of wood [24,25]. From the perspective of wood’s ultrastructure, it is related to the microfibrillar angle of the S2 layer of cell wall. Specifically, it is difficult for water to move in and out of the molecular chain of the elementary fibrils in the S2 layer, which is mainly parallel to the longitude direction, of the cell wall. However, it is easier for water to move in and out of the gap between the molecular chains, which results in that for a single cell, the change in the diameter direction is greater than the change in length. From a macro perspective, the longitudinal shrinkage and swelling of the wood are smaller than the transverse direction [26]. Yamamoto et al. [27] also reported that when the microfibrillar angle of S2 layer of cell wall beyond the degree of 40, shrinkage of longitude direction is greater than the tangential direction, which proved it again. Then, when wood along the transverse direction is compressed, the hydrogen bonds between the molecular chains are more likely to break. Thus, moisture is one of the factors that contribute to the phenomenon that wood along the transverse direction is more likely to enter the plastic zone than that of longitude direction.
Table 4 shows the mean values of compressive yield strength under each condition. With the increasing moisture content of 5%–30%, the compressive yield strength decreased. The same results were reported by Ozyhar et al. [28] and Jiang et al. [29] within the moisture of 0–16.3% and 10.3%–16.7%, respectively. Because water enters the amorphous region of the wood, making the percentage of cell walls per unit area decreases and the distance between the molecular chains expands, the connection between molecular chains is more likely to slip or break due to compressive stress, so the wood fibers are more prone to plastic deformation.
Duncan test shows that there is no significant difference between the yield strength of moisture content 30% and 60%, as shown in Table 4. It is due to that the free water above the fiber saturated point (FSP) had little effects on the mechanical properties of wood [30]. This result is related to that free water is mainly present in the cell lumen and has a limited effect on the cell wall, which serves as the main mechanical support [31]. It could be seen that the yield stress at 60% moisture content was slightly lower than that at the 30%, which was consistent with the study of Uhmeier and Salmen [32]. A possible explanation for this might be related to the effect of free water in the cell cavity at low strain rate [32]. However, the specific influencing mechanism still needs further study.
The results also suggested that the sequence of compressive yield strength values under each moisture content was that σl > σr > σt. This suggested that the wood still had anisotropy in the compressive yield strength under varying moisture contents. The σl:σr:σt in this study was 4.93:1.71:1 at the moisture content of 11.25%, which like results of 7.5:1.83:1 of Ozyhar et al. [28]. This can be explained by the variation of wood microstructure in terms of different grain orientations. The longitude yield strength of wood is greater than the transverse yield strength, which due to the microfilament angle of the S2 layer of the wood cell wall is almost parallel to the longitude direction of wood fiber. The radial yield strength of beech wood is greater than that of tangential, because beech wood does have denser wood rays, which plays a stronger supporting role in the radial compression [33]. Further checking Table 4, at 5% and 60% moisture content, the values of σl/σr were 4.038 and 2.553; and the values of σl/σt were 5.986 and 4.097. It demonstrated that moisture weakened the anisotropy of the compressive yield strength of beech wood.
Figure 4 shows the regression fitting curves between moisture content and yield strength of each grain direction, to get any value of compressive yield strength within the moisture content from 5% to 60%. The R2 values were all above 0.95.

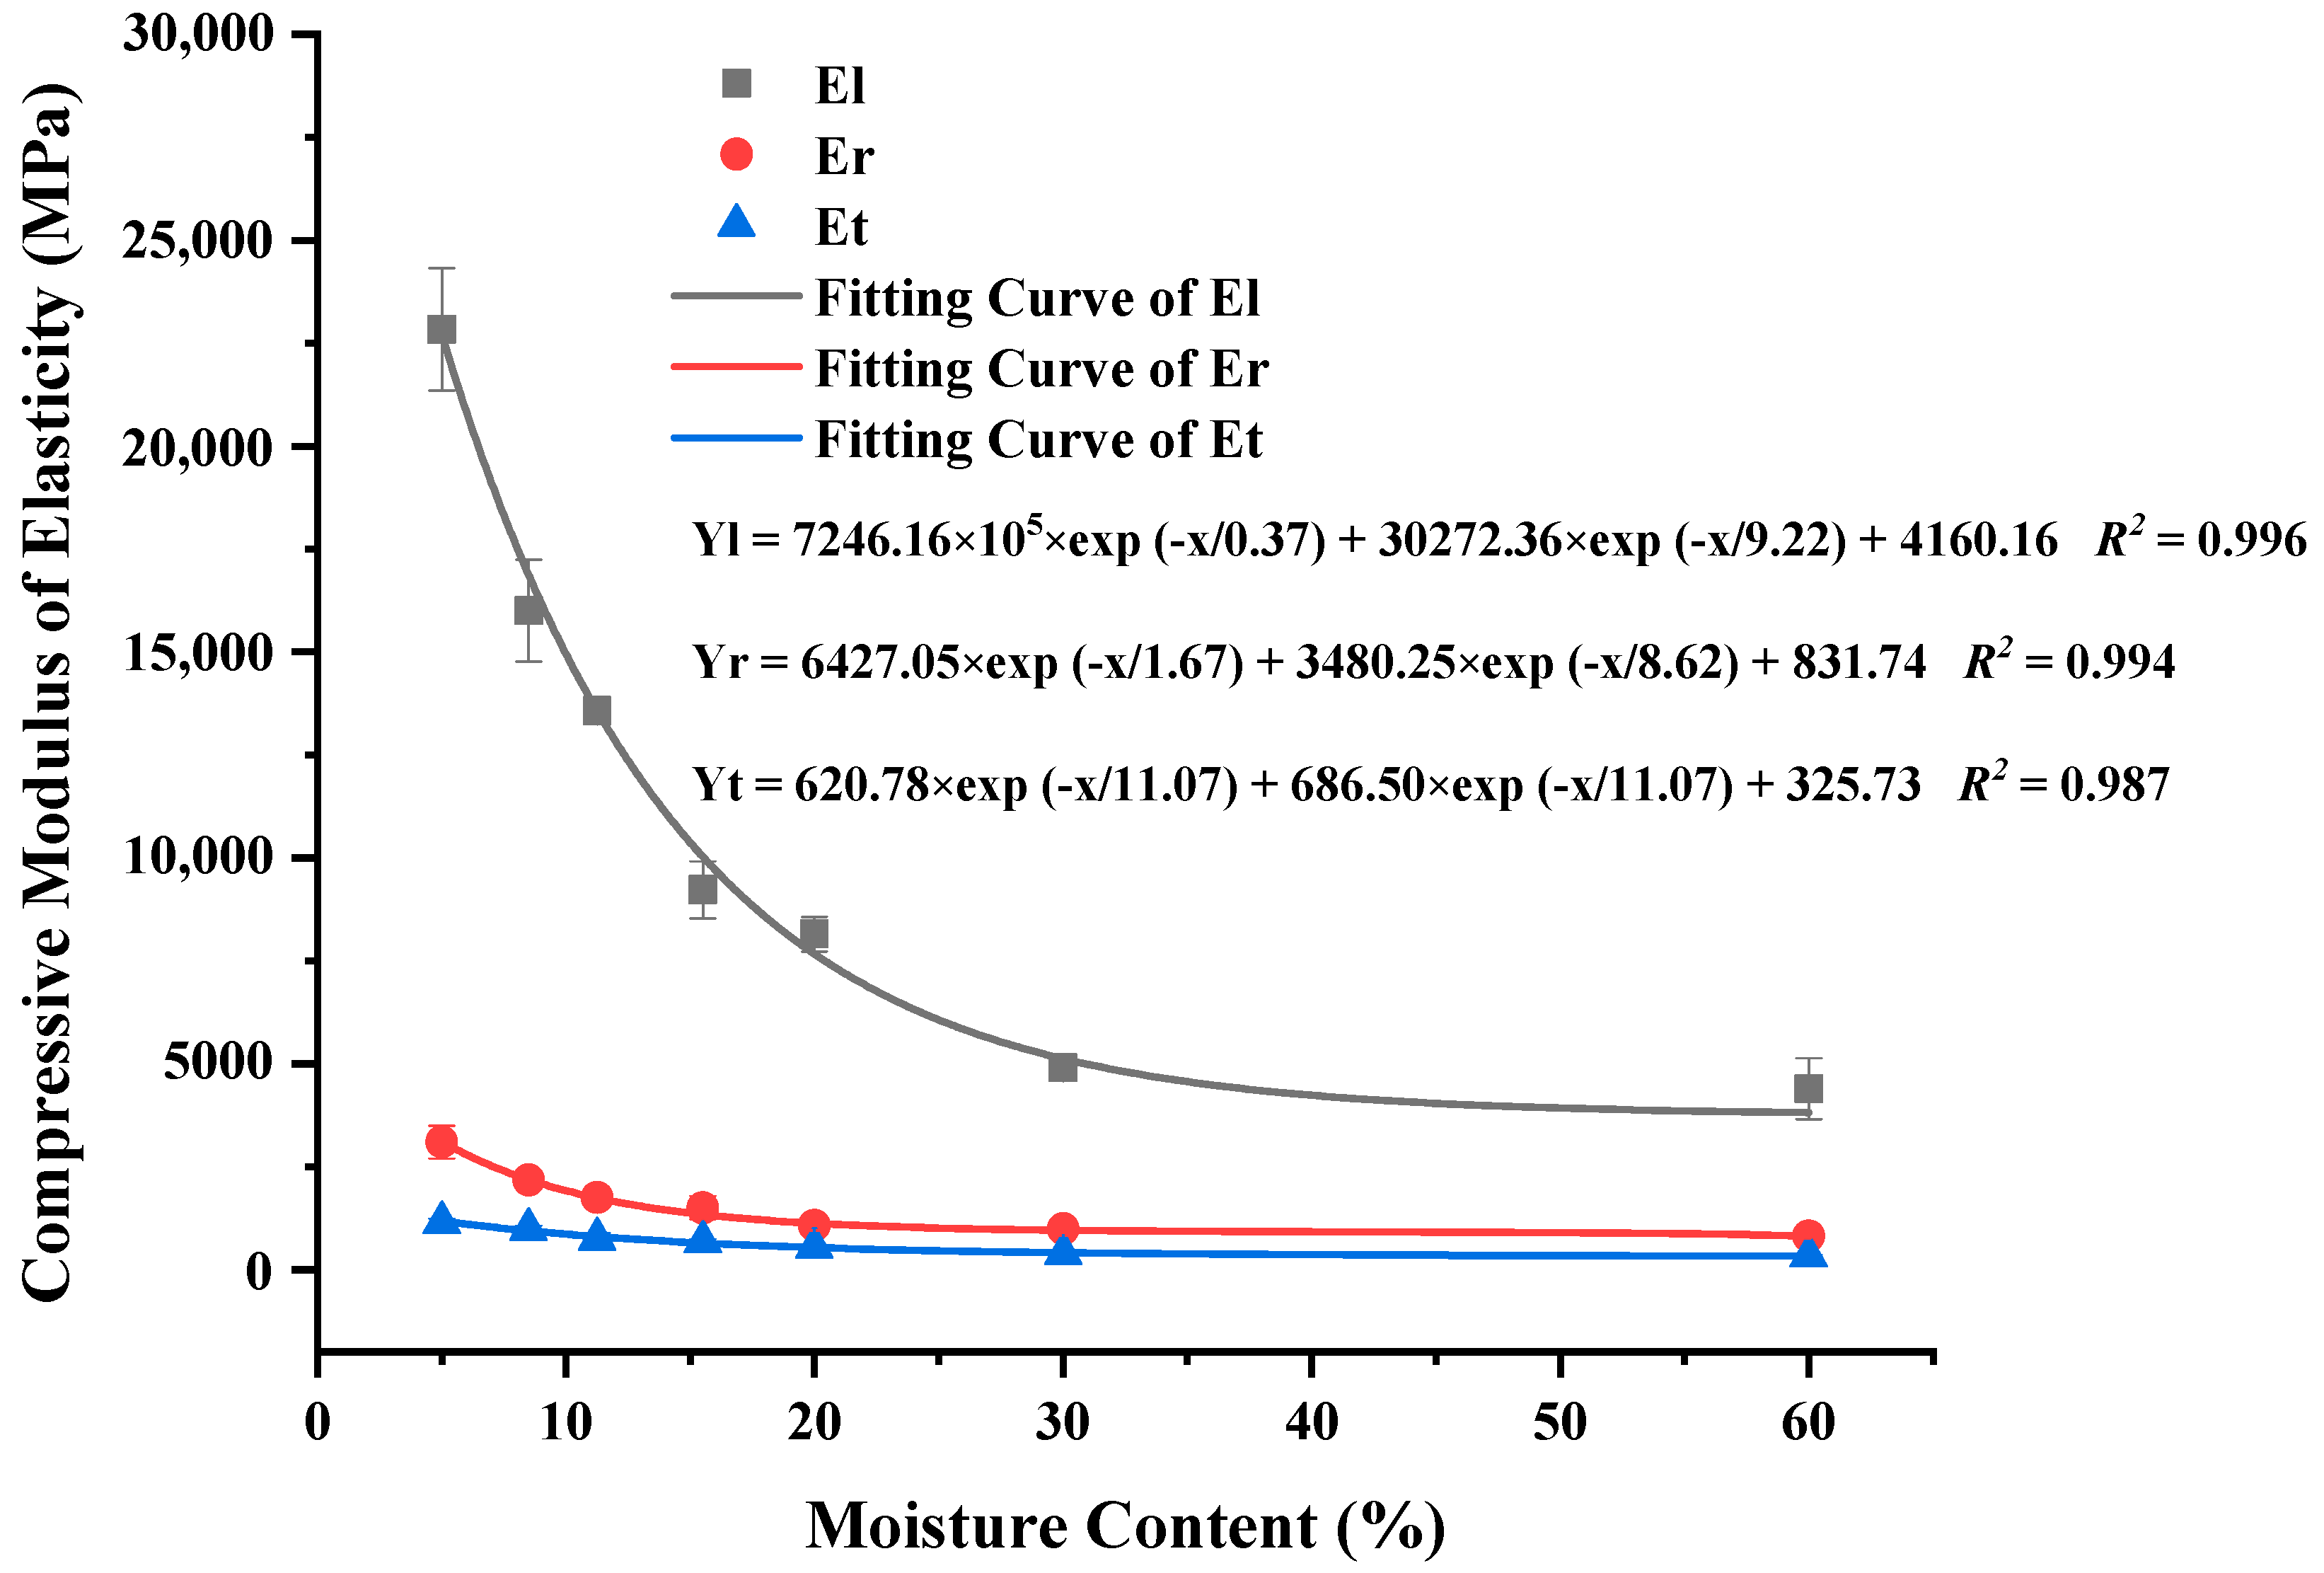
3.2. Compressive Elastic Contents of Beech Wood with different Moisture Contents and Grain Depictions

Table 5 suggests the moisture content and grain direction and their interaction effect all have significant influence (p < 0.05) on the compressive MOE. The grain direction had a stronger effect on the compressive MOE, followed by the moisture content. Their interaction effect also had a significant influence on the compressive MOE. It indicated that under the condition of compression, the moisture’s influence on the degree of fiber deformation in varying directions was different. This finding was consistent with the results of compressive yield strength, as well as the internal influence mechanism mentioned above.
Table 6 presents the mean values of compressive MOE under different moisture contents and grain directions. The Duncan tests revealed that there were significant differences between the groups of 5%–30% under each grain direction, but it showed no significant difference between the groups of 30% and 60%. It might be inferred from the Duncan multiple comparison test that the FSP was between the moisture content of 20 and 30%, because moisture content above the FSP has no obvious effects on the mechanical properties of wood. This agreed with the finding of Báder and Németh [9], who pointed out the FSP of beech wood is about 25.6%.
It also suggested the significant difference between the groups of three grain directions of each moisture content. The compressive MOE along the longitude direction El was larger than that along with the transverse direction, Er and Et, under each moisture content. It indicated the beech still had anisotropy of the modulus of elasticity at different moisture content. The value of El:Er:Et was 18.25:2.35:1 under the moisture content of 11.25%. A previous study stated that the El:Er:Et of beech wood was 23.17:3.14:1 under 12.5% moisture content [12]. Güntekin and Aydın [34] reported that the ratio is 23.44:3.58:1 of Anatolian black pine wood. Data from the study of Jiang et al. [29] suggested the ratio was 20.39:1.39:1 of Chinese fir wood. The ratio in the study of Güntekin et al. [35] was 8.5:1.6:1 of sessile oak wood. Variations in wood species or measurement methods could cause differences in results, but all above previous studies hold the same magnitude as the results in this study approximately. Further analyzing Table 6, at 5% and 60% moisture content, the values of El/Er were 7.366 and 5.368; and the values of El/Et were 19.936 and 12.914. It proved that moisture also weakened the anisotropy of the modulus of elasticity of beech wood.
To get a comprehensive compressive MOE value within the moisture content of 5%–60%, the relationship between moisture content and compressive MOE of each grain direction was obtained as shown in Figure 5. The curves fit well with the decay function, and the R2 values were all above 0.99.
Table 7 provides the mean value of Poisson’s ratio of different moisture contents. The results suggested that moisture content had a significant influence on the Poisson’s ratio (p < 0.05). For the Poisson’s ratio of Ulr and Ult, the value of them decreased from moisture content of 5%–30% and then raised from that of 30%–60%. It is in line with the previous study of Mizutani and Ando [36] that below the FSP, the Ulr and Ult of Japanese cypress and Magnolia wood have a negative relationship with moisture content; and above the FSP, they have a positive relationship with moisture content. A possible explanation for this might be that free water moves forward to tangential and radial direction when compression load along the longitude direction, resulting in increasing transverse strain [36]. From the observation of the Duncan multiple test results, there was no obvious regulation between the moisture content and other Poisson’s ratios, which was similar to the report of Erik et al. [37]. There was an interesting result that the rule of Ult > Ulr, Url >Utl, Urt >Utr under each moisture content, which perhaps due to the deformation of beech wood along the tangential direction is larger than radial direction under compression within the elastic range [14].
According to the Functions (5) and (6), the validity of the experimental results was checked. It could be seen from Table 8 that the value of Uij/Ei was mainly equal to the Uji/Ej. The value of Uij was smaller than the |Ei/Ej|1/2 could also be seen obviously through Table 6 and Table 7.

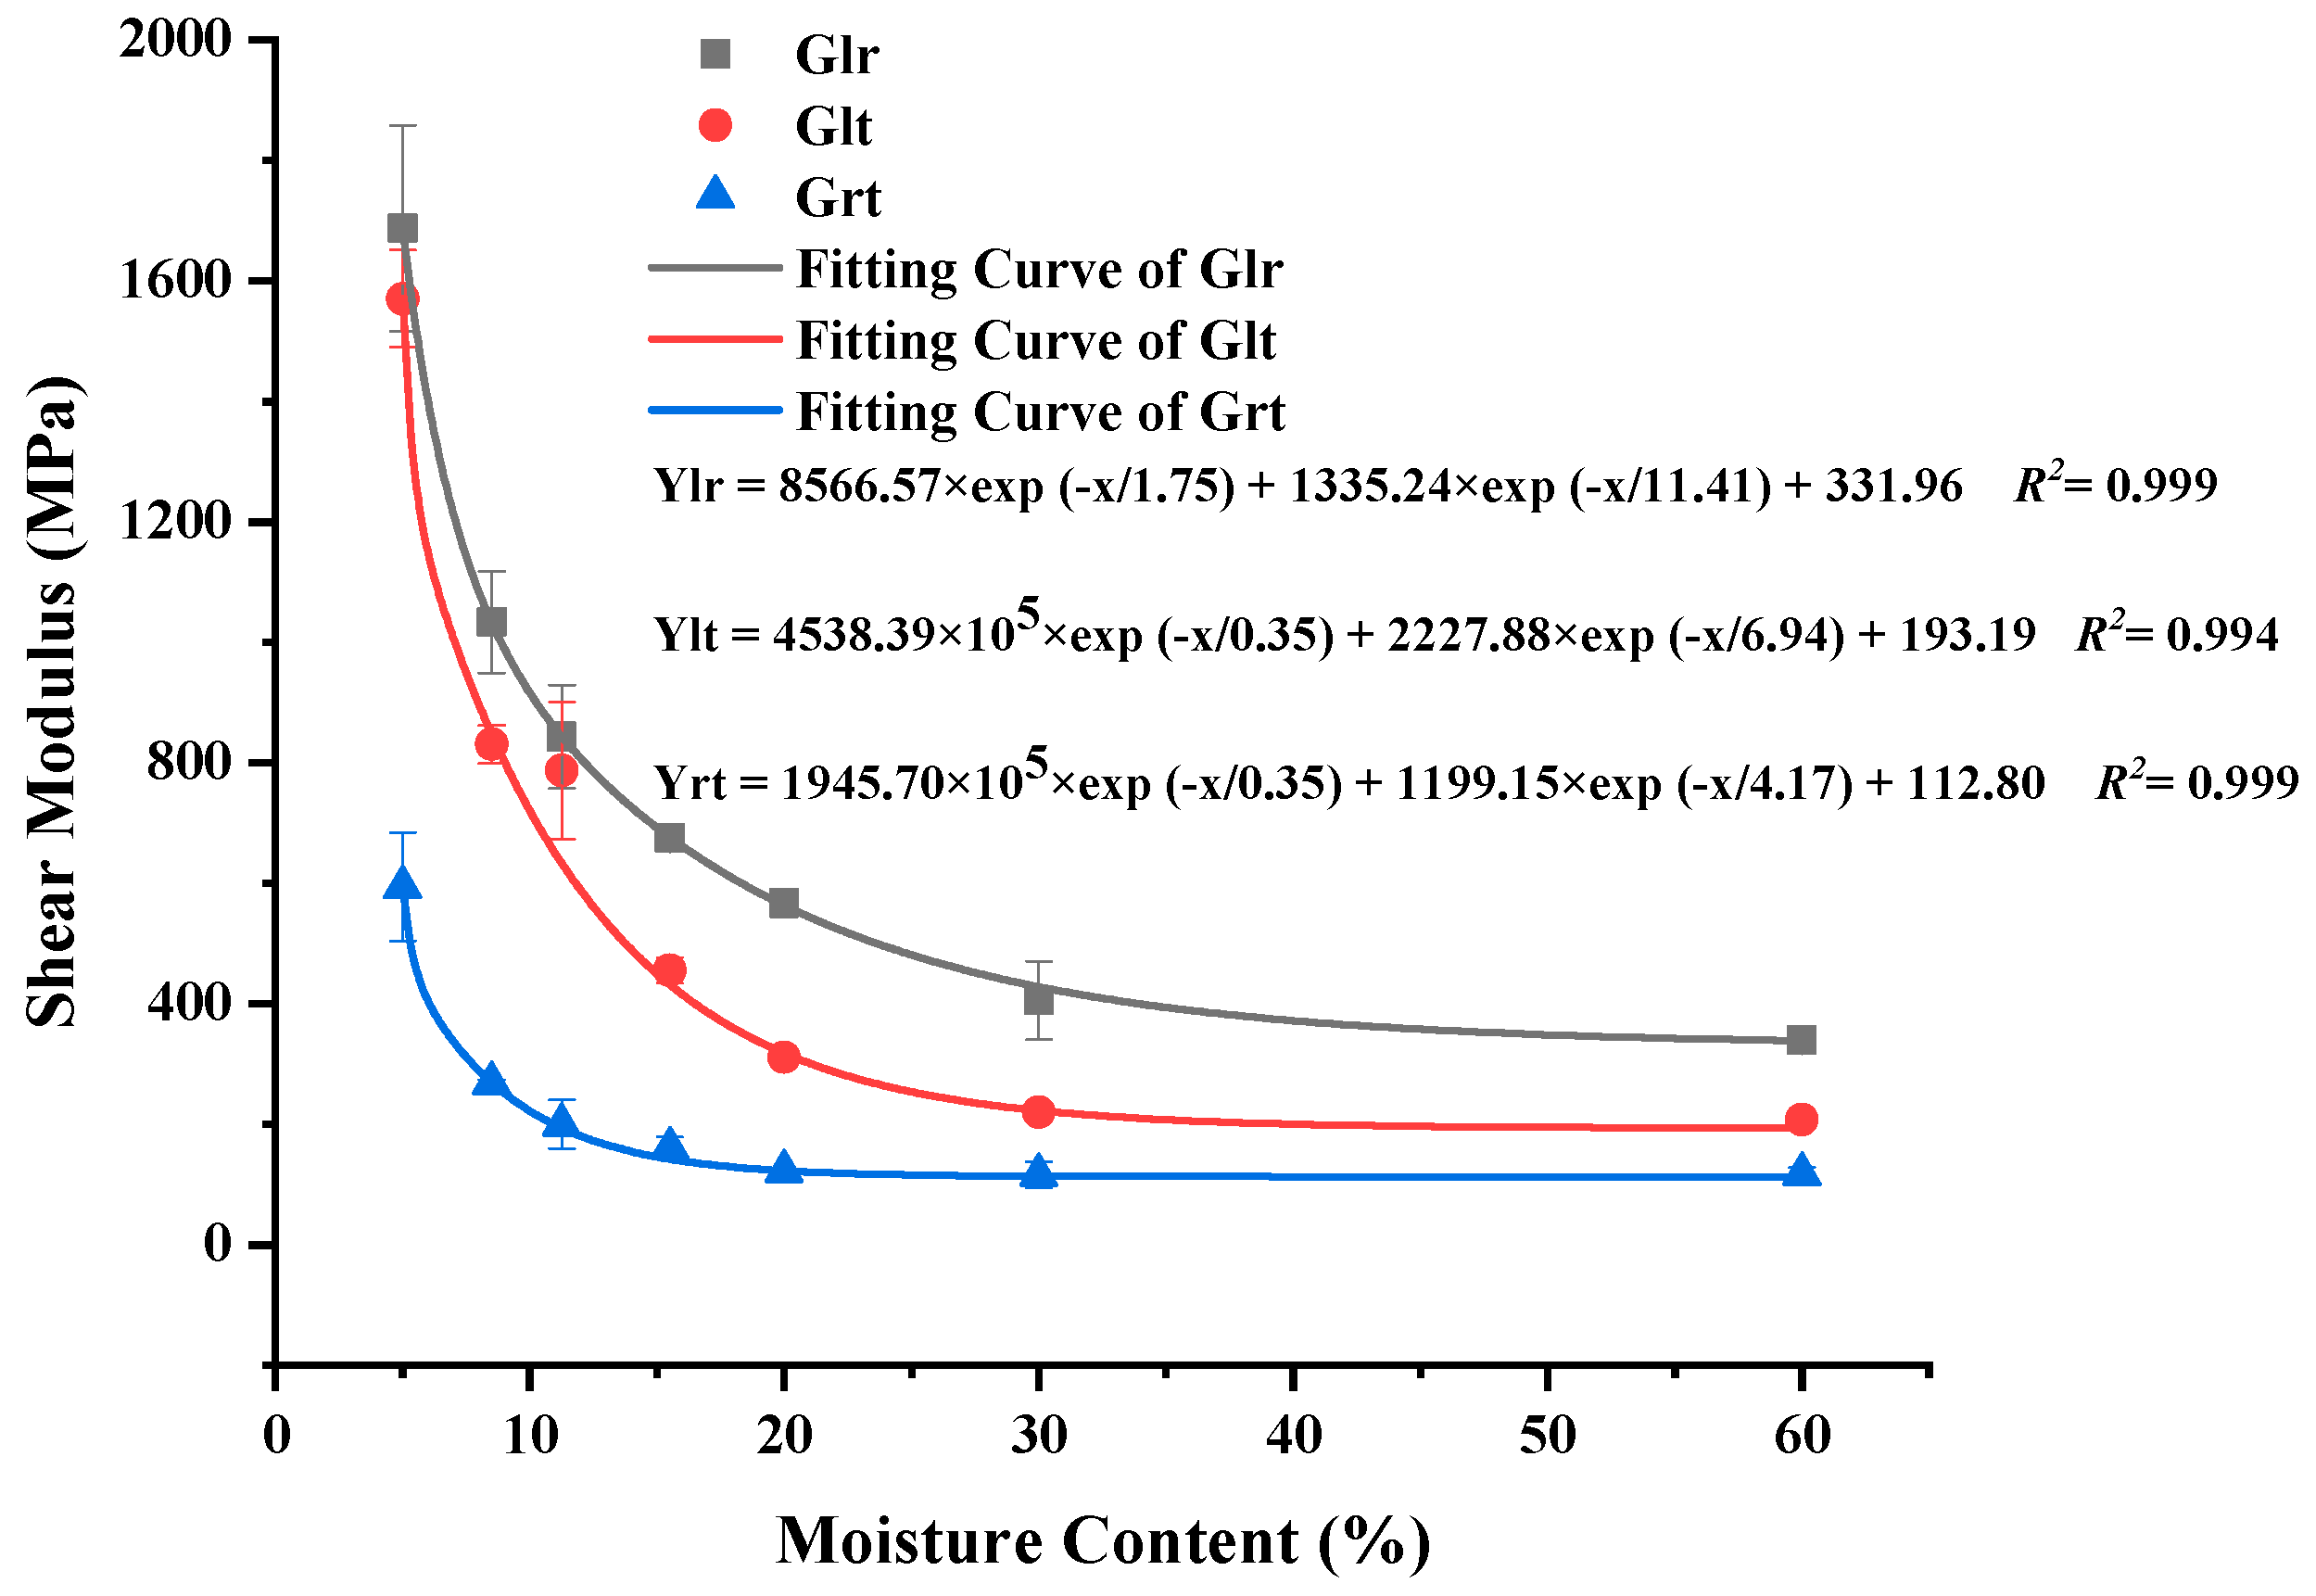
3.3. Shear Modulus of Beech Wood with different Moisture Contents and Grain Directions

It can be seen from Table 9 that the moisture content and grain direction had a significant influence (p < 0.05) on the shear modulus. It also found that moisture content had different effects on the shear plane of different types (lr, lt and rt), considering the interactive effects between moisture content and grain direction was also significant (p < 0.05) on shear modulus. It might relate to the different moisture responses to shear planes with varying grain orientations, and the distinct structural characteristics of beech wood.
Table 10 provides an overview of the mean values of shear modulus under each condition. The results of the Duncan multiple comparison tests indicated the significant differences between every two groups of 5%–30%. However, the difference between the 30 and 60% groups was insignificant. The moisture’s effects below the FSP on the shear modulus also attributes to the entry of bound water would weaken hydrogen bonding between the elementary fibrils [26].
Table 10 suggests that the value of the shear modulus of each moisture content obeys the rule of Glr > Glt > Grt. The value of Glr:Glt:Grt was 4.22:3.94:1 of 11.25% moisture content, which was mainly in agreement with Güntekin and Aydın’s [34] finding, that was 4.67:3.58:1 of black pine wood. The ratio obtained by Erik et al. [37] was 5.38:3.96:1of Walnut wood. This result may be explained by the fact that the test of Grt mainly compresses the earlywood on the rt shear plane. The deformation of the earlywood leads to the initial shear deformation, and then the failure occurs along with the earlywood and wood rays. The earlywood and wood ray are softer parts in the structure of wood, so the Grt value is lower [38]. The loading direction is perpendicular to the long axis direction of wood fiber cells, so that the fiber cells are compressed laterally also contribute to this phenomenon. For Glr and Glt, the angle between the loading direction and the axial direction of wood fiber cells is small, leading to higher shear modulus. Bahmanzad et al. [39] also confirmed that the shear modulus and strength were both decreased with the increasing of degree between fiber orientation and load direction of eastern hemlock wood, as well as the results of Zhang and Yang [15].
To predict the value of shear modulus, the relationship between moisture content and shear modulus was generated as seen from Figure 6; the R2 values were all above 0.99.

3.4. Moisture Sensitivity of Different Elastic Constants of Beech Wood

The moisture sensitivity (k) is defined as Function (7) [8,10].
k = ((∆ϴ/∆MC)/ϴ11.25)100%
where ∆ϴ stands for the changed value of elastic constants from moisture content 8.5%–20%; ∆MC is the changed value of moisture content; ∆ϴ11.25 is the value of elastic constants at the moisture content 11.25%.
Table 11 shows moisture sensitivities of different elastic constants in this paper and results obtained by previous works, within the moisture content of 8.5%–20%. This table was quite revealing in serval ways. The sensitivities of the nine types of elastic constant obtain in this paper were all in the same level of magnitude compared with previous literature. However, the sensitivity of different elastic constants to moisture was somewhat different. Specifically, the moisture sensitivity of yield strength of longitude (σl) was greater than that of transverse (σr and σt), which agreed with the earlier studies shown in Table 9. The moisture sensitivity of MOE of longitude (El) was smaller than that of transverse (Er and Et). Previous studies [12,28,29] also demonstrated that Er and Et were influenced by moisture to a higher degree than the El. Then, the results obtained from Table 9 supported the idea that the moisture sensitivity of compressive yield strength was higher than the compressive stiffness, overall. The finding was also reported by Dinwoodie [40]. Ultimately, for shear modulus, the Grt was more sensitive to moisture than Glr and Glt. It was also consistent with the prior research in Table 9, except for cherry wood in the study of Bachtiar et al. [37]. This may be due to the different wood microscopic structures like the latewood ratio or test method.

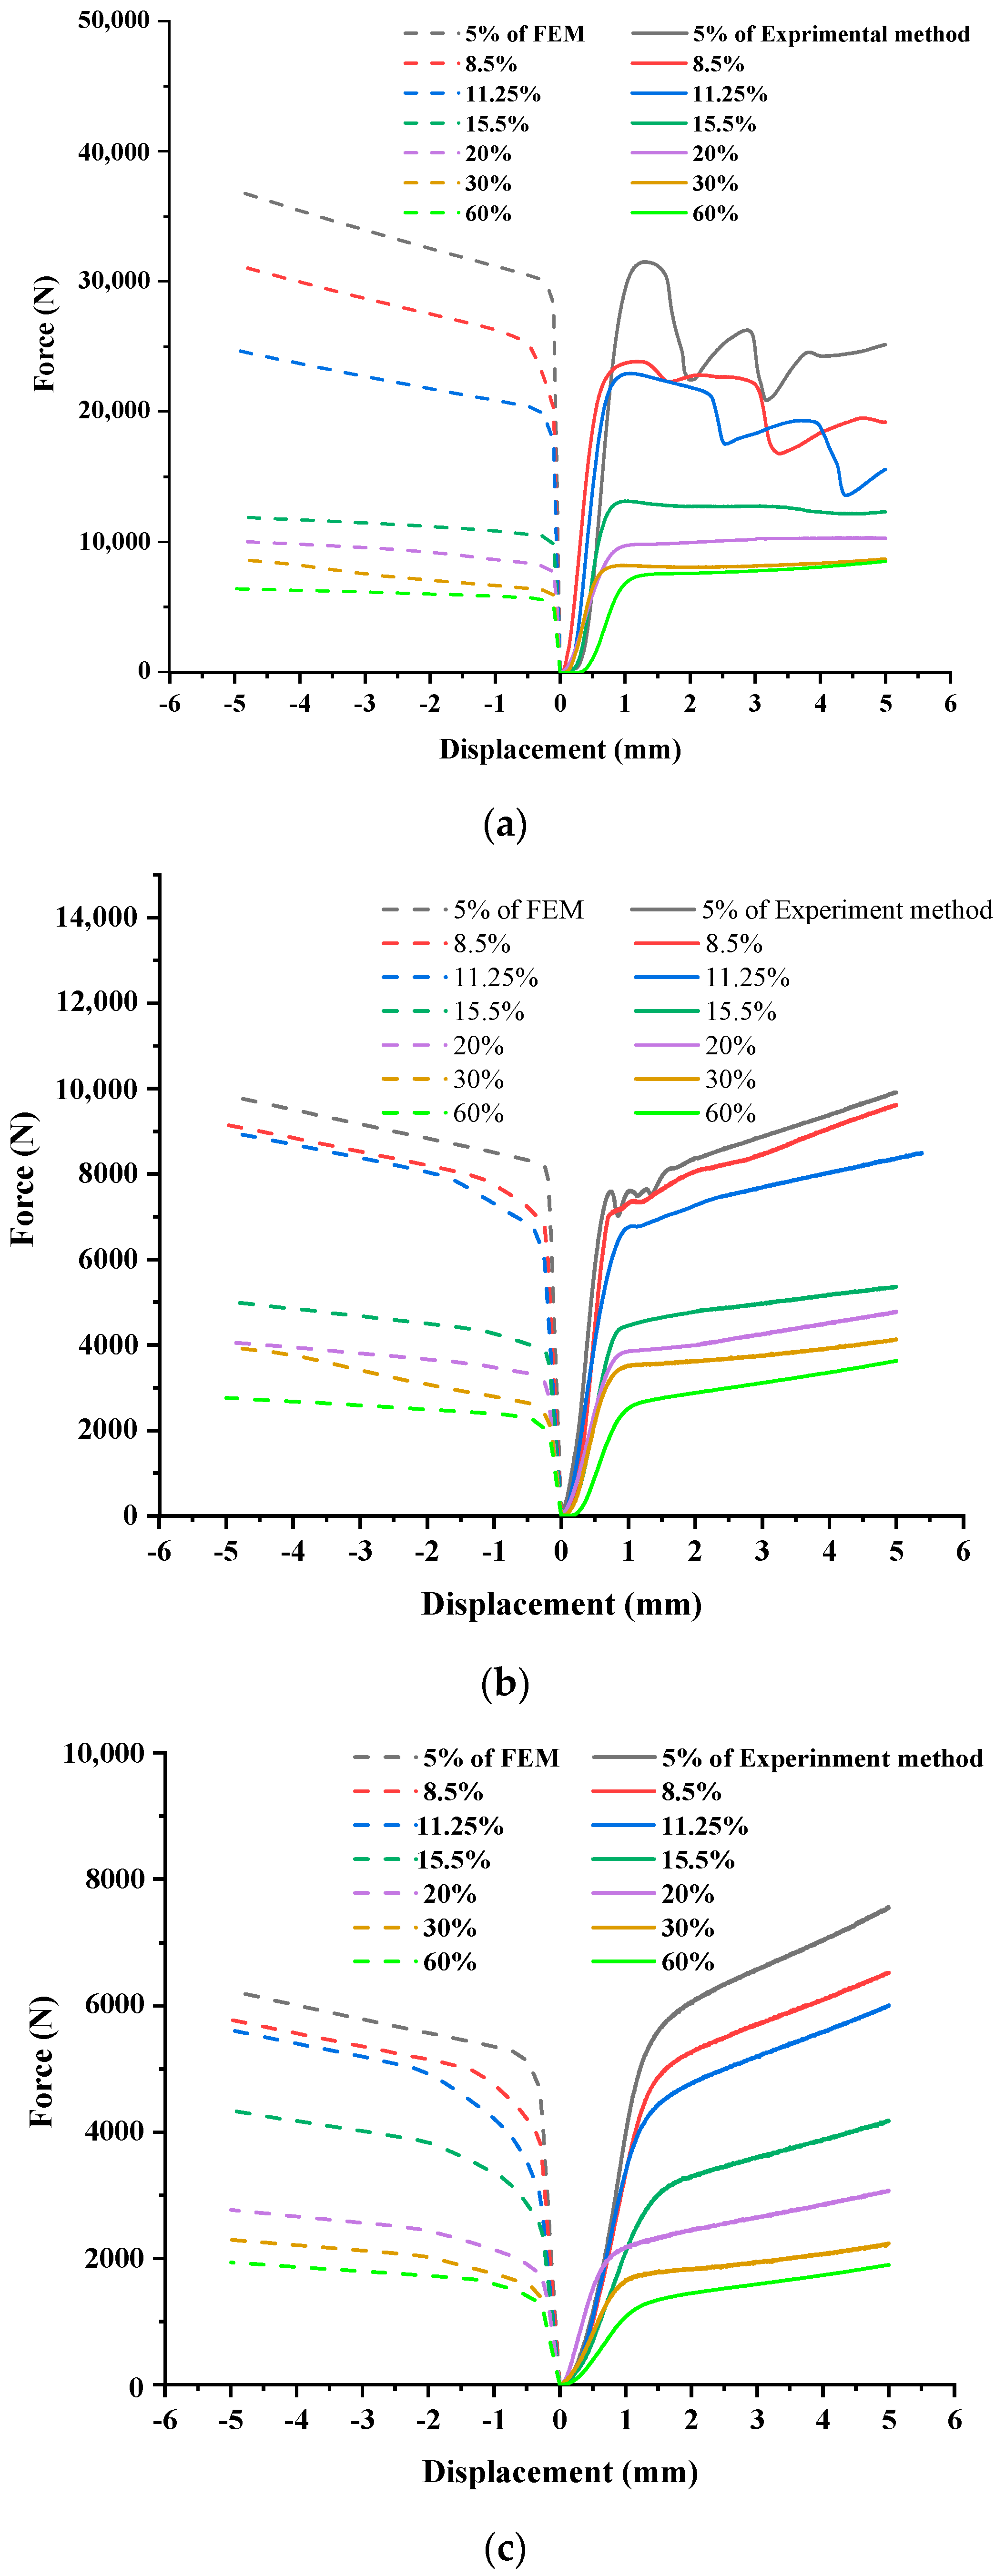
3.5. Comparison of the Results Obtained by Finite Element Method and Experiment Method

The compressive force–displacement curves through FEM and experimental method of different moisture contents and three grain directions were obtained as shown in Figure 7.
Close observation of Figure 7 shows that the trend of the curves between FEM and experiment method under each condition is consistent approximately. Nevertheless, there was a tendency, for testing specimens under longitude compression of moisture content 5%, 8.5% and 11.25%, that the curves obtained experimentally suddenly decreased after the peak, as shown in Figure 7a. Because the lower moisture content leads to lower plasticity, and micro-fracture occurs after the wood reaches the ultimate stress. Compared with the curves obtained by FEM, the experiment results showed a crawling tendency in the initial stage, which was mainly caused by the non-ideal contact between the surface of the specimen and indenter, at the early stage of compression.
The results obtained by the FEM also followed the rule that compressive yield strengthen of longitude > radial > tangential under each moisture content. The influence trend of moisture on the compressive force was also similar to the experiment results (Figure 7). Seen from Figure 7, with the increasing moisture content of each grain direction, the bend of the curve became much smooth gradually; the yield point of wet wood under compression tended to be less pronounced than wood in dry conditions. Because the moisture makes the wood fiber’s ductility increases, which similar to the research of Báder and Németh [9].
Table 12 shows the relative error, which between compressive yield strength obtained by FEM and that attained by experiment method, ranged from 0.49% to 16.10%. This also demonstrated that the FEM could be used to simulate the compressive elastic–plastic behavior of wood within a wide range of moisture content.
Further studies will focus on the influence of moisture content and grain direction on the mechanical properties of mortise and tenon joint based on experiment and finite element method.

4. Conclusions

The major conclusions of this study are as the follows:
  • Compared with the moisture content, the grain direction had a stronger effect on the elastic constants. The interactive effects of moisture with grain direction did also had significant effects on the elastic constants of beech wood. It suggested that moisture was one of the factors that contributed to that wood along the transverse direction was more likely to enter the plastic zone than that of longitude direction.
  • This research followed the rule of σl > σr > σt, El > Er > Et and Glr > Glt > Grt, with regarded to each moisture content. It demonstrated that, when under the influence of moisture, the wood still had the anisotropy; however, the moisture weakened the anisotropy of beech wood’s compressive yield strength and its modulus of elasticity.
  • The decay function can be used to fit the experimental results well, and the fitting formulas could predict the value of elastic constants within moisture contents of 5%–60%; the R2 values were all above 0.95.
  • The moisture sensitivity of various elastic constants was different. It suggested that the moisture sensitivity of σl was bigger than that of σr and σt, while the moisture sensitivity of El was smaller than that of Er and Et, which demonstrated that moisture sensitivity of compressive yield strength was higher than its stiffness when wood is along the longitude direction. Besides this, the moisture sensitivity of Grt was greater than those of Glr and Glt.
  • FEM can be used to simulate the compression performance of wood with a wide range of moisture contents (5%–60%). The trend shown in result of FEM was consistent with the experiment in terms of the effects of moisture content and grain direction. The relative error between the compressive yield strength obtained by FEM and that attained by experiment method ranged from 0.49% to 16.10%.

Author Contributions

Conceptualization, H.-Y.G., S.K. and W.-L.F.; methodology, H.-Y.G. and W.-L.F.; software, W.-L.F.; validation, H.-Y.G. and W.-L.F.; investigation, W.-L.F.; resources, H.-Y.G. and W.-L.F.; data curation, W.-L.F.; writing—original draft preparation, W.-L.F.; writing—review and editing, H.-Y.G., S.K. and W.-L.F. All authors have read and agreed to the published version of the manuscript.

Funding

This work was supported by A Project Funded by the National First-Class Disciplines (PNFD) and A Priority Academic Program Development of Jiangsu Higher Education Institutions (PAPD).

Acknowledgments

The authors thank the Furnishing and Industry College of Nanjing forestry university for supplying laboratories, equipment and technical staff for this experiment. We are also grateful to the reviewers and editors for their valuable time and suggestions for improving the quality of this paper.

Conflicts of Interest

The authors declare no conflict of interest.

References

  1. Fang, L.; Zeng, J.; Zhang, X.H.; Wang, D. Effect of Veneer Initial Moisture Content on the Performance of Polyethylene Film Reinforced Decorative Veneer. Forests 2021, 12, 102. [Google Scholar] [CrossRef]
  2. Pan, F.Q.; Feng, X.H.; Wu, Z.H. Evaluation of Physical and Mechanical Properties of Canadian Aspen. Chin. J. Wood Sci. Technol. 2020, 34, 9–12. [Google Scholar] [CrossRef]
  3. Fang, X.Y.; Xu, W.; Huang, Q.T. Research on the Physical and Mechanical Properties of Plantation Small-diameter Teak. For. Mach. Woodwork. Equip. 2019, 47, 40–44. [Google Scholar] [CrossRef]
  4. Sawata, K. Strength of bolted timber joints subjected to lateral force. J. Wood Sci. 2015, 61, 221–229. [Google Scholar] [CrossRef] [Green Version]
  5. Wang, X.H.; Wu, Z.H.; Li, X.Z.; Wang, Z.M.; Zhou, H.J. Effect of Climatic Factors on the Deformation of Solid Wood Composite Door. China For. Prod. Ind. 2015, 5, 16–19. [Google Scholar]
  6. Hu, W.G.; Liu, N.; Guan, H.Y. Experimental Study of the Contact Forces and Deformations of Mortise-and-Tenon Joints Considering the Fits and Grain Orientations of the Tenon. Bioresources 2019, 14, 8728–8737. [Google Scholar] [CrossRef]
  7. Zhao, Z.Y.; Wu, D.; Huang, C.H.; Zhang, M.; Umemura, K.; Yong, Q. Utilization of Enzymatic Hydrolysate from Corn Stover as a Precursor to Synthesize an Eco-friendly Adhesive for Plywood II: Investigation of appropriate manufacturing conditions, curing behavior, and adhesion mechanism. J. Wood Sci. 2020, 66, 1–10. [Google Scholar] [CrossRef]
  8. Aydin, T.Y.; Ozveren, A. Effects of Moisture Content on Elastic Constants of Fir Wood. Eur. J. Wood Wood Prod. 2019, 77, 63–70. [Google Scholar] [CrossRef]
  9. Báder, M.; Németh, R. Moisture-dependent Mechanical Properties of Longitudinally Compressed Wood. Eur. J. Wood Wood Prod. 2019, 77, 1009–1019. [Google Scholar] [CrossRef] [Green Version]
  10. Jiang, Z.H.; Wang, H.K.; Tian, G.L.; Liu, X.E.; Yu, Y. Sensitivity of Several Selected Mechanical Properties of MOSO Bamboo to Moisture Content Change under the Fiber Saturation Point. Bioresources 2012, 7, 5048–5058. [Google Scholar] [CrossRef] [Green Version]
  11. Koponen, S.; Toratti, T.; Kanerva, P. Modeling Longitudinal Elasticity and Shrinkage Properties of Wood. Wood Sci. Technol. 1989, 23, 55–63. [Google Scholar] [CrossRef]
  12. Hering, S.; Keunecke, D.; Niemz, P. Moisture-dependent Orthotropic Elasticity of Beech Wood. Wood Sci. Technol. 2012, 46, 927–938. [Google Scholar] [CrossRef] [Green Version]
  13. Roszyk, E.; Stachowska, E.; Majka, J.; Mania, P.; Broda, M. Moisture-dependent Strength Properties of Thermally-Modified Fraxinus Excelsior Wood in Compression. Materials 2020, 13, 1647. [Google Scholar] [CrossRef] [Green Version]
  14. Zhong, W.Z.; Song, S.C.; Huang, X.C.; Hao, Z.M.; Xie, Z.R.; Chen, G. Research on Static and Dynamic Mechanical Properties of Spruce Wood by Three Loading Directions. Chin. J. Theor. Appl. Mech. 2011, 43, 1141–1150. [Google Scholar]
  15. Yang, N.; Zhang, L. Investigation of Elastic Constants and Ultimate Strengths of Korean Pine from Compression and Tension Tests. J. Wood Sci. 2018, 64, 85–96. [Google Scholar] [CrossRef] [Green Version]
  16. Wu, Y.M.; Huang, Y.F.; Gao, Z.Q.; Wang, Y.W.; Li, R. Research Development of Influencing Factors of Stress—Strain Relationship under Wood Transverse Compression. China For. Prod. Ind. 2018, 45, 11–16. [Google Scholar]
  17. Hu, W.G.; Chen, B.R.; Zhang, T.X. Experimental and Numerical Studies on Mechanical Behaviors of Beech Wood under Compressive and Tensile States. Wood Res. 2021, 66, 27–37. [Google Scholar] [CrossRef]
  18. ASTM E104-02. Standard Practice for Maintaining Constant Relative Humidity by Means of Aqueous Solutions; ASTM International: West Conshohocken, PA, USA, 2012. [Google Scholar]
  19. Cheng, J.Q.; Yang, J.J.; Liu, P. Chapter 7—The Important Wood Material of China. In Wood Science, 1st ed.; China Forestry Publishing House: Beijing, China, 1985; pp. 994–996. (In Chinese) [Google Scholar]
  20. CNS GB/T1939-2009. Method of Testing in Compressive Perpendicular to Grain of Wood; National standard of the People’s Republic of China: Beijing, China, 2009. (In Chinese) [Google Scholar]
  21. Wang, L.Y.; Lu, Z.Y.; Shen, S.J. Study on Twelve Elastic Constant Values of Betula Platyphylla Suk. Wood. J. Beijing For. Univ. 2003, 6, 64–67. (In Chinese) [Google Scholar]
  22. Hu, W.G.; Guan, H.Y. Study on Elastic Constants of Beech in Different Stress States. J. For. Eng. 2017, 2, 31–36. [Google Scholar]
  23. Liu, F.L.; Zhang, H.J.; Jiang, F.; Wang, X.P.; Guan, C. Variations in Orthotropic Elastic Constants of Green Chinese Larch from Pith to Sapwood. Forests 2019, 10, 456. [Google Scholar] [CrossRef] [Green Version]
  24. Taguchi, A.; Murata, K.; Nakamura, M.; Nakano, T. Scale Effect in the Anisotropic Deformation Change of Tracheid Cells During Water Adsorption. Holzforschung 2011, 65, 253–256. [Google Scholar] [CrossRef] [Green Version]
  25. Yang, L.; Liu, H.H. Study of the Collapse and Recovery of Eucalyptus Urophydis during Conventional Kiln Drying. Eur. J. Wood Wood Prod. 2021, 79, 129–137. [Google Scholar] [CrossRef]
  26. Liu, Y.X.; Zhao, G.J. Science of Wood Resources and Materials, 1st ed.; China Forestry Publishing House: Beijing, China, 2004; pp. 140–142. [Google Scholar]
  27. Yamamoto, H.; Sassus, F.; Ninomiya, M.; Gril, J. A Model of Anisotropic Swelling and Shrinking Process of Wood. Wood Sci. Technol. 2001, 35, 167–181. [Google Scholar] [CrossRef]
  28. Ozyhar, T.; Hering, S.; Niemz, P. Moisture-dependent Orthotropic Tension-compression Asymmetry of Wood. Holzforschung 2013, 67, 395–404. [Google Scholar] [CrossRef] [Green Version]
  29. Jiang, J.L.; Bachtiar, E.V.; Lu, J.X.; Niemz, P. Comparison of Moisture-dependent Orthotropic Young’s Moduli of Chinese Fir Wood Determined by Ultrasonic Wave Method and Static Compression or Tension Tests. Eur. J. Wood Wood Prod. 2018, 76, 953–964. [Google Scholar] [CrossRef]
  30. Korkmaz, O.; Buyuksari, U. Effects of Moisture Content on Mechanical Properties of Micro-size Oak Wood. Bioresources 2019, 14, 7655–7663. [Google Scholar] [CrossRef]
  31. Maaß, M.C.; Saleh, S.; Militz, H.; Volkert, C.A. The Structural Origins of Wood Cell Wall Toughness. Adv. Mater. 2020, 32. [Google Scholar] [CrossRef] [PubMed] [Green Version]
  32. Uhmeier, A.; Salmen, L. Influence of Strain Rate and Temperature on the Radial Compression Behavior of Wet Spruce. J. Eng. Technol. 1996, 118, 289–294. [Google Scholar] [CrossRef]
  33. Nairn, J.A. Numerical Simulations of Transverse Compression and Densification in Wood. Wood Fiber Sci. 2006, 38, 122–139. [Google Scholar]
  34. Güntekin, E.; Aydın, T.Y. Determination of Elastic Constants for Anatolian Black Pine Wood Using Ultrasound. In Proceedings of the World Conference on Timber Engineering, Vienna, Austria, 22–25 August 2016; pp. 976–981. [Google Scholar]
  35. Güntekin, E.; Aydın, T.Y.; Niemz, P. Some Orthotropic Mechanical Properties of Sessile Oak (Quercus petrea) as Influenced by Moisture Content. Eurasian J. For. Sci. 2016, 4, 40–47. [Google Scholar] [CrossRef] [Green Version]
  36. Mizutani, M.; Ando, K. Influence of a Wide Range of Moisture Contents on the Poisson’s Ratio of Wood. J. Wood Sci. 2015, 61, 81–85. [Google Scholar] [CrossRef]
  37. Bachtiar, E.V.; Sanabria, S.J.; Mittig, J.P.; Niemz, P. Moisture-dependent Elastic Characteristics of Walnut and Cherry Wood by Means of Mechanical and Ultrasonic Test Incorporating Three Different Ultrasound Data Evaluation Techniques. Wood Sci. Technol. 2017, 51, 47–67. [Google Scholar] [CrossRef]
  38. Kruger, R.; Buchelt, B.; Wagenfuhr, A. New Method for Determination of Shear Properties of Wood. Wood Sci. Technol. 2018, 52, 1555–1568. [Google Scholar] [CrossRef]
  39. Bahmanzad, A.; Clouston, P.L.; Arwade, S.R.; Schreyer, A.C. Shear Properties of Eastern Hemlock with Respect to Fiber Orientation for Use in Cross Laminated Timber. J. Mater. Civ. Eng. 2020, 2, 1–11. [Google Scholar] [CrossRef]
  40. Dinwoodie, J.M. Timber: Its Nature and Behavior, 2nd ed.; E & FN Spon: London, UK, 2000; pp. 187–229. [Google Scholar]
  41. Güntekin, E.; Demiratli, S. Influence of Moisture Content on Some Elastic Constants of Black Pine Subjected to Compression. ProLigno 2017, 13, 21–26. [Google Scholar]
Figure 1. Configurations of testing specimens: (a) σl and El; (b) σr and Er; (c) σt and Et; (d) Glr; (e) Glt; (f) Grt. (unit: mm).
Forests 12 00610 g001
Figure 2. Setup for measuring the compressive yield strength.
Forests 12 00610 g002
Figure 3. Set up for testing method of elastic constants: (a) strain gauge stick positions; (b) connection method of quarter bridge two-wire method.
Forests 12 00610 g003
Figure 4. Relationship between moisture content and compressive yield strength.
Forests 12 00610 g004
Figure 5. Relationship between moisture content and compressive modulus of elasticity.
Forests 12 00610 g005
Figure 6. Relationship between moisture content and shear modulus.
Forests 12 00610 g006
Figure 7. Force−displacement curves of beech wood subjected to compressive loading, using FEM and experiment method: (a) longitude direction, (b) radial direction and (c) tangential direction.
Forests 12 00610 g007
Table 1. Saturated salt solution corresponding to targeted and measured moisture content.
TypesHumidityTargeted
Moisture Content
Measured
Moisture Content
Potassium acetate (CH3COOK)23%5%4.63 ± 0.27
Potassium carbonate (K2CO3)43%8.5%8.74 ± 0.34
Sodium chloride (NaCl)75%15.5%15.8 ± 0.49
potassium chloride (KCl2)89%20%18.74 ± 0.75
Potassium sulfate (K2SO4)98%30%28.85 ± 1.03
Water-60%57.18 ± 1.65
Table 2. The upper and lower limit forces used for calculation of different type specimen.
Specimen TypeMoisture Content (%)
58.5011.2515.50203060
(N)
a 13000–60003000–60003000–60002000–50001000–40001000–40001000–4000
b800–1500800–1500800–1500600–1000600–1000600–1000600–1000
c800–1500800–1500800–1500600–1000300–700300–700300–700
d–f800–1500800–1500800–1500600–1000600–1000600–1000600–1000
1 Represent the types of specimen seen in Figure 1.
Table 3. Summary of analysis of variance (ANOVA) results for compressive yield strength of beech wood through the general linear model (GLM) procedure performed on two factors.
Monitored FactorsF Valuep-Value
Moisture content185.39<0.05
Grain direction890.34<0.05
Moisture content × Grain direction62.80<0.05
Table 4. Summary of mean values of compressive yield strength and the Duncan multiple tests for different moisture contents or grain directions.
Grain DirectionMoisture Content
5.008.5011.2515.5020.0030.0060.00
(MPa)
σl69.74 (9.64) 1
a 2
50.07 (14.71)
b
43.08 (12.31)
c
24.10 (9.15)
d
18.69 (10.74)
e
14.77 (10.63)
f
12.74 (12.96)
f
σr17.27 (9.55)
g
16.67 (13.31)
h
14.90 (10.11)
i
9.23 (14.59)
j
7.54 (22.65)
k
5.43 (20.41)
l
4.99 (16.75)
l
σt11.65(16.09)
m
9.63 (20.67)
n
8.74 (14.98)
o
6.15 (14.60)
p
4.12 (15.46)
q
3.56 (9.30)
r
3.11 (20.26)
r
1 The values in the parentheses are COV. 2 Two means in each row or column not followed by a common letter are significantly different one form others at the 5% significance level. The a-l are Duncan multiple-comparison tests results.
Table 5. Summary of analysis of variance (ANOVA) results for compressive MOE of beech wood through the general linear model (GLM) procedure performed on two factors.
Monitored FactorsF Valuep-Value
Moisture content 630.556<0.05
Grain direction6900.048<0.05
Moisture content × Grain direction 383.336<0.05
Table 6. Summary of mean values of compressive MOE and the Duncan multiple tests for different moisture contents or grain directions.
Grain DirectionMoisture Content
5.008.5011.2515.5020.0030.0060.00
(MPa)
El22,839.69
(6.52) 1
a 2
16,005.90
(7.71)
b
13,580.50
(0.75)
c
9229.60
(7.49)
d
8151.67
(5.15)
e
4902.51
(5.90)
f
4395.76
(16.83)
f
Er3100.59
(12.85)
g
2178.29
(8.44)
h
1747.33
(12.89)
i
1498.65
(19.07)
j
1073.96
(11.53)
k
992.94
(15.51)
l
818.87
(3.12)
l
Et1145.63
(7.85)
m
979.46
(8.37)
n
743.96
(18.26)
o
676.92
(8.41)
p
540.78
(6.93)
q
395.37
(6.58)
r
340.38
(4.85)
r
1 The values in the parentheses are COV. 2 Two means in each row or column not followed by a common letter are significantly different one form others at the 5% significance level. The a-r are Duncan multiple-comparison tests results.
Table 7. Summary of mean values of Poisson’s ratio of different moisture contents and the Duncan multiple comparison tests.
Grain DirectionMoisture Content
5.008.5011.2515.5020.0030.0060.00
(MPa)
Ulr0.8791
(6.38) 1
a 2
0.7382
(0.36)
b
0.5365
(23.75)
cf
0.4393
(17.38)
de
0.3799
(11.64)
e
0.5557
(5.14)
f
0.6595
(15.38)
g
Ult1.2122
(2.56)
a
1.0685
(3.15)
b
0.6158
(4.64)
cf
0.5269
(3.38)
de
0.5047
(13.60)
e
0.6070
(4.43)
f
0.9761
(5.73)
g
Urt0.9048
(7.64)
ac
0.7657
(12.33)
bef
0.8727
(7.74)
cd
0.7995
(6.71)
de
0.7803
(16.62)
ef
0.7039
(14.26)
fg
0.6628
(21.93)
g
Url0.0988
(23.35)
aef
0.0934
(6.47)
aef
0.0618
(30.58)
bcd
0.0508
(20.53)
cd
0.0629
(0.33)
d
0.0911
(34.97)
ef
0.0933
(28.02)
f
Utr0.4171
(6.98)
ad
0.3411
(20.78)
bg
0.470
(9.63)
ce
0.3901
(2.91)
df
0.4672
(16.99)
e
0.3663
(1.92)
bfg
0.3415
(7.85)
g
Utl0.046
(20.00)
a
0.057
(15.10)
bdg
0.029
(28.76)
cef
0.049
(20.55)
ad
0.034
(4.66)
ef
0.036
(11.12)
f
0.059
(2.19)
g
1 The values in the parentheses are COV. 2 Two means in each row not followed by a common letter are significantly different one form others at the 5% significance level. The a-g are Duncan multiple-comparison tests results.
Table 8. Summary of validity of the modulus of elasticity and Poisson’s ratio obtained by experiment.
Moisture Content(Ulr/El)/(Url/Er)(Ult/El)/(Utl/Et)(Urt/Er)/(Utr/Et)
5.000.812 0.762 1.248
8.500.930 0.875 1.027
11.250.843 0.861 1.265
15.500.712 1.277 1.075
20.001.213 1.024 1.178
30.000.809 0.730 1.307
60.000.760 0.774 1.263
Table 9. Summary of analysis of variance (ANOVA) results for shear modulus of beech wood through the general linear model (GLM) procedure performed on two factors.
Monitored Factorsp-ValueF Value
Moisture content <0.05864.593
Grain Direction<0.051106.267
Moisture content × Grain direction<0.0570.624
Table 10. Summary of mean values of shear modulus under different moisture contents and grain directions and the Duncan multiple comparison tests.
Grain DirectionMoisture Content
5.008.5011.2515.5020.0030.0060.00
(MPa)
Glr1687.17
(10.13) 1
a 2
1033.92
(8.17)
b
843.76
(10.19)
c
674.96
(2.76)
d
567.04
(4.06)
e
405.68
(16.06)
f
339.69
(6.54)
f
Glt1570.63
(5.12)
g
830.93
(3.81)
h
787.30
(14.44)
i
455.74
(4.66)
j
311.17
(4.25)
k
220.52
(2.41)
l
207.62
(6.95)
l
Grt594.23
(15.17)
m
269.11
(1.48)
n
199.90
(20.10)
o
160.41
(11.22)
p
122.28
(1.68)
q
116.34
(18.65)
r
117.85
(8.57)
r
1 The values in the parentheses are COV. 2 Two means in each row or column not followed by a common letter are significantly different one form others at the 5% significance level. The a-l are Duncan multiple-comparison tests results.
Table 11. Moisture sensitivity of different elastic constants and results obtained by previous works.
Reference LiteratureWood SpeciesMoisture Sensitivity of Elastic Constants
(%)
σlσrσtElErEtGlrGltGrt
This studyBeech wood6.3355.3295.4815.0295.4965.1274.8125.7406.381
Hering et al. [12]European beech wood---2.1902.9773.8691.3392.2502.940
Aydin and Ozveren. [8]Fir wood5.3452.4785.3611.8796.7252.8614.9454.6715.000
Güntekin et al. [35]Sessile oak wood4.2343.7862.9752.9034.0274.001---
Güntekin and DEMIRATLI. [41]Black pine wood4.4643.3953.3523.4575.0693.481---
Ozyhar et al. [28]European beech wood7.9495.5945.2893.5915.4205.000---
Jiang et al. [29]Chinese fir wood---4.2426.0108.371---
Bachtiar et al. [37]Walnut wood---7.5034.1853.0397.7485.29510.858
Bachtiar et al. [37]Cherry wood---3.1104.6685.6263.1874.7952.054
Korkmaz and Büyüksar. [30]Oak wood4.341--------
Table 12. Relative errors between compressive yield strength obtained by FEM and experiment method.
Yield StrengthMoisture Content
58.511.2515.5203060
(%)
σl1.261.212.552.172.523.311.58
σr16.101.920.861.891.935.108.64
σt0.490.9813.773.174.143.282.87
Publisher’s Note: MDPI stays neutral with regard to jurisdictional claims in published maps and institutional affiliations.

