Article

Forest Quality Dynamic Change and Its Driving Factors Accompanied by Forest Transition in China

1
College of Forestry, Northwest A&F University, No.3 Taicheng Road, Yangling 712100, China
2
Qinling National Forest Ecosystem Research Station, Huoditang, Ningshan, Ankang 711600, Shaanxi, China
3
College of Economics and Management, Northwest A&F University, No.3 Taicheng Road, Yangling 712100, China
*
Author to whom correspondence should be addressed.
Forests 2021, 12(6), 733; https://doi.org/10.3390/f12060733
Submission received: 29 March 2021 / Revised: 9 May 2021 / Accepted: 27 May 2021 / Published: 4 June 2021
(This article belongs to the Section Forest Ecology and Management)

Abstract

:
As ecological and environmental issues have received continuous attention, forest transition has gradually become the frontier and a hot issue, which have implications for biodiversity and ecosystem functioning. In this study, the spatial-temporal dynamics and the spatial determinants of forest quality were investigated using spatial econometric regression models at the province level, which contained 31 provinces, autonomous regions, and municipalities in China. The results showed that forest area, forest volume, forest coverage, and forest quality have greatly increased as of 2018, but uneven forest distribution is an important feature of forest adaptation to the environment. The global Moran’s I value was greater than 0.3, and forest quality of the province level had a positive spatial correlation and exhibited obvious spatial clustering characteristics. In particular, the spatial expansion of forest quality had shown an accelerated concentration. The most suitable model for empirical analysis and interpretation was the Spatial Durbin Model (SDM) with fixed effects. The average annual precipitation and the area ratio of the collective forest were positively correlated with forested quality (significance level 1%). Ultimately, this framework could guide future research, describe actual and potential changes in forest quality associated with forest transitions, and promote management plans that incorporate forest area changes.

1. Introduction

Forest quality refers to the functions and values that reflect all the ecological, social, and economic benefits of the forest, which not only includes the inherent attributes of the forest itself, but also the service efficiency provided by the forest [1]. The optimal function of the forest ecosystem depends not only on the forest quantity, but also on the forest quality [2,3]. Sustainable forest management is the fundamental way to improve forest quality, which could preserve the ecological integrity and ecosystem functions and maintain the provision of goods and services over time [4,5,6]. As high-quality ecological products have been becoming an increasing concern to meet the people’s growing ecological environment, the improvement of forest quality is facing a new challenge. Driving mechanisms of forest quality have become a frontier in international environmental and economic sustainable development [7], which are not only affected by natural environmental factors, but are also significantly affected by the macro environment of social development [8]. Specifically, they contain the role of economic growth mechanisms in the allocation of forest resources, the changes in forest management practices in response to climate change, demographic factors, and national policy [9].
Change in forested area could affect the sustainability of environment and socioeconomics development [10]. Forest transition refers to the phenomenon of a reversal or change in the long-term land-use trends of a country or region from a period of a net loss to a period of a net gain in forested area, which shows a “U-shaped curve” [11], and the process is individually divided into periods of forest reduction, the transition point, and forest growth [12,13]. In fact, forest degradation could happen all along the forest transition curve, even if in the phase of transition point [2], and different types and ages of forests are known to support different types of forest structure, genetics and biodiversity, and ecosystem service functions. So, forest transition theory ignores ecologically important characteristics [14], which fails to systematically consider the ecological implications [15,16], and forest quality is not well interpretated in forest transition theory. Gillet et al. studied the Central African forest and reported that ecosystem services (such as non-timber forest products), wildlife consumption, and the contribution of these products to household incomes and dietary intake decrease along the forest transition curve [17]. Despite political resolve and global efforts, forest transition theory does not sufficiently account for biophysical differences in forest dynamic change, and therefore, forest loss, fragmentation, and land degradation continue unabated [18].
As one of the main countries in Asia working to increase forest area, China has experienced forest transition from the 1980s to the 1990s [19]. Due to rapid population growth and fast economic development, deforestation has become severe and has increased a series of environmental problems, such as the intensity of water runoff and soil erosion, especially in the upper and middle reaches of the Yangtze and Yellow River basins [20]. Large-scale ecological engineering projects (EEPs) launched by Chinese Government have played an important role in vegetation restoration [21,22], forest area has transitioned from long-term reduction to the beginning of forest recovery in recent 20 years, and some studies found that forest ecosystem service function enhanced substantially as forest cover increased and that the regional climate also had a positive feedback [23,24]. The forest area in Asia experienced a net increase in the 1990s, mainly due to the large-scale afforestation in China. China accounted for 25% of the net increase in total leaf area in Asia [25], and forest transition in China is of great significance to global carbon storage, biodiversity protection, and improvement of the regional environment [26].
Compared with the substantial increase in forest quantity, the deterioration of the ecological environment has not been fundamentally reversed [27]. Forest quality in China is lower than the world average, and it is still slightly lower than the Asian average [28]. Scientific research results and production practices have shown that the forest volume per unit area can be increased by 20%–40% [27], and the potential to improve the forest quality through scientific and reasonable tending and management is high [29]. Therefore, under the rigid constraints of forest area, follow-up forestry development should primarily emphasize the importance of improving forest quality from a strategic perspective to transition from extensive forest growth to intensive forest growth [30,31]. However, the research on the spatial and temporal differences and driving factors of forest quality with multiple indicators and multiple regions is almost blank.
There are temporal and spatial differences in the forest quality [32,33], and the process of the change in forest quality is not well interpreted in the forest transition theory. In this study, in order to describe actual and potential changes in forest quality associated with forest transitions, the spatial-temporal dynamics and the spatial determinants of forest quality were used at the province level, and the results would enrich the research cases of forest transition and provide a theoretical basis for a more comprehensive and effective promotion of forest resource to high-quality transition in China.

2. Materials and Methods

2.1. Study Area

Forest resources in China exhibit significant interprovincial spatial heterogeneity. In this study, we compiled province-level panel data in China from 1973 to 2018, and the sample unit includes 31 provinces, autonomous regions, and municipalities in China except Hong Kong, Macao, and Taiwan. Due to data limitations, Hainan Province and Tibetan autonomous regions were calculated using the linear difference method [34]. Chongqing was a prefecture-level city in Sichuan Province before 1997, so we calculated the data for the Chongqing municipality before 1997 using the linear difference method.

2.2. Data Source and Descriptions

As a renewable resource, forest quality is interpreted as all the functions of forests in terms of ecological, social, and economic benefits. In this paper, forest quality index was used as the dependent variable, which was assessed by four criteria of forest quantity, forest productivity, forest structure, and forest health. The data used to measure forest quality were obtained from the National Forestry Inventories (NFIs) maintained by China’s State Forestry Administration, which were obtained using the resource survey method based on sampling theory and using fixed sample plots that were rechecked every five years [32]. The first NFI was conducted between 1973 and 1976, and the continuous forest inventory framework was established during the 2nd NFI (1977–1981), and nine NFIs have been conducted so far. It is worth noting that the forest density standard (crown density) changed from >0.3 to ≥0.2 since 1994 in the 5th forest inventory (1994–1998), and to maintain data comparability and consistency, the methods of adjustment, referring to the research of Fang et al., were used to adjust the data from the 2nd to 4th NFIs data [35]. Under this framework, forest resources can be repeatedly inspected at a fixed interval in a continuous and comparable manner according to strict and uniform standards. In this study, we used the 2nd to 9th NFIs data to analyze the forest quality index.
The factors affecting forest quality are complex. Based on extensive reference to existing forest transition theories and related research [9,19,23,31,34,36], combined with the development characteristics of forest resource changes in China, in this paper, the explanatory variables contained economic growth factors, demographic factors, national policy investments factors, and biophysical factors (Table 1). The statistics were obtained from the Social and Economic Statistics Yearbook in China (1977–2018), the Statistical Yearbook in China (1977–2018), the China Forestry Statistical Yearbook (1998–2017), the China Forestry Yearbook (1949–2018), and the China Agriculture and Forestry Database. The method precipitation and temperature data acquisition and processing refers to the research of Gong et al. [37], and the specific characteristics of the data are shown in Table 2.

2.3. Analytical Methods

2.3.1. Construction of Forest Quality Index System

A multi-criteria evaluation process was used to assess the forest quality index. Four criteria of forest quantity, forest productivity, forest structure, and forest health were used, and each criterion was further composed of multiple factors (Table 3), based on the expert opinions of researchers in the fields of forestry, ecology, and forest conservation, and the previous studies [9,36].
In the process of calculating the forest quality index, the key was the weight of each indicator [38]. To avoid human subjective factors in the weighting method, the entropy weighting method was used to establish the forest quality index [39]. The basic idea of the entropy weighting method is to determine the objective weight according to the size of the index’s variability. The specific steps of the process were as follows.
(1)
Normalized index value.
Due to the differences in the measurement units of the indicators, the indicators need to be dimensionless. In this study, the efficacy coefficient method was used to standardize the data. The positive indicators were standardized according to the following equation:
r i j t = x i j t x m i n x m a x x m i n ,
and the negative indicators were standardized according to the following equation:
r i j t = x m a x x i j t x m a x x m i n ,
where r i j t and x i j t are the standardized and original values, respectively, for the jth index in the tth year in the ith province, and x m a x and x m i n are the maximum and minimum values, respectively, for the jth index in the ith province.
(2)
Determination of the indicators’ weights.
The information entropy was used to measure the discrete degree of the index for the comprehensive evaluation of multiple indicators as follows [39]:
e j = 1 l n m i = 1 m P i j l n P i j ,
d j = 1 e j ,
w j = d j j = 1 n d j ,
j = 1 n w j = 1 ,
where P i j is the proportion of the jth index in the ith province in the tth year, e j is the entropy of the jth index, d j   is the information utility value, w j is in the weight of index j in year t, m is the number of provincial administrative regions, and n is the number of indicators.
(3)
Establishing the evaluation model.
When assessing forest quality, it was necessary to calculate the comprehensive score Y of each province in different years. Higher Y values indicate better forest quality.
Y = j = 1 n c j w j ,
where cj is the normalized evaluation index value.
Evaluating the forest quality index were constructed using the software of SPSS 19.0.

2.3.2. Spatial Autocorrelation

Global spatial autocorrelation could measure the overall spatial association and spatial difference of forest resources between regions [40,41], and Moran’s I is a common indicator, which can be used to test the correlation of economic variables with geospatial variables [42].
The Getis-Ord Gi* values can be used to detect the spatial distribution of high-value or low-value clustering of spatial unit [34]. Compared to the LISA scatter plot, the Getis-Ord Gi* values based on the normal distribution hypothesis test are more sensitive than the LISA based on the random distribution hypothesis test [43]. We used the Getis-Ord Gi* method to identify the spatial distribution locations of similar clustering areas of the forest quality index, which makes up for the lack of global spatial autocorrelation analysis of the spatial local relationship characteristics.
G i * = j = 1 n w i j x j x ¯ j = 1 n w i j S j = 1 n w i j 2 ( j = 1 n w i j ) 2 n 1
x ¯ = j = 1 n x j n
S = ( j = 1 n x j ) 2 n ( x ¯ ) 2
The Gi* statistic is the Z-score. The higher the Z-score, the closer the clustering of the high values (hot spots), and the lower the Z-score, the closer the clustering of the low values (cold spots). In this paper, the Jenks best natural cutoff method for Getis-Ord G* index was used to cluster and layer the analysis results to form hotspots, sub-hot spots, sub-cold spots, and cold spots.

2.3.3. Spatial Econometric Regression Models

Spatial econometric models could effectively solve the spatial dependence problem that cannot be handled by linear regression analysis [44]. Spatial econometric model contained Spatial Lag Model (SLM), Spatial Error Model (SEM), and Spatial Durbin model (SDM) were used to analyze the driving factors of the forest quality dynamic change [41,45,46], which were constructed using the spatialreg package in R.
The SLM model is a direct representation of the spatial effects based on the autoregression of dependent variables and is primarily used to explore the spatial spillover or diffusion effects between economic individuals. This model is represented by the following equation:
y = ρ W y + X β + ε
The SEM model accounts for the error process using the covariance of the difference. The SEM is represented by the following equation:
y = X β + ( 1 λ W ) 1 u
The SDM model combines the characteristics of the spatial lag model and the spatial error model, which is represented by the following equation:
y = ρ W y + X β + W X ¯ r + ε  
The y is the dependent variable vector of n × 1, and is the spatial weight matrix of n × n order. Generally, a contiguity matrix is used, which is related to the spatial autoregressive process of the explanatory variables and residuals. The X is the independent variable matrix of n × k; X ¯ is an explanatory variable of n × ( Q   − 1), ρ is a coefficient of the spatial lag and reflects the inherent spatial dependence of the data and the influences of y on observation of the surrounding or neighboring spaces, β is a parameter vector, which reflects the influence of the independent variables X on the dependent variable y, and ε is the random error term. λ is a parameter of the spatial error and measures the spatial dependence function of the observed values, namely, the direction and degree of influences of observed value y of neighboring areas on the observed value y of the local areas; and μ is a random error vector of the normal distribution.
The coefficient of determination (R2) and Akaike information criterion (AIC) were selected to compare the residuals of the spatial econometric regression models, and the LM test was used to determine whether the spatial lag effect and the spatial error effect were significant. If the results support either SLM or SEM, or both, then SDM should be established, and the Wald statistic and LR statistic were used to test whether the SDM can be simplified into SLM and SEM. If the Wald statistic and LR statistic were inconsistent with the model chosen by the LM test, the SDM should also be selected. The Hausman test was also used to select the fixed effect models and the random effects models.

3. Results

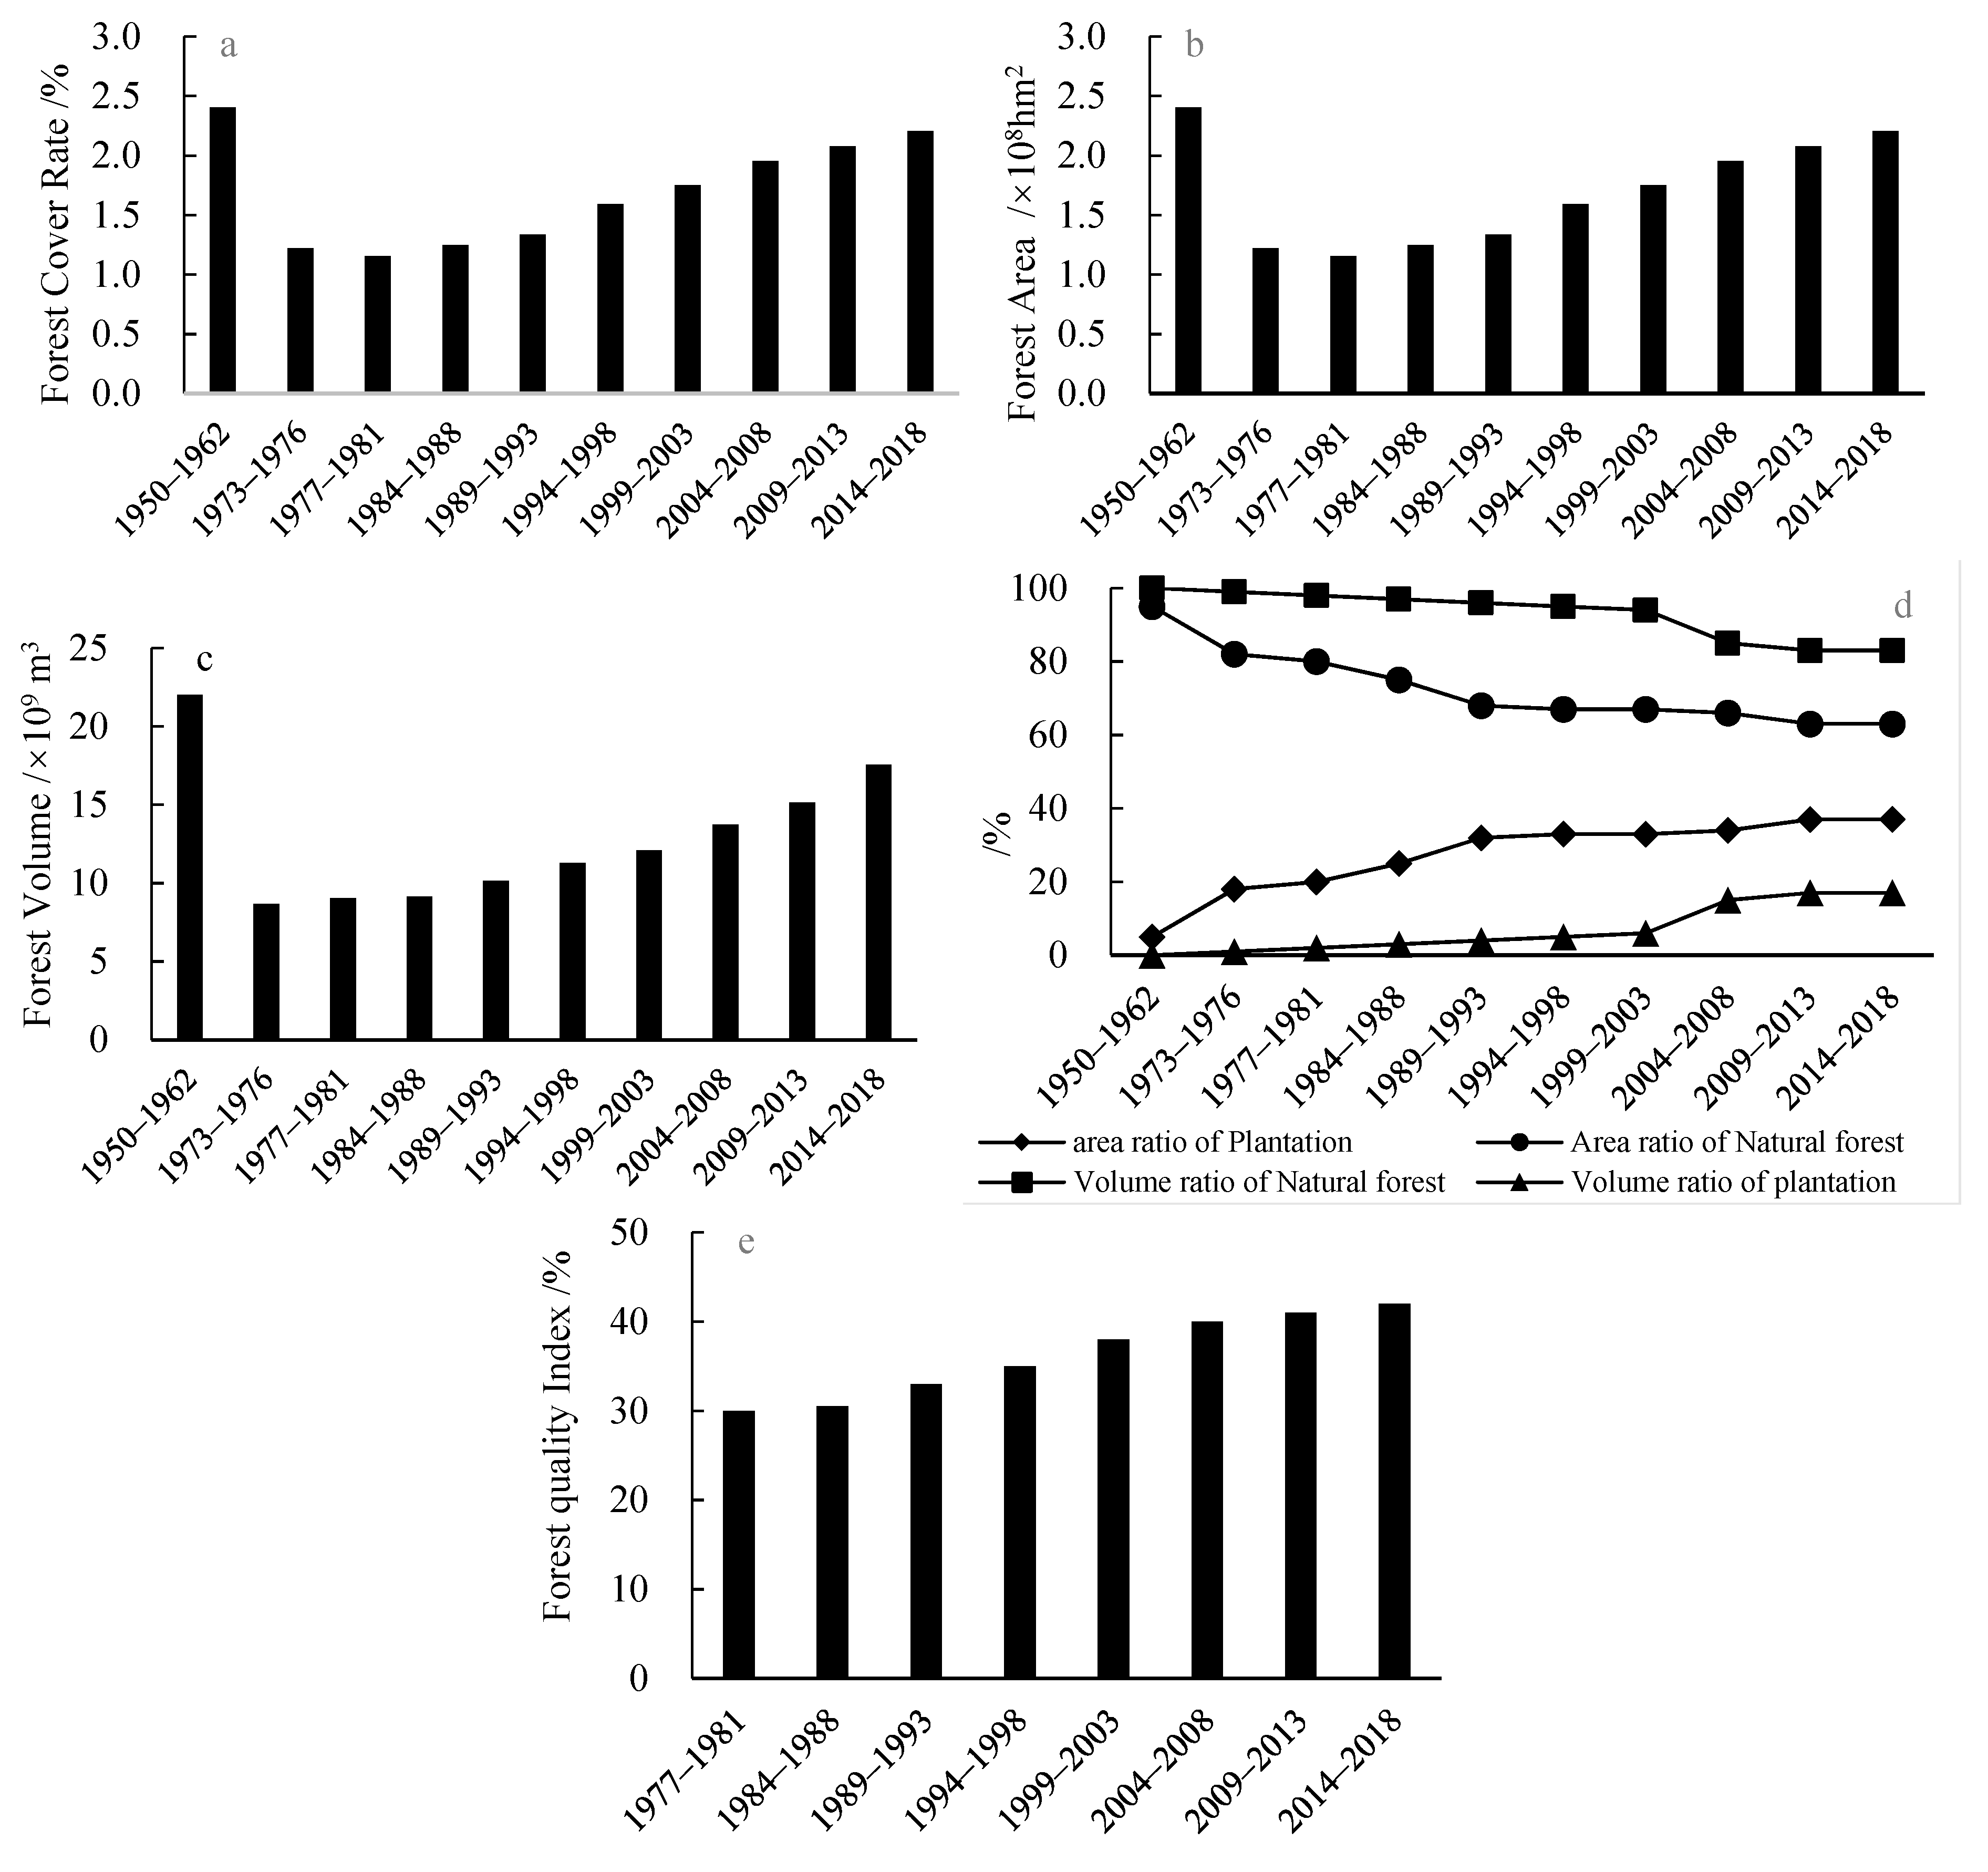
3.1. Dynamic Change of Forest Quantity

Forest area, forest volume, and forest coverage decreased to the lowest point from the end of the 1970s to the early 1980s in China (Figure 1a–c), which was the inflection point of the forest transition. Thereafter, the forest coverage rate increased continuously (Figure 1a), and the forest area and forest volume also exhibited a relatively stable increase, especially after 1993 (Figure 1b,c). Although forest area and volume had greatly improved by 2018, they had not recovered to the level in 1960. From 1950 to 1962, natural forests constituted a large proportion, and plantations accounted for only 4.49%. Then, the area proportion of the plantations continued to increase to 37% within 50 years, while the volume proportion of natural forests continued to decrease for more than 50 years, reaching a low of 83% in 2018 (Figure 1d). However, the volume of natural forests still accounted for the majority of the entire stocking volume.

3.2. Structure of Forest Quality Index

The weights of the resource indicators were greater than those of the disaster indicators (Table 3), indicating that the state of the forest resources is the most important reason for the differences in forest quality among the provincial administrative regions. The indicator with the greatest impact on forest quality was the forest cover rate (0.1724), and the second most important indicator was the volume per unit area (0.1584). The forest quality index during the study period increased, but the increase was smaller than the increases in forest area and forest volume, illustrating the difference between forest quality and forest quantity (Figure 1e).
Based on the spatial distribution, the Jilin and Heilongjian province in northeastern China had the highest forest quality indexes from the in 2nd and 9th National Forestry Inventory, because Xing’an Mountains and Changbai Mountain forest areas were concentrated in this region (Figure 2). The forest quality indexes in Sichuan, Chongqing, and Yunan were also high because where include the western Sichuan forest area and the northwestern Yunnan forest area. The forest quality indexes of Fujian, Jiangxi, and Zhejiang along the eastern coast were also high. The forest quality index in Tianjin, Shanghai, and Shandong was low. Ningxia and Gansu have fragile ecologies and forest resources were scarce, so their forest quality indexes were not high.

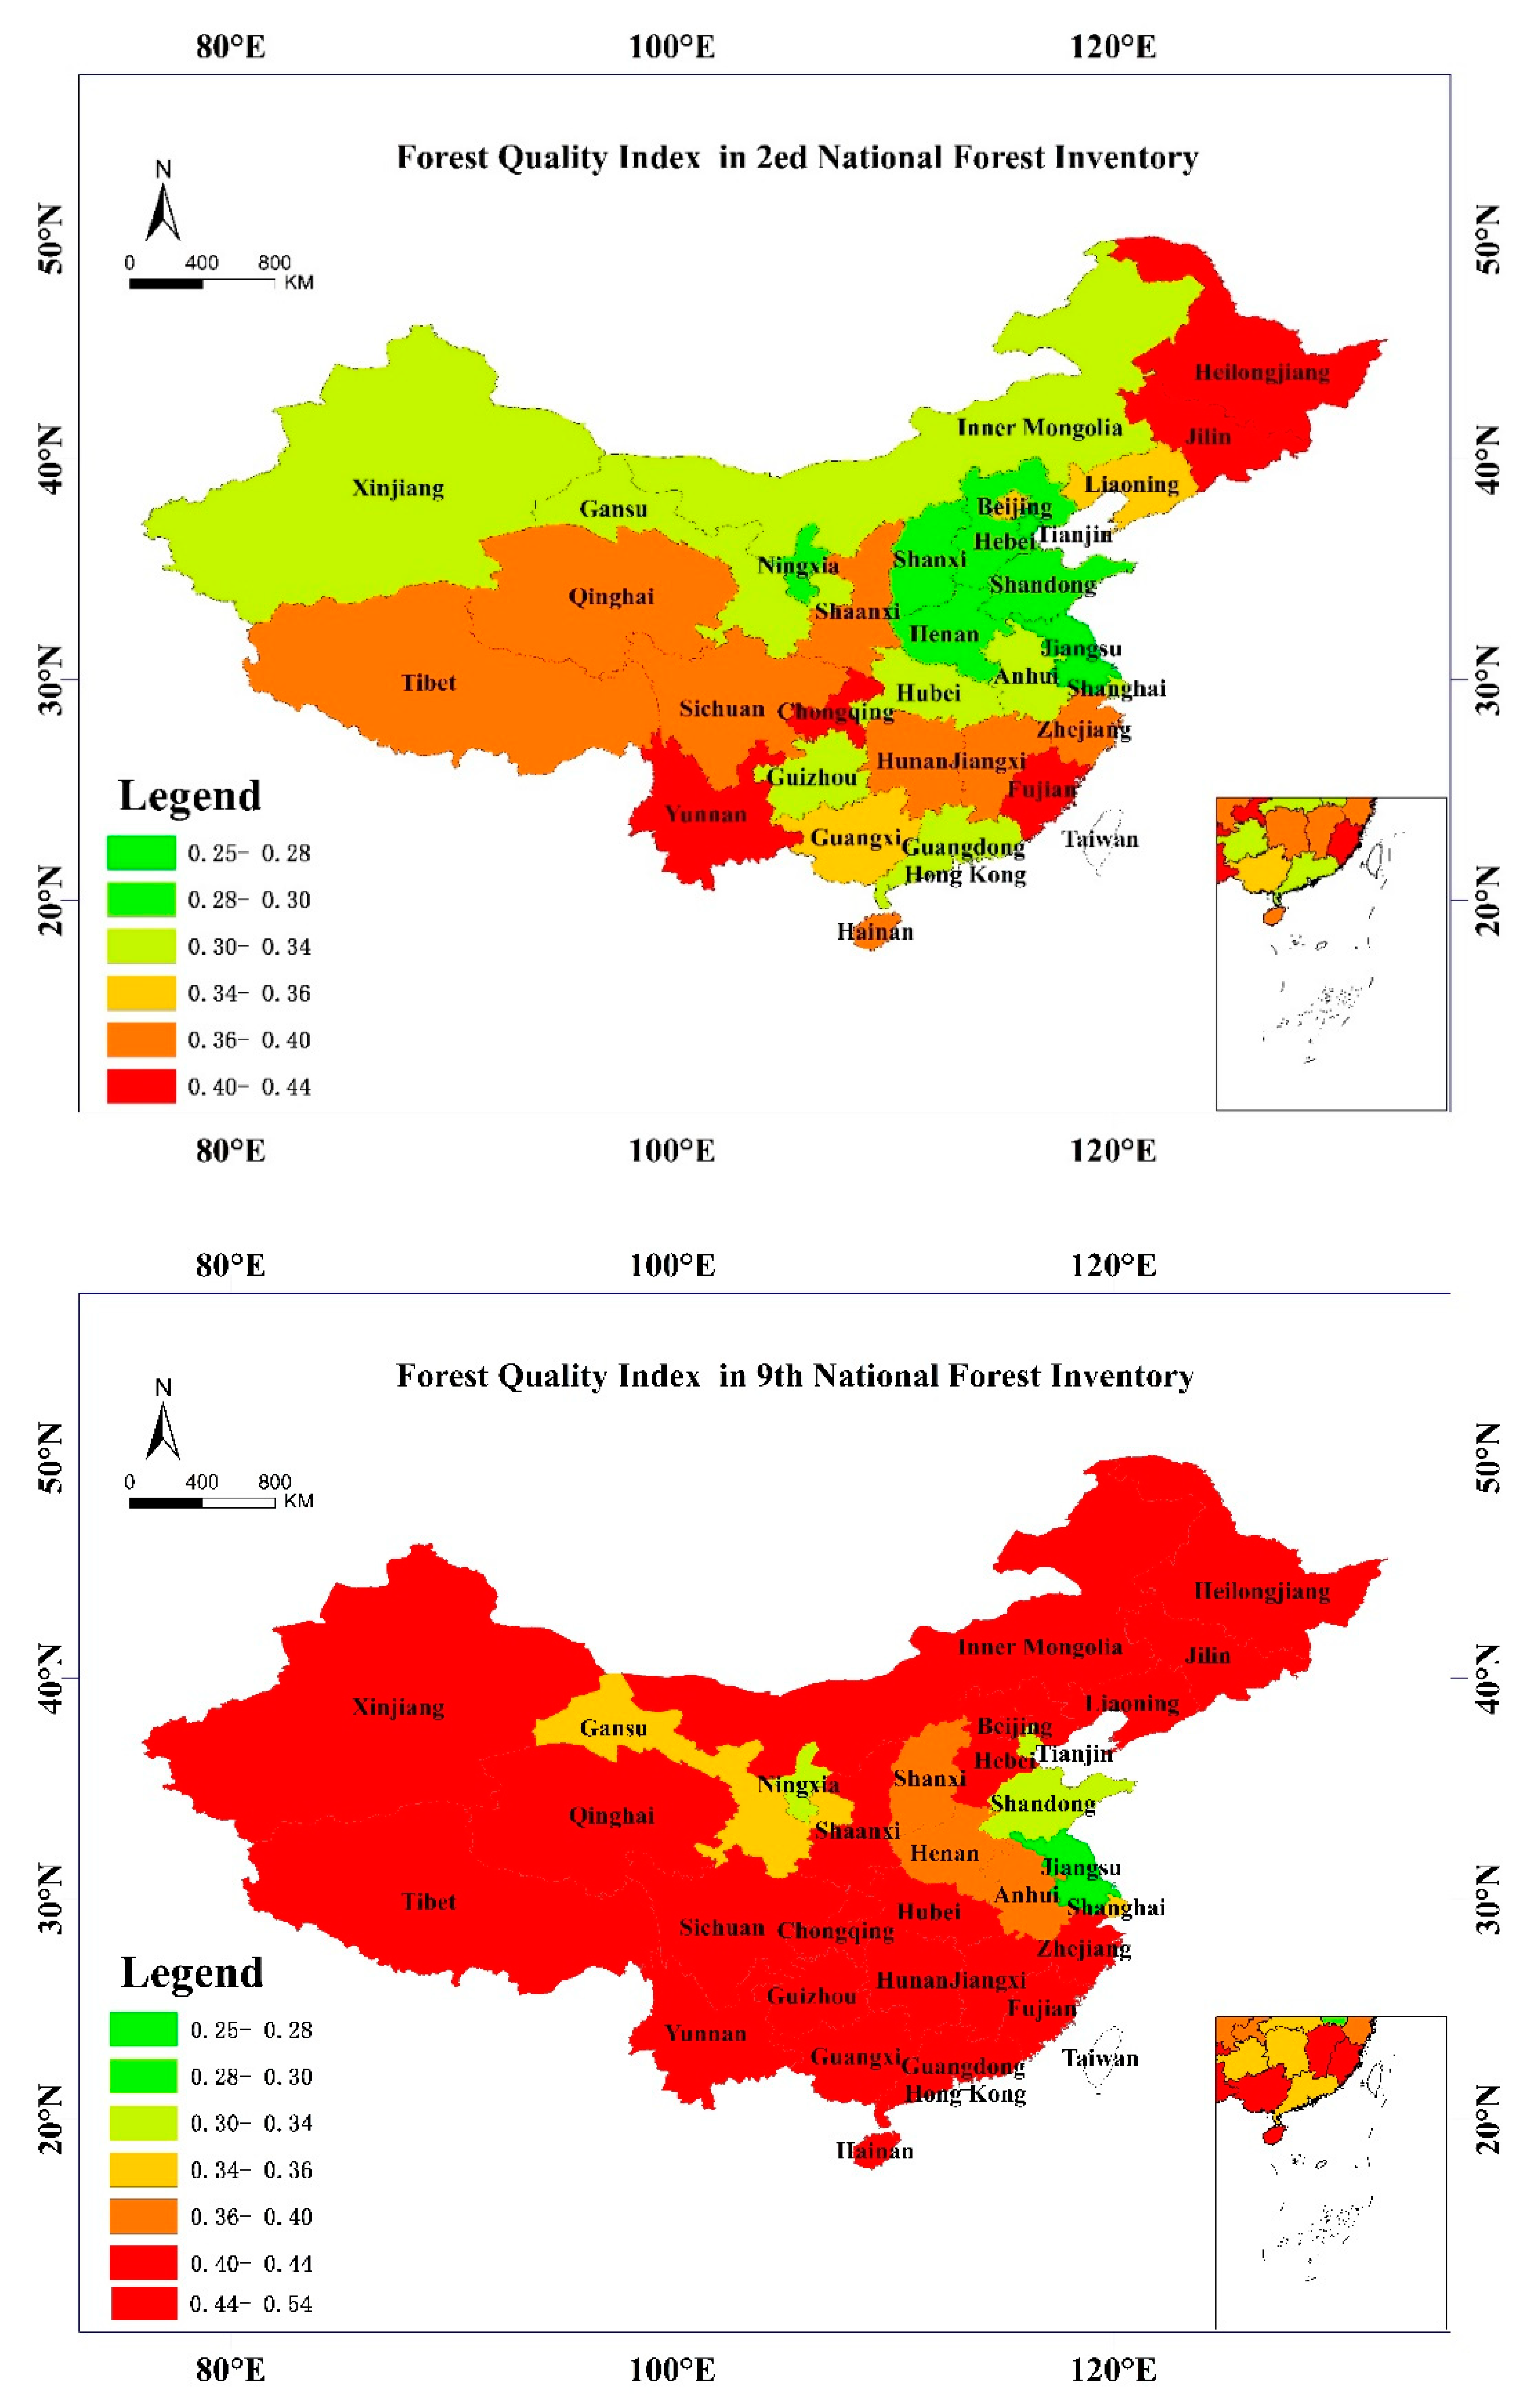
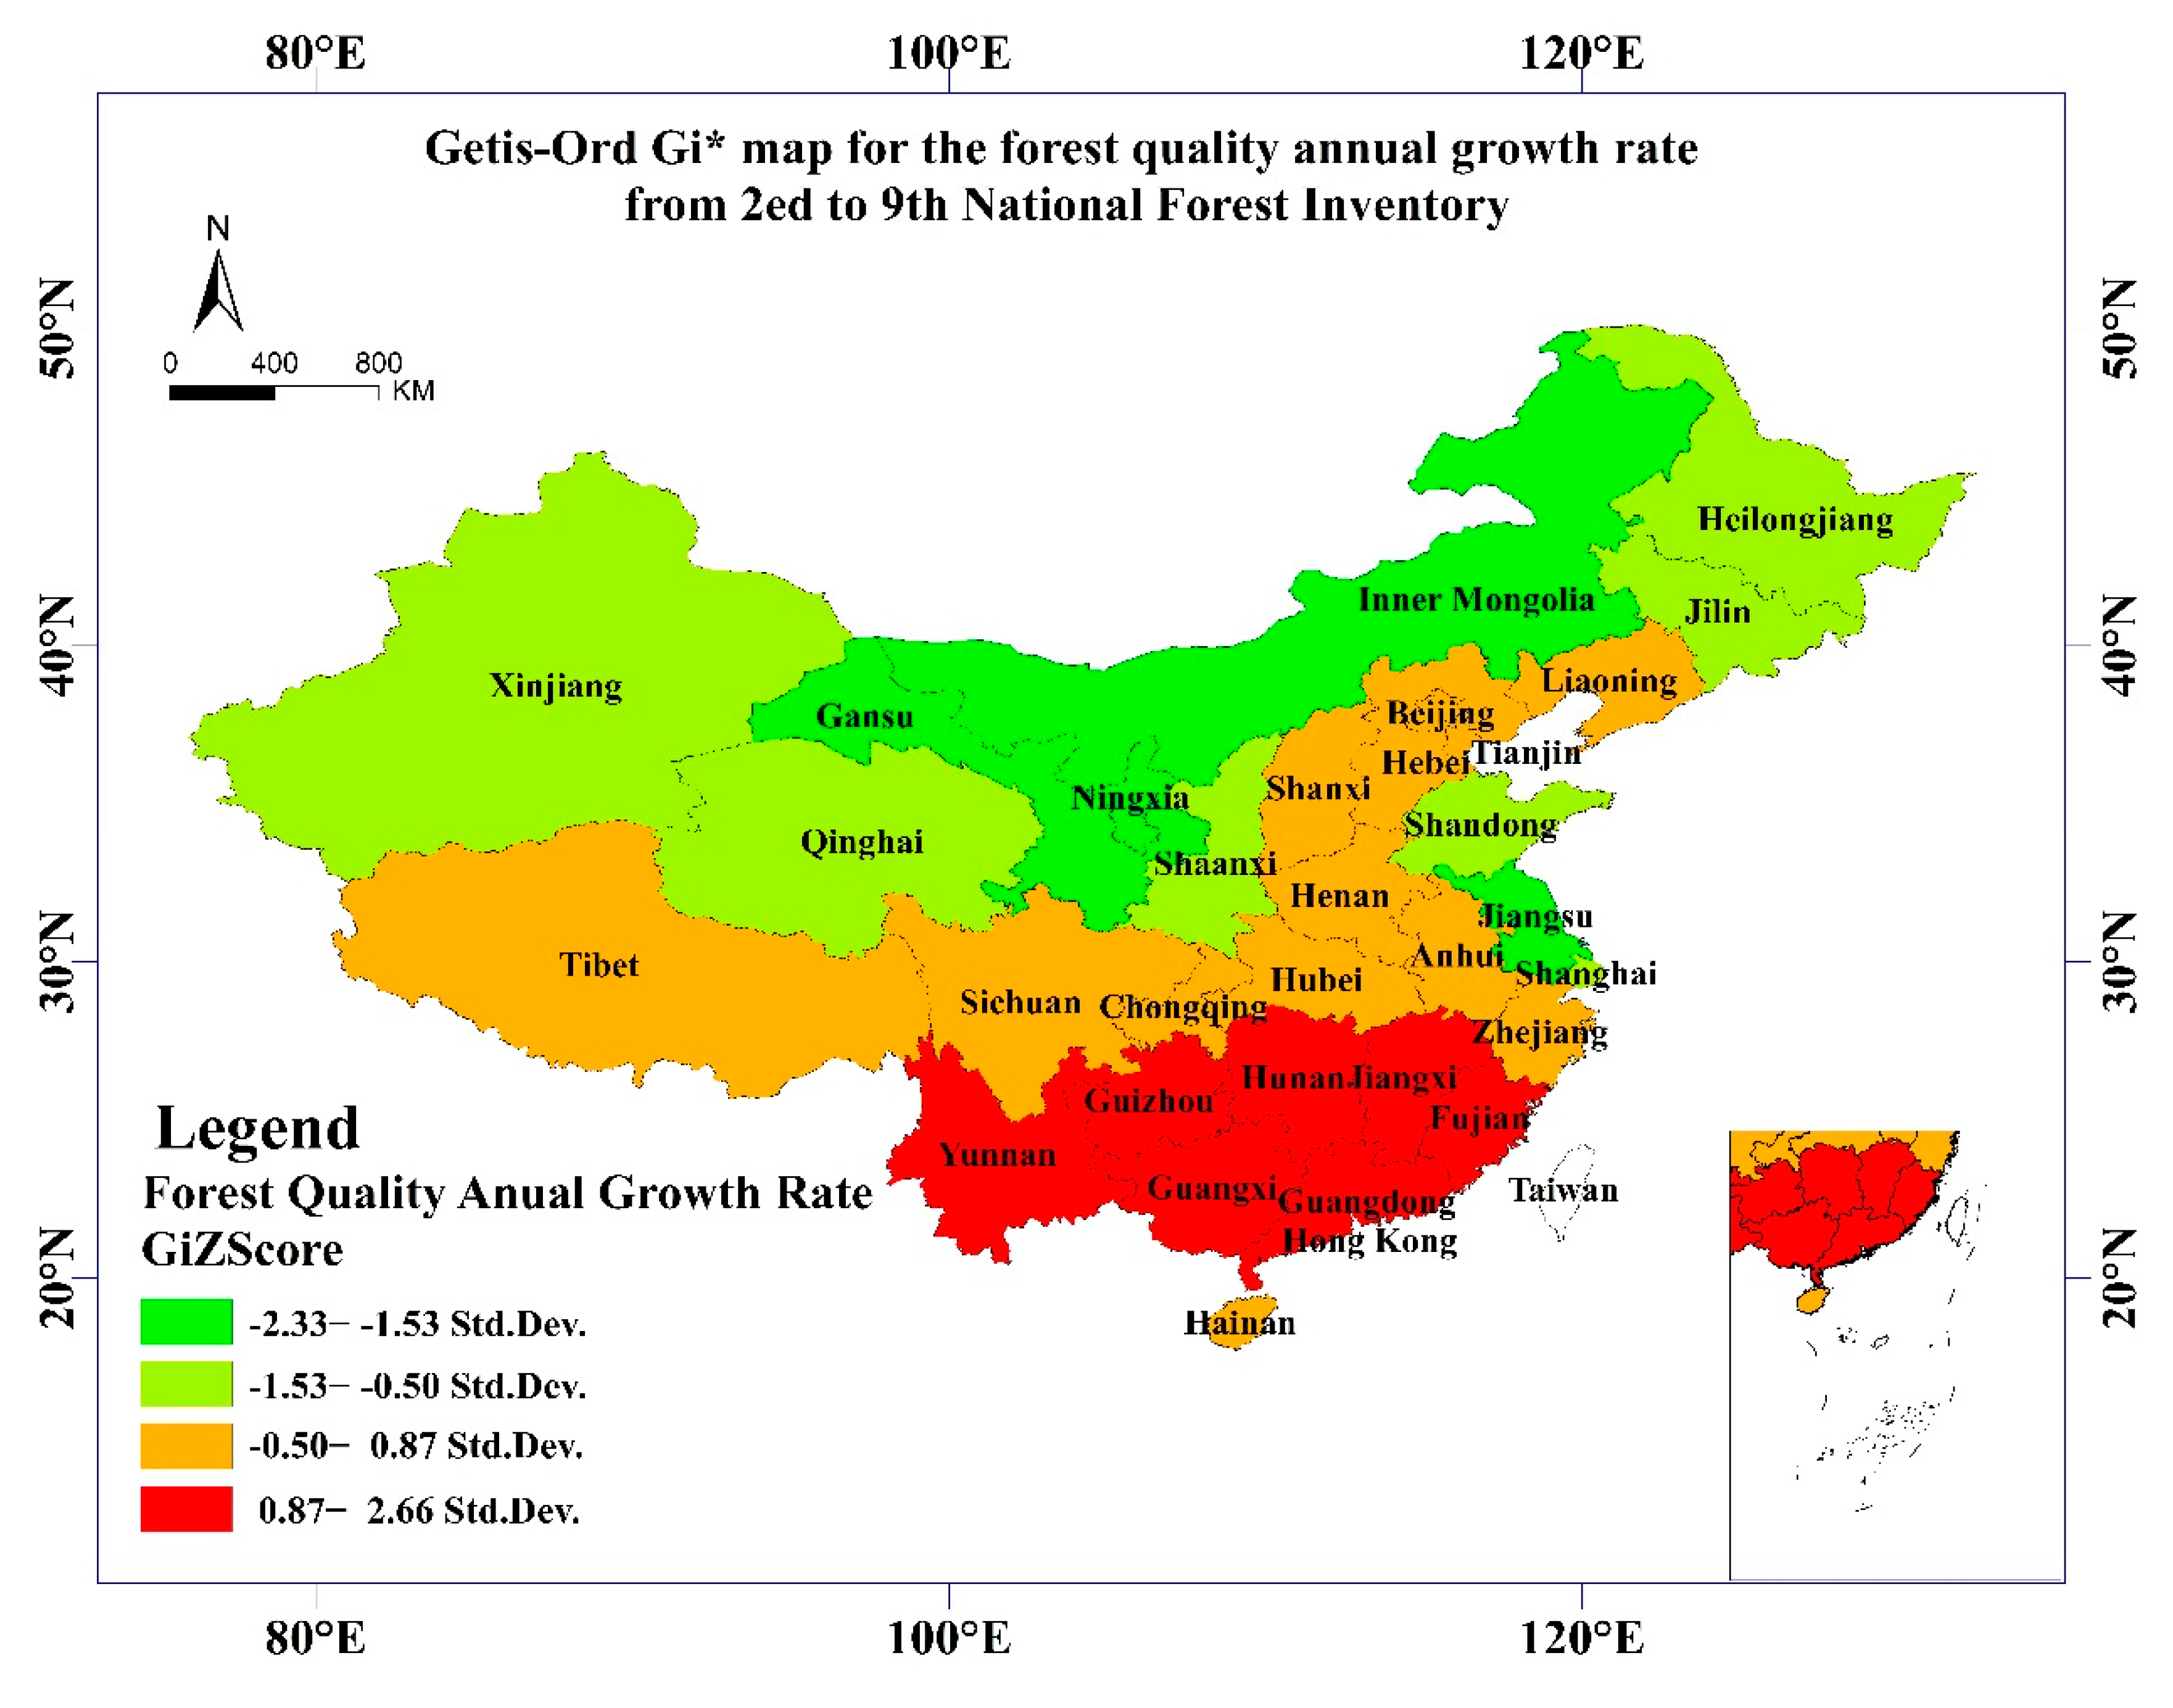
3.3. Spatial Correlation Analysis

The Moran’s I index of the provincial forest quality index were all greater than 0.3, and the Z-scores were greater than 1.96 from 1977 to 2018 (Table 4). All of the results were significant below the significance level of 0.1, forest quality indexes of the various provinces had a certain spatial dependence and geographical clustering characteristics at the 99.9% confidence level. The results indicated that forest quality in the province level had a positive spatial correlation and exhibit significant spatial clustering characteristics. In particular, the Moran’s I index increased from 0.3085 to 0.3845, and the Z-value score increased from 2.8703 to 3.5058 from 1977 to 2018, indicating spatial expansion of the forest quality was in an accelerated concentration state, which also showed that there was an imbalance in the quality of regional forest resource development in China. Therefore, in the process of quantitatively studying the factors affecting forest quality, the spatial correlation effects should be fully considered.
The G* values of the forest quality index were from hotspots, sub-hot spots, sub-cold spots, and cold spots (Figure 3). The hotspots and sub-hotspots of the forest quality growth rate were mainly concentrated in the southern collective forests and the southwestern alpine forests. The cold spots and sub-cold spots of the forest quality growth rate were mainly distributed in the semi-arid and arid regions of the northwest. Tianjin, Shanghai, and Jiangsu provinces were cold spots.

3.4. Spatial Econometric Model

A Hausman test comparing fixed and random effects supported the fixed effects specification at the 0.01 level (Table 5), and the LM-lag and LM-error passed the significance test for two-way fixed effects. The Robust LM-lag statistic was significant at the 5% test level, whereas the Robust LM-error statistic failed the significance test. That is, the SLM with fixed-effects was more significant. Both the Wald test value and the LR test value pass the 1% significance test based on the results of the SDM test (Table 6), thus the SDM was selected as the optimal model. Furthermore, the R2 and Log L values of the SDM were larger than those of the SLM and SEM, and the AIC and SC values were the smallest. Therefore, the SDM with fixed effects was the best model to analyze the factors influencing provincial forest quality.
Average annual precipitation had a significant positive impact on forest quality (significant at the 1% level, Table 6). National forest policies also had a positive role in promoting forest quality (significance level 1%). In particular, the collective forest area ratio had a high significance level. Among the economic indicators, GDP per capita and population urbanization rate were positive indicators, and they were within the 5% statistical significance level. The cultivated land area ratio also had a positive effect on forest quality within the 10% statistical significance level. In contrast, population density was a negative indictor, indicating that it inhibits the increase in forest quality.

4. Discussion

4.1. Forest Quality Change

Larger-scale artificial afforestation was one of the main reasons for the increasing trend of the forest Kuznets curve in some countries and regions in Asia [29,47], which also have been confirmed in our study. An inflection point in China’s forest transition appeared around 1981 (Figure 1a–c), and since then, forest management objectives have gradually shifted to both wood production and ecological construction, forest resources have increased [33], and forest area and volume of plantations especially have continued to increase (Figure 1d). The rapid expansion of forest area in China was the main reason for the transition of Asian forests from net loss to net growth [48]. However, the contradiction between effective forest supply and increasing social demand was still prominent, especially the proportion of wood imports to domestic wood consumption increased from 27.9% in 2000 to 50.7% in 2014 [32]. Therefore, it was of great significance and urgency to make full use of the superior light availability and the hot and wet soil conditions in the southern region to enhance the wood supply capacity of the plantation forests.
There was no defined or agreed upon standard concerning the criteria to be taken into consideration when assessing forest quality [9], and in this paper, a hierarchical model was established to assess forest quality index at the provincial level, and our criteria included forest quantity, forest productivity, forest structure, and forest health. In general, each normalization method has its own advantages and disadvantages, and the entropy weighting method could void human subjective factors at the provincial level. The weight of forest cover rate, forest land ratio, and stock volume per unit area were 0.1724, 0.1408, and 0.1584, respectively (Table 3), indicating that forest quantity had a great impact on the forest quality, and the results were consistent with those of previous studies [9,49,50]. The increase rate of forest cover rate was mainly from the substantial artificial afforestation. However, the increase in artificial forest would alter forest productivity, structure, and health.
The improving rates of forest quality varied between the different regions (Figure 2). The hotspots and sub-hotspots of the forest quality growth rate were mainly concentrated in the southern collective forests and the southwestern alpine forests. The forest resources in these regions were mainly broad-leaved forests with high ecological value. Moreover, the unique geographical advantage resulted in an economically advantageous position, so the level of forestry development was relatively high. The climatic conditions in the central most provinces (e.g., Beijing, Hebei, Tianjin, etc.) were mainly the sub-hot spots and sub-cold spots with respect to forest quality growth rate (Figure 2). These areas were conducive to both forest growth and agricultural development, and forest land was easily converted into cultivated land [10]. The Liaoning, Jilin, and Heilongjiang provinces were located in the northeastern state-owned forest area, including traditional forest areas of the northeast coniferous forests and mixed coniferous and broad-leaved forests [51]. This region had good forest quality, rich species availability, and high ecological value. However, the per capita GDP and urbanization levels were low, and the area of ecological public welfare forests was relatively low, resulting in a low forest ecological index and forest ecological construction.
The northwestern semi-arid and arid regions were poorly endowed with forest resources. The precipitation was also low with a considerable number of areas having an average annual precipitation of less than 400 mm [36]. The climatic conditions were not conducive to the reproduction and restoration of forest trees, and the economic development was relatively backward compared to the eastern provinces [52]. Thus, these regions, for example, the Shaanxi, Gansu, Ningxia, Qinghai, Xinjiang, and Inner Mongolia provinces in northwestern China, were cold spots and sub-cold spots for the forest quality growth rate (Figure 2). It should be noted that these provinces were important ecologically fragile areas. Once important key ecological land was destroyed, its recovery was quite difficult [36]. Another reason that these areas were forest quality growth rate cold spots and sub-cold spots is that grassland quality was not statistically considered in the forest quality index. How to incorporate grassland resources into the forest resource inventory and construct a comprehensive index reflecting the total amount of forest and grassland resources should be considered in future resource inventory studies.

4.2. Impact Factors

Climate factors and human activities were interlinked in the dynamic change of forest quality, which was consistent with findings from other studies [53,54]. Resource endowment was to be the most important explanatory variable that determined forest quality [55], and precipitation had an obvious positive impact on forest quality (Table 6), which was the most important factor restricting forest growth, especially in arid and semi-arid regions. Forest coverage can be close to saturation only in areas where the average annual precipitation was greater than 400 mm, whereas the forest coverage was generally less than 30% in areas where the average annual precipitation was less than 400 mm, and most of these areas have less than 10% forest coverage. China’s greening (forest coverage or leaf area index) has not crossed the 400 mm precipitation line [54]. This fact showed that artificial forestation was also limited by the 400 mm precipitation line [25,31]. Therefore, future forest construction in the arid and semi-arid regions in northwestern China need to consider the suitability of climate change [56]. Furthermore, local-scale plantation construction can only be carried out in locations with a guaranteed water supply, and large-scale afforestation is not a good strategy to address climate change.
Although some research argued that forest tenure insecurity was not strongly related to forest sustainability [57,58], our results showed that the collective forest area ratio also played a significant role in promoting forest quality (Table 6), which was consistent with the comments of Coleman [59], who also argued that the enforcement of tenure was an important determinant. The promotion of forest tenure reform through democratic decision-making was more conducive to increasing farmers’ input in forest land [51]. In addition, the increased investment by government in forest restoration enhanced the willingness and ability to invest in forest land and significantly increased the forest area and forest volume [60,61]. Therefore, the next step is to continue to deepen forest tenure reform, give full play to the role of market mechanisms in resource allocation, and improve forest quality.
Our results also strikingly demonstrated the importance of economic development in the dynamics of forest quality, especially in the central and eastern provinces. We recognized that the economic policy of opening to the outside world had an important positive impact on the improvement of forest quality in the early 1980s, and forest resources transitioned from long-term reduction to growth in the same period [34]. Economic growth also created more non-agricultural employment opportunities, which allowed urbanization to accelerate, thereby reducing the pressure on the forests [62]. Moreover, the increase in urbanization rate of the population led to the reconfiguration of the family labor force. Forest management required less labor compared with crop cultivation, so it has become a rational decision for farmers to adapt to the shortage of family labor by abandoning cultivated land [7]. The local energy consumption structure also changed, with traditional fuelwood being gradually replaced by new energy sources, thereby promoting the forest transition [63].
However, with the outflow of the rural population, agricultural machinery replaced labor to improve the efficiency, and agricultural output in China has not decreased but has only increased [64,65]. It is worth mentioning that the change in the cultivated land area ratio has not had a significant effect on the improvement of forest quality due to the characteristics of the national conditions (Table 6). That is, there was no competition and substitution relationship between agriculture and forestry development in China. The ecological benefits generated by forestry contribute to the improvement of the agricultural production efficiency. The agroforestry system was a typical representative of this harmonious symbiosis. In addition, this harmonious symbiosis of agriculture and forestry was also conducive to the development of the tertiary rural leisure tourism industry, which was conducive to the transformation and upgrading of traditional agriculture and forestry.

5. Conclusions

Forestry in China has entered a critical stage of improving the forest quality and transforming the development modes. In this paper, a large panel database (NFIs) was employed to investigate the spatial-temporal dynamics and the spatial determinants of forest quality. Results strikingly demonstrated that forest quality had greatly improved for the 31 provinces from the 2nd to 9th National Forestry Inventory. In general, the implementation of ecological projects had significantly improved the forest quality at the province level as of 2018. However, forest quality of the province level had a positive spatial correlation and exhibited obvious spatial clustering characteristics. The Spatial Durbin Model (SDM) with fixed effects was the most suitable model for empirical analysis and interpretation of the driving factors, which showed that the average annual precipitation and the area ratio of the collective forest were positively correlated with forested quality. The results could provide theoretical and technical supports for forest management in China.

Author Contributions

L.G. wrote the main manuscript text. Z.G. was mainly responsible for the content of the thesis, revision, and language adaptation; and he was the corresponding author, and Y.B. prepared the figures and tables. All authors have read and agreed to the published version of the manuscript.

Funding

This research was funded by Social Science Foundation of Shaanxi Province [Grant No. 2020R053], and Postdoctoral Research Foundation of China (Grant No.2019M663843). We are grateful to the Qinling National Forest Ecosystem Research Station for providing support.

Institutional Review Board Statement

Not applicable.

Informed Consent Statement

Not applicable.

Data Availability Statement

No new data were created or analyzed in this study. Data sharing is not applicable to this article.

Acknowledgments

The authors appreciate the referees and editors for their valuable advice.

Conflicts of Interest

The authors have no conflict of interest to declare.

References

  1. Dudley, N.; Schlaepfer, R.; Jackson, W. Forest Quality: Assessing Forests at a Landscape Scale; Earthscan: London, UK, 2006. [Google Scholar]
  2. Marull, J.; Otero, L.; Stefanescu, C.; Tello, E.; Miralles, M.; Coll, F.; Pons, M.; Diana, G.L. Exploring the links between forest transition and landscape changes in the Mediterranean. Does forest recovery really lead to better landscape quality? Agrofor. Syst. 2015, 89, 705–719. [Google Scholar] [CrossRef] [Green Version]
  3. Garcia, C.A.; Savilaakso, S.; Verburg, R.W.; Gutierrez, V.; Wilson, S.J.; Krug, C.B.; Sassen, M.; Robinson, B.E.; Moersberger, H.; Naimi, B.; et al. The global forest transition is a human affair. One Earth 2020, 2, 417–428. [Google Scholar] [CrossRef]
  4. Meyfroidt, P.; Lambin, E.F. Global forest transition: Prospects for an end to deforestation. Annu. Rev. Environ. Resour. 2011, 36, 343–371. [Google Scholar] [CrossRef]
  5. Kumar, P.; Esen, S.E.; Yashiro, M. Linking ecosystem services to strategic environmental assessment in development policies. Environ. Impact Assess. Rev. 2013, 40, 75–81. [Google Scholar] [CrossRef]
  6. Lorenzo, C.; Anders, M.; Davide, P. Ecosystem services from forest restoration: Thinking ahead. New For. 2012, 43, 543–560. [Google Scholar] [CrossRef]
  7. Näyhä, A. Transition in the Finnish forest-based sector: Company perspectives on the bioeconomy, circular economy and sustainability. J. Clean. Prod. 2019, 209, 1294–1306. [Google Scholar] [CrossRef]
  8. Barbier, E.B.; Burgess, J.C.; Grainger, A. The forest transition: Towards a more comprehensive theoretical framework. Land Use Policy 2010, 27, 98–107. [Google Scholar] [CrossRef]
  9. Feng, J.G.; Wang, J.S.; Yao, S.C.; Ding, L.B. 2016. Dynamic assessment of forest resources quality at the provincial level using AHP and cluster analysis. Comput. Electron. Agric. 2016, 124, 184–193. [Google Scholar] [CrossRef]
  10. Xie, H.L.; He, Y.F.; Xie, X. Exploring the factors influencing ecological land change for China’s Beijing-Tianjin-Hebei Region using big data. J. Clean. Prod. 2017, 142, 677–687. [Google Scholar] [CrossRef]
  11. Wilson, S.J.; Coomes, O.T.; Dallaire, C.O. The ‘ecosystem service scarcity path’ to forest recovery: A local forest transition in the Ecuadorian Andes. Reg. Environ. Chang. 2019, 19, 2437–2451. [Google Scholar] [CrossRef]
  12. Silver, W.L.; Ostertag, R.; Lugo, A.E. The potential for carbon sequestration through reforestation of abandoned tropical agricultural and pasture lands. Restor. Ecol. 2000, 8, 394–407. [Google Scholar] [CrossRef]
  13. Daily, G.C.; Polasky, S.; Goldstein, J.; Kareiva, P.M.; Mooney, H.A.; Pejchar, L.; Ricketts, T.H.; Salzman, J.; Shallenberger, R. Ecosystem services in decision making: Time to deliver. Front. Ecol. Environ. 2009, 7, 21–28. [Google Scholar] [CrossRef] [Green Version]
  14. Vallet, A.E.; Locatelli, B.; Levrel, H.; Perez, C.B.; Imbach, P.; Carmona, N.E.; Manlay, R.; Oszwald, J. Dynamics of Ecosystem Services during Forest Transitions in Reventazón, Costa Rica. PLoS ONE 2016, 11, e0158615. [Google Scholar] [CrossRef] [Green Version]
  15. Thompson, I.D.; Okabe, K.; Tylianakis, J.M.; Kumar, P.; Brockerhoff, E.G.; Schellhorn, N.A.; Parrotta, J.A.; Nasi, R. Forest biodiversity and the delivery of ecosystem goods and services: Translating science into policy. Bioscience 2011, 61, 972–981. [Google Scholar] [CrossRef]
  16. Fenichel, E.P.; Adamowicz, W.L.; Ashton, M.S.; Hall, J.S. Incentive systems for forest-based ecosystem services with missing financial service markets. J. Assoc. Environ. Resour. Econ. 2019, 6, 319–347. [Google Scholar] [CrossRef]
  17. Geels, F.W.; Sovacool, B.K.; Schwanen, T.; Sorrell, S. The sociotechnical dynamics of low-carbon transitions. Joule 2017, 1, 463–479. [Google Scholar] [CrossRef] [Green Version]
  18. Brancalion, P.H.S.; Niamir, A.; Broadbent, E.; Crouzeilles, R.; Barros, F.S.M.; Zambrano, A.M.A.; Baccini, A.; Aronson, J.; Goetz, S.; Reid, J.L.; et al. Global restoration opportunities in tropical rainforest landscapes. Sci. Adv. 2019, 5, eaav3223. [Google Scholar] [CrossRef] [Green Version]
  19. Li, L.; Hao, T.T.; Chi, T. Evaluation on China’s forestry resources efficiency based on big data. J. Clean. Prod. 2017, 142, 513–523. [Google Scholar] [CrossRef]
  20. Xu, J.T.; Yin, R.S.; Li, Z.; Liu, C. 2006. China’s ecological rehabilitation: Unprecedented efforts, dramatic impacts, and requisite policies. Appl. Energy 2019, 241, 73–81. [Google Scholar] [CrossRef]
  21. Tao, Y.Z.; Lu, Y.H.; Li, F.Q.; Jian, H.; Zhang, K.; Li, T.; Ren, Y.J. Assessment of ecological effect of the natural forest protection project in Southwest China. J. Ecol. Rural Environ. 2016, 32, 716–723. [Google Scholar] [CrossRef]
  22. Hong, B.T.; Ren, P.; Yuan, Q.Z.; Wang, L. Ecological function regionalization in the Upper Yangtze River. J. Ecol. Rural Environ. 2019, 35, 1009–1019. [Google Scholar] [CrossRef]
  23. Piao, S.; Yin, G.; Tan, J.; Cheng, L.; Huang, M.; Li, Y.; Wang, Y. Detection and attribution of vegetation greening trend in China over the last 30 years. Glob. Chang. Biol. 2015, 21, 1601–1609. [Google Scholar] [CrossRef]
  24. Tan, M.; Li, X. Does the Green Great Wall effectively decrease dust storm intensity in China? A study based on NOAA NDVI and weather station data. Land Use Policy 2015, 43, 42–47. [Google Scholar] [CrossRef]
  25. Chen, C.; Park, T.; Wang, X.H.; Piao, S.L.; Xu, B.D.; Chaturvedi, R.K.; Fuchs, R.; Brovkin, V.; Ciais, P.; Fensholt, R.; et al. China and India lead in greening of the world through land-use management. Nat. Sustain. 2019, 2, 122–129. [Google Scholar] [CrossRef]
  26. Tong, X.; Brandt, M.; Yue, Y.M.; Horion, S.; Wang, K.L.; Keersmaecker, D.W.; Tian, F.; Schurgers, G.; Xiao, X.M.; Luo, Y.Q.; et al. Increased vegetation growth and carbon stock in China karst via ecological engineering. Nat. Sustain. 2018, 1, 44–50. [Google Scholar] [CrossRef]
  27. State Forestry and Grassland Bureau (SFGB). China Forest Resources Report (2014–2018); China Forestry Publishing: Beijing, China, 2019. [Google Scholar]
  28. Fang, J.Y.; Chen, A.; Peng, C.; Peng, C.H.; Zhao, S.Q.; Ci, L. Changes in forest biomass carbon storage in China between 1949 and 1998. Science 2001, 292, 2320–2322. [Google Scholar] [CrossRef] [PubMed]
  29. Gao, G.L.; Ding, G.D.; Wang, H.Y.; Zang, Y.T.; Liang, W.J. China needs forest management rather than reforestation for carbon sequestration. Environ. Sci. Technol. 2011, 45, 10292–10293. [Google Scholar] [CrossRef]
  30. Liu, Y.S.; Fang, F.; Li, Y.H. Key issues of land use in China and implications for policy making. Land Use Policy 2014, 40, 6–12. [Google Scholar] [CrossRef]
  31. Wang, J.Y.; Xin, L.G.; Wang, Y.H. Economic growth, government policies, and forest transition in China. Rev. Environ. Resour. 2019, 19, 1023–1033. [Google Scholar] [CrossRef]
  32. Zhang, Y.X. Change analysis on Chinese forest construction from year 1950 to 2003. J. Beijing For. Univ. 2006, 28, 80–87. [Google Scholar]
  33. Hu, A.G.; Shen, R.M.; Lang, X.J. Verification of the environmental Kuznets curve relationship between changes in China’s forest resources and economic development: Based on provincial panel data from the second to the seventh national forest statistics. China Public Adm. Rev. 2013, 15, 61–75. [Google Scholar]
  34. Hao, Y.; Xu, Y.L.; Zhang, J.T.; Hu, X.L.; Huang, J.B.; Chang, C.P.; Guo, Y.Q. Relationship between forest resources and economic growth: Empirical evidence from China. J. Clean. Prod. 2019, 214, 848–859. [Google Scholar] [CrossRef]
  35. Fang, J.Y.; Guo, Z.D.; Piao, S.L.; Chen, A.P. Terrestrial vegetation carbon sinks in China, 1981–2000. Sci. China Ser. D 2007, 50, 1341–1350. [Google Scholar] [CrossRef]
  36. Wang, N.J.; Bao, Y.Q. Modeling forest quality at stand level: A case study of loess plateau in China. For. Policy. Econ. 2011, 13, 488–495. [Google Scholar] [CrossRef]
  37. Gong, Z.W.; Yao, S.B.; Gu, L. Effects of bio-physical, economic and ecological policy on forest transition: A spatial econometric analysis for Loess Plateau, P.R. China. J. Clean. Prod. 2019, 243, 1–16. [Google Scholar] [CrossRef]
  38. Zhang, T.T.; Lan, J.; Yu, J.N.; Liu, Z.; Yao, S.B. Assessment of forest restoration projects in different regions using multicriteria decision analysis methods. J. For. Res. 2020, 25, 12–20. [Google Scholar] [CrossRef]
  39. Cao, Y.L.; Fan, X.Y.; Guo, Y.H.; Li, S.; Huang, H.Y. Multi-objective optimization of injection-molded plastic parts using entropy weight, random forest, and genetic algorithm methods. J. Polym. Eng. 2020, 40, 360–371. [Google Scholar] [CrossRef]
  40. Yang, R.Y.; Chen, W.D. Spatial correlation, influencing factors and environmental supervision mechanism construction of atmospheric pollution: An empirical study on SO2 emissions in China. Sustainability 2019, 11, 1742. [Google Scholar] [CrossRef] [Green Version]
  41. Anselin, L. Spatial Econometrics: Methods and Models; Kluwer Academic Publisher: Dordrecht, The Netherlands, 1988. [Google Scholar]
  42. Moran, P. Notes on Continuous Stochastic Phenomena. Biometrika 1950, 37, 17–23. [Google Scholar] [CrossRef]
  43. Getis, A.; Aldstadt, J. Constructing the spatial weight matrix using a local statistic. Geogr. Anal. 2004, 36, 90–104. [Google Scholar] [CrossRef]
  44. Meiyappan, P.; Roy, P.S.; Sharma, Y.; Ramachandran, R.M.; Joshi, P.K.; DeFries, R.S.; Jain, A.K. Dynamics and determinants of land change in India: Integrating satellite data with village socioeconomics. Rev. Environ. Resour. 2017, 17, 753–766. [Google Scholar] [CrossRef]
  45. Anselin, L. Under the hood issues in the specification and interpretation of spatial regression analysis. Agric. Econ. 2002, 27, 247–267. [Google Scholar] [CrossRef]
  46. Anselin, L.; Bera, A.; Florax, R.; Yoond, M.J. Simple diagnostic tests for spatial dependence. Reg. Sci. Urban. Econ. 1996, 26, 77–104. [Google Scholar] [CrossRef]
  47. Mather, A.S.; Needle, C.L.; Fairbairn, J. The forest transition: A theoretical basis. Geography 1999, 84, 55–65. [Google Scholar] [CrossRef]
  48. FAO. State of the World’s Forests; United Nations Food and Agricultural Organization: Rome, Italy, 2007. [Google Scholar]
  49. Wu, G.X. The study on Indicator System and Evaluation Method of Forest Resources Quality at County-Level. Ph.D. Thesis, Beijing Forestry University, Beijing, China, 2010. (In Chinese with English Abstract). [Google Scholar]
  50. Zhang, H.R.; He, P.; Lang, P.M. Comprehensive evaluation of forest resource in Yanqing county based on AHP and fuzzy methods. J. Northwest For. Univ. 2011, 26, 179–184, (In Chinese with English Abstract). [Google Scholar]
  51. Zhang, Y.; Peng, C.H.; Li, W.Z.; Tian, L.X.; Zhu, Q.Q.; Chen, H.; Fang, X.Q.; Zhang, G.L.; Liu, G.M.; Mu, X.M.; et al. Multiple afforestation programs accelerate the greenness in the ‘Tree North’ region of China from 1982 to 2013. Ecol. Indic. 2016, 61, 404–412. [Google Scholar] [CrossRef]
  52. Li, Z.; Zheng, F.; Liu, W.; Flanagan, D.C. Spatial distribution and temporal trends of extreme temperature and precipitation events on the Loess Plateau of China during 1961~2007. Quatern. Int. 2010, 226, 92–100. [Google Scholar] [CrossRef]
  53. Frayera, J.; Sun, Z.L.; Müller, D.; Munroe, D.K.; Xu, J.C. Analyzing the drivers of tree planting in Yunnan, China, with Bayesian networks. Land Use Policy 2014, 36, 248–258. [Google Scholar] [CrossRef]
  54. Gao, X.R.; Sun, M.; Luan, Q.H.; Zhao, X.N.; Wang, J.C.; He, G.H.; Zhao, Y. The spatial and temporal evolution of the actual evapotranspiration based on the remote sensing method in the Loess Plateau. Sci. Total Environ. 2020, 708, 1–15. [Google Scholar] [CrossRef]
  55. Mustalahti, I. The responsive bioeconomy: The need for inclusion of citizens and environmental capability in the forest based bioeconomy. J. Clean. Prod. 2018, 172, 3781–3790. [Google Scholar] [CrossRef]
  56. Niu, Q.F.; Xiao, X.M.; Zhang, Y.; Qin, Y.W.; Dang, X.H.; Wang, J.; Zou, Z.H.J.; Doughty, R.B.; Brandt, M.; Tong, X.W.; et al. Ecological engineering projects increased vegetation cover, production, and biomass in semiarid and subhumid Northern China. Land Degrad. Dev. 2019, 30, 1620–1631. [Google Scholar] [CrossRef] [Green Version]
  57. Liu, C.; Wang, S.; Liu, H.; Zhu, W.Q. Reprint of: Why did the 1980s’ reform of collective forestland tenure in southern China fail? For. Policy. Econ. 2019, 98, 8–18. [Google Scholar] [CrossRef]
  58. Caveness, F.A.; Kurtz, W.B. Agroforestry adoption and risk perception by farmers in Sénégal. Agrofor. Syst. 1993, 21, 11–25. [Google Scholar] [CrossRef]
  59. Coleman, E.A. Institutional factors affecting biophysical outcomes in forest management. J. Policy Anal. Manag. 2010, 28, 122–146. [Google Scholar] [CrossRef]
  60. Rudel, T.K.; Coomes, O.T.; Moran, E.; Achard, F.; Angelsen, A.; Xu, J.; Lambin, E. Forest transitions: Towards a global understanding of land use change. Glob. Environ. Chang. 2005, 15, 23–31. [Google Scholar] [CrossRef]
  61. Song, Y.; Wang, G.; Burch, W.R., Jr.; Rechlin, M.A. From innovation to adaptation: Lessons from 20 years of the SHIFT forest management system in Sanming, China. For. Ecol. Manag. 2004, 191, 225–238. [Google Scholar] [CrossRef]
  62. Ewers, R.M. Interaction effects between economic development and forest cover determine deforestation rates. Glob. Environ. Chang. 2006, 16, 161–169. [Google Scholar] [CrossRef]
  63. DeFries, R.; Pandey, D. Urbanization, the energy ladder and forest transitions in India’s emerging economy. Land Use Policy 2010, 27, 130–138. [Google Scholar] [CrossRef]
  64. Barbiera, E.B.; Delacoteb, P.; Wolfersbergerc, J. The economic analysis of the forest transition: A review. J. For. Econ. 2017, 27, 10–17. [Google Scholar] [CrossRef]
  65. Cropper, M.L.; Griffiths, C. The interaction of population growth and environmental quality. Am. Econ. Rev. 1994, 84, 250–254. [Google Scholar]
Figure 1. The trends of forest area and forest quality in China from 1950–2018. ((a) is the forest cover rate, (b) is the forest area, (c) is the forest volume, (d) is the origin structure, and (e) is the forest quality index).
Forests 12 00733 g001
Figure 2. Forest quality index in 2nd and 9th National Forestry Inventory.
Forests 12 00733 g002
Figure 3. Getis-Ord Gi* values and its statistical test for the forest quality from the 2nd to 9th national forest inventory (1984–2018).
Forests 12 00733 g003
Table 1. Selection and interpretation of explanatory variables of forest quality.
VariablesSub-VariablesDefinition
Demographic FactorsPopulation DensityPopulation per unit land area (person/ha)
Economic Growth
Factors
GDP per CapitaTotal gross domestic product/Total population
Population Urbanization RateNon-agricultural population/Total population
Ratio of Cultivated Land AreaCultivated land area/Total land area
National Forest PolicyRatio of Collective Forest AreaCollective forest area/Forest area
Ratio of Forest Management AreaAfforestation area of national key project/Forest area
Nature FactorsAverage Annual TemperatureUsing the method of reverse distance weighted to interpolate based on the meteorological data (http://www.resdc.cn, accessed on 1 June 2021).
Average Annual PrecipitationSame as above
Table 2. Variables applied in the model and basic statistics from 1977 to 2018 in China.
VariablesSamplesMeanVarianceMinMax
Forest Quality Index2480.390.080.220.55
Population Density (N/hm2)2484.015.750.0640.80
Population Urbanization Rate (%)24841.8818.9212.2689.60
GDP per Capita (%)2482.272.600.0712.90
Ratio of Forest Management Area (%)2483.236.880.0163.10
Ratio of Cultivated Land Area (%)2482.805.820.0152.38
Ratio of Collective Forest Area (%)24831.5029.613.0197.69
Average Annual Temperature (℃)24812.745.94−1.4125.55
Average Annual Precipitation (mm)248982.52522.05131.862272.83
Table 3. Forest quality index system and its weights.
StructureSubstructureIndictorIndictor PropertyFormulaIndictor Weight
Forest Quality Index SystemForest quantityForest cover ratePositiveNFI (%)0.1724
Forest land ratioPositiveForest land area (m2)/ land area (m2)0.1406
Forest productivityForest land utilizationPositiveForested area (m2)/ forestry area (m2)0.0810
Volume per unit areaPositiveStand volume (m3) (m2)/ Forested area (hm2)0.1584
Volume qualityPositivevolume of forested land (m3)/ volume of standing trees (m3)0.0307
Volume growthPositiveNFI (%)0.1271
Forest structureStand origin structurePositiveNatural forest area (m2)/ plantation area (m2)0.1191
Stand category structurePositiveEcological public welfare forest area (m2)/ Forested area (m2)0.0800
Stand age structurePositiveYoung, middle-aged forest area (m2)/ Forested area (m2)0.0400
Forest healthyForest accessPositiveHigh accessibility area (m2)/ Forested area (m2)0.0372
Forest fire disaster ratioNegativeForest fire affected area (m2)/ Forested area (m2)0.0100
forest pests and rats damage ratioNegativeForest pests, rats area (m2)/ Forested area (m2)0.0002
Table 4. Global Moran’s I value and statistical test for forest quality from the 2nd to 9th National Forestry Inventory (1977–2018).
YearMoran’s IZScoreThreshold Value p (p < 0.05)
1977–19810.31243.04890.0094 (1.96)
1984–19880.30852.87030.0041
1989–19930.33873.12690.0017
1994–19980.30852.87030.0041
1999–20030.36243.31910.0009
2004–20080.36903.36890.0007
2009–20130.33923.11460.0018
2014–20180.38453.50580.0005
Table 5. The test of LM and Hausman and the P-value.
TestTest Valuep (p < 0.05)
LM-lag84.52740.0000
Robust LM-lag74.32150.0001
Hausman121.00590.0000
LM-error76.44150.0000
Robust LM-error71.65890.0541
Hausman189.22540.0000
Table 6. Regression coefficient estimates results of SLM, SEM, and SDM.
VariablesSLMSEMSDM
Coef.Std. Err.pCoef.Std. Err.pCoef.Std. Err.p
Population Density (N/hm2)−0.5428 **0.84210.0007−0.5214 **0.92360.0000−0.4455 **0.13200.0000
GDP per Capita (%)0.1457 *0.96520.00470.1235 *1.20150.00250.1035 **0.23200.0021
Population Urbanization Rate (%)0.01451.25450.05780.4523 **0.52180.21450.1209 **0.90040.0081
Ratio of Cultivated Land Area (%)0.3646 *0.98740.0214−0.56320.87510.1247−0.5672 *1.20360.5542
Ratio of Collective Forest Area (%)0.5124 ***0.09750.00000.5214 **0.53210.00000.3005 ***0.08920.0000
Ratio of Forest Management Area (%)0.59711.15470.05780.21450.56420.01150.4503 *0.89520.0019
Average Annual Temperature (°C)0.21561.09540.21450.01270.32140.1245−0.00431.80950.4041
Average Annual Precipitation (mm)0.8624 ***0.23140.00000.7521 ***0.08520.00000.6075 ***0.00970.0000
R20.79 0.84 0.87
Log L497.5544 501.2653 478.5235
AIC752.1245 687.8428 541.1548
SC574.3564 582.1471 187.5247
Wald Test 16.3522 ***
LR Test 15.3568 ***
Wald Test 24.5243 ***
LR Test 23.2215 ***
Note: *** represents within statistical significance level 1%, ** represents within statistical significance level 5%, * represents within statistical significance level 10%.
Publisher’s Note: MDPI stays neutral with regard to jurisdictional claims in published maps and institutional affiliations.

