Article

Predicting the Potential Geographic Distribution and Habitat Suitability of Two Economic Forest Trees on the Loess Plateau, China

1
Institute of Soil and Water Conservation, Chinese Academy of Sciences and Ministry of Water Resources, Yangling 712100, China
2
College of Resources and Environment, University of Chinese Academy of Sciences, Beijing 100049, China
3
Institute of Soil and Water Conservation, Northwest Agriculture and Forest University, Yangling 712100, China
*
Author to whom correspondence should be addressed.
Forests 2021, 12(6), 747; https://doi.org/10.3390/f12060747
Submission received: 7 April 2021 / Revised: 27 May 2021 / Accepted: 2 June 2021 / Published: 5 June 2021
(This article belongs to the Section Forest Ecology and Management)

Abstract

:
The Loess Plateau is one of the most fragile ecosystems in the world. In order to increase the biodiversity in the area, develop sustainable agriculture and increase the income of the local people, we simulated the potential geographic distribution of two economic forest trees (Malus pumila Mill and Prunus armeniaca L.) in the present and future under two climate scenarios, using the maximum entropy model. In this study, the importance and contributions of environmental variables, areas of suitable habitats, changes in habitat suitability, the direction and distance of habitat range shifts, the change ratios for habitat area and land use proportions, were measured. According to our results, bioclimatic variables, topographic variables and soil variables play a significant role in defining the distribution of M. pumila and P. armeniaca. The min temperature of coldest month (bio6) was the most important environmental variable for the distribution of the two economic forest trees. The second most important factors for M. pumila and P. armeniaca were, respectively, the elevation and precipitation of the driest quarter (bio17). At the time of the study, the area of above moderately suitable habitats (AMSH) was 8.7967 × 10⁴ km2 and 11.4631 × 10⁴ km2 for M. pumila and P. armeniaca. The effect of Shared Socioeconomic Pathway (SSP) 5-85 was more dramatic than that of SSP1-26. Between now and the 2090s (SSP 5-85), the AMSH area of M. pumila is expected to decrease to 7.5957 × 10⁴ km2, while that of P. armeniaca will increase to 34.6465 × 10⁴ km2. The suitability of M. pumila decreased dramatically in the south and southeast regions of the Loess Plateau, increased in the middle and west and resulted in a shift in distance in the range of 78.61~190.63 km to the northwest, while P. armeniaca shifted to the northwest by 64.77~139.85 km. This study provides information for future policymaking regarding economic forest trees in the Loess Plateau.

1. Introduction

The global ecosystem is under great pressure resulting from both climate change and social development [1]. A number of important studies have proven that climate change is having a profound impact on ecosystem biodiversity, at both global and local scales [2]. The global average temperature has risen by 0.1 °C per decade since the 1950s and is projected to increase by 1.5–2.1 °C by 2050, with a maximum rise of 2.6–4.8 °C by the end of this century [3,4]. Climate change (i.e., temperature, precipitation and radiation) leads to land use and land cover change (LUCC), which in turn leads to changes in the climate, particularly in the form of temperature changes. Both climate change and LUCC have significant impacts on the distribution ranges and spatial living patterns of biological organisms.
The importance and contributions of climate variables in explaining the distribution of species have long been recognized [5]. In the past few decades, with technological developments, a number of models based on various hypotheses have been applied in ecology that can directly calculate the correlations between environmental factors in species and communities [5,6,7]. The species distribution models (SDMs), such as Domain, the maximum entropy model (Maxent), the multi-model framework (MMF) and the generalized additive model (GAM), represent a set of tools that measure the distribution of species through a range of correlations among environmental factors and the locations of specific species [8,9,10,11]. Each model has its own unique advantages [9] and application scope. Among these SDM approaches, Maxent, a presence-only model [12], combines a variety of statistical models and machine learning methods and has the advantage of predicting the probability distribution of species by analyzing existing data [6,13,14], has been widely used to simulate species distribution [9,15,16]. The receiver operating characteristic (ROC), the area under characteristic curve (AUC) and the Jackknife test were used to evaluate the accuracy and test the performance of the Maxent model [1,17]. The AUC value varies from 0 to 1 and an AUC value closer to 1 indicates a prediction with higher accuracy [18]; less than 0.5 indicates an incorrect prediction, 0.5 indicates a random prediction, 0.5–0.7 indicates a fair prediction [19], 0.7–0.9 indicates a good prediction [16] and 0.9–1.0 indicates an excellent prediction [20]. Furthermore, previous studies reveal that Maxent has significantly superior performance over other methods in terms of its high accuracy and tolerance [3], particularly for poorly known species with few occurrence records [21].
The Loess Plateau is widely considered one of the most fragile ecosystems in the world [22]. Its deep loess deposit and severe soil erosion cover a region of 0.64 million km2 of a typical highland area [23,24]. The human beings living in this area continue to face enormous challenges related to water and food security [25]. In addition, the unsustainable land use by local farmers and herdsmen has caused extensive vegetation degradation and land degradation on the Loess Plateau, which is considered one of the main driving forces of these challenges [2,26]. Rapid and significant changes in the underlying surface caused by human activities will inevitably lead to changes in ecosystem structure and function [23]. In order to reverse and improve the ecological environment and develop sustainable agriculture [24], the Chinese government has paid close attention to the control of soil erosion and implemented many soil and water conservation practices since the 1970s, two of the most famous of which are the Grain for Green Project (GGP) and Natural Forest Protection Projects [23]. After decades of efforts, a large amount of farmland has been converted into forests and grasslands [23]. However, it should be noted that these projects are still too dependent on national financial input and so we are far from achieving stable and sustainable development in this region. Reed [27] argues that adequate policy and economic support could help to facilitate sustainable land management. In order to increase the income of the local people, the Chinese government has strongly suggested planting economic forest trees while balancing ecological functions [22]. However, local famers and herdsmen usually lack scientific guidance in the selection of economic forest tree locations and species [18], which may be an important reason for the low survival rate of economic tree reforestation. Unsustainable farming practices could lead to changes in the underlying surface [1,28,29]. Hence, it is crucial to determine suitable areas for specific economic forest trees in order to contribute to the sustainable and long-term development of the Loess Plateau. Therefore, we select Malus pumila Mill (apple) and Prunus armeniaca L. (apricot), which are favored by the Chinese people and have a rich cultivation history, as our objects of study. In this study, we aim to (1) predict the geographic distribution of M. pumila and P. armeniaca, (2) calculate the areas of suitable habitats and its proportions with regard to land use types and (3) determine their direction and the distance of range shifts under climate change.

2. Materials and Methods

2.1. Species Occurrence Data

In order to obtain the occurrence records for the northern region of the Yangtze River in China (except Qinghai, Tibet and Xinjiang), we applied the location data from the Chinese Virtual Herbarium (a platform supported by the Chinese government for sharing the digital information of nearly 8 million plant specimens from more than 100 domestic herbarium, (https://www.cvh.ac.cn, accessed on 23 November 2020) and retrieved 501 records (260 of M. pumila and 241 of P. armeniaca). Since the prediction of plant species’ geographic distribution requires high-accuracy occurrence data, we first excluded duplicate records [4] and those records whose locations were above the county level. Then, we used the Google Earth map of Earth Online (https://www.earthol.com/, accessed on 29 December 2020) to determine the latitude and longitude coordinates according to the position description of the specimen, particularly when the occurrence records lacked exact coordinates. To reduce spatial autocorrelation and improve the accuracy of model prediction, we used the SDM toolbox Ver 2.4 of ArcGIS 10.2 (ESRI, Redlands, CA, USA) to rarefy occurrence data for SDMs. The rarefication ensures that the distance between any two occurrence records is greater than 5 km. Finally, we obtained 176 geographic locations of M. pumila and P. armeniaca (Figure 1) for the Maxent model.

2.2. Environmental Variables

To describe future climate change [30], we used the same bioclimatic variable projection (2.5 arc-min resolution) of the Beijing Climate Center Climate System Model (BCC–CSM2–MR) in phase 6 of the Coupled Model Intercomparison Projects (CMIP6), which has been widely used in East Asia [31,32]. Among four emission scenarios of the Shared Socioeconomic Pathways (SSP), SSP1-26 intends to limit warming below 1.5 °C, while SSP5-85 predicts an increase of 5 °C by 2100 [33,34]. Two of the climate scenarios, SSP1-26 (the optimistic case, 2.6 Wm−2 level) and SSP5-85 (the worst case, 8.5 Wm−2 level), showing the two most extreme scenarios of future climate change [4], were finally, selected as the future variable types for the Maxent model [35].
We initially selected 24 environmental factors that may affect the geographic distribution of M. pumila and P. armeniaca to model the present and future species distribution patterns. These factors included 19 bioclimatic variables (bio1-bio19) with 2.5 arc-min spatial resolution (~5 km) from WorldClim v2.1 (https://www.worldclim.org, accessed on 18 May 2020) [36], one digital elevation model datum (DEM, ~1 km) and three soil texture data (~1 km) from RESDC (http://www.resdc.cn/, accessed on 19 May 2020) and one soil type datum from FAO (http://www.fao.org/soils–portal/en, accessed on 11 May 2020). With the help of the toolbox in ArcGIS, three extra topographic factors (slope, aspect, curvature) were obtained by using DEM data (elevation). To avoid over-fitting [29,37], 8 out of 27 variables were selected (more details are given in [38]). Based on the physiology requirements [30] of M. pumila and P. armeniaca, we selected four additional bioclimatic variables. Finally, 12 vital environmental variables were obtained for the Maxent model, including six bioclimatic variables, four topographic variables and two soil variables (Table 1).
To describe the land use situation, we chose the observational data (300 m spatial resolution) of 2010 from Copernicus (https://climate.copernicus.eu/, accessed on 7 August 2020). As shown in Table S1, we combined and reclassified land use types with similar functions and finally obtained seven types: cropland, grassland, forest, mosaic area, bare, urban and built-up and water.

2.3. Model Implementation and Evaluation

In this study, we used Maxent 3.4.1 [6] to predict the potential geographic distribution of species. To ensure the accuracy of Maxent, with the help of ArcGIS, we set the environmental variables to the same resolution (2.5 arc-min) and the same projected coordinate system (Asia North Alberts Equal Area Conic, WGS1984). In addition to the recommended default parameters [6], we ran the model with 30% test data (70% of training data) and 5 replicates. We firstly use maximizing of the sum of sensitivity and specificity (Maxsss) to delineate the binary presence/absence maps [39]. The presence distribution maps were then reclassified and divided into lowly suitable, moderately suitable and highly suitable areas by breakpoints 0.4 and 0.6.

2.4. Spatial and Statistical Analysis

With the help of the raster calculator, we calculated the changes in suitability. In the process of describing the increase and decrease maps of M. pumila and P. armeniaca, we define the interval period as “Pt-Pp”, while Pt represents the target period and Pp represents the previous period. The reclassified suitability change was divided into seven conditions: high decrease, middle decrease, low decrease, no change, low increase, middle increase and high increase. Specifically, the no change parts were divided into two specific parts, no change_suitable and no change_unsuitable, according to the presence and absence conditions of species.
In order to determine the moderately suitable and highly suitable area proportions of land use in different periods, we overlaid the reclassified suitable maps and the LUCC maps and finally obtained the suitability conditions with land use in three periods. Since it is difficult to obtain relatively accurate simulation results of LUCC over a long time span, we assumed that the land use will not change in the next 100 years. By considering the gravity of suitability, we used the mean center tool to calculate the distribution maps of M. pumila and P. armeniaca under the climate scenarios and finally obtained the centroids in different periods. The change ratio (Cr) represents the suitable habitat area change from the present (Ap) to the target period (At) and it can be calculated using the following equation: Cr = (At − Ap)/Ap [30]. The combination of periods (2050s and 2090s) and climate scenarios (SSP1-26 and SSP5-85) represents the condition of the period under the corresponding climate scenario.

3. Results

3.1. The Contribution and Importance of Environmental Variables

The accuracy of Maxent was evaluated based on the AUC values. During the Maxent simulation, all the AUC values were higher than 0.9. The average AUC values were 0.946 ± 0.02 and 0.959 ± 0.02 (mean ± SD) for M. pumila and P. armeniaca, indicating that Maxent displayed excellent prediction accuracy in our simulations. These results also indicated that the bioclimatic data, topographic data and soil data played an important role in developing the model. Among all environmental variables, bio6 and elevation played important roles in determining the future distribution of M. pumila in both the 2050s and 2090s. The contribution of bio6 and elevation exceeded 72%, while their importance exceeded 73% in all simulations of the 2050s and 2090s under SSP1-26 and SSP5-85 (Figure 2A,B). However, it should be noted that both bio6 and elevation had a wide range of contribution rate and importance rate values in the SSP1-26 scenario (i.e., the contribution of bio6 ranged from 33.8% to 48.4% in the 2050s, the importance of bio6 varied from 29.1% to 51.4% in the 2050s, the importance of elevation ranged from 22.2% to 49.2% in the 2050s and the importance of elevation ranged from 19.0% to 43.0% in the 2090s). Interestingly, compared with SSP1-26, the contribution rate and importance rate of bio6 and elevation in the SSP5-85 scenario were relatively stable, particularly the contribution rate of bio6 (43.4–46.7%) (Figure 2B).
During the simulation of P. armeniaca, the three highest-ranked factors were bio6, bio 12 and bio17, whose cumulative relative contribution and importance exceeded 65% and 76%, respectively. The average contribution rate of bio6 was the highest in both the 2050s and 2090s under the SSP1-26 and SSP5-85 scenarios. Among all environmental variables used to predict the distribution of P. armeniaca, bio12 ranked third, but it had the largest range (i.e., the importance rate varied from 2.2% to 30.3% under the SSP5-85 climate scenario) in both the 2050s and 2090s.
For M. pumila and P. armeniaca, bioclimatic variables are the most important variables affecting their growth and development, followed by topographic variables and soil variables. Among all environmental factors, the contribution rate and importance rate of bio1, bio5 and aspect were close to 0. For M. pumila, the contribution rate of topographic and soil factors showed the following order: elevation > sand > slope >curvature > soil > aspect. However, the contribution ranking of topographic and soil factors for P. armeniaca was as follows: elevation > slope > curvature > soil > sand > aspect.

3.2. Suitable Habitats for M. pumila and P. armeniaca

We obtained the distribution maps of M. pumila and P. armeniaca in the present and future (SSP1-26 and SSP5-85 scenarios, Figure 3). The suitability was reclassified into four categories (unsuitable, low suitable, moderately suitable and highly suitable) and the corresponding habitats were classified as unsuitable habitat (UH), low suitable habitat (LSH), moderately suitable habitat (MSH) and highly suitable habitat (HSH).
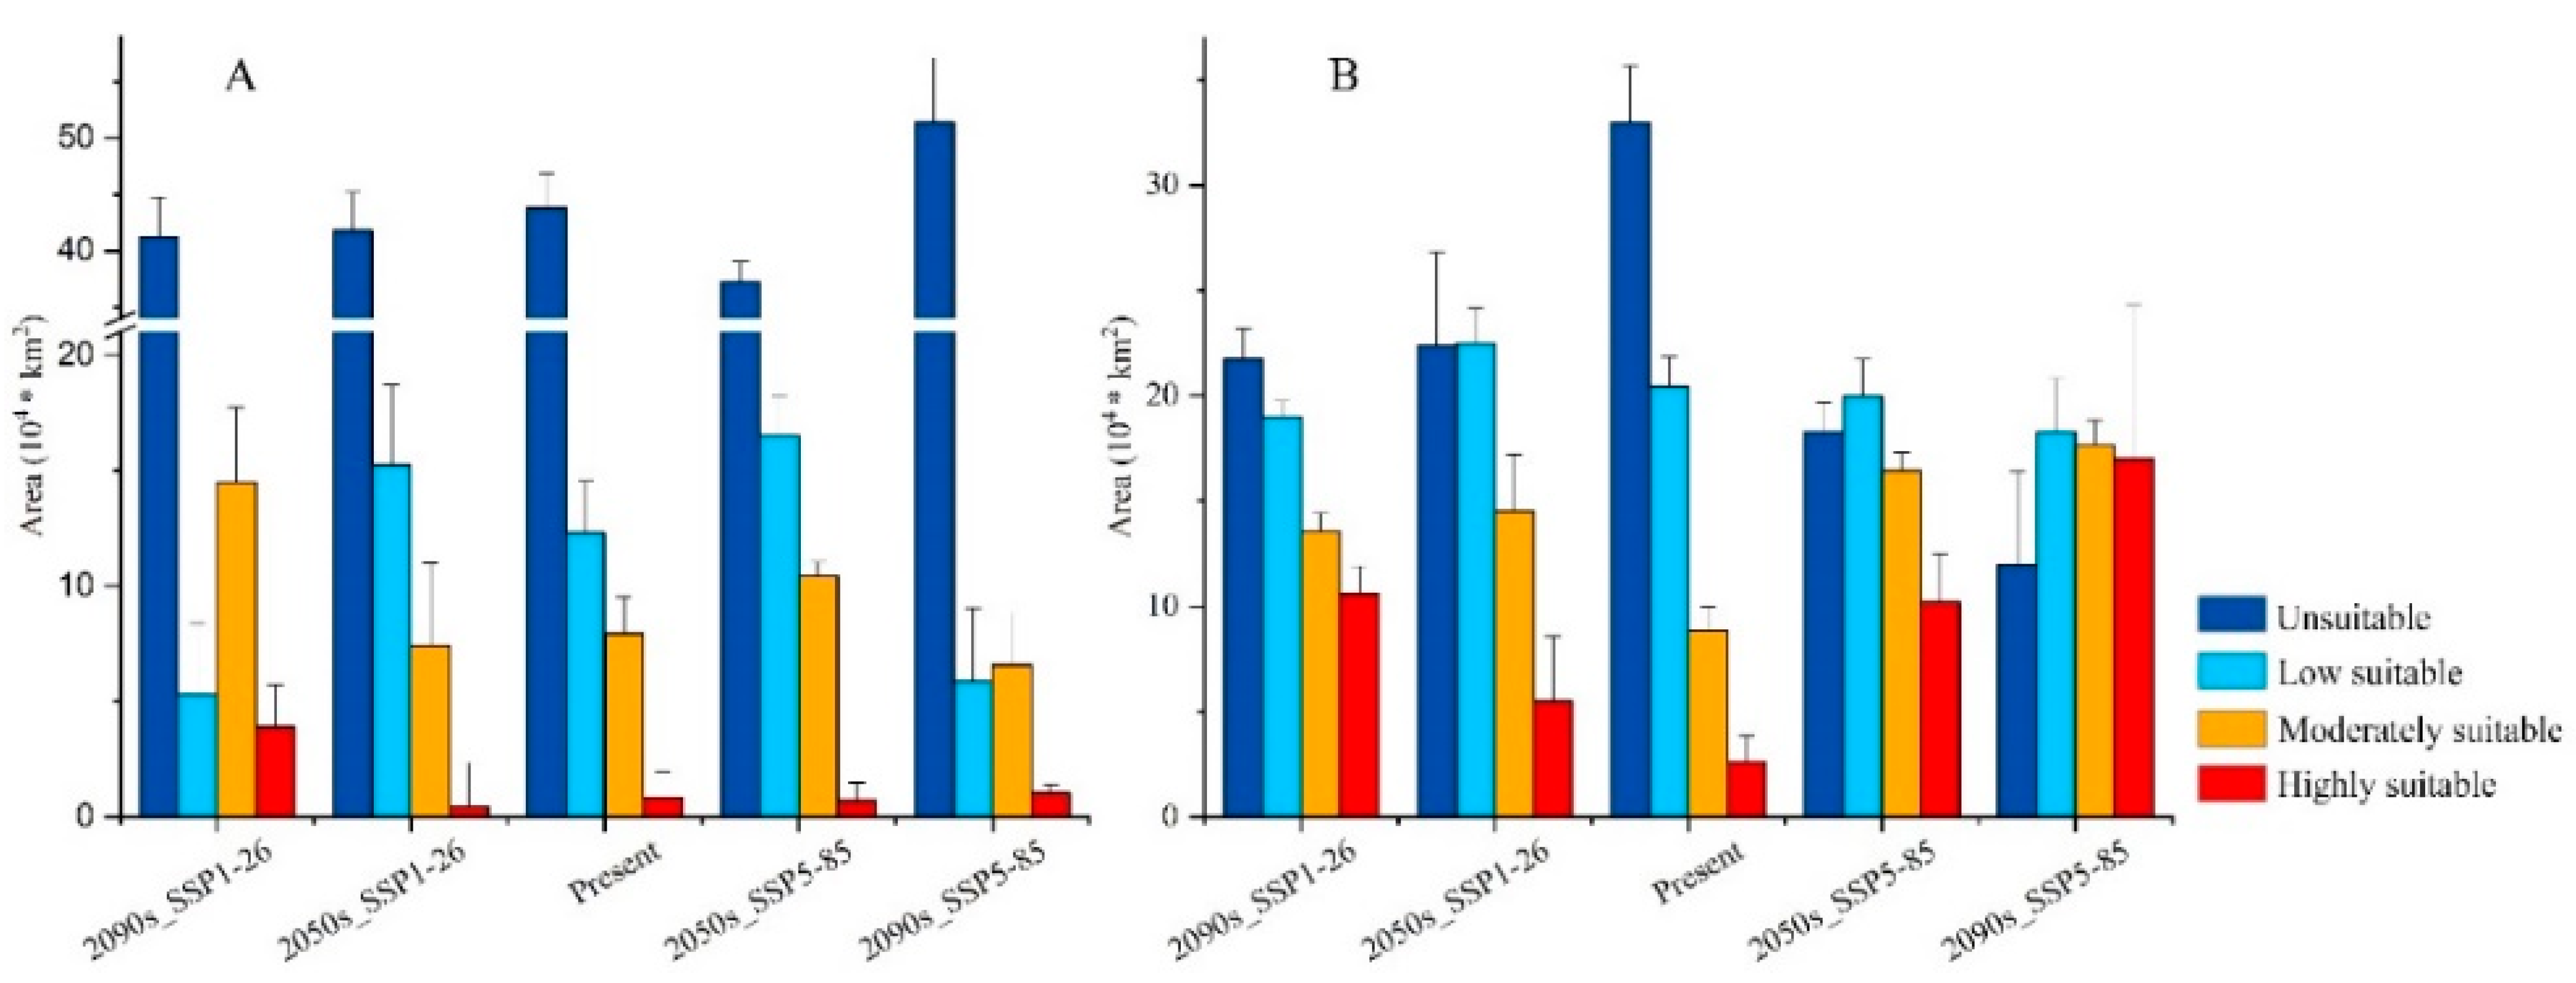
For M. pumila, the area of UH, LSH, MSH and HSH was 43.7759 × 10⁴ km2, 12.3149 × 10⁴ km2, 7.9449 × 10⁴ km2 and 0.8518 × 10⁴ km2, respectively (Figure 4A, Table S2). The suitable area of M. pumila showed a difference change under SSP1-26 and SSP5-85 on the Loess Plateau. Under SSP1-26, the area of suitable habitats (SH: LSH, MSH and HSH) showed a slight trend of continuous increase from the present period to the end of this century (Table S2); however, the area of above moderately suitable habitats (AMSH: MSH and HSH) dropped from 8.7967 × 10⁴ km2 (present) to 7.8458 × 10⁴ km2 for the 2050s and then increased to 18.3296 × 10⁴ km2 for the 2090s. Interestingly, compared with SSP1-26, the area of SH under SSP5-85 did not maintain a stable and sustained change and the area of SH increased for the 2050s and decreased dramatically for the 2090s. The area of AMSH was consistent with the change trend of SH, which increased from the present to 11.1493 × 10⁴ km2 for the 2050s and then dropped to 7.5957 × 10⁴ km2 for the 2090s.
Compared with M. pumila, P. armeniaca showed a dramatic expansion in all climate change cases. The area of UH, LSH, MSH and HSH was 32.9711 × 10⁴ km2, 20.4533 × 10⁴ km2, 8.8486 × 10⁴ km2 and 2.6145 × 10⁴ km2, respectively. Under both SSP1-26 and SSP5-85, P. armeniaca showed a continuous increase from the present period to the 2050s and the 2090s. Under SSP1-26, the area of AMSH increased from 11.4631 × 10⁴ km2 at present, to 20.0286 × 10⁴ km2 for the 2050s and 24.1556 × 10⁴ km2 for the 2090s (Figure 4B, Table S2), while under SSP5-85, the area in the two periods was 26.6638 × 10⁴ km2 and 34.6465 × 10⁴ km2. The area of MSH and HSH increased greatly; in particular, the area of HSH under the SSP5-85 scenario increased by 550% compared to the present area (Table S2).

3.3. Changes in Habitat Suitability and Range Shifts

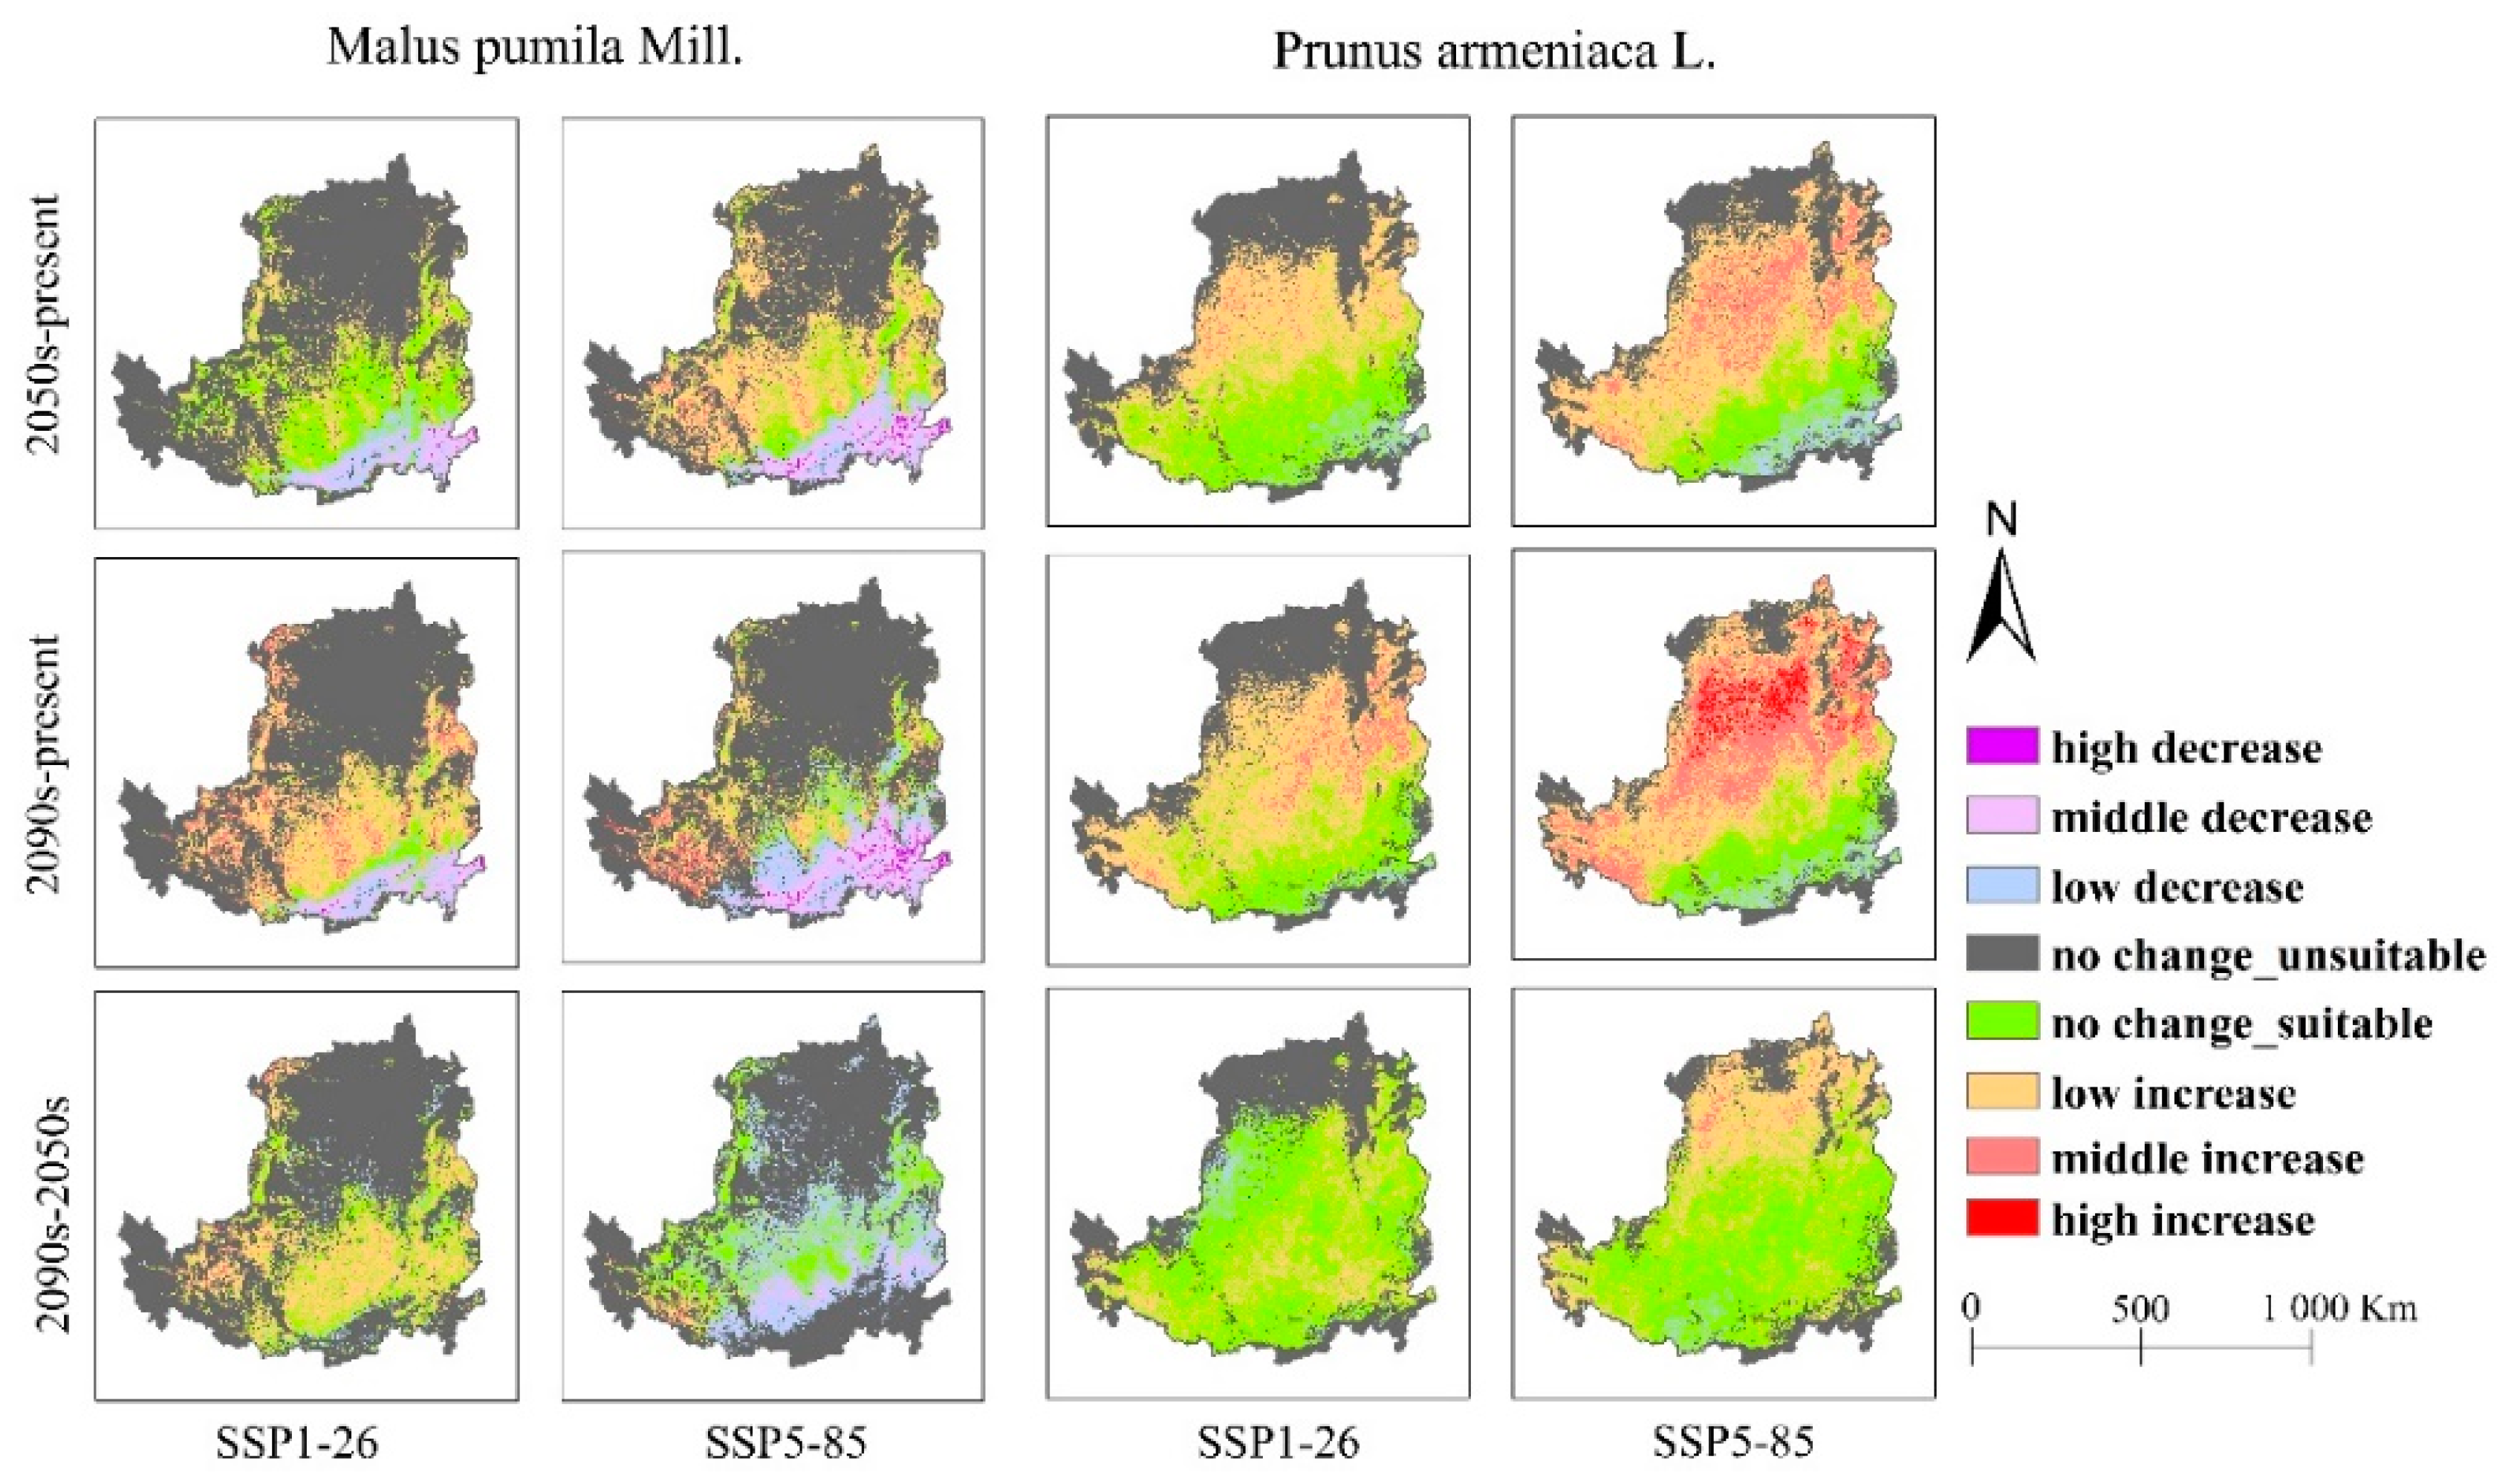
The change in suitability was divided into seven levels (Figure 5) based on the reclassified suitability of habitats. For M. pumila, by the 2050s (SSP1-26), the area of habitat suitability was predicted to mainly decrease in the south of the Loess Plateau (a low decrease in the south and a dramatic decrease in the southeast); the suitability remained largely unchanged in the central, northern and southwestern areas (the central area was suitable habitat, while the north and southwest were unsuitable areas) and there was a scattered increase in suitability in the central area (Figure 5). By the 2090s (SSP1-26), the area of habitat suitability was predicted to decrease in the south and southeast of the Loess Plateau and increase in the central and western areas. Specifically, compared with SSP1-26, the habitat suitability change in M. pumila showed different trends under SSP5-85. By the 2050s, in the south of the Loess Plateau, a dramatic decrease in habitat suitability was predicted over a larger area, while the central and western areas showed a dramatic increase (Figure 5). However, by the 2090s, the area of suitability was predicted to dramatically decrease in the south of the Loess Plateau, while the area of suitability will dramatically increase in the southwest of the Loess Plateau. From the 2050s to the 2090s, in the central and southern areas of the Loess Plateau, M. pumila was predicted to show a slight increase in habitat suitability under SSP1-26 and a slight decrease under SSP5-85. For the habitat suitability change in P. armeniaca, from the southeast to northwest, the intensity of the change in suitability varied from a high decrease to a high increase in all cases. The suitability of P. armeniaca remained constant in the middle of the Loess Plateau and dramatically increased in the northern and northwestern regions. SSP5-85 displayed a change of greater intensity than SSP1-26.
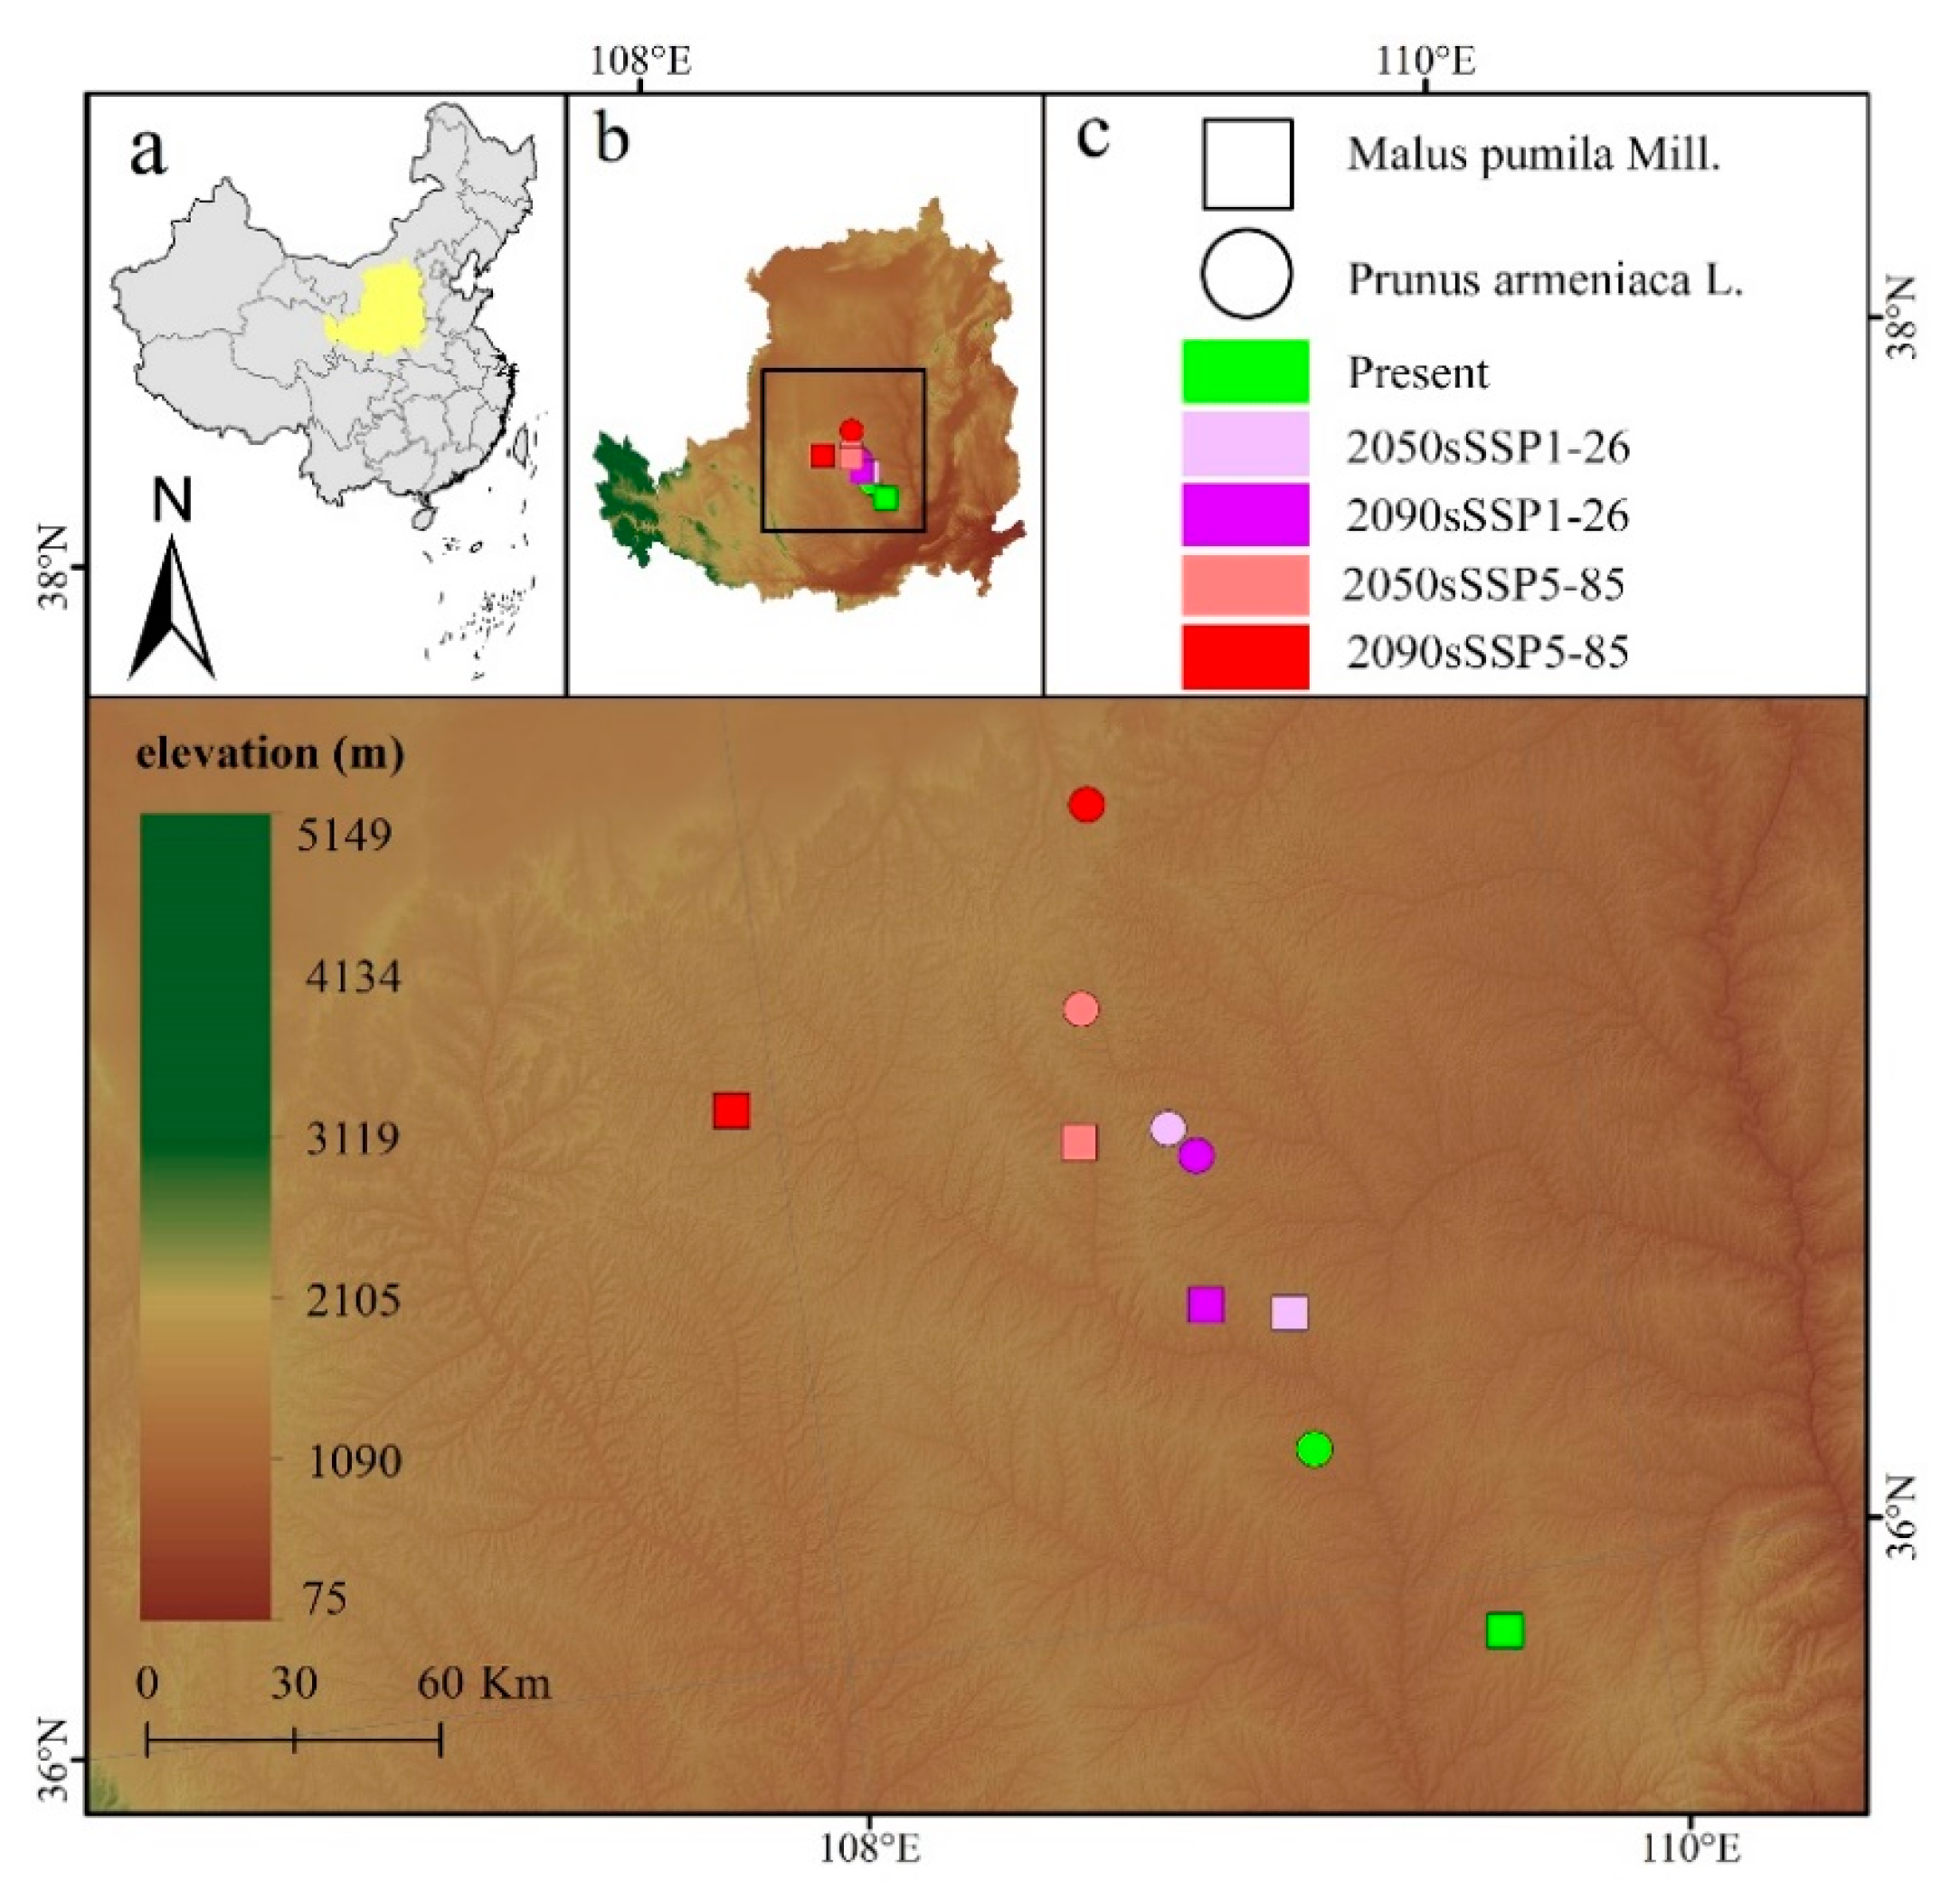
Changes in the suitable area and habitat suitability resulted in changes in the centroids. The centroid of the current habitat of M. pumila and P. armeniaca was located at 109°36′55.96″ E, 35°54′12.87″ N and 109°12′53.28″ E, 36°15′19.23″ N, respectively (Figure 6). For M. pumila, under SSP1-26, the shift distances were 78.61 km and 90.20 km for the 2050s and the 2090s, while the shift distances were 132.57 km and 190.63 km under SSP5-85. For P. armeniaca, the shift distances were 72.08 km and 64.77 km for the 2050s and the 2090s under SSP1-26, while they were 101.89 km and 139.85 km under SSP5-85. Overall, for both M. pumila and P. armeniaca, we observed that the centroids of future suitable habitats (2050s, 2090s) shifted towards the northwest under both future emission scenarios (SSP1-26, SSP5-85).

3.4. the Dominant Composition and Proportion of Land Cover

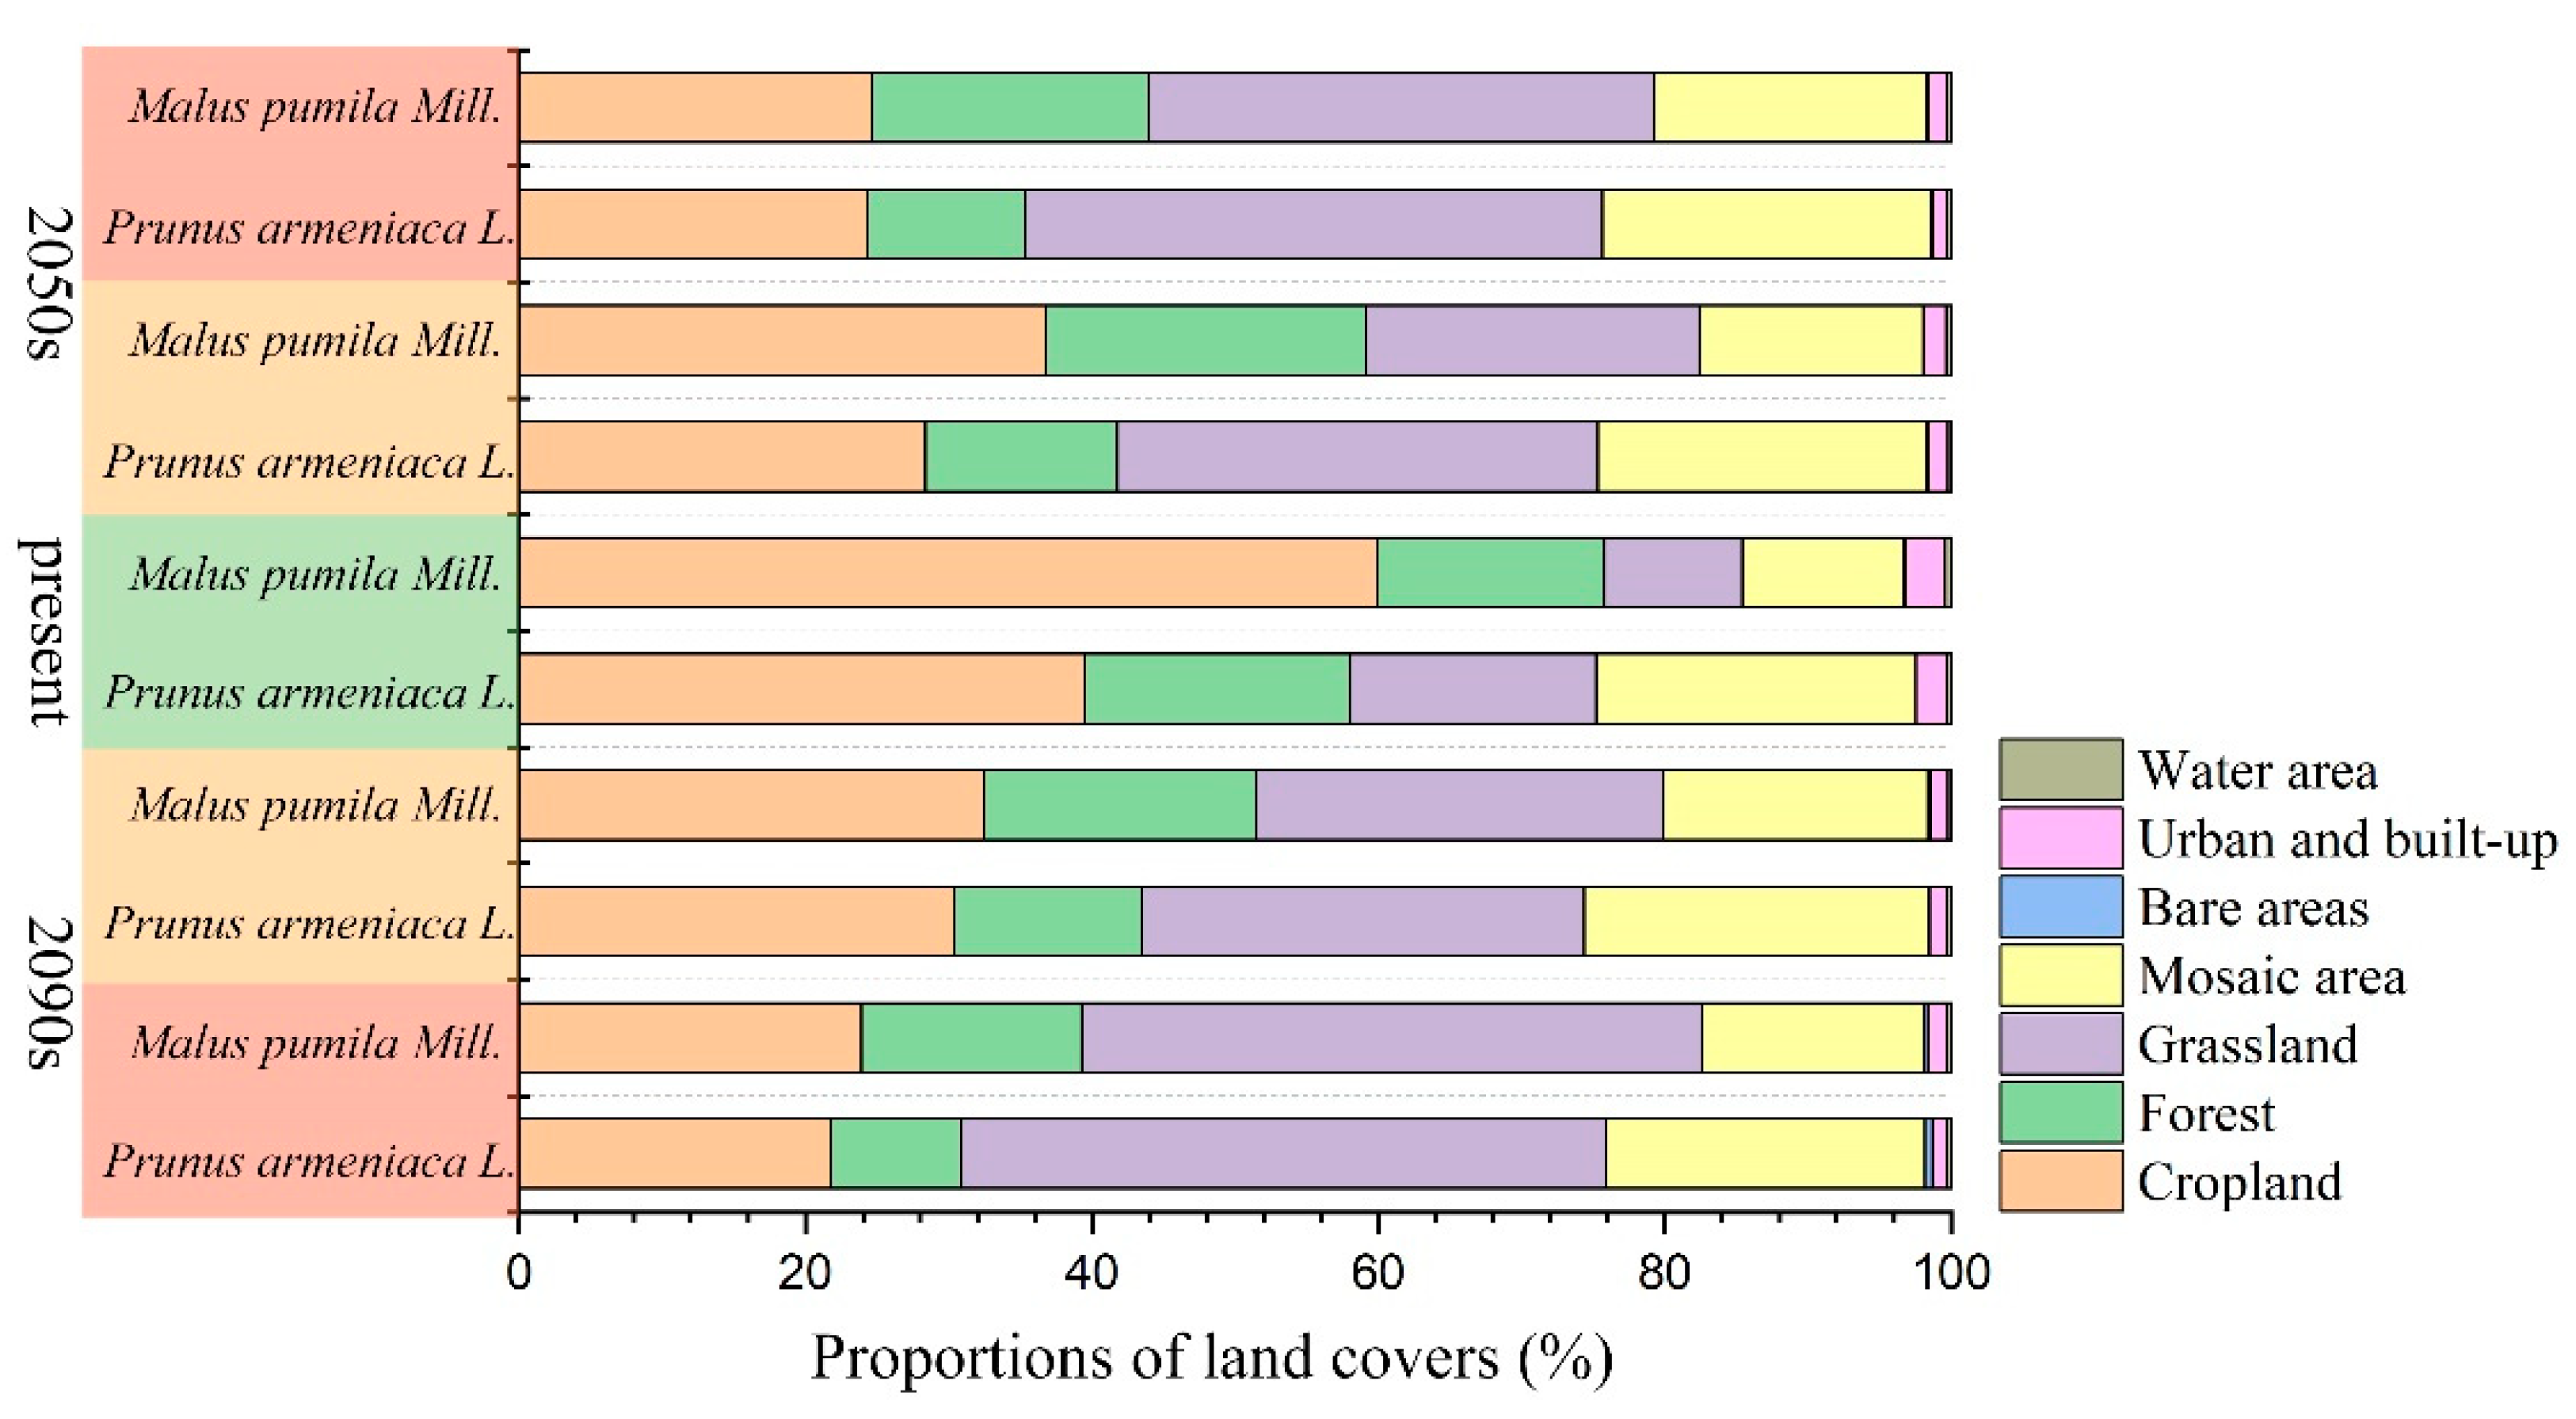
We obtained the preferable land cover proportions of M. pumila and P. armeniaca under SSP1-26 and SSP5-85 (Figure 7). At present, for M. pumila, the dominant land cover types of AMSH were, in order, cropland, forest and mosaic areas (Figure 7). Under SSP1-26, the proportion of cropland decreased from 34.68% for the 2050s to 32.51% for the 2090s and the proportion of grassland increased from 23.28% for the 2050s to 28.42% for the 2090s. SSP5-85 showed a stronger change range than SSP1-26. Compared with the proportion of the present, forest type showed an initial increasing trend and then decreased under both the SSP1-26 and the SSP5-85 scenarios. For P. armeniaca, the dominant land cover types were, in order, cropland, mosaic area and forest at present (Figure 7). The proportions of grassland showed an increasing trend from the present to the 2050s and the 2090s and SSP5-85 saw a greater increase in proportion than SSP1-26. By the 2090s, the proportion of cropland was predicted to decrease to 30.35% under SSP1-26 from 39.52% at present and to decrease to 21.78% under SSP5-85; the proportion of mosaic area showed a stable trend, which was predicted to change from 22.38% at present to 22.95% (2050s) and 24.08% (2090s) under SSP1-26 and to 22.89% (2050s) and 22.26% (2090s) under SSP5-85 (Figure 7).

4. Discussion

4.1. Environmental Factors Shaping the Distribution of Species

We simulated the geographic distribution of M. pumila and P. armeniaca at present and in the 2050s and 2090s by Maxent under two emission scenarios (SSP1-26, SSP5-85). Our results, which indicate robust and accurate model performance (AUC > 0.9), reveal that bioclimatic factors, together with topographic factors and soil factors, play an important role in affecting species distribution, which is consistent with previous studies [7,40]. Among the various environmental variables, min temperature of coldest month (bio6) and elevation are considered the most obvious limitations for the distribution of M. pumila, while for P. armeniaca, the limiting factors are the min temperature of coldest month (bio6) and precipitation of the driest quarter (bio17). Previous studies have proven that winter temperature, especially the minimum temperature, has huge effect on the distribution of species, especially for plants at high altitudes [41]. Temperature increase in the future may change the distribution patterns of M. pumila and P. armeniaca [42]. As economic trees that have been widely cultivated in the Loess Plateau, although M. pumila and P. armeniaca are limited by similar bioclimatic factors, they are restricted by different topographic and soil factors. Our simulation shows that, by the 2050s, compared with SSP5-85 (9.33%), the area where the suitability of M. pumila remained unchanged was predicted to maintain a relatively higher percentage (17.67%, Figure 5) under the SSP1-26 scenario, which indicates that M. pumila are sensitive to climate change. This is consistant with the previous studies in Northern India, which have shown that the elevation of apple orchards risen from 1200–1500 m to 1500–2500 m in two decades [41]. With the high contribution and importance of elevation and the low contribution and importance of bio12, bio16 and bio17, M. pumila exhibits much greater tolerance to precipitation and higher sensitivity to the cultivation altitude [42,43]. The high contribution and importance of bio17 indicates that P. armeniaca is more sensitive to precipitation. Therefore, P. armeniaca can be used to occupy the original position of M. pumila [27,42] and future cultivation may require a variety of irrigation to compensate [41]. The texture and type of soil is essential to support plants and provide nutrients. The difference in the contributions and importance of sand (soil texture) and soil (soil type) reveals that, for M. pumila, sand has a greater effect on the geographic distribution than soil, while soil plays a relatively significant role in affecting the distribution of P. armeniaca.

4.2. The Distribution of M. pumila and P. armeniaca

The area of AMSH showed differences in the change trend between M. pumila and P. armeniaca under the two scenarios (SSP1-26, SSP5-85). The AMSH area of M. pumila showed the opposite trend under the two scenarios, while that of P. armeniaca showed an increasing trend over time (Figure 4, Table S2). We speculate that the preference for colder temperatures and the limited tolerance of increases in temperature in M. pumila [41] are possible reasons for the contrasting change trends under the two climate scenarios. For P. armeniaca, the increasing intensity of the predicted AMSH area under SSP5-85 was greater than that under SSP1-26, indicating that P. armeniaca had a higher temperature tolerance than M. pumila. Considering the future climate conditions, P. armeniaca would be more suitable for planting in the vast area of the Loess Plateau.
In the biological world, the distribution of species is often affected by many factors simultaneously [1]. It is difficult to quantitatively measure the contributions of various factors to the range of changes in species using general methods and we believe that qualitative analysis is often more important in order to elucidate specific problems. Generally, a smaller temperature increase and higher carbon dioxide concentrations are more conductive to plant growth, but by the 2050s, the temperature accumulation of SSP5-85 may have exceeded the optimal growth temperature for M. pumila, resulting in a decrease in the AMSH area. Recent studies have suggested that temperatures above the optimal temperature range force stomata closure and reduce the overall metabolic activity of plants [44]. In addition, global warming may lead to a redistribution of precipitation across regions, which in turn will significantly alter plant distribution patterns [33].
Under both the SSP1-26 and SSP5-85 scenarios, compared with the centroid of the present, both M. pumila and P. armeniaca shift to the northwest, which is consistent with the direction of the increasing altitude of the Loess Plateau. Under the same climate scenario, M. pumila and P. armeniaca showed the same trend: the range shift distance for the 2090s was larger than that for the 2050s. Many species have been reported to shift poleward in latitude and upward in altitude in many cases, at a large scale, under the continued pressure of global warming [45,46,47]. For climate-sensitive species, similar climate change pressure may result in dramatic expansion or contraction [48], which may result in a long-distance range shift. However, at local or regional scale, species are greatly affected by local factors, which often leads to diverse shifts [45]. Thus, unusual shifts are likely to become explicable when local conditions are taken into account.

4.3. Establishment and Conservation Strategies of Economic Forest Trees in the Loess Plateau

It is widely accepted that changes in the global climate will inevitably affect land use, land cover and the distribution of natural species [15,28]. Previous studies have proven that increasing the biodiversity of ecosystems can increase their resistance to climate changes [49]. In the extensive, ecologically sensitive area of the Loess Plateau, policymakers are seeking novel ways to reach the goals of balanced local food security, reduction of poverty and development of sustainable ecosystems [50]. Combining the vegetation restoration and national projects such as the GGP to increase the cultivated area of local economic tree species is a feasible approach to achieve these goals. However, as different species have different levels of tolerance to the environment of the Loess Plateau, it is vital to manage the suitable areas of target species according to their environmental variables in order to increase the possibility of their successful cultivation [18]. In addition, the introduction of some species with good economic benefits can be considered to increase the income of the local people and increase the biodiversity of the Loess Plateau ecosystem. However, when selecting the species to be introduced, the interspecific relationships between the introduced and native species should be taken into consideration.
To ensure that the Loess Plateau’s ecosystems can fulfil their regional functions, it is necessary to adopt tailored and comprehensive methods for these fragile ecological areas [51]. Vegetation restoration in different regions may have different purposes. For species with stable environmental supply, such as mangroves in the southeast of China [18], areas of high suitability are the target sites for the establishment of protected areas. In contrast, vegetation restoration in the Loess Plateau aims not only to increase the diversity of the region but also to increase the income of the local people. Until the end of this century, for both M. pumila and P. armeniaca, the land use type with the largest suitable area should be converted from cropland to grassland. However, it should be noted that cropland, grassland, forests and mosaic areas still occupy more than 90% of the AMSH. When considering where to plant economic trees in the Loess Plateau, we should not restrict our selection to the potential areas with moderate and high suitability; in special cases, areas with low suitability could also be appropriate. Combined with the goal of the GGP—to conserve water and soil and increase biodiversity—it is feasible to cultivate economic forest trees in grassland with sufficient moisture, on roadsides in built-up areas and on croplands with steep slopes [24] and patch planting is recommended in forest and mosaic areas.

4.4. Model Application and Optimization in Predicting the Distribution of Species

In the present study, the Maxent model was used to predict the distribution of M. pumila and P. armeniaca under SSP1-26 and SSP5-85. Though Maxent showed high accuracy in the statistical methods, there are still some uncertainties. For Maxent, to avoid over-fitting, we rarefied the environmental factors. However, those environmental factors that were screened out may contain important information that affects the distribution of species [52]. Moreover, the application of the dynamic model to analyze the influence of individual factors will further improve the accuracy of the simulation. Thus, more rational algorithms are needed. In addition, the extensive collection of occurrence data and high-resolution maps [30] will further improve the robustness of species simulation.
In addition to the common environmental variables [53,54], we tried to incorporate land use and land cover into suitable habitats of economic trees to better understand the impact of climate change and provide a complement for better and more accurate decision-making. However, a long-term LUCC simulation may reduce the accuracy of the simulation, because LUCC is strongly affected by social factors, such as policy, in addition to climate change [28]. It was unclear whether we could simulate LUCC for the next 100 years with relative accuracy, so we used the same LUCC map for all three periods considered in the study. However, in order to obtain high-accuracy LUCC maps, more relevant factors (e.g., the road, elevation and location of the farmland protection zone) must be taken into account to improve the stability of species habitat simulation, which is necessary for future research.

5. Conclusions

This study investigated the geographical distribution of M. pumila and P. armeniaca on the Loess Plateau using the Maxent model in three periods (present, 2050s and 2090s) under two climate scenarios (SSP1-26 and SSP5-85). Bio6 was considered the dominant factor affecting the distribution of M. pumila and P. armeniaca. M. pumila showed greater sensitivity to elevation and temperature changes. Bio17 played a significant role in the distribution of P. armeniaca. Soil type had a greater effect on the distribution of P. armeniaca, while soil texture had a greater effect on M. pumila. The AMSH area of M. pumila is 8.7967 × 10⁴ km2 at present. By the 2090s, the AMSH area was predicted to increase to 18.3296 × 10⁴ km2 under SSP1-26 and decrease to 7.5957 × 10⁴ km2 under SSP5-85. The SSP5-85 results in a higher range shift in distance than the SSP2-26, for both M. pumila and P. armeniaca. The suitability of M. pumila decreases in the south and southeast and increase in the middle and western areas of the Loess Plateau. Climate change leads to northwest range shifts in M. pumila, with a distance range of 78.61 km to 190.63 km. Compared to the present area (11.4631 × 10⁴ km2), in the future, the AMSH area of P. armeniaca was predicted to increase in different degrees and will reach to 24.1556 × 10⁴ km2 in the 2090s under SSP1-26. The suitability of P. armeniaca remains constant in the middle and dramatically increases in the north and northwest. By the 2090s, the centroid of P. armeniaca will, respectively, shift by 64.77 km and 139.85 km under SSP1-26 and SSP5-85.

Supplementary Materials

The following are available online at https://www.mdpi.com/article/10.3390/f12060747/s1. Table S1: The reclassification of land use types, Table S2: The area (104 × km2) and area change rate (%) of Malus pumila Mill and Prunus armeniaca L.

Author Contributions

W.X. designed the study, drew the figures and tables and wrote the main body of the manuscript; J.J. supervision and analyzed the importance of factors; J.C. edited the draft, revised the manuscript, acquired the funding and revised the manuscript. All authors have read and agreed to the published version of the manuscript.

Funding

This research was supported by the Deployment Program of the Chinese Academy of Sciences (No. KJZD–EW–TZ–G10), the National Key Research and Development Program of China—Mechanisms of grassland degradation and the integrative demonstration of their ecological restoration technology in the agro-pastoral transitional zone of the northern China (No. 2016YFC0500700) and Key Research and Development Program of Shaanxi Province (No. 2021NY-006).

Acknowledgments

We acknowledge the groups of ArcGIS, MaxEnt, WorldClim, RESDC and FAO for their contribution in making this simulation possible. We thank Hanqi Liu, Bin Xia and Changwu Cheng for their advice and assistance in data processing. Runzhi Mao’s spiritual support is important for this study. Especially, the authors thank the anonymous reviewers for their excellent suggestions which have been particularly helpful in improving this paper.

Conflicts of Interest

The authors declare no conflict of interest.

References

  1. Li, J.; Fan, G.; He, Y. Predicting the current and future distribution of three Coptis herbs in China under climate change conditions, using the MaxEnt model and chemical analysis. Sci. Total Environ. 2020, 698, 134141. [Google Scholar] [CrossRef]
  2. Shi, S.; Yu, J.; Wang, F.; Wang, P.; Zhang, Y.; Jin, K. Quantitative contributions of climate change and human activities to vegetation changes over multiple time scales on the Loess Plateau. Sci. Total Environ. 2021, 755, 142419. [Google Scholar] [CrossRef] [PubMed]
  3. Xu, X.; Zhang, H.; Yue, J.; Xie, T.; Xu, Y.; Tian, Y. Predicting Shifts in the Suitable Climatic Distribution of Walnut (Juglans regia L.) in China: Maximum Entropy Model Paves the Way to Forest Management. Forests 2018, 9, 103. [Google Scholar] [CrossRef] [Green Version]
  4. Naeem, M.; Liu, M.; Huang, J.; Ding, G.; Potapov, G.; Jung, C.; An, J. Vulnerability of East Asian bumblebee species to future climate and land cover changes. Agric. Ecosyst. Environ. 2019, 277, 11–20. [Google Scholar] [CrossRef]
  5. Guisan, A.; Zimmermann, N.E. Predictive habitat distribution models in ecology. Ecol. Model. 2000, 135, 147–186. [Google Scholar] [CrossRef]
  6. Phillips, S.J.; Anderson, R.P.; Schapire, R.E. Maximum entropy modeling of species geographic distributions. Ecol. Model. 2006, 190, 231–259. [Google Scholar] [CrossRef] [Green Version]
  7. Abolmaali, S.M.-R.; Tarkesh, M.; Bashari, H. MaxEnt modeling for predicting suitable habitats and identifying the effects of climate change on a threatened species, Daphne mucronata, in central Iran. Ecol. Inform. 2018, 43, 116–123. [Google Scholar] [CrossRef]
  8. Halvorsen, R.; Mazzoni, S.; Dirksen, J.W.; Næsset, E.; Gobakken, T.; Ohlson, M. How important are choice of model selection method and spatial autocorrelation of presence data for distribution modelling by MaxEnt? Ecol. Model. 2016, 328, 108–118. [Google Scholar] [CrossRef]
  9. Zhang, X.; Li, G.; Du, S. Simulating the potential distribution of Elaeagnus angustifolia L. based on climatic constraints in China. Ecol. Eng. 2018, 113, 27–34. [Google Scholar] [CrossRef]
  10. Zhang, K.; Yao, L.; Meng, J.; Tao, J. Maxent modeling for predicting the potential geographical distribution of two peony species under climate change. Sci. Total. Environ. 2018, 634, 1326–1334. [Google Scholar] [CrossRef]
  11. Narouei-Khandan, H.A.; Worner, S.P.; Viljanen, S.L.H.; Bruggen, A.H.C.; Jones, E.E. Projecting the suitability of global and local habitats for myrtle rust ( Austropuccinia psidii ) using model consensus. Plant Pathol. 2019, 69, 17–27. [Google Scholar] [CrossRef]
  12. Ribeiro, M.M.; Roque, N.; Ribeiro, S.; Gavinhos, C.; Castanheira, I.; Quinta-Nova, L.; Albuquerque, T.; Gerassis, S. Bioclimatic modeling in the Last Glacial Maximum, Mid-Holocene and facing future climatic changes in the strawberry tree (Arbutus unedo L.). PLoS ONE 2019, 14, 0210062. [Google Scholar] [CrossRef] [PubMed] [Green Version]
  13. Elith, J.; Graham, C.H.; Anderson, R.P.; Dudík, M.; Ferrier, S.; Guisan, A.; Hijmans, R.J.; Huettmann, F.; Leathwick, J.R.; Lehmann, A.; et al. Novel methods improve prediction of species’ distributions from occurrence data. Ecography 2006, 29, 129–151. [Google Scholar] [CrossRef] [Green Version]
  14. Dudik, M. Maximum Entropy Density Estimation and Modeling Geographic Distributions of Species. In Dissertation Abstracts International; University Microfilms International: Ann Arbor, MI, USA, 2007. [Google Scholar]
  15. Guo, Y.; Li, X.; Zhao, Z.; Nawaz, Z. Predicting the impacts of climate change, soils and vegetation types on the geographic distribution of Polyporus umbellatus in China. Sci. Total Environ. 2019, 648, 1–11. [Google Scholar] [CrossRef]
  16. Liao, Z.; Zhang, L.; Nobis, M.P.; Wu, X.; Pan, K.; Wang, K.; Dakhil, M.A.; Du, M.; Xiong, Q.; Pandey, B.; et al. Climate change jointly with migration ability affect future range shifts of dominant fir species in Southwest China. Divers. Distrib. 2020, 26, 352–367. [Google Scholar] [CrossRef] [Green Version]
  17. Ma, B.; Sun, J. Predicting the distribution of Stipa purpurea across the Tibetan Plateau via the MaxEnt model. BMC Ecol. 2018, 18, 1–12. [Google Scholar] [CrossRef] [Green Version]
  18. Hu, W.; Wang, Y.; Dong, P.; Zhang, D.; Yu, W.; Ma, Z.; Chen, G.; Liu, Z.; Du, J.; Chen, B.; et al. Predicting potential mangrove distributions at the global northern distribution margin using an ecological niche model: Determining conservation and reforestation involvement. For. Ecol. Manag. 2020, 478, 118517. [Google Scholar] [CrossRef]
  19. Hu, X.; Wu, F.; Guo, W.; Liu, N. Identification of Potential Cultivation Region Fie Santalum Album in China by the Maxent Ecologic Niche Model. Sci. Silvae Sin. 2014, 50, 27–33. [Google Scholar]
  20. Kadar, N.; DeCherney, A.H.; Romero, R. Receiver operating characteristic (ROC) curve analysis of the relative efficacy of single and serial chorionic gonadotropin determinations in the early diagnosis of ectopic pregnancy. Fertil. Steril. 1982, 37, 542–547. [Google Scholar] [CrossRef]
  21. Papes, M.; Gaubert, P. Modelling ecological niches from low numbers of occurrences: Assessment of the conservation status of poorly known viverrids (Mammalia, Carnivora) across two continents. Divers. Distrib. 2007, 13, 890–902. [Google Scholar] [CrossRef]
  22. Yang, M.; Wang, S.; Zhao, X.; Gao, X.; Liu, S. Soil properties of apple orchards on China’s Loess Plateau. Sci. Total Environ. 2020, 723, 138041. [Google Scholar] [CrossRef]
  23. Fu, B.; Wang, S.; Liu, Y.; Liu, J.; Liang, W.; Miao, C. Hydrogeomorphic Ecosystem Responses to Natural and Anthropogenic Changes in the Loess Plateau of China. Annu. Rev. Earth Planet. Sci. 2017, 45, 223–243. [Google Scholar] [CrossRef]
  24. Liu, G.B. Soil Conservation and Sustainable Agriculture on the Loess Plateau: Challenges and Prospects. Ambio 1999, 28, 663–668. [Google Scholar]
  25. He, X.; Zhou, J.; Zhang, X.; Tang, K. Soil erosion response to climatic change and human activity during the Quaternary on the Loess Plateau, China. Reg. Environ. Chang. 2006, 6, 62–70. [Google Scholar] [CrossRef]
  26. Zhao, X.; Wu, P.; Gao, X.; Persaud, N. Soil Quality Indicators in Relation to Land Use and Topography in a Small Catchment on the Loess Plateau of China. Land Degrad. Dev. 2012, 26, 54–61. [Google Scholar] [CrossRef]
  27. Reed, M.; Stringer, L.; Dougill, A.; Perkins, J.; Atlhopheng, J.; Mulale, K.; Favretto, N. Reorienting land degradation towards sustainable land management: Linking sustainable livelihoods with ecosystem services in rangeland systems. J. Environ. Manag. 2015, 151, 472–485. [Google Scholar] [CrossRef] [Green Version]
  28. Zhang, Y.; Liu, X.; Chen, G.; Hu, G. Simulation of urban expansion based on cellular automata and maximum entropy model. Sci. China Earth Sci. 2020, 63, 701–712. [Google Scholar] [CrossRef]
  29. Vaughan, I.P.; Ormerod, S.J. The continuing challenges of testing species distribution models. J. Appl. Ecol. 2005, 42, 720–730. [Google Scholar] [CrossRef]
  30. Yu, F.; Wang, T.; Groen, T.A.; Skidmore, A.K.; Yang, X.; Ma, K.; Wu, Z. Climate and land use changes will degrade the distribution of Rhododendrons in China. Sci. Total Environ. 2019, 659, 515–528. [Google Scholar] [CrossRef]
  31. Rana, S.K.; Rana, H.K.; Ghimire, S.K.; Shrestha, K.K.; Ranjitkar, S. Predicting the impact of climate change on the distribution of two threatened Himalayan medicinal plants of Liliaceae in Nepal. J. Mt. Sci. 2017, 14, 558–570. [Google Scholar] [CrossRef]
  32. Xin, X.; Zhang, L.; Zhang, J.; Wu, T.; Fang, Y. Climate Change Projections over East Asia with BCC_CSM1.1 Climate Model under RCP Scenarios. J. Meteorol. Soc. Jpn. 2013, 91, 413–429. [Google Scholar] [CrossRef] [Green Version]
  33. Bracegirdle, T.J.; Krinner, G.; Tonelli, M.; Haumann, F.A.; Naughten, K.A.; Rackow, T.; Roach, L.A.; Wainer, I. Twenty first century changes in Antarctic and Southern Ocean surface climate in CMIP. Atmos. Sci. Lett. 2020, 21, e984. [Google Scholar] [CrossRef]
  34. O’Neill, B.C.; Tebaldi, C.; Van Vuuren, D.P.; Eyring, V.; Friedlingstein, P.; Hurtt, G.; Knutti, R.; Kriegler, E.; Lamarque, J.-F.; Lowe, J.; et al. The Scenario Model Intercomparison Project (ScenarioMIP) for CMIP. Geosci. Model. Dev. 2016, 9, 3461–3482. [Google Scholar] [CrossRef] [Green Version]
  35. Riahi, K.; Van Vuuren, D.P.; Kriegler, E.; Edmonds, J.; O’Neill, B.C.; Fujimori, S.; Bauer, N.; Calvin, K.V.; Dellink, R.B.; Fricko, O.; et al. The Shared Socioeconomic Pathways and their energy, land use, and greenhouse gas emissions implications: An overview. Glob. Environ. Chang. 2017, 42, 153–168. [Google Scholar] [CrossRef] [Green Version]
  36. Fick, S.E.; Hijmans, R.J. WorldClim 2: New 1-km spatial resolution climate surfaces for global land areas. Int. J. Climatol. 2017, 37, 4302–4315. [Google Scholar] [CrossRef]
  37. Graham, M.H. Confronting multicollinearity in ecological multiple regression. Ecology 2003, 84, 2809–2815. [Google Scholar] [CrossRef] [Green Version]
  38. Xu, W.; Sun, H.; Jin, J.; Cheng, J. Predicting the Potential Distribution of Apple Canker Pathogen (Valsa mali) in China under Climate Change. Forests 2020, 11, 1126. [Google Scholar] [CrossRef]
  39. Liu, C.; White, M.T.; Newell, G. Selecting thresholds for the prediction of species occurrence with presence-only data. J. Biogeogr. 2013, 40, 778–789. [Google Scholar] [CrossRef]
  40. Fu, G.Q.; Xu, X.Y.; Ma, J.P.; Xu, M.S.; Jiang, L.; Ding, A.Q. Responses of Haloxylon Ammodendron Potential Geographical Distribution to the Hydrothermal Conditions under Maxent Model. Pratacult. Sci. 2016, 33, 2173–2179. [Google Scholar]
  41. Sahu, N.; Saini, A.; Behera, S.K.; Sayama, T.; Sahu, L.; Nguyen, V.-T.-V.; Takara, K. Why apple orchards are shifting to the higher altitudes of the Himalayas? PLoS ONE 2020, 15, 0235041. [Google Scholar] [CrossRef]
  42. Rana, R.S.; Singh, M.; Pathania, R.; Upadhyay, S.K.; Kalia, V. Impact of Changes in Climatic Conditions on Temperate Fruit Production of Himachal Pradesh. MAUSAM 2017, 68, 655–662. [Google Scholar]
  43. Rai, R.; Joshi, S.; Roy, S.; Singh, O.; Samir, M.; Chandra, A. Implications of Changing Climate on Productivity of Temperate Fruit Crops with Special Reference to Apple. J. Hortic. 2015, 02. [Google Scholar] [CrossRef] [Green Version]
  44. Yang, J.; Duan, Y.; Wang, L.; Kang, D.; Awasthi, M.K.; Li, H.; Zhang, L. Seasonal variation of net ecosystem CO2 exchange and its influencing factors in an apple orchard in the Loess Plateau. Environ. Sci. Pollut. Res. 2020, 27, 43452–43465. [Google Scholar] [CrossRef] [PubMed]
  45. Lenoir, J.; Svenning, J.-C. Climate-Related Range Shifts—A Global Multidimensional Synthesis and New research Directions. Ecography 2015, 38, 15–28. [Google Scholar] [CrossRef]
  46. Cao, B.; Bai, C.; Xue, Y.; Yang, J.; Gao, P.; Liang, H.; Zhang, L.; Che, L.; Wang, J.; Xu, J.; et al. Wetlands rise and fall: Six endangered wetland species showed different patterns of habitat shift under future climate change. Sci. Total Environ. 2020, 731, 138518. [Google Scholar] [CrossRef]
  47. Zhang, J.; Nielsen, S.E.; Chen, Y.; Georges, D.; Qin, Y.; Wang, S.S.; Svenning, J.-C.; Thuiller, W. Extinction risk of North American seed plants elevated by climate and land-use change. J. Appl. Ecol. 2016, 54, 303–312. [Google Scholar] [CrossRef]
  48. Chen, I.-C.; Hill, J.K.; Ohlemüller, R.; Roy, D.; Thomas, C.D. Rapid Range Shifts of Species Associated with High Levels of Climate Warming. Science 2011, 333, 1024–1026. [Google Scholar] [CrossRef] [PubMed]
  49. Isbell, F.; Craven, D.; Connolly, J.; Loreau, M.; Schmid, B.; Beierkuhnlein, C.; Bezemer, T.M.; Bonin, C.; Bruelheide, H.; De Luca, E.; et al. Biodiversity increases the resistance of ecosystem productivity to climate extremes. Nat. Cell Biol. 2015, 526, 574–577. [Google Scholar] [CrossRef] [PubMed]
  50. Li, Q.; Babu, T.S.A.; Sieber, S.; Zander, P. Assessing divergent consequences of payments for ecosystem services on rural livelihoods: A case-study in China’s Loess Hills. Land Degrad. Dev. 2018, 29, 3549–3570. [Google Scholar] [CrossRef] [Green Version]
  51. Lee, S.Y.; Hamilton, S.; Barbier, E.B.; Primavera, J.; Lewis, R.R. Better restoration policies are needed to conserve mangrove ecosystems. Nat. Ecol. Evol. 2019, 3, 870–872. [Google Scholar] [CrossRef]
  52. Wang, S.; Xu, X.; Shrestha, N.; Zimmermann, N.E.; Tang, Z.; Wang, Z. Response of spatial vegetation distribution in China to climate changes since the Last Glacial Maximum (LGM). PLoS ONE 2017, 12, 0175742. [Google Scholar] [CrossRef] [PubMed] [Green Version]
  53. Cruz-Cárdenas, G.; López-Mata, L.; Villaseñor, J.L.; Ortiz, E. Potential Species Distribution Modeling and the Use of Principal Component Analysis as Predictor Variables. Rev. Mex. Biodivers. 2014, 85, 189–199. [Google Scholar] [CrossRef]
  54. Jiao, Y.; Zhao, D.; Ding, Y.; Liu, Y.; Xu, Q.; Qiu, Y.; Liu, C.; Liu, Z.; Zha, Z.; Li, R. Performance evaluation for four GIS-based models purposed to predict and map landslide susceptibility: A case study at a World Heritage site in Southwest China. Catena 2019, 183, 104221. [Google Scholar] [CrossRef]
Figure 1. Occurrence records of Malus pumila Mill. and Prunus armeniaca L. in China. Different colored dots represent the sites of species and yellow lines show the range of the study area, the Loess Plateau.
Forests 12 00747 g001
Figure 2. Contributions and importance of environmental factors in Maxent model. (A) Malus pumila Mill in 2050s, (B) M. pumila in 2090s, (C) Prunus armeniaca L. in 2050s, (D) P. armeniaca in 2090s.
Forests 12 00747 g002
Figure 3. The habitat range of Malus pumila Mill and Prunus armeniaca L. in the Loess Plateau under different climate scenarios.
Forests 12 00747 g003
Figure 4. Four suitable habitat areas in the Loess Plateau under different climate scenarios. (A) Malus pumilla Mill, (B) Prunus ameniaca L.
Forests 12 00747 g004
Figure 5. Increase and decrease maps of suitability for 2050s–present, 2090s–present and 2090s–2050s periods.
Forests 12 00747 g005
Figure 6. Suitable habitat centroids of Malus pumila Mill and Prunus armeniaca L. in present, 2050s and 2090s periods under the Shared Socioeconomic Pathways (SSPs) SSP1-26 and SSP5-85. (a) Yellow area shows the study area, the Loess Plateau, in relation to China. (b) Black box shows the locations of centroids in relation to the Loess Plateau. (c) The colored dots and squares correspond with the shape and color.
Forests 12 00747 g006
Figure 7. Proportions of land cover in the Loess Plateau under different climate scenarios. Species shaded in light green show the present condition, species shaded in light orange show the conditions of the Shared Socioeconomic Pathways (SSPs) SSP1-26 and species shaded in deep pink show the conditions of SSP5-85.
Forests 12 00747 g007
Table 1. Environmental variables used in predicting the potential distribution of Malus pumila Mill and Prunus armeniaca L.
CategoryVariableDescriptionUnit
Bioclimatic variablesbio1Annual Mean Temperature°C
Bio5max temperature of warmest month°C
Bio6Min Temperature of Coldest Month°C
bio12Annual Precipitationmm
bio16precipitation of wettest quartermm
bio17precipitation of driest quartermm
Topographic variablesaspectAspect
curvatureCurvature
elevationElevationm
slopeSlope°
Soil variablessandTexture of Soil
soilType of Soil
Publisher’s Note: MDPI stays neutral with regard to jurisdictional claims in published maps and institutional affiliations.