Abstract
To understand the mechanism of carbon release from the soil after clear-cutting, it is first necessary to understand the soil microbes, which are the decomposers of organic matter. The aim of this study was to obtain knowledge on the composition of the soil bacterial community in a Cryptomeria japonica plantation at different times after clear-cutting. We established three clear-cutting plots—CC1, CC2, and CC3—in March 2013, May 2017, and December 2017, respectively, and one unlogged plot (Control) in March 2013 in a 35–39-year-old C. japonica plantation in eastern Japan. We collected the soil in May and September 2018 and examined the soil bacterial community compositions of the plots at 5–9, 12–16, and 62–66 months after clear-cutting. The soil bacterial community composition at the phylum level showed a small difference between plots for CC1, CC2, CC3, and the Control. On the other hand, most of the taxa showed similar compositional ratios in the four plots, but some taxa, such as Proteobacteria and Acidobacteria, showed differences. Proteobacteria appeared more frequently in CC1, CC2, and CC3 than in the Control, indicating a longer period of high soil temperature due to clear-cutting. The frequency of Acidobacteria was significantly lower in CC1 and CC2 than in CC3 and the Control, which might be due to the lack of the organic layer (Ao) after clear-cutting.
1. Introduction
Climate change caused by increasing greenhouse gas concentrations in the atmosphere has become an important global environmental issue. The main greenhouse gas is carbon dioxide, and forests are one of the main carbon sinks. Of the total carbon stored in terrestrial ecosystems, the carbon stored in the soil is estimated to be 1500–2400 PgC, which is approximately twice that stored in the atmosphere and three times that stored in plants [1]. In addition, carbon stored in forest soils accounts for approximately 45% of the total soil [2]. Therefore, forest soil plays an important role as a carbon storage in the global carbon cycle.
The organic matter stored in forest soil is decomposed by various microbes, which releases carbon dioxide into the atmosphere. Although this heterotrophic respiration (Rh) is affected by various environmental factors, including soil temperature and soil moisture, it is especially promoted by a temperature increase [3,4,5,6]. Thus, global warming significantly increases the rate of Rh [7]. However, the decomposition response of soil organic matter (SOM) to environmental changes is not well understood, because SOM is composed of organic matter with different decomposition rates.
Koarashi et al. [8] reported that a soil organic carbon pool with a mean residence time (MRT) of less than 10 years is responsible for 73% of annual Rh. Without the supply of organic matter for the soil, Koarashi et al. [8] estimated that the Rh was reduced to less than half of initial levels in 1–2 years due to the decrease of SOM with short MRT using a model. However, the actual decomposition process of SOM in forests has been poorly studied at the field scale. Thus, we measured the Rh in the field for six years (2013–2018), using the experimental logging site of the Cryptomeria japonica plantation, and found that a significant reduction in Rh took more than six years following logging [9]. In addition, we confirmed increases in soil temperature from April to September and soil moisture content in the experimental logging site [9], but the soil carbon content of the surface soil (0–5 cm depth) in 2018 was not significantly different [9]. The time it took for Rh to decrease was a gap between the measured values and the model. To understand why Rh does not decrease even though soil temperature and soil moisture content change so quickly after clear-cutting, it is important to understand the bacteria, fungi, and microfauna that decompose soil organic matter, individually.
It has been suggested that changes in the soil environment associated with clear-cutting might have a significant impact on the composition of the soil microbial community [10,11,12]. Holden and Treseder [13] conducted meta-analyses based on 139 reported datasets of soil microbial responses to forest disturbances, suggesting that forest disturbance had a significant impact on the soil microbial communities and that clear-cutting significantly reduced soil bacterial abundance. Hartmann et al. [11] also conducted a metagenomic analyses using 306 soil samples and showed that deforestation had a significant impact on the composition of bacterial communities. On the other hand, in a report on a deciduous broad-leaved forest, most of the taxa showed similar composition ratios between the control and clear-cut sites, but some taxa showed differences after clear-cutting [14].
In this study, metagenomic analysis of soil bacteria was performed in clear-cutting sites of C. japonica plantations that have stopped supplying new SOM. It was then investigated whether the soil bacterial composition was changed by such treatment.
2. Materials and Methods
2.1. Site Description
The study site was a 35–39-year-old C. japonica plantation forest located within Tokyo University of Agriculture Okutama Forest (35°49′ N, 139°4′ E; 670–790 m asl) in Tokyo, Japan. The mean annual temperature and precipitation at the nearby AMeDAS station (Ogouchi; 35°47.5′ N, 139°3′ E; 530 m asl) from 2013 to 2018 were 12.6 °C and 1425.7 mm, respectively.
Three clear-cutting plots (CC1, CC2, and CC3) and a Control plot established in the C. japonica plantation were used for soil sampling (Figure 1). Each of the plot conditions before clear-cutting is shown in Table A1. Clear-cutting was conducted in March 2013, May 2017, and December 2017 at the plots CC1, CC2, and CC3, respectively. The cut trees were whole-tree harvested without dragging, to minimize surface soil disturbance. After clear-cutting, newly appeared grasses were constantly removed, and weeding was done twice a year. In addition, there was no grass in the study site before clear-cutting due to deer browsing. In 2018, the organic layer (Ao) layer was almost nonexistent in CC1 and CC2 but remained in CC3 and the Control.
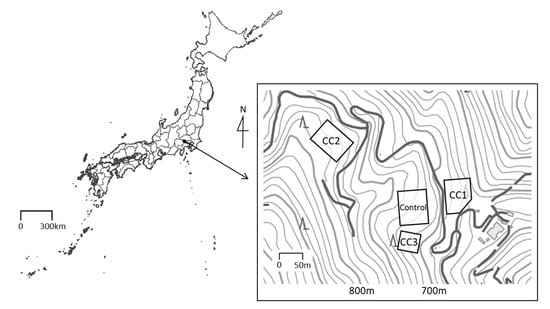
Figure 1.
Location of the study site and measurement plots. This map was processed and created based on the Digital Topographic Map published by Geospatial Information Authority of Japan [15].
2.2. Soil Sampling
Soil was collected in May and September 2018 using a soil auger. The elapsed times after clear-cutting in May and September 2018 were 62–66 months for CC1, 12–16 months for CC2, and 5–9 months for CC3. Nine soil sampling fixed points were set up in each plot. Soil samples at a depth of 0–10 cm were collected from three points around each fixed point and were thoroughly mixed. Soil samples obtained at three adjacent fixed points in each plot were mixed to form one sample, and three samples were collected each month from each plot. However, in CC2, a road was constructed to divide the plot above and below a slope when cut trees were carried out; therefore, only two samples were collected (those from above and below the slope). Thus, four total samples were collected each month in CC2.
2.3. DNA Extraction and Sequencing
DNA was extracted using ISOIL (NIPPON GENE CO., LTD., Tokyo, Japan) from each of the 26 soil samples. To confirm the extracted DNA, each sample was measured using a Qubit2.0 Fluorometer (Thermo Fisher Scientific, Waltham, MA, USA). To compare the 16S rRNA region, we created a primer (barcoded primer) with a 24 bp identification sequence (barcode) added to the 5′ end of each of the 27F (5′-AGAGTTTGATCMTGGCTCAG-3′) [16] and 1492R (5′-AGAGTTTGATCMTGGCTCAG-3′) [17]; polymerase chain reaction (PCR) amplification was performed using different barcoded primers for each sample. PCR amplifications were performed using MightyAmp DNA polymerase Ver. 3 (TAKARA BIO INC., Shiga, Japan), and the amplified products were purified using Agencourt AMPure XP (Beckman Coulter, Brea, CA, USA). The purified products were measured using a Qubit2.0 Fluorometer. Each 16S rRNA sample was adjusted to 40–60 ng μL−1, mixed, and then used as a library; the mean concentration of the 26 samples of the 16S rRNA region was 47.5 ± 25.1 ng μL−1 (ranging from 6.5 to 101.0 ng μL−1). Library sequencing was carried out using a MinION (Oxford Nanopore Technologies, Oxford, UK) and Ligation Sequencing Kit (SQK-LSK109; Oxford Nanopore Technologies, Oxford, UK).
2.4. Data Analysis
The FASTA file of primers was created based on the sequence of the barcoded primer, and a BLAST (ver.2.6.0+) database was created using the makeblastdb program. The reads obtained from the nanopores were executed by specifying “-word_size 4” in the blastn program, and regions homologous to the primers were searched. The results of the blastn program were processed with an in-house script. Only hits that were aligned with a length of 90% or more of the primer sequence were used, and each read was classified using the primer names of the top hits on the forward and reverse sides.
For 16S rRNA analysis, the metagenomics ~ silva_SSU+LSU pipeline of the Portable Pipeline (v. 0.9c) was used to estimate the taxa most applicable to each read. The option “-t 0.995” was specified. In this study, we decided to treat the estimated taxa as an operational taxonomic unit (OTU) by comparing plots at the phylum level. To examine the change in the bacterial community composition in each plot, we visualized soil bacterial community compositions by non-metric multidimensional scaling (NMDS) using the vegan package in R software version 4.0.1 [18]. Hierarchical clustering was performed with the pvclust package in R software version 4.0.1 [18]. A sample with 4000 leads or more was used for NMDS and hierarchical clustering. A significance test for the survey section was performed using Tukey’s HSD test in R software version 4.0.1 [18].
3. Results
3.1. Soil Bacterial Community Composition
After quality control and primer trimming, 257,366 sequence reads were obtained from the 16S regions of the 26 soil samples. The sequencing reads identified a total number of 2482 OTUs, with the number of OTUs obtained in each plot being 1686, 1511, 1593, and 1136 for CC1, CC2, CC3, and the Control, respectively (Table 1). OTU, identified at the phylum level, constituted over 96% of all plots. The β-diversity of the Shannon diversity indices was 1.1, showing low values. The non-metric multidimensional scaling (NMDS) and hierarchical clustering analyses confirmed that the distances between the samples was close (Figure 2); therefore, it was considered that the differences among the plots were small.

Table 1.
Numbers of reads, operational taxonomic units (OTUs), and phyla on clear-cutting plots (CC1, CC2, and CC3) and the Control. The taxa estimated at the phylum level were treated as OTUs.
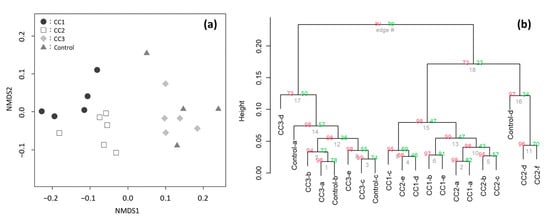
Figure 2.
(a) The non-metric multidimensional scaling (NMDS) analyses of the soil bacterial community compositions in clear-cutting plots (CC1, CC2, and CC3) and the Control plot. (b) The hierarchical clustering according to the group average method. Near nodes au and bp p-values, the number of replications based on the bootstrap is 1000. A sample with 4000 leads or more was used for the both analyses.
3.2. Comparison of Bacterial Composition at Different Times after Clear-Cutting
From the analysis of the 16S region, Proteobacteria were the most common phylum in all plots, occupying ~40% of the total phyla composition (Figure 3). In addition, Proteobacteria tended to appear more frequently in CC1, CC2, and CC3 than in the Control. The next most common bacteria were Acidobacteria, which were significantly lower in CC1 and CC2 than in CC3 and the Control (p < 0.05). Proteobacteria were divided into Alphaproteobacteria, Deltaproteobacteria, and Gammaproteobacteria (Figure 4). There were no significant differences among the plots for Alphaproteobacteria and Gammaproteobacteria. However, the proportion of Deltaproteobacteria was highest in CC1 and was significantly higher in CC1 than in CC3 and the Control (Figure 4).
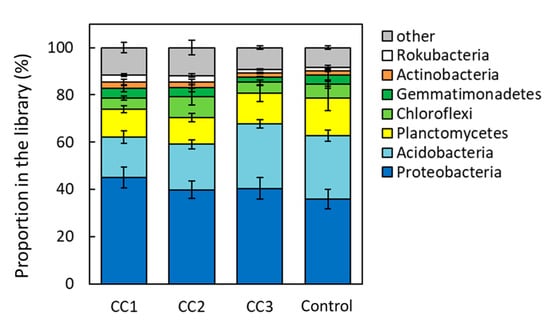
Figure 3.
Composition of the soil bacterial communities of clear-cutting plots (CC1, CC2, and CC3) and the Control plot. Error bars show calculated standard deviations of each plot sample, including CC1, CC2, and the Control (n = 6) and CC3 (n = 8).
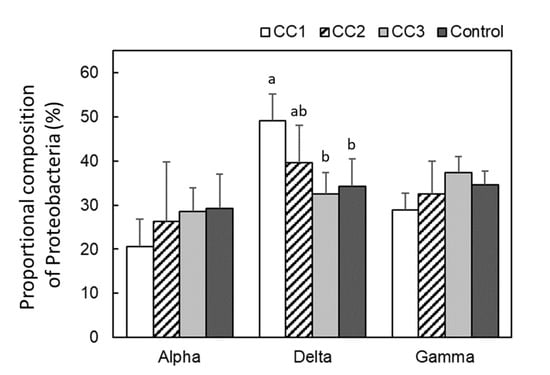
Figure 4.
Proteobacterial compositions of each plot. Error bars show calculated standard deviations of each plot sample, including CC1, CC2, and the Control (n = 6) and CC3 (n = 8). Different letters (a and b) indicate significant differences between plots (Tukey’s HSD, p < 0.05).
4. Discussion
The results of NMDS analyses and hierarchical clustering showed that the compositions of the soil bacterial communities were slightly close between CC1 and CC2 and between CC3 and the Control (Figure 2), but soil bacterial community compositions had low β-diversity (Shannon diversity index = 1.1), indicating that the change in soil bacterial community composition due to clear-cutting was limited in the C. japonica plantation.
In this study, Proteobacteria and Acidobacteria were the most common phyla, accounting for ~60% of the total phyla composition (Figure 3). Proteobacteria and Acidobacteria are environmentally widespread phyla of bacteria and are abundant in soils [19,20]. Proteobacteria appeared more frequently in CC1, CC2, and CC3 than in the Control. Of these, Deltaproteobacteria was the most common class in CC1 and increased proportionately with time after clear-cutting (Figure 4). Deltaproteobacteria have been reported to live in high-temperature environments [21]. In this study site, the soil temperature from April to September was often higher in CC1 than in the Control [9]. It has been suggested that changes in the soil environment might have a significant impact on the composition of the bacterial and fungal communities [10,11,12] and that due to disturbance by logging, the diversity and structure of these species remains highly altered for more than 10 years after logging [10]. A report investigating soil microbial community composition and temperature by incubation experiments suggested that elevated soil temperature alters the composition of the soil microbial community [22], and the microbial biomass decreases [23]. The periods of high soil temperature from the time of clear-cutting to soil sampling were 33–36, 8–12, and 2–6 months for CC1, CC2, and CC3, respectively. Thus, the length of the period of high soil temperature might have affected the appearance of Deltaproteobacteria. The appearance of Acidobacteria was significantly lower in CC1 and CC2 than in CC3 and the Control (Figure 3). Acidobacteria is able to decompose litter, especially polysaccharides (including cellulose) [24,25]. The Ao layer at the time of sample collection had almost disappeared in CC1 and CC2 but remained in CC3 and the Control (Table A1). This could have affected the appearance rate of Acidobacteria.
The soil bacterial composition of site CC3 and the Control was similar (Figure 2). Organic matter on the ground surface has been reported to have a moderating effect on changes in soil microbial community composition [26]. Since the Ao layer remained both in CC3 and the Control, this might have resulted in the similarity. The result was that the soil bacterial composition of sites CC1 and CC2 was close (Figure 2), although the geographical distance between them was large (Figure 1). In these two plots, more than one year had passed after clear-cutting, and the Ao layer had already disappeared at the time of soil sampling. Considering that CC3 (little time after clear-cutting) and the Control (no clear-cutting) were similar, sites CC1 and CC2 may be slightly different from the other two sites because of the different elapsed time after clear-cutting. In addition, sites CC1 and CC2 were geographically slightly separated from sites CC3 and the Control. Therefore, there is a possibility that the difference in location had an effect on the differences among the sites; it is necessary to clarify this in the future.
These results indicate that the soil bacterial community had a similar composition in all the study areas, with different times elapsed after clear-cutting of C. japonica plantations. However, some phyla, such as Proteobacteria and Acidobacteria, showed differences among the study plots. On the other hand, the soil bacterial community may be adaptive or resilient to deforestation and clear-cutting [14,27]. Furthermore, Carini et al. [28] suggested that relic DNA remaining in the soil could obscure the relationship between microbial taxa and environmental conditions. Differences in soil bacterial community composition at different elapsed times after clear-cutting were limited, but it is unclear what this result indicates; e.g., soil bacteria were not affected by clear-cutting, adapted after being affected by clear-cutting, or were overestimated by relic DNA. Therefore, the cause of this limited change in the bacterial community needs to be clarified. In this study, we focused only on the soil bacterial community, but it has been reported that fungal and bacterial responses to disturbances mirror the response of the microbial community as a whole [13]; therefore, soil organisms other than bacteria need to be considered in the future to understand the mechanism of organic matter decomposition.
Author Contributions
Conceptualization, Y.A.; methodology, Y.A., H.K. and K.Y.; software, K.Y. and S.A.; formal analysis, Y.A., H.K. and K.Y.; investigation, Y.A.; data curation, Y.A. and R.Y.; writing—original draft preparation, Y.A.; writing—review and editing, H.K. and T.T.; visualization, Y.A.; supervision, T.T. All authors have read and agreed to the published version of the manuscript.
Funding
This research received no external funding.
Data Availability Statement
The original data of the metagenomic analysis used in this study is stored in the drive by the corresponding author (Y.A.), so please contact Y.A. if you would like to view it.
Acknowledgments
We would like to thank all the members of Tokyo University of Agriculture Okutama Forest for their help in this research, especially the late Izumi Sugawara.
Conflicts of Interest
The authors declare no conflict of interest.
Appendix A
Table A1.
Basic information on the clear-cutting plots (CC1, CC2, and CC3) and the Control.
Table A1.
Basic information on the clear-cutting plots (CC1, CC2, and CC3) and the Control.
| Plot | Elevation | Area | Tree Age | Stem Density | Mean DBH | Measurement (*1) | Clear-Cutting (*2) | Ao Layer (*3) |
|---|---|---|---|---|---|---|---|---|
| (m) | (ha) | (y) | (tree ha−1) | (cm) | ||||
| CC1 | 680 | 0.23 | 35 | 1040 | 25.0 | March 2013 | March 2013 | Almost disappeared |
| CC2 | 780 | 0.18 | 39 | 806 | 29.0 | May 2017 | May 2017 | Almost disappeared |
| CC3 | 710 | 0.04 | 38 | 1800 | 23.0 | September 2016 | December 2017 | Remaining |
| Control | 725 | 0.24 | 35 | 1156 | 25.6 | March 2013 | - | Remaining |
*1: Year and month when information on Elevation, Area, Tree age, Stem density, and Mean diameter at breast height (DBH) was obtained. *2: Year and month of Clear-cutting. *3: State of Ao Layer when soil sample was taken.
References
- IPCC. Climate Change 2013. The Physical Science Basis; Cambridge University Press: Cambridge, UK, 2013. [Google Scholar]
- IPCC. Climate Change 2001. The Scientific Basis; Cambridge University Press: Cambridge, UK, 2001. [Google Scholar]
- Karhu, K.; Auffret, M.D.; Dungait, J.A.J.; Hopkins, D.W.; Prosser, J.I.; Singh, B.K.; Subke, J.A.; Wookey, P.A.; Agren, G.I.; Sebastià, M.T.; et al. Temperature sensitivity of soil respiration rates enhanced by microbial community response. Nature 2014, 513, 81–84. [Google Scholar] [CrossRef] [PubMed]
- Lloyd, J.; Taylor, J.A. On the temperature dependence of soil respiration. Funct. Ecol. 1994, 8, 315–323. [Google Scholar] [CrossRef]
- Fang, C.; Moncrieff, J.B. The dependence of soil CO2 efflux on temperature. Soil Biol. Biochem. 2001, 33, 155–165. [Google Scholar] [CrossRef]
- Davidson, E.A.; Janssens, I.A. Temperature sensitivity of soil carbon decomposition and feedbacks to climate change. Nature 2006, 440, 165–173. [Google Scholar] [CrossRef] [PubMed]
- Cox, P.M.; Betts, R.A.; Jones, C.D.; Spall, S.A.; Totterdell, I.J. Acceleration of global warming due to carbon-cycle feedbacks in a coupled climate model. Nature 2000, 408, 184–187. [Google Scholar] [CrossRef] [PubMed]
- Koarashi, J.; Atarashi-Andoh, M.; Ishizuka, S.; Miura, S.; Saito, T.; Hirai, K. Quantitative aspects of heterogeneity in soil organic matter dynamics in a cool-temperate Japanese beech forest: A radiocarbon-based approach. Glob. Chang. Biol. 2009, 15, 631–642. [Google Scholar] [CrossRef]
- Abe, Y.; Hashimoto, S.; Kurokochi, H.; Teramoto, M.; Sugawara, I.; Liang, N.; Tange, T. Six-year change of heterotrophic respiration rate in a clear-cutting site of Cryptomeria japonica plantation. Jpn. J. For. Environ. 2020, 62, 29–37, (In Japanese with English Summary). [Google Scholar]
- Jones, M.D.; Durall, D.M.; Cairney, J.W.G. Ectomycorrhizal fungal communities in young forest stands regenerating after clearcut logging. New Phytol. 2003, 157, 399–422. [Google Scholar] [CrossRef]
- Hartmann, M.; Howes, C.G.; Vaninsberghe, D.; Yu, H.; Bachar, D.; Christen, R.; Henrik Nilsson, R.; Hallam, S.J.; Mohn, W.W. Significant and persistent impact of timber harvesting on soil microbial communities in Northern coniferous forests. ISME J. 2012, 6, 2199–2218. [Google Scholar] [CrossRef] [PubMed]
- Zhang, X.; Liu, S.; Li, X.; Wang, J.; Ding, Q.; Wang, H.; Tian, C.; Yao, M.; An, J.; Huang, Y. Changes of soil prokaryotic communities after clear-cutting in a karst forest: Evidences for cutting-based disturbance promoting deterministic processes. FEMS Microbiol. Ecol. 2016, 92, fiw026. [Google Scholar] [CrossRef] [PubMed]
- Holden, S.R.; Treseder, K.K. A meta-analysis of soil microbial biomass responses to forest disturbances. Front. Microbiol. 2013, 4, 1–17. [Google Scholar] [CrossRef] [PubMed]
- Lee, B.J.; Eo, S.H. Comparison of soil bacterial diversity and community composition between clear-cut logging and control sites in a temperate deciduous broad-leaved forest in Mt. Sambong, South Korea. J. For. Res. 2020, 31, 2367–2375. [Google Scholar] [CrossRef]
- Geospatial Information Authority of Japan. Digital Topographic Map. 2021. Available online: https://maps.gsi.go.jp/ (accessed on 20 May 2021).
- Lane, D.J. 16S/23S rRNA sequencing. In Nucleic Acid Techniques in Bacterial Systematics; Stackebrandt, E., Goodfellow, M., Eds.; John Wiley & Sons: New York, NY, USA, 1991; pp. 125–175. [Google Scholar]
- Turner, S.; Pryer, K.M.; Miao, V.P.; Palmer, J.D. Investigating deep phylogenetic relationships among cyanobacteria and plastids by small subunit rRNA sequence analysis. J. Eukuryot. Mtrrohiol. 1999, 46, 327–338. [Google Scholar] [CrossRef] [PubMed]
- R Core Team. R: A Language and Environment for Statistical Computing; R Foundation for Statistical Computing: Vienna, Austria, 2020; Available online: https://www.R-project.org/ (accessed on 8 April 2021).
- Barns, S.M.; Takala, S.L.; Kuske, C.R. Wide Distribution and Diversity of Members of the Bacterial Kingdom Acidobacterium in the Environment. Appl. Environ. Microbiol. 1999, 65, 1731–1737. [Google Scholar] [CrossRef] [PubMed]
- Janssen, P.H. Identifying the dominant soil bacterial taxa in libraries of 16S rRNA and 16S rRNA genes. Appl. Environ. Microbiol. 2006, 72, 1719–1728. [Google Scholar] [CrossRef]
- Iizuka, T.; Tokura, M.; Jojima, Y.; Hiraishi, A.; Yamanaka, S.; Fudou, R. Enrichment and Phylogenetic Analysis of Moderately Thermophilic Myxobacteria from Hot Springs in Japan. Microbes Environ. 2006, 21, 189–199. [Google Scholar] [CrossRef][Green Version]
- Zogg, G.P.; Zak, D.R.; Ringelberg, D.B.; White, D.C.; MacDonald, N.W.; Pregitzer, K.S. Compositional and Functional Shifts in Microbial Communities Due to Soil Warming. Soil Sci. Soc. Am. J. 1997, 61, 475. [Google Scholar] [CrossRef]
- Wu, Y.; Yu, X.; Wang, H.; Ding, N.; Xu, J. Does history matter? temperature effects on soil microbial biomass and community structure based on the phospholipids fatty acid (PLFA) analysis. J. Soils Sediments 2010, 10, 223–230. [Google Scholar] [CrossRef]
- Štursová, M.; Žifčáková, L.; Leigh, M.B.; Burgess, R.; Baldrian, P. Cellulose utilization in forest litter and soil: Identification of bacterial and fungal decomposers. FEMS Microbiol. Ecol. 2012, 80, 735–746. [Google Scholar] [CrossRef]
- Ward, N.L.; Challacombe, J.F.; Janssen, P.H.; Henrissat, B.; Coutinho, P.M.; Wu, M.; Xie, G.; Haft, D.H.; Sait, M.; Badger, J.; et al. Three genomes from the phylum Acidobacteria provide insight into the lifestyles of these microorganisms in soils. Appl. Environ. Microbiol. 2009, 75, 2046–2056. [Google Scholar] [CrossRef]
- Wilhelm, R.C.; Cardenas, E.; Maas, K.R.; Leung, H.; McNeil, L.; Berch, S.; Chapman, W.; Hope, G.; Kranabetter, J.M.; Dubé, S.; et al. Biogeography and organic matter removal shape long-term effects of timber harvesting on forest soil microbial communities. ISME J. 2017, 11, 2552–2568. [Google Scholar] [CrossRef] [PubMed]
- Navarrete, A.A.; Tsai, S.M.; Mendes, L.W.; Faust, K.; De Hollander, M.; Cassman, N.A.; Raes, J.; Van Veen, J.A.; Kuramae, E.E. Soil microbiome responses to the short-term effects of Amazonian deforestation. Mol. Ecol. 2015, 24, 2433–2448. [Google Scholar] [CrossRef] [PubMed]
- Carini, P.; Marsden, P.; Leff, J.; Morgan, E.; Strickland, M.; Fierer, N. Relic DNA is abundant in soil and obscures estimates of soil microbial diversity. Nat. Microbiol. 2017, 16242, 043372. [Google Scholar] [CrossRef] [PubMed]
Publisher’s Note: MDPI stays neutral with regard to jurisdictional claims in published maps and institutional affiliations. |
© 2021 by the authors. Licensee MDPI, Basel, Switzerland. This article is an open access article distributed under the terms and conditions of the Creative Commons Attribution (CC BY) license (https://creativecommons.org/licenses/by/4.0/).