Article

Soil Respiration Variation among Four Tree Species at Young Afforested Sites under the Influence of Frequent Typhoon Occurrences

The Experimental Forest, College of Bio-Resources and Agriculture, National Taiwan University, Nantou 55750, Taiwan
*
Author to whom correspondence should be addressed.
Forests 2021, 12(6), 787; https://doi.org/10.3390/f12060787
Submission received: 30 April 2021 / Revised: 7 June 2021 / Accepted: 11 June 2021 / Published: 15 June 2021
(This article belongs to the Special Issue Soil Respiration and Carbon Stocks in Tropical Forests)

Abstract

:
Afforestation is an effective solution for restoring forest ecosystems and mitigating climate change in the tropics. In this study, we analyzed the soil respiration (Rs) at four afforested sites with different tree species exposed to a monsoon climate with frequent typhoon occurrences in southern Taiwan. The aim of this study is to examine (1) the distinct seasonal variation that strongly affects the Rs among four tree species at afforested sites, (2) the patterns of Rs that differ among the four species at the afforested sites, and (3) the influence of typhoons on forest structure and consequently the degree of Rs. The annual mean Rs among the four tree species at the afforested sites in the pretyphoon disturbance year was approximately 7.65 t C ha−1, with the post-typhoon year having an annual mean Rs of approximately 9.13 t C ha−1. Our results clearly show Rs variations in the four tree species at the young afforested sites under the influence of typhoon disturbances. The high seasonal variations in Rs were controlled by soil temperature and soil moisture. The different tree species also led to variations in litterfall production and consequently influenced Rs variation. Forest structures, such as aboveground biomass and consequently the degree of Rs, were disturbed by severe typhoon impacts in 2016, resulting in high aboveground biomass with tree height losses and litterfall accumulation. Furthermore, Rs increased immediately after litterfall input to the soil, and the addition effect of litter and the soil C release occurred throughout the year after typhoon disturbances. Our results contribute to understanding impact of typhoon disturbances on the degree of Rs at tropical afforested sites.

1. Introduction

Forest ecosystems serve as carbon sinks for the atmosphere and impact the global carbon cycle [1]. Deforestation is the second largest anthropogenic source of carbon in the world [2]. Deforestation generally leads to continuous carbon losses and is a driver affecting global climate change. In contrast, alleviating forest degradation and increasing afforestation are some of the main keys to mitigating carbon emissions and climate change. Afforestation has been demonstrated to be an effective solution for restoring forest ecosystems, reducing carbon emissions, and limiting climate change [3,4], especially in tropical regions, where climate conditions are suitable for carbon sequestration and plant growth [3,5,6]. The area of afforestation globally has increased at an annual rate of approximately 4.4 million ha, and 46% of the total afforested area in the world occurs in Asia [7,8]. However, the afforestation growth process is controlled by climate status, and climate change may cause a decrease in the carbon uptake rate and an increase in soil CO2 emissions, especially in the Asian monsoon region.
Autotropic respiration and heterotrophic respiration contribute to soil respiration (Rs), and in terrestrial ecosystems Rs reaches 66–100 Pg C y−1 [9,10,11] and is one of the largest carbon flux components. Of the total ecosystem respiration in forests, 60–90% is Rs [12]. It is well-documented that soil temperature and soil moisture are the dominant factors controlling Rs and thus are well-modeled by empirical functions [13,14,15,16,17,18,19]. Vegetation in a forest also controls Rs through its effect on litter quality and quantity, root exudates and biomass, the microbial community, and surface soil temperature [20,21,22,23,24]. Changing tree species composition during afforestation processes may also affect the microbial community and thus affect the decomposition of litter and soil organic matter and soil CO2 production [21,25,26]. The role that changing tree species composition plays in soil CO2 emissions is unclear, especially in terms of afforestation in the Asian monsoon region. A number of recent studies reported that several key factors influence CO2 release via changes in Rs after afforestation [16,27]. Therefore, the study of influence magnitudes of afforestation on Rs should receive more attention in the Asian monsoon region.
Extreme climate events (such as typhoons, tropical cyclones, or hurricanes) are major terrestrial disturbances globally and are known to affect forest structure, dynamics and function [28,29,30]. Extreme climate events such as typhoons alter the patterns of seasonal precipitation, especially in monsoon regions [31], but the scientific understanding of the impact of typhoons on the carbon cycle is still obscure [32]. Typhoons often lead to a large quantity of deposits of green and immature leaves [33,34], and in comparison to natural forests, afforested areas can be more vulnerable to typhoon disturbances [35]. Climate change intensifies typhoon damage to afforested areas and thereby affects Rs. It is necessary to be able to forecast Rs and its relationship with climate change. However, using the increase in the intensity and/or frequency of extreme climate events based on climate change to estimate and predict the soil CO2 emissions from afforested areas is difficult. Therefore, long-term Rs monitoring is necessary to clarify how the tree species affect variation of Rs at afforested sites. In this study, we examined patterns of Rs variation for four tree species at young afforested sites on a tropical deciduous plantation in southern Taiwan. Taiwan is hit by typhoons at a rate of approximately three per year, and these typhoons also bring high rainfall amounts [36]. Soil moisture is high during the typhoon season, especially in forest ecosystems that receive high amounts of rainfall. Performing field studies in young, tropical afforested areas is challenging because of typhoon disturbances and high amounts of rainfall, which makes quantifying the values of Rs difficult. We tested the following three alternate hypotheses: (1) distinct seasonal variation strongly affects Rs among the four tree species at the afforested sites, (2) patterns of Rs differ among the four tree species at the afforested sites, and (3) typhoons influence forest structure and consequently Rs amounts. The results have important management implications regarding forest carbon budgets for not only the sites in this study but also for young afforested areas in the Asian monsoon region.

2. Materials and Methods

2.1. Site Description

The research site is a tropical deciduous plantation in southern Taiwan (22°31′ N, 120°36′ E, 71 m above sea level). The study area used to be sugar cane farms in the early 1900s [37] and was cultivated until the 2000s. The sugar cane farms were abandoned (approximately 291 ha) and afforested from 2002–2005 to reduce the net emissions of greenhouse gases such as CO2 into the atmosphere. Fourteen tree species (Cinnamomum osmophloeum Kanehira, Terminalia catappa Linn., Pongamia pinnata (L.) Pierre, Fraxinus formosana Hayata, Pterocarpus indicus Willd., Cassia fistula Linn., Melia azedarach Linn., Bischofia javanica Blume., Swietenia macrophylla King, Sapindus mukorossi Gaertner, Liquidambar formosana Hance, Zelkova serrata Thunb., Cinnamomum camphora (L.) presl, and Calophyllum inophyllum L.) were planted in a mixed manner in the study area [38], and the initial planted tree density was 1500 trees per ha. To assess CO2 sequestration of the afforested plantation, eddy covariance measurements were set up in the center of the study area within a subarea of 100 ha [39]. Mahogany (Swietenia macrophylla King), Indian almond (Terminalia catappa Linn.), rose wood (Pterocarpus indicus Willd.), and China berry (Melia azedarach Linn.) were selected as forest types for this study. The study plots were located 0.5–0.75 km apart, and all plot sizes were 6.25 ha. In each plot, four circular subplots (radius 7.2 m) with four replicates were spaced 36.6 m apart in a triangular arrangement, with one subplot in the center. The study area has a Southeast Asian monsoon climate with on average three typhoon disturbances per year [36]. Taiwan experienced two typhoons in 2015 (Typhoon Soudelor in July, and Typhoon Dujuan in September) and two in 2017 (Typhoon Nesat in Julu, and Typhoon Haitang), but these typhoons were far away our study area. However, there were 3 typhoons that passed close to the study area in 2016 (Typhoon Megi in March, typhoon Nepartak in April, and typhoon Meranti in July), but only the strongest typhoon, Meranti, directly hit forests in 2016. Therefore, to distinguish the impact of typhoon disturbance, we defined the strongest typhoon disturbance in 2016 as typhoon disturbance year, 2015 as pre-typhoon disturbance year and 2017 as post-typhoon disturbance year.
Daily air temperature exhibited a typical seasonal pattern with a range of 14.4–30.4 °C and peaks in July (Figure 1a). In general, high-intensity rainfall events generally occurred from April to September and were equal to 90% of the annual rainfall (Figure 1b). The mean annual rainfall was 2833 mm and showed high seasonal variation from 2015 to 2017, with the highest amount of 4927 mm in 2016, which increased 73.9% compared to the mean rainfall in 2015–2017 (Figure 1b). The highest annual rainfall in 2016 was due to Typhoon Nepartak (category 3) in July and Typhoon Meranti (category 5) in September passing through southern Taiwan. Specifically, compared to other years, in 2015 a lower rainfall amount occurred in the growing season (January to May). The soil in the study site is classified as hyperthermic Udorthent and is over 60% gravel due to the alluvial effect. The soil pH is 5.5 with low base cations. The soil texture is loam with 50% sand, 31% silt and 19% clay. The topography of the study site is relatively homogeneous, with an average slope above 5°.

2.2. Plot Inventory

Tree biometrics were measured from 2015 to 2017. Tree diameters at breast height (DBHs) of 1 cm and larger were measured with diameter tape, and tree height (TH) was measured with a laser hypsometer (Haglof Vertex III, Långsele, Sweden). The measurements of DBH and TH were obtained in late December each year. Litterfall was collected and measured each month from 2015 to 2017 using the litterfall trap method. Litterfall traps (1 m × 1 m) were placed 1 m above the ground in the center of each circular subplot, collected monthly, and then weighed after being oven-dried at 70 °C for 72 h.

2.3. Soil Respiration Measurement

Before the Rs measurement, a soil collar (PVC, 10 cm inside diameter, 9 cm in height) was set in the center of each subplot and inserted 6 cm into the soil with 3 cm left above the soil surface in late 2014. All living plants in the collars were carefully trimmed regularly from the soil surface to exclude aboveground plant respiration. From 2015–2017, each plot’s Rs was measured once per month on clear days between 8:00 and 16:00 with an LI-8100 (LI-COR Inc., Lincoln, NE, USA) equipped with a 10 cm survey chamber. Each measurement took 150 s, and the linear increase in the CO2 concentration in the chamber was used to estimate Rs. Each Rs was measured in triplicate to minimize the variation. The mean Rs for each plot was calculated from the four subplots. The soil temperature at a depth of 5 cm was measured adjacent to each collar using a copper thermocouple penetration probe (LI6000-09 TC, LI-COR Inc., Lincoln, NE, USA) connected to the LI-8100. A volumetric soil moisture sensor (Decagon EC-5, METER Group, Inc., WA, USA) at a depth of 10 cm adjacent to each collar was connected to the LI-8100 to measure soil moisture.

2.4. Data Analysis

Each set of monthly measurements was averaged over the four subplots, and nonlinear regression analyses were performed to investigate the relationship between Rs and abiotic, biotic, and stand structural factors.
The relationship between Rs and soil temperature was calculated as follows:
Rs = VP RST δ C δ t ,
where Rs is the soil respiration (μmol m−2 s−1); V is the chamber volume (m3); P is the atmospheric pressure (Pa); R is the ideal gas constant (8.314 Pa m3 K−1 mol−1); S is the soil surface area in the chamber (m2); T is the air temperature in the chamber (K); and δC/δt is the slope of the CO2 ratio (μmol mol−1 s−1). The chamber volume and soil surface area were 854.2 cm3 and 83.7 cm2, respectively. For the analysis of the influence of the soil temperature on Rs, the equation was transformed as follows [40]:
Rs = a × e ( b × T soil ) ,
where Tsoil is the soil temperature at a depth of 5 cm, a is Rs at 0 °C, and b is the temperature constant and is used to calculate the temperature sensitivity index.
The increase in Rs with a 10 °C increase in soil temperature was used to describe the temperature sensitivity of Rs as follows:
Q 10 = e ( 10 × b ) ,
where b is the temperature constant from Equation (2).

2.5. Statistical Analysis

The one-way analysis of variance (ANOVA) was performed on the data, and the significant differences between the treatment means were calculated by Tukey’s multiple range test with p < 0.05 probability levels and were compared by descriptive statistics (±SD).
All statistical analyses were performed using SigmaPlot 14.0 software (Systat Software Inc., San Jose, CA, USA).

3. Results

3.1. Change in the Inventory of the Four Tree Species before and after Typhoon Disturbances

Interannual variations in tree height, DBH, aboveground biomass, and litterfall from 2015 to 2017 for different tree species are shown in Figure 2. The tree height of mahogany was significantly higher than all other tree species only in 2015 (p < 0.05, Figure 2a), while China berry tree heights were significantly lower than the other study species across all the years. The DBH values of China berry were lower than all other species for all study years but the difference was only significant in 2015 (p < 0.05, Figure 2b). The estimated aboveground biomass of mahogany showed the significantly lowest value in 2016 than in other years (Figure 2c). Compared with estimated aboveground biomass of four tree species, China berry had the significantly lowest values among the years. The annual litterfall of all tree species was also significantly higher in 2016 than in 2015 and 2017 (Figure 2d). In contrast, the annual litterfall of mahogany and Indian almond was significantly higher than that of rose wood and China berry within the same years.

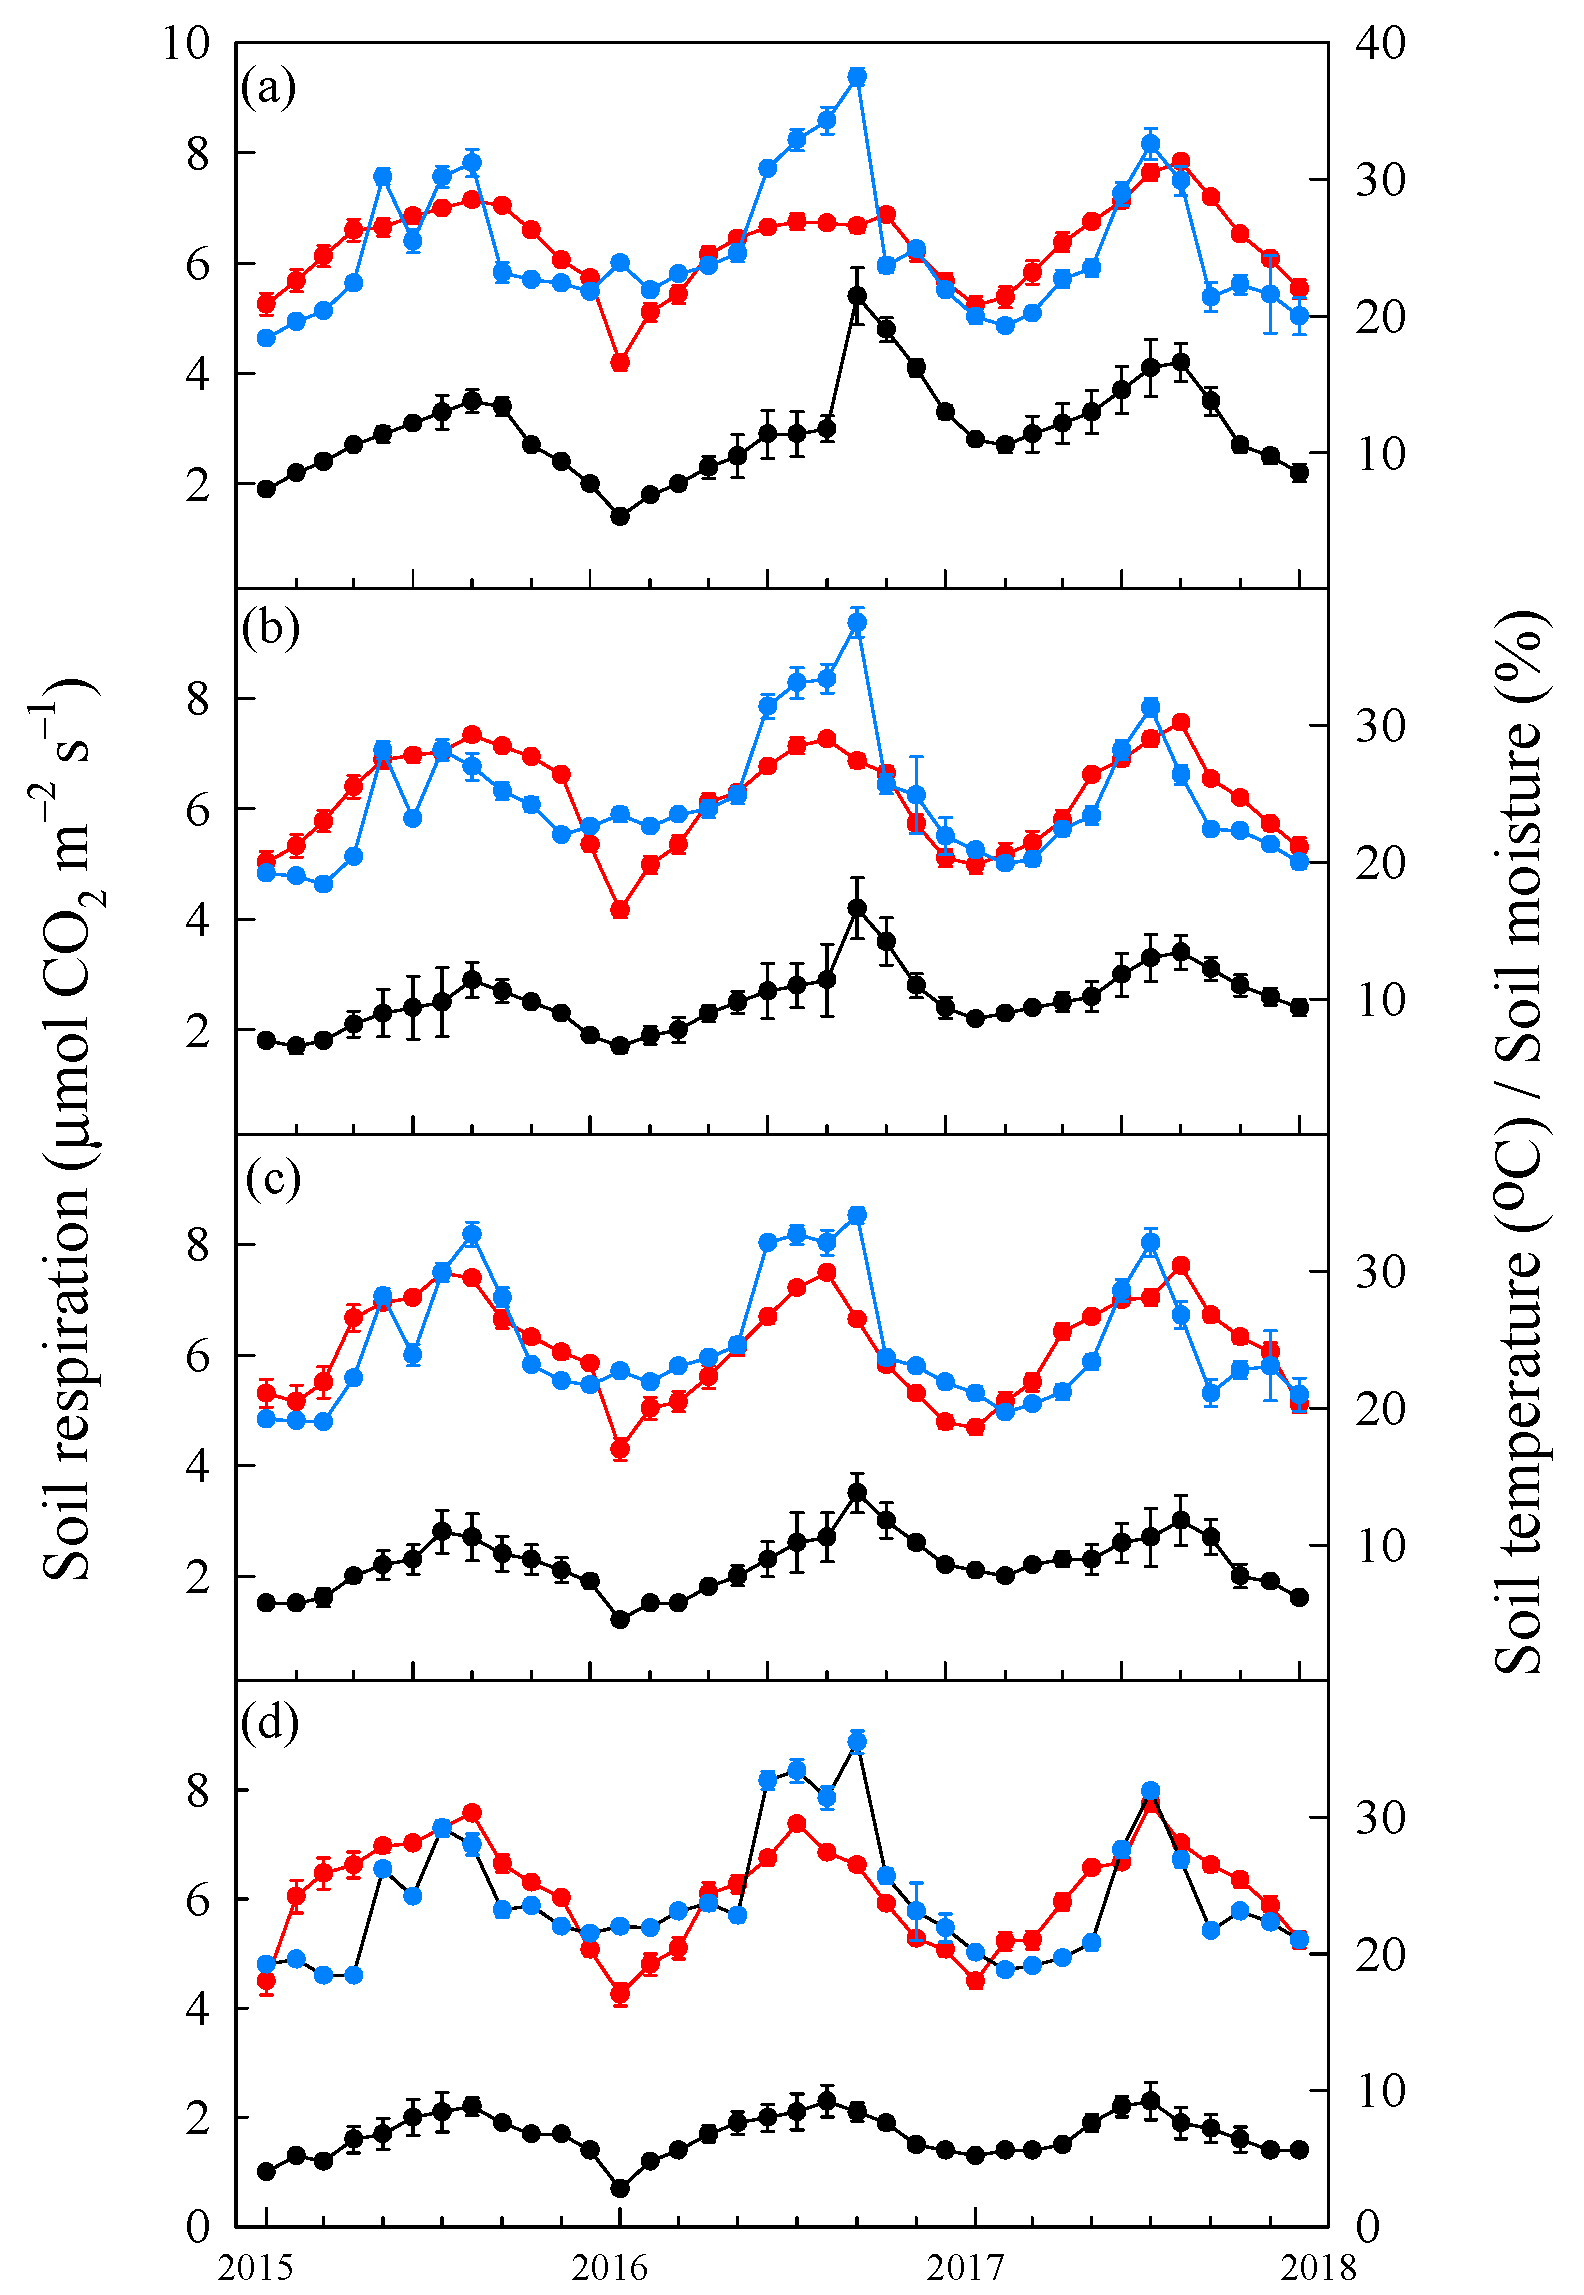
3.2. Change in Soil Respiration, Soil Temperature and Volumetric Soil Moisture before and after Typhoon Disturbances

Generally, Rs showed seasonal patterns among the four tree species, and the maximum and minimum Rs occurred in August and January, respectively. (Figure 3). The annual mean Rs of mahogany and Indian almond in 2015 was significantly lower than that in 2016 and 2017 (p < 0.05, Table 1). However, the annual mean Rs of rose wood and China berry did not show differences among the years. Compared with four tree species, the annual mean Rs of mahogany and China Berry had the significantly highest and lowest values among the years, respectively. Furthermore, the annual mean Rs among the four tree species at the afforested sites in the pretyphoon disturbance year was approximately 7.65 t C ha−1, with the post-typhoon year having an annual mean Rs of approximately 9.13 t C ha−1.
Monthly soil temperature at 5 cm depths also exhibited a typical seasonal pattern with a range of 16.5–31.7 °C and peaks in July for the four tree species (Figure 3). The lowest soil temperature among the four tree species occurred in January 2016. The annual mean soil temperature did not show differences among tree species and years (Table 1). Monthly volumetric soil moisture at 10 cm depth varied between 18.1 and 31.5%, with peaks generally occurring on months with large rainfall amounts. The volumetric soil moisture gradually decreased from 28.5–21% because of a lack of rainfall from October to March. The annual mean volumetric soil moisture in 2016 was significantly higher than that in 2015 and 2017 (p < 0.05, Table 1).
The average relative ratio of the annual means of the environmental factors in 2016–2017 to that in the pretyphoon disturbance year for the four tree species is shown in Table 2. The annual mean soil temperature (MAT) significantly decreased by 1.6–5.2% (−0.39 to −1.28 °C) among the four tree species in 2016 compared to that in the pretyphoon disturbance years, but the MAT significantly increased by 4.7% in the post-typhoon year (2017; +1.16 °C, Table 2). At the same time, the annual mean volumetric soil moisture (MSM) significantly increased by 9–13% (2.19–2.95%) in 2016 compared to that in the pretyphoon disturbance years, but the MSM did not significantly change in the post-typhoon disturbance year. Finally, the annual mean Rs in both 2016 and 2017 significantly increased by 5.1–31% (0.41–2.53 t C ha−1) compared to that in the pretyphoon disturbance years (Table 2).

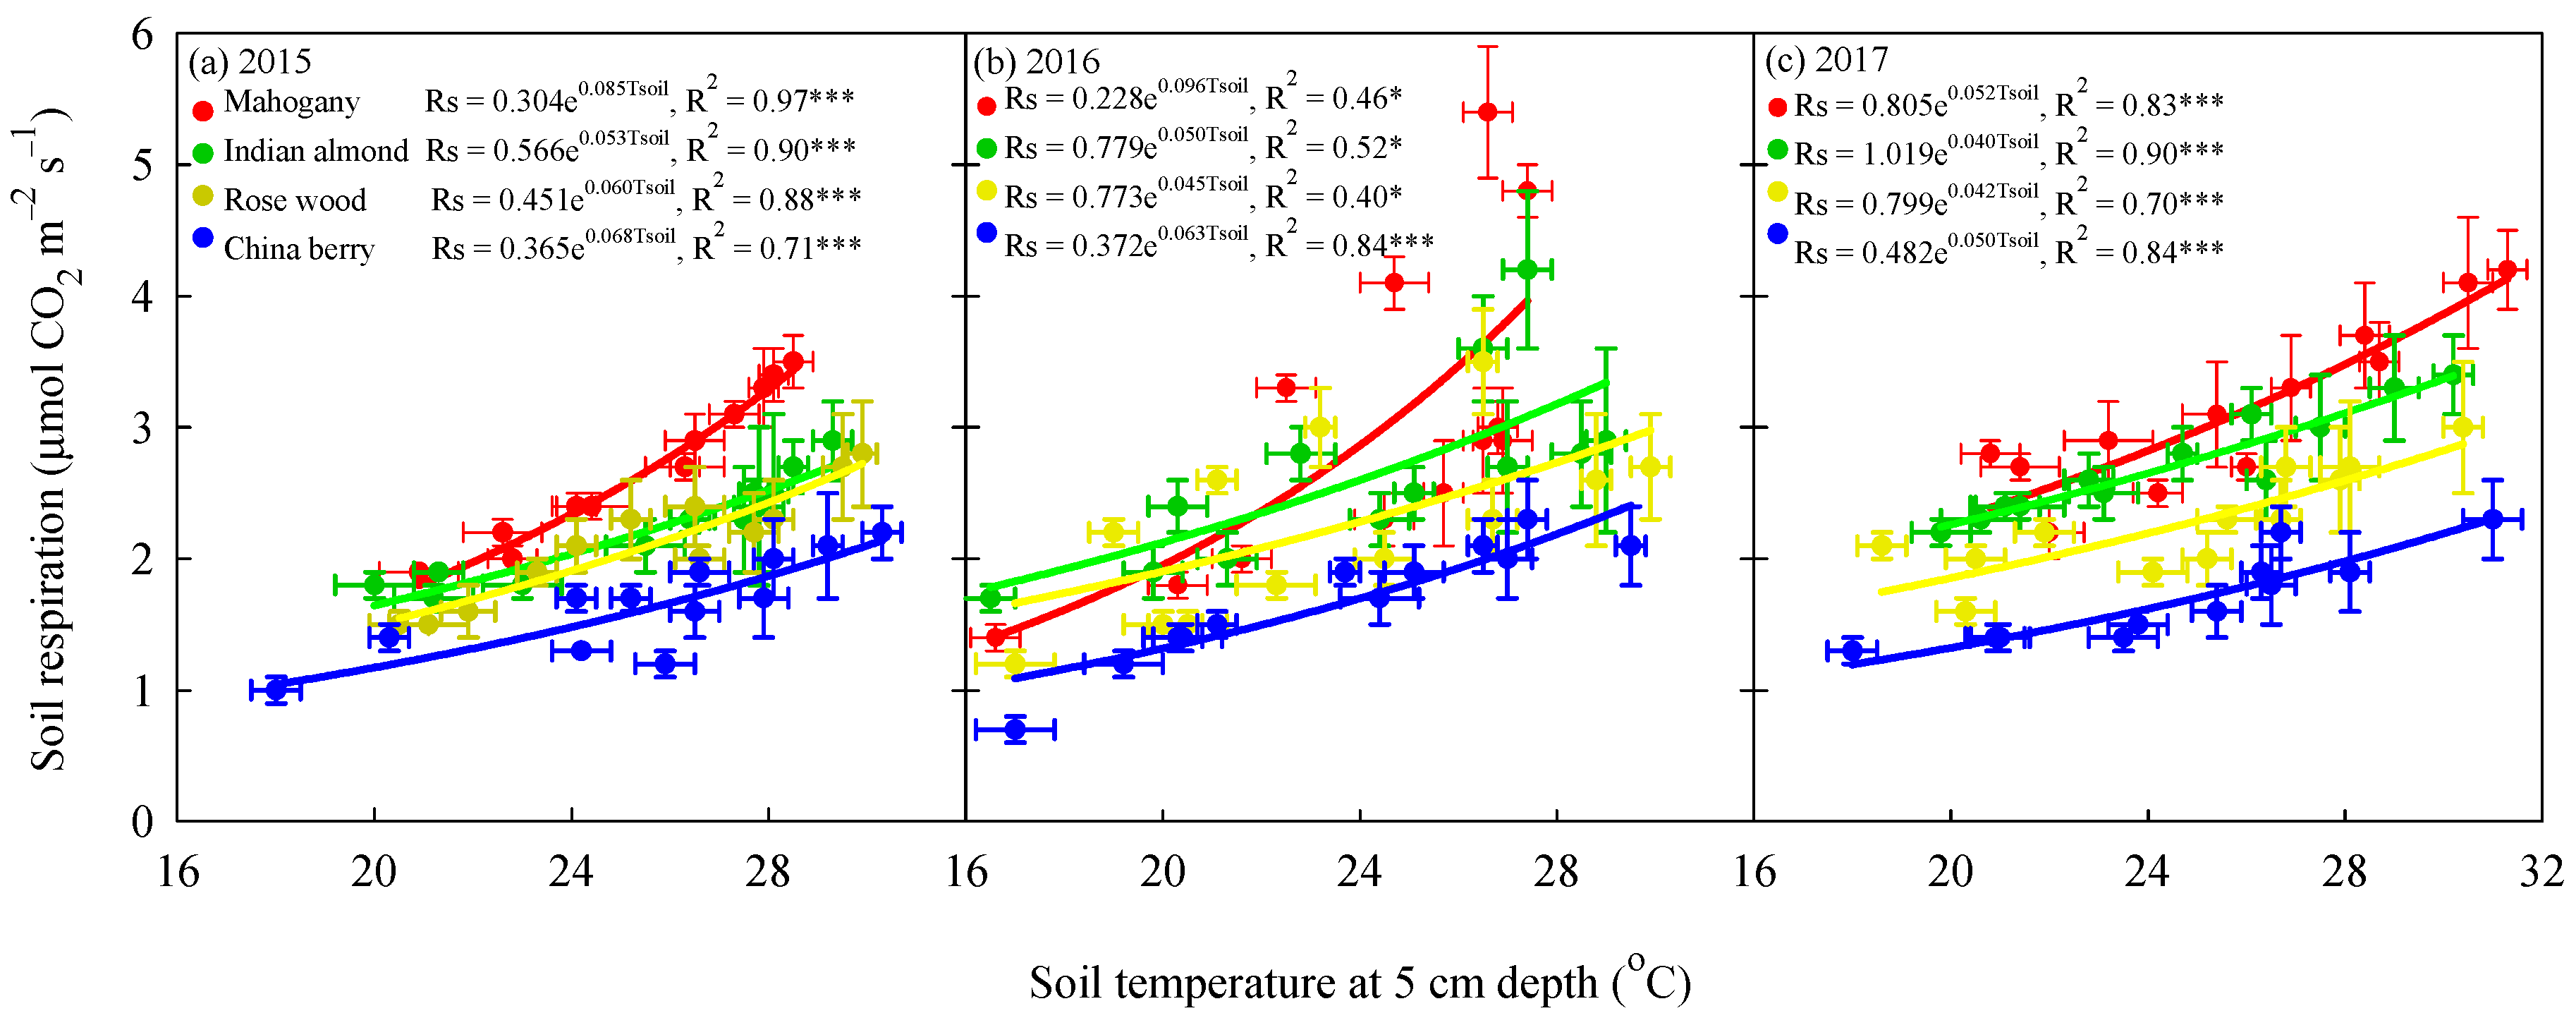
3.3. Variation in Rs with Soil Temperature, Temperature Sensitivity and Soil Moisture

Rs exhibited a significant exponential relationship with soil temperature at the 5 cm depth for the four tree species between 2015 and 2017 (p < 0.001, Figure 4). The coefficient of determination (R2) of Rs among the four tree species between 2015 and 2017 varied from 0.40 to 0.97 (Figure 4). The mean annual Q10 value ranged from 1.79 to 2.34, 1.57 to 2.61, and 1.49 to 1.68 between 2015 and 2017 for mahogany, Indian almond, rose wood, and China berry, respectively (Table 3). Specifically, all of the annual Q10 values in 2017 were significantly lower than those in 2015 and 2016 (p < 0.05). Significant relationships between Rs and volumetric soil moisture were observed over the 3 years (p < 0.05, Figure 5). The coefficient of determination of Rs between 2015 and 2017 varied from 0.31 to 0.95 (Figure 5).

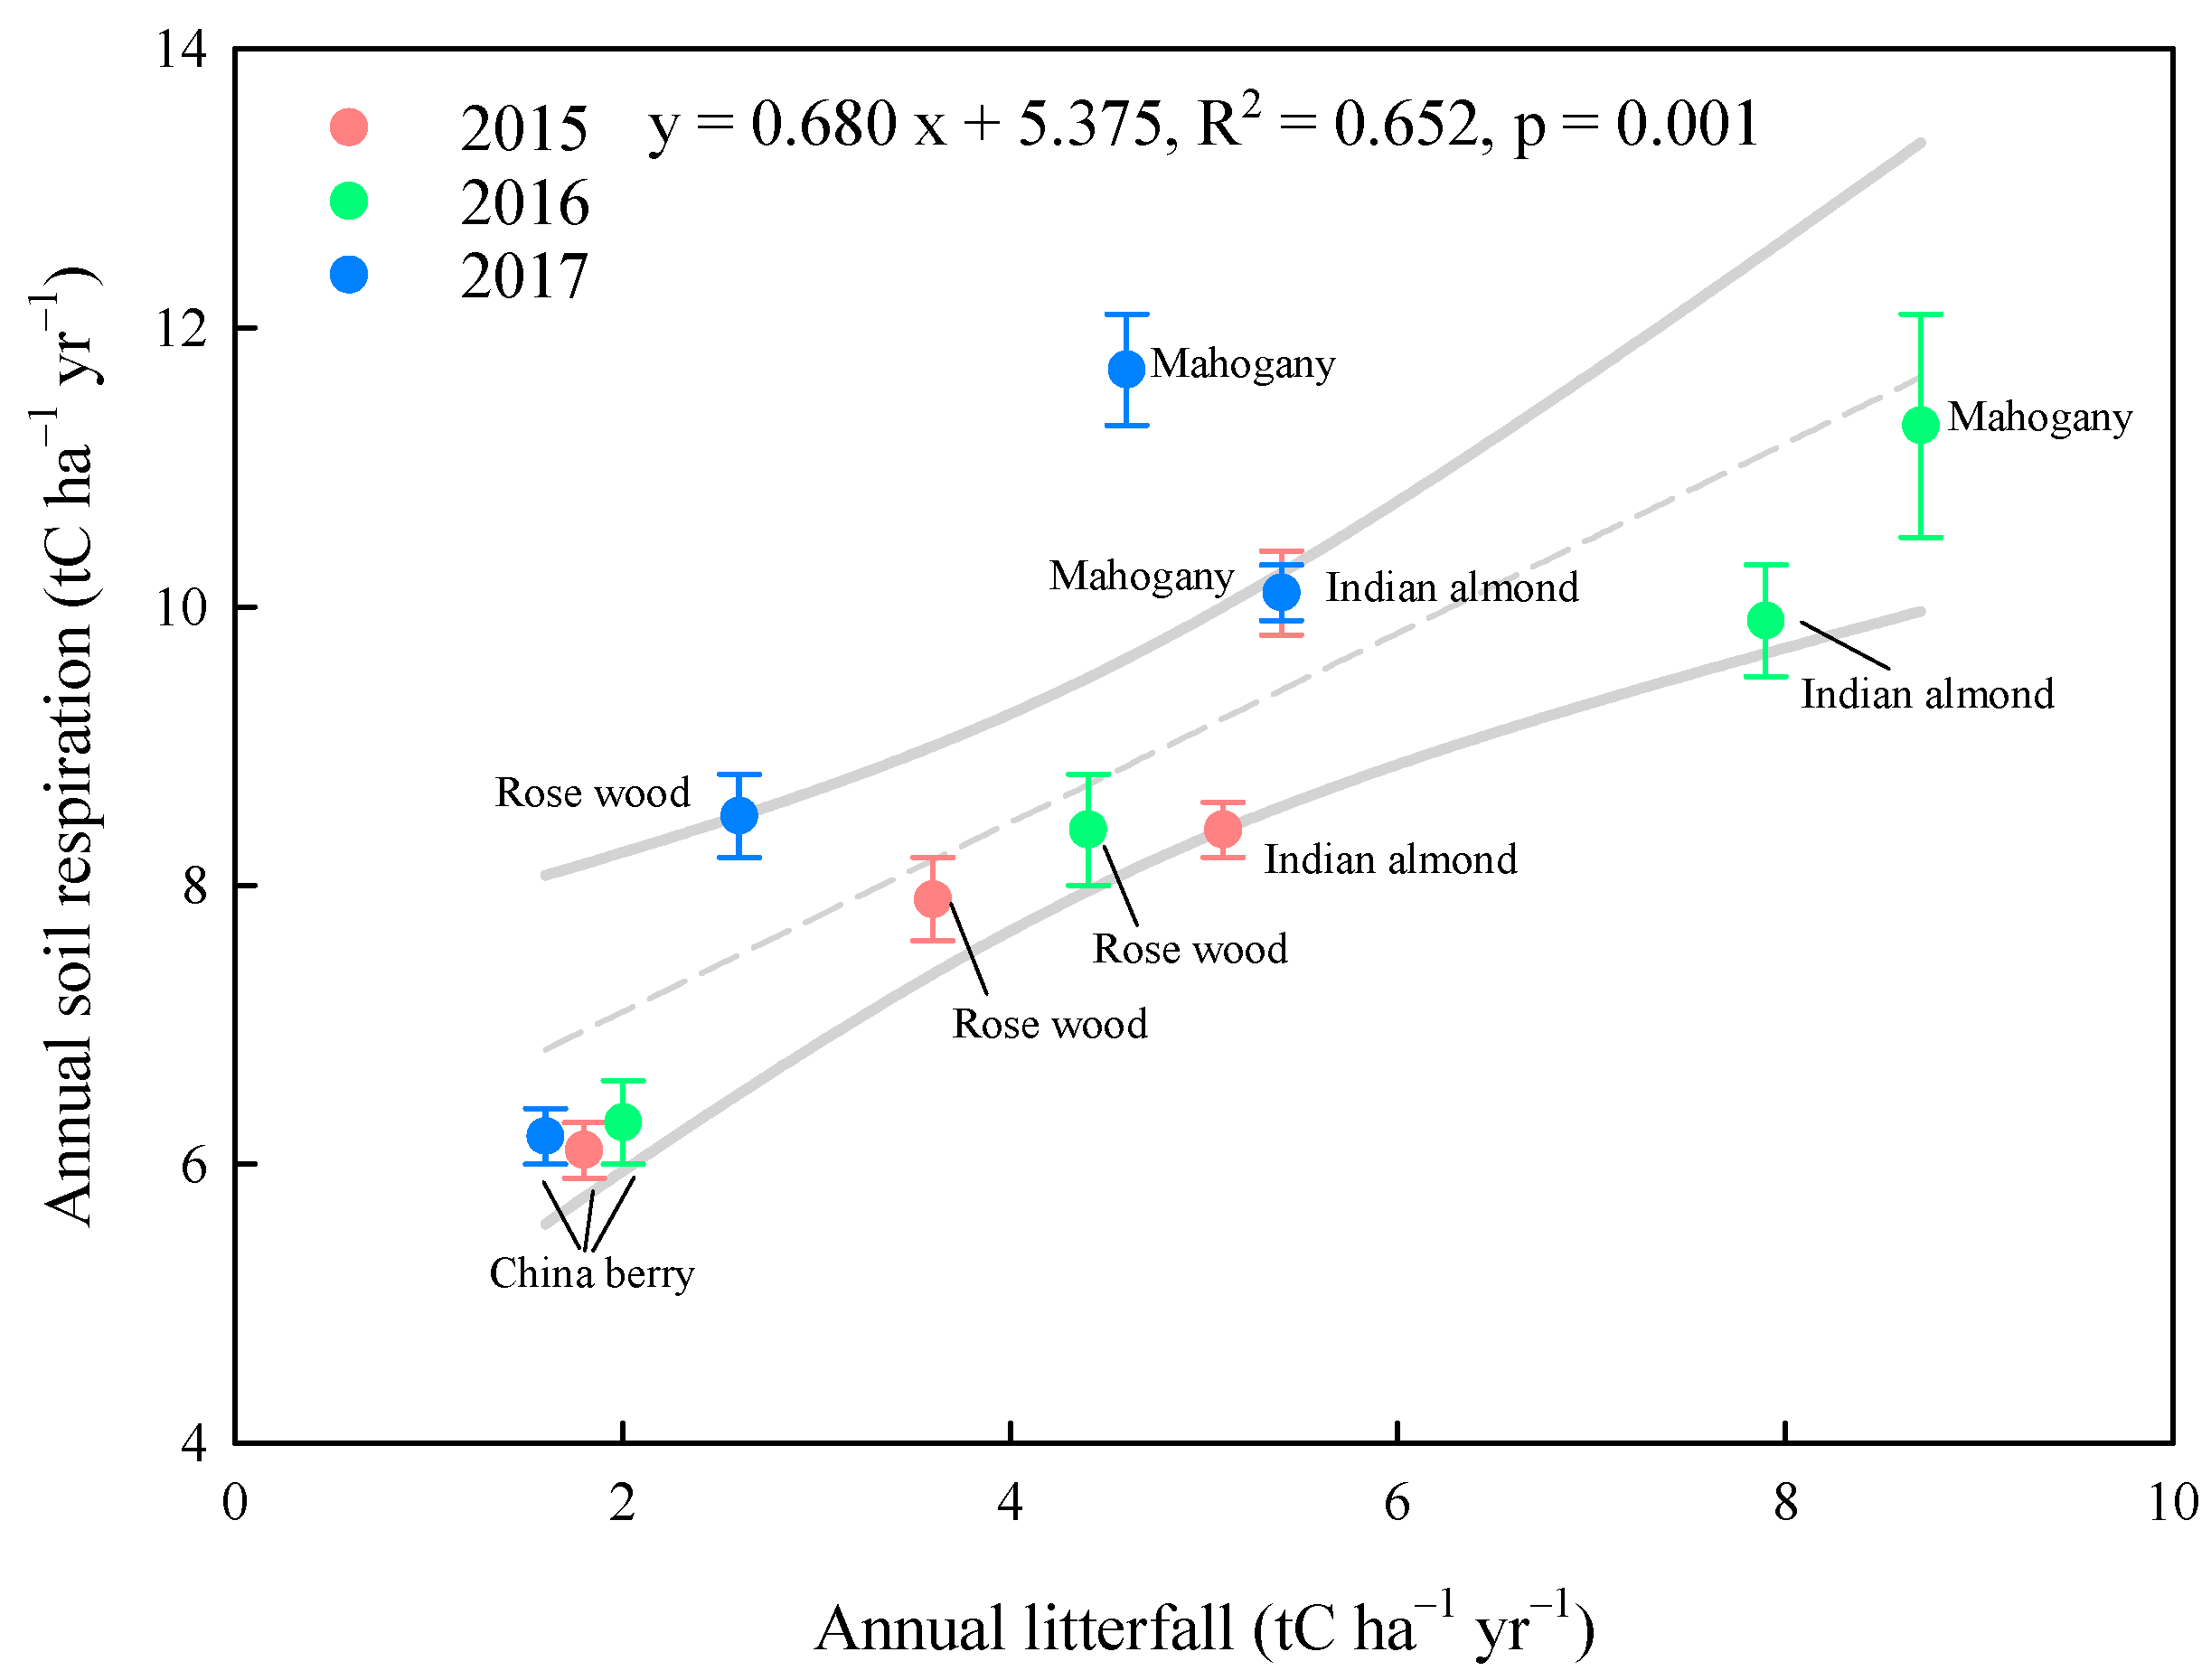
3.4. Relationships between the Annual Litterfall and Annual Rs

Significant relationships between the annual litterfall and annual Rs were observed for the four tree species from 2015 to 2017 (R2 = 0.65, p = 0.001, Figure 6). On the other hand, the annual Rs for mahogany in 2017 was outside the 95% prediction interval and was higher than the values estimated from the annual litterfall–annual Rs relationship (Figure 6).

4. Discussion

4.1. Typhoon Disturbance Impact on the Aboveground Biomass and Litterfall

Typhoons often cause the quantity of litterfall to increase [28]. In this study, the Typhoon Meranti (category 5) disturbance resulted in decreases of tree height and aboveground biomass, and increases of annual litterfall (Figure 2a,c,d). The vulnerability of taller trees to being blown over has resulted in short-stature forests after typhoon disturbances [28,41]. After a typhoon disturbance, taller trees such as mahogany subsequently recover growth (Figure 2c). Moreover, forests frequently disturbed by typhoons use defoliation mechanisms to reduce tree removal. Defoliation is the most common and most important effect of typhoons on biogeochemical processes and is well-demonstrated in many studies [28,34,41]. Taller trees such as mahogany are blown over and have increased litterfall, likely from defoliation mechanisms. Shorter trees such as China berry are resistant to typhoon disturbances, likely initiating defoliation mechanisms to reduce the impact of tree-removing disturbances, such as uprooting and bole snapping. The research results did not show significant differences in tree height, aboveground biomass or annual litterfall from the pre- to post-typhoon disturbances (p > 0.05 Figure 2a–d).

4.2. Impact of Typhoon Disturbances on the Soil Temperature, Soil Moisture and Rs Response of the Four Tree Species at the Afforested Sites

We compared the response of Rs to 3 years of pre- and post-typhoon disturbances at afforested sites with four tree species. All afforested sites showed a similar seasonal pattern of Rs, with high rates during the growing season (rainy season) from April to October and the lowest rates during the dry season (November–March) (Figure 3). Soil temperature and soil moisture are the main drivers of Rs on a global scale [42,43], and the pattern we observed across all tree species reflects differences among the typhoon disturbance years (Figure 3). The annual Rs values in the pretyphoon disturbance years in this study ranged from 5.9 to 9.1 t C ha irrespective of the tree species, which is similar to reported values for other tropical forests [18,19,44,45]. The study results also demonstrated that soil temperature was correlated to Rs for the four tree species in the afforested areas (Figure 4), which is similar to the results for other tropical forests [35,46,47,48,49,50,51]. However, although the temperature sensitivities of the Rs values (Q10) for the four tree species at the afforested sites were similar to those in other tropical forests [45,52,53], it must be noted that the Q10 values were significantly lower in the post-typhoon year than in the pretyphoon year (p < 0.05, Table 3). This result suggested that the forest was disturbed by typhoons and that changes in forest structure, such as bole snapping and uprooting, resulted in soil temperature and moisture increases in the post-typhoon year (Table 2). Typhoon disturbances significantly increased MATs by 1.16 °C (4.7%) for mahogany at the afforested sites in 2017 compared to the pretyphoon disturbance years, possibly due to the light environment being enhanced after the typhoon disturbances (p < 0.001, Figure 4, Table 1 and Table 2). Some studies also reported similar results: typhoons caused defoliation and an enhanced light environment [28] or a lack of vegetation recovery [54], consequently increasing soil temperature variation. Decreasing tree height with increasing temperature was also found in monsoon Asian forests after typhoon disturbances [55], therefore leading to an increase in annual Rs.
In contrast, the volumetric soil moisture for all tree species was significantly higher in the typhoon disturbance year than in the pretyphoon disturbance years because typhoons contributed high rainfall (p < 0.01, Figure 5 and Table 2). The annual Rs increased with increasing volumetric soil moisture, suggesting that the general Rs declined in the dry season [56]. On the other hand, pulse increases in Rs and volumetric soil moisture after rainfall events were demonstrated [15,17,24] due to the high sand contents and soil pore capacity at this study site. Nevertheless, Rs values in the typhoon disturbance years were less related to volumetric soil moisture than in the pre- and post-typhoon disturbance years (Figure 5), and Rs showed the highest value in the typhoon disturbance month (Figure 3). This result was most likely because microbes and roots of soil are more sensitive to rapid changes in volumetric soil moisture conditions under a constant soil temperature [47].

4.3. Response of Aboveground Biomass Increment, Litterfall and Rs to Typhoon Disturbances

Despite the fact that the seasonal pattern in Rs was strongly collated to soil temperature and soil moisture in this study, Rs also quickly responded to changes in aboveground biomass, and greater litterfall occurred in typhoon disturbance years than in pretyphoon disturbance years, as the canopy recovered from defoliation. In the typhoon disturbance years, the aboveground biomass and litterfall over the whole plantation decreased by approximately 20% and increased by 60% compared to those in the pretyphoon disturbance years at this study site, respectively [39], resulting in an increase in Rs (Figure 6). Litter represents a major carbon flux from vegetation to soil [56], is the substrate of soil microbial metabolic activity and is an important factor regulating Rs [34]. Furthermore, the differences in quantities and qualities of litter derived from different tree species led to Rs variations [25,26,34], as observed in some studies that compared different vegetation types [20,21,23,34,56]. Moreover, forests were disturbed by typhoons and produced fresh litterfall, Rs increased immediately after litterfall input in soil, and the addition effect of litter and the soil C release occurred throughout the post-typhoon disturbance year. The links between typhoon disturbances and litterfall addition suggest that the more frequent extreme events expected under climate change will have the potential to significantly alter Rs.

5. Conclusions

Our results clearly show soil respiration variations among the four tree species in the young afforested areas under the influence of typhoon disturbances. In accordance with our first hypothesis, there were high seasonal differences in Rs, soil temperature and volumetric soil moisture, which showed higher values during the summer season than during the winter season. Different tree species also led to litterfall production and consequently controlled Rs variation. In accordance with the last hypothesis, forest structure and consequently Rs magnitude were influenced by typhoon disturbances.
The aboveground biomass was strongly impacted by severe typhoons in 2016, resulting in high aboveground biomass with tree height losses and litterfall accumulation. Furthermore, Rs increased immediately after litterfall input to the soil, and the addition effect of litter and the soil C release occurred throughout the years of post-typhoon disturbances. Our results contribute to the understanding of the degree to which Rs is impacted by typhoon disturbances in tropical afforested areas.

Author Contributions

Conceptualization, P.-N.C., J.-C.Y. and Y.-J.L.; methodology, P.-N.C., J.-C.Y. and Y.-J.L.; formal analysis, J.-C.Y. and Y.-J.L.; writing—original draft preparation, P.-N.C. and J.-C.Y.; writing—review and editing, P.-N.C., J.-C.Y. and Y.-J.L.; visualization, P.-N.C. and Y.-J.L.; funding acquisition, P.-N.C. All authors have read and agreed to the published version of the manuscript.

Funding

This research was partially supported by the Ministry of Science Technology, grant number MOST 107-2313-B-002-035 and MOST 109-2313-B-002-038.

Data Availability Statement

The data presented in this study are amiable on request from the corresponding author. The data are not publicly available due to privacy.

Acknowledgments

This authors thank the staff of the Experimental Forest, National Taiwan University—Chen-Sheng Chang for assistance in fieldwork. This work was also partially supported by the Ministry of Science Technology (MOST 107-2313-B-002-035 and MOST 109-2313-B-002-038). Data from the publication are available from the Experimental Forest, National Taiwan University.

Conflicts of Interest

The authors declare no conflict of interest.

References

  1. Van der Werf, G.R.; Morton, D.C.; DeFries, R.S.; Olivier, J.G.J.; Kasibhatla, P.S.; Jackson, R.B.; Collatz, G.J.; Randerson, J.T. CO2 emissions from forest loss. Nat. Geosci. 2009, 2, 737–738. [Google Scholar] [CrossRef]
  2. Friedlingstein, P.; O’Sullivan, M.; Jones, M.W.; Andrew, R.M.; Hauck, J.; Olsen, A.; Peters, G.P.; Peters, W.; Pongratz, J.; Sitch, S.; et al. Global carbon budget 2020. Earth Syst. Sci. Data 2020, 12, 3269–3340. [Google Scholar] [CrossRef]
  3. Doelman, J.C.; Stehfest, E.; van Vuuren, D.P.; Tabeau, A.; Hof, A.F.; Braakhekke, M.C.; Gernaat, D.E.H.J.; van den Berg, M.; van Zeist, W.J.; Daioglou, V.; et al. Afforestation for climate change mitigation: Potentials, risks and trade-offs. Glob. Chang. Biol. 2020, 26, 1576–1591. [Google Scholar] [CrossRef] [PubMed]
  4. Guo, J.; Wang, B.; Wang, G.B.; Wu, Y.Q.; Cao, F.L. Afforestation and agroforestry enhance soil nutrient status and carbon sequestration capacity in eastern China. Land Degrad. Dev. 2020, 31, 392–403. [Google Scholar] [CrossRef]
  5. Bastin, J.F.; Finegold, Y.; Garcia, C.; Mollicone, D.; Rezende, M.; Routh, D.; Zohner, C.M.; Crowther, T.W. The global tree restoration potential. Science 2019, 365, 76–79. [Google Scholar] [CrossRef] [PubMed]
  6. Busch, J.; Engelmann, J.; Cook-Patton, S.C.; Griscom, B.W.; Kroeger, T.; Possingham, H.; Shyamsundar, P. Potential for low-cost carbon dioxide removal through tropical reforestation. Nat. Clim. Change 2019, 9, 463–466. [Google Scholar] [CrossRef]
  7. Payn, T.; Carnus, J.M.; Freer-Smith, P.; Kimberley, M.; Kollert, W.; Liu, S.R.; Orazio, C.; Rodriguez, L.; Silva, L.N.; Wingfield, M.J. Changes in planted forests and future global implications. For. Ecol. Manag. 2015, 352, 57–67. [Google Scholar] [CrossRef] [Green Version]
  8. Nepal, P.; Korhonen, J.; Prestemon, J.P.; Cubbage, F.W. Projecting global planted forest area developments and the associated impacts on global forest product markets. J. Environ. Manag. 2019, 240, 421–430. [Google Scholar] [CrossRef] [Green Version]
  9. Teramoto, M.; Liang, N.S.; Takahashi, Y.; Zeng, J.Y.; Saigusa, N.; Ide, R.; Zhao, X. Enhanced understory carbon flux components and robustness of net CO2 exchange after thinning in a larch forest in central Japan. Agric. For. Meteorol. 2019, 274, 106–117. [Google Scholar] [CrossRef]
  10. Teramoto, M.; Liang, N.; Ishida, S.; Zeng, J. Long-term stimulatory warming effect on soil heterotrophic respiration in a cool-temperate broad-leaved deciduous forest in northern Japan. J. Geophys. Res. Biogeo. 2018, 123, 1161–1177. [Google Scholar] [CrossRef]
  11. Jian, J.; Steele, M.K.; Thomas, R.Q.; Day, S.D.; Hodges, S.C. Constraining estimates of global soil respiration by quantifying sources of variability. Glob. Chang. Biol. 2018, 24, 4143–4159. [Google Scholar] [CrossRef]
  12. Law, B.E.; Kelliher, F.M.; Baldocchi, D.D.; Anthoni, P.M.; Irvine, J.; Moore, D.; Van Tuyl, S. Spatial and temporal variation in respiration in a young ponderosa pine forests during a summer drought. Agric. For. Meteorol. 2001, 110, 27–43. [Google Scholar] [CrossRef]
  13. Liang, N.S.; Teramoto, M.; Takagi, M.; Zeng, J.Y. Data descriptor: High-resolution data on the impact of warming on soil CO2 efflux from an Asian monsoon forest. Sci. Data 2017, 4, 1–11. [Google Scholar] [CrossRef] [Green Version]
  14. Teramoto, M.; Liang, N.S.; Zeng, J.Y.; Saigusa, N.; Takahashi, Y. Long-term chamber measurements reveal strong impacts of soil temperature on seasonal and inter-annual variation in understory CO2 fluxes in a Japanese larch (Larix kaempferi Sarg.) forest. Agric. For. Meteorol. 2017, 247, 194–206. [Google Scholar] [CrossRef]
  15. Yu, J.C.; Chiang, P.N.; Lai, Y.J.; Tsai, M.J.; Wang, Y.N. High rainfall inhibited soil respiration in an Asian monsoon forest in Taiwan. Forests 2021, 12, 239. [Google Scholar] [CrossRef]
  16. Wang, J.Y.; Ren, C.J.; Feng, X.X.; Zhang, L.; Doughty, R.; Zhao, F.Z. Temperature sensitivity of soil carbon decomposition due to shifts in soil extracellular enzymes after afforestation. Geoderma 2020, 374, 114426. [Google Scholar] [CrossRef]
  17. Zhu, M.X.; De Boeck, H.J.; Xu, H.; Chen, Z.S.N.; Lv, J.; Zhang, Z.Q. Seasonal variations in the response of soil respiration to rainfall events in a riparian poplar plantation. Sci. Total Environ. 2020, 747, 141222. [Google Scholar] [CrossRef]
  18. Goldberg, S.D.; Zhao, Y.; Harrison, R.D.; Monkai, J.; Li, Y.; Chau, K.; Xu, J. Soil respiration in sloping rubber plantations and tropical natural forests in Xishuangbanna, China. Agric. Ecosyst. Environ. 2017, 249, 237–246. [Google Scholar] [CrossRef]
  19. Zhao, Y.L.; Goldberg, S.D.; Xu, J.C.; Harrison, R.D. Spatial and seasonal variation in soil respiration along a slope in a rubber plantation and a natural forest in Xishuangbanna, Southwest China. J. Mt. Sci. 2018, 15, 695–707. [Google Scholar] [CrossRef]
  20. Fernandez-Alonso, M.J.; Diaz-Pines, E.; Ortiz, C.; Rubio, A. Disentangling the effects of tree species and microclimate on heterotrophic and autotrophic soil respiration in a Mediterranean ecotone forest. For. Ecol. Manag. 2018, 430, 533–544. [Google Scholar] [CrossRef] [Green Version]
  21. Díaz-Pinés, E.; Schindlbacher, A.; Godino, M.; Kitzler, B.; Jandl, R.; Zechmeister-Boltenstern, S.; Rubio, A. Effects of tree species composition on the CO2 and N2O efflux of a Mediterranean mountain forest soil. Plant. Soil 2014, 384, 243–257. [Google Scholar] [CrossRef]
  22. Teramoto, M.; Liang, N.S.; Takagi, M.; Zeng, J.Y.; Grace, J. Sustained acceleration of soil carbon decomposition observed in a 6-year warming experiment in a warm-temperate forest in southern Japan. Sci. Rep. 2016, 6, 1–14. [Google Scholar] [CrossRef] [PubMed]
  23. Liu, M.Y.; Xia, H.P.; Fu, S.L.; Eisenhauer, N. Tree diversity regulates soil respiration through accelerated tree growth in a mesocosm experiment. Pedobiologia 2017, 65, 24–28. [Google Scholar] [CrossRef]
  24. Yu, S.Q.; Chen, Y.Q.; Zhao, J.; Fu, S.L.; Li, Z.; Xia, H.P.; Zhou, L.X. Temperature sensitivity of total soil respiration and its heterotrophic and autotrophic components in six vegetation types of subtropical China. Sci. Total Environ. 2017, 607, 160–167. [Google Scholar] [CrossRef] [PubMed]
  25. Huang, Y.H.; Hung, C.Y.; Lin, I.R.; Kume, T.; Menyailo, O.V.; Cheng, C.H. Soil respiration patterns and rates at three Taiwanese forest plantations: Dependence on elevation, temperature, precipitation, and litterfall. Bot. Stud. 2017, 58, 49. [Google Scholar] [CrossRef] [PubMed] [Green Version]
  26. Han, C.X.; Liu, T.X.; Lu, X.X.; Duan, L.M.; Singh, V.P.; Ma, L.Q. Effect of litter on soil respiration in a man-made Populus L. forest in a dune-meadow transitional region in China’s Horqin sandy land. Ecol. Eng. 2019, 127, 276–284. [Google Scholar] [CrossRef]
  27. Thuille, A.; Buchmann, N.; Schulze, E.D. Carbon stocks and soil respiration rates during deforestation, grassland use and subsequent Norway spruce afforestation in the Southern Alps, Italy. Tree Physiol. 2000, 20, 849–857. [Google Scholar] [CrossRef]
  28. Lin, T.C.; Hamburg, S.P.; Lin, K.C.; Wang, L.J.; Chang, C.T.; Hsia, Y.J.; Vadeboncoeur, M.A.; McMullen, C.M.M.; Liu, C.P. Typhoon disturbance and forest dynamics: Lessons from a northwest pacific subtropical forest. Ecosystems 2011, 14, 127–143. [Google Scholar] [CrossRef]
  29. Su, S.H.; Guan, B.T.; Chang-Yang, C.H.; Sun, I.F.; Wang, H.H.; Hsieh, C.F. Multi-stemming and size enhance survival of dominant tree species in a frequently typhoon-disturbed forest. J. Veg. Sci. 2020, 31, 429–439. [Google Scholar] [CrossRef]
  30. Wang, L.X.; Lin, T.C. Forests affected by frequent and intense typhoons challenge the intermediate disturbance hypothesis. Biotropica 2019, 51, 797–801. [Google Scholar] [CrossRef]
  31. Easterling, D.R.; Meehl, G.A.; Parmesan, C.; Changnon, S.A.; Karl, T.R.; Mearns, L.O. Climate extremes: Observations, modeling, and impacts. Science 2000, 289, 2068–2074. [Google Scholar] [CrossRef] [PubMed] [Green Version]
  32. Reichstein, M.; Bahn, M.; Ciais, P.; Frank, D.; Mahecha, M.D.; Seneviratne, S.I.; Zscheischler, J.; Beer, C.; Buchmann, N.; Frank, D.C.; et al. Climate extremes and the carbon cycle. Nature 2013, 500, 287–295. [Google Scholar] [CrossRef]
  33. Lin, K.C.; Hamburg, S.P.; Wang, L.X.; Duh, C.T.; Huang, C.M.; Chang, C.T.; Lin, T.C. Impacts of increasing typhoons on the structure and function of a subtropical forest: Reflections of a changing climate. Sci. Rep. 2017, 7, 4911. [Google Scholar] [CrossRef] [PubMed] [Green Version]
  34. Wang, H.C.; Wang, S.F.; Lin, K.C.; Shaner, P.J.; Lin, T.C. Litterfall and element fluxes in a natural hardwood forest and a Chinese-fir plantation experiencing frequent typhoon disturbance in central Taiwan. Biotropica 2013, 45, 541–548. [Google Scholar] [CrossRef]
  35. Yu, S.Q.; Mo, Q.F.; Chen, Y.Q.; Li, Y.W.; Li, Y.X.; Zou, B.; Xia, H.P.; Jun, W.; Li, Z.A.; Wang, F.M. Effects of seasonal precipitation change on soil respiration processes in a seasonally dry tropical forest. Ecol. Evol. 2020, 10, 467–479. [Google Scholar] [CrossRef] [Green Version]
  36. Wu, C.C.; Kuo, Y.H. Typhoons affecting Taiwan: Current understanding and future challenges. Bulletin Am. Meteorol. Soc. 1999, 80, 67–80. [Google Scholar] [CrossRef]
  37. Torii, N. The development of the use of interflow water in the barren land/l creation process of Wan-long farm of Taiwan sugar Co., Ltd. Irrig. Taiwan 1936, 6, 3–27. [Google Scholar]
  38. Chen, C.-I.; Wang, Y.-N.; Lih, H.-W.; Yu, J.-C. Three-year study on diurnal and seasonal CO2 sequestration of a young Fraxinus griffithii plantation in southern Taiwan. Forests 2016, 7, 230. [Google Scholar] [CrossRef] [Green Version]
  39. Maneke-Fiegenbaum, F.; Santos, S.H.; Klemm, O.; Yu, J.C.; Chiang, P.N.; Lai, Y.J. Carbon dioxide fluxes of a young deciduous afforestation under the influence of seasonal precipitation patterns and frequent typhoon occurrence. J. Geophys. Res. Biogeo. 2021, 126, e005996. [Google Scholar] [CrossRef]
  40. Lloyd, J.; Taylor, J.A. On the Temperature-Dependence of Soil Respiration. Funct. Ecol. 1994, 8, 315–323. [Google Scholar] [CrossRef]
  41. Yao, A.W.; Chiang, J.M.; McEwan, R.; Lin, T.C. The effect of typhoon-related defoliation on the ecology of gap dynamics in a subtropical rain forest of Taiwan. J. Veg. Sci. 2015, 26, 145–154. [Google Scholar] [CrossRef]
  42. Raich, J.W. Temporal Variability of soil respiration in experimental tree plantations in lowland Costa Rica. Forests 2017, 8, 40. [Google Scholar] [CrossRef] [Green Version]
  43. Raich, J.W.; Schlesinger, W.H. The global carbon-dioxide flux in soil respiration and its relationship to vegetation and climate. Tellus B 1992, 44, 81–99. [Google Scholar] [CrossRef] [Green Version]
  44. Schwendenmann, L.; Veldkamp, E.; Brenes, T.; O’Brien, J.J.; Mackensen, J. Spatial and temporal variation in soil CO2 efflux in an old-growth neotropical rain forest, La Selva, Costa Rica. Biogeochemistry 2003, 64, 111–128. [Google Scholar] [CrossRef]
  45. Deng, Q.; Zhang, D.; Han, X.; Chu, G.; Zhang, Q.; Hui, D. Changing rainfall frequency rather than drought rapidly alters annual soil respiration in a tropical forest. Soil Biol. Biochem. 2018, 121, 8–15. [Google Scholar] [CrossRef]
  46. Prasad, S.; Baishya, R. Interactive effects of soil moisture and temperature on soil respiration under native and non-native tree species in semi-arid forest of Delhi, India. Trop. Ecol. 2019, 60, 252–260. [Google Scholar] [CrossRef]
  47. Brechet, L.M.; Lopez-Sangil, L.; George, C.; Birkett, A.J.; Baxendale, C.; Castro Trujillo, B.; Sayer, E.J. Distinct responses of soil respiration to experimental litter manipulation in temperate woodland and tropical forest. Ecol. Evol. 2018, 8, 3787–3796. [Google Scholar] [CrossRef] [PubMed]
  48. Machmuller, M.B.; Ballantyne, F.; Markewitz, D.; Thompson, A.; Wurzburger, N.; Frankson, P.T.; Mohan, J.E. Temperature sensitivity of soil respiration in a low-latitude forest ecosystem varies by season and habitat but is unaffected by experimental warming. Biogeochemistry 2018, 141, 63–73. [Google Scholar] [CrossRef]
  49. Adachi, M.; Bekku, Y.S.; Konuma, A.; Kadir, W.R.; Okuda, T.; Koizumi, H. Required sample size for estimating soil respiration rates in large areas of two tropical forests and of two types of plantation in Malaysia. For. Ecol. Manag. 2005, 210, 455–459. [Google Scholar] [CrossRef]
  50. Arora, P.; Chaudhry, S. Dependency of rate of soil respiration on soil parameters and climatic factors in different tree plantations at Kurukshetra, India. Trop. Ecol. 2017, 58, 573–581. [Google Scholar]
  51. Barbhuiya, A.R.; Arunachalam, A.; Nath, P.C.; Khan, M.L.; Arunachalam, K. Leaf litter decomposition of dominant tree species of Namdapha National Park, Arunachal Pradesh, northeast India. J. For. Res. 2008, 13, 25–34. [Google Scholar] [CrossRef]
  52. Zimmermann, M.; Bird, M.I. Temperature sensitivity of tropical forest soil respiration increase along an altitudinal gradient with ongoing decomposition. Geoderma 2012, 187–188, 8–15. [Google Scholar] [CrossRef]
  53. Zimmermann, M.; Davies, K.; Zimmermann, V.; Bird, M. Impact of temperature and moisture on heterotrophic soil respiration along a moist tropical forest gradient in Australia. Soil Res. 2015, 53, 286–297. [Google Scholar] [CrossRef]
  54. Sano, T.; Hirano, T.; Liang, N.S.; Hirata, R.; Fujinuma, Y. Carbon dioxide exchange of a larch forest after a typhoon disturbance. For. Ecol. Manag. 2010, 260, 2214–2223. [Google Scholar] [CrossRef] [Green Version]
  55. Chi, C.H.; McEwan, R.W.; Chang, C.T.; Zheng, C.Y.; Yang, Z.J.; Chiang, J.M.; Lin, T.C. Typhoon disturbance mediates elevational patterns of forest structure, but not species diversity, in humid monsoon Asia. Ecosystems 2015, 18, 1410–1423. [Google Scholar] [CrossRef]
  56. Bréchet, L.; Ponton, S.; Roy, J.; Freycon, V.; Coûteaux, M.-M.; Bonal, D.; Epron, D. Do tree species characteristics influence soil respiration in tropical forests? A test based on 16 tree species planted in monospecific plots. Plant Soil 2009, 319, 235–246. [Google Scholar] [CrossRef]
Figure 1. The mean (a) daily air temperature, soil moisture, rainfall and (b) monthly rainfall from 2015 to 2017.
Forests 12 00787 g001
Figure 2. Interannual variations in (a) tree height, (b) DBH, (c) aboveground biomass, and (d) annual litterfall from 2015 to 2017 for different tree species: mahogany (Swietenia macrophylla King, red bar), Indian almond (Terminalia catappa Linn., green bar), rose wood (Pterocarpus indicus Willd., yellow bar), and China berry (Melia azedarach Linn., blue bar). Different capital letters indicate differences among years for the same species at p < 0.05. Different lowercase letters indicate differences among species within the same years at p < 0.05. Error bars indicate standard deviations (n = 4).
Forests 12 00787 g002
Figure 3. Monthly variations in soil respiration (μmol m−2 s−1), soil temperature (°C) and soil moisture from 2015 to 2017 for the different tree species: (a) mahogany, (b) Indian almond, (c) rose wood, and (d) China berry. The black, red, and blue solid circles represent the soil respiration, soil temperature, and soil moisture, respectively; error bars represent standard deviations (n = 4).
Forests 12 00787 g003
Figure 4. Relationships between monthly mean soil respiration (Rs, μmol CO2 m−2 s−1) and soil temperature at a 5 cm depth (°C) for studied tree species in (a) 2015 (b) 2016, and (c) 2017. Asterisks indicate a significance: * p < 0.05, *** p < 0.001. Values are presented as the mean ± standard errors, n = 4.
Forests 12 00787 g004
Figure 5. Relationships between monthly mean soil respiration (Rs, μmol CO2 m−2 s−1) and volumetric soil moisture at a 10 cm depth (%) for studied tree species in (a) 2015, (b) 2016, and (c) 2017. Asterisks indicate a significance: * p < 0.05, ** p ≤ 0.01, *** p < 0.001. Values are presented as the mean ± standard errors, n = 4.
Forests 12 00787 g005
Figure 6. Relationships between annual litterfall and annual soil respiration. Dashed curves represent a significant relationship between annual litterfall and annual Rs, including all measurement data from 2015 to 2017. Pairs of gray curves show the 95% prediction intervals based on regression analysis. Values are presented as the mean ± standard errors, n = 4.
Forests 12 00787 g006
Table 1. Interannual variations in Rs from 2015 to 2017 for the different tree species: mahogany, Indian almond, rose wood, and China berry. Different capital letters indicate differences among years for the same species at p < 0.05. Different lowercase letters indicate differences among species within the same years at p < 0.05. Values indicate means ± standard deviations (n = 4).
YearAnnual Mean Soil Temperature (°C)Annual Mean Volumetric Soil Moisture
(%)
Annual Mean Soil Respiration
(tC ha−1)
201520162017201520162017201520162017
Mahogany24.5 ± 2.8 Aa24.2 ± 3.3 Aa25.7 ± 3.5 Aa22.5 ± 2.3 Ba24.9 ± 2.8 Aa22.5 ± 2.2 Ba9.1 ± 0.6 Aa11.3 ± 1.2 Ba11.7 ± 0.6 Ba
Indian almond24.8 ± 3.5 Aa24.1 ± 3.9 Aa24.4 ± 3.5 Aa23.3 ± 2.4 Ba25.2 ± 2.6 Aa22.6 ± 2.4 Ba8.1 ± 0.5 Aab9.9 ± 0.7 Ba10.1 ± 0.4 Bab
Rose wood24.5 ± 3.8 Aa23.3 ± 4.0 Aa24.7 ± 3.6 Aa22.0 ± 2.1 Ba24.1 ± 1.8 Aa22.7 ± 2.1 Ba7.5 ± 0.5 Ab8.4 ± 0.7 Aab8.5 ± 0.4 Ab
China berry24.7 ± 3.4 Aa23.5 ± 3.8 Aa24.4 ± 3.7 Aa21.7 ± 2.1 Ba24.6 ± 2.7 Aa21.4 ± 1.7 Ba5.9 ± 0.4 Ac6.3 ± 0.5 Ab6.2 ± 0.3 Ac
Table 2. Average relative ratio of the annual means of the environmental factors in 2016–2017 to that in the pretyphoon disturbance years for the four tree species: mahogany, Indian almond, rose wood, and China berry. The averages of the factors in the post-typhoon disturbance year (2017) were also compared with those of the pretyphoon disturbance year (2015). Values indicate means ± standard deviations (n = 4).
YearAnnual Mean Soil Temperature
(°C)
Annual Mean Volumetric Soil Moisture
(%)
Annual Mean Soil Respiration
(t C ha−1)
201620172016201720162017
Mahogany0.984 ± 0.0611.047 ± 0.041 ***1.112 ± 0.103 **1.003 ± 0.0321.242 ± 0.405 *1.310 ± 0.192 ***
Indian almond0.967 ± 0.047 *0.984 ± 0.0321.131 ± 0.085 ***1.011 ± 0.0471.231 ± 0.241 **1.272 ± 0.096 ***
Rose wood0.948 ± 0.048 **1.007 ± 0.0481.098 ± 0.058 ***1.035 ± 0.044 *1.107 ± 0.2321.152 ± 0.178 **
China berry0.948 ± 0.047 ***0.985 ± 0.0401.132 ± 0.06 ***0.985 ± 0.0531.051 ± 0.1271.066 ± 0.104 *
*, **, and *** represent significant differences of the indicated factors compared with the pretyphoon disturbances years at p< 0.05, p < 0.01, and p < 0.001, respectively.
Table 3. The Q10 values (n = 4) as a function of soil temperature (°C) at 5 cm depth from 2015 to 2017. Different capital letters indicate differences among years for the same species at p < 0.05. Different lowercase letters indicate differences among species within the same years at p < 0.05.
Species Q10 Value
201520162017
Mahongany2.34 Aa2.61 Aa1.68 Ba
Indian almond1.70 Ab1.65 ABb1.49 Bb
Rose wood1.82 Ab1.57 Bb1.52 Bb
China berry1.79 ABb1.88 Ab1.65 Bac
Publisher’s Note: MDPI stays neutral with regard to jurisdictional claims in published maps and institutional affiliations.

