Article

Comparative Analysis of the Complete Chloroplast Genomes of Four Chestnut Species (Castanea)

1
College of Forestry, Northwest A&F University, Yangling 712100, China
2
Key Laboratory of Resource Biology and Biotechnology in Western China, Ministry of Education, College of Life Sciences, Northwest University, Xi’an 710069, China
3
USDA Forest Service Hardwood Tree Improvement and Regeneration Center (HTIRC), Department of Forestry and Natural Resources, Purdue University, 715 West State Street, West Lafayette, IN 47907, USA
*
Authors to whom correspondence should be addressed.
Forests 2021, 12(7), 861; https://doi.org/10.3390/f12070861
Submission received: 24 May 2021 / Revised: 21 June 2021 / Accepted: 28 June 2021 / Published: 29 June 2021
(This article belongs to the Section Genetics and Molecular Biology)

Abstract

:
Chloroplast (cp) DNA genomes are traditional workhorses for studying the evolution of species and reconstructing phylogenetic relationships in plants. Species of the genus Castanea (chestnuts and chinquapins) are valued as a source of nuts and timber wherever they grow, and chestnut species hybrids are common. We compared the cp genomes of C. mollissima, C. seguinii, C. henryi, and C. pumila. These cp genomes ranged from 160,805 bp to 161,010 bp in length, comprising a pair of inverted repeat (IR) regions (25,685 to 25,701 bp) separated by a large single-copy (LSC) region (90,440 to 90,560 bp) and a small single-copy (SSC) region (18,970 to 19,049 bp). Each cp genome encoded the same 113 genes; 82–83 protein-coding genes, 30 transfer RNA genes, and four ribosomal RNA genes. There were 18 duplicated genes in the IRs. Comparative analysis of cp genomes revealed that rpl22 was absent in all analyzed species, and the gene ycf1 has been pseudo-genized in all Chinese chestnuts except C. pumlia. We analyzed the repeats and nucleotide substitutions in these plastomes and detected several highly variable regions. The phylogenetic analyses based on plastomes confirmed the monophyly of Castanea species.

1. Introduction

Chestnut (Castanea Mill.) is a genus of the Fagaceae that includes twelve to seventeen species distributed in deciduous forests in eastern North America, Europe, and Asia [1]. Chestnuts and the other members of the genus are ecologically and economically important nut and wood producing trees [2]. Four Castanea species are Asian; three are endemic to China: Chinese chestnut (Castanea mollissima Bl.), Seguin chestnut (Castanea Seguinii Dode), and Pearl chestnut or Henry chestnut (Castanea henryi (Skan) Rehd. et Wils.) [3,4]. These species grow across a broad range in China [5], from Jilin province in the North (40° N) to Hainan Island in the South (18° N), a range that includes a cold temperate zone, temperate zone, and subtropical zone, and 50 to ~2800 m a.s.l. [6]. Chinese chestnut is also widely cultivated around the world as a nut tree [2]. The most important chestnut species in terms of nut commerce are Chinese chestnut, European chestnut (Castanea sativa Mill.), and Japanese chestnut (Castanea crenata Sieb. et Zucc.) [6,7]. C. seguinii and C. henryi (sometimes called willow leaf or pearl chestnut) are cultivated in small quantities and are mainly used for variety improvement in breeding programs [8]. China is the world’s largest producer of edible chestnuts, and these chestnuts have been roasted over a hot flame as an attraction and food for tourists and locals. The cultivation of C. mollissima began 2000–3000 years ago [9], probably in China, but the species’ origins and genetic diversity are not well-characterized compared to many crops [10,11,12].
The chloroplast (cp) genome is haploid, has a simple and stable genetic structure, no (or very rare) recombination, and is usually uniparentally inherited (maternally in most angiosperms) [13,14,15,16]. Angiosperm cp are circular, 120–160 kb in length, and they typically include two inverted repeat (IR) regions separated by a large single copy (LSC) and a small single (SSC) copy region [17,18]. Universal primers can be used to amplify target sequences where most of the sequence variation is concentrated [15]. For these reasons and more, the plastid genome is used as a research model for evolutionary and comparative genomics [16]. Chloroplast genomes can provide species identification, sequences or SNPs to establish intra or interspecies differences, and they are often used for phylogeny and population genetic analysis [19,20,21,22]. Whole organelle sequences can potentially be used as “super barcodes” to differentiate lineages or varieties in breeding programs [23,24,25,26,27,28].
In the current classification of chestnuts based on Flora of China (2000) [10,11,12,29,30], C. mollissima and C. seguinii are joined (along with C. dentata) in section Castanea because they produce cupules (burs) containing three nuts; C. henryi is the sole member of section Hypocastanon [30], and C. pumila (a chinquapin) is in section Balanocastanon. In the past, breeders and orchardists relied on morphological traits to differentiate among chestnut species and varieties. With the development of DNA-based marker technology, the accurate identification of genotypes, including juvenile trees, became possible [31]. Comparative analysis of complete cp genomes (whole-plastid barcoding) is emerging as a practical tool for breeding, but also for gene-based phylogeny, genome-based phylogenomics, taxonomy, and biogeography [23,24,25,26,32]. The application of Next-Generation Sequence (NGS) technologies [33], especially the use of genomic capture strategies, lowers the cost of sequencing complete cpDNA sequences [34,35], and the high abundance of cpDNA allows total DNA to be used for sequencing without prior purification of the cp or cp genome [36,37].
In the present study, we compared eight Castanea cp genomes from four species to the cp of 35 other species. Our goal was to determine: (1) chloroplast genome structure of endemic Chinese Castanea species and provide a preliminary assessment of intergeneric variation; (2) the phylogenetic relationships among endemic Chinese Castanea; (3) highly variable regions that distinguish among endemic Chinese Castanea species. Our study will provide genetic resources for the resolution of Castanea species classification, forest population genetics, biogeographic analysis, and phylogenetic relationship in Fagaceae.

2. Materials and Methods

2.1. Plant Materials, DNA Extraction, and Sequences Sources

We collected two samples of wild C. mollissima growing in Taoshaba County, Shaanxi Province, China (Castanea mollissima1), and the Wuyi mountainous, Fujian Province, China (Castanea mollissima2); a further two C. seguinii and C. henryi samples from a botanic garden, Nanchang City, Jiangxi Province, China, were collected. Harvested fresh leaves were immediately placed in a container with silica gel and stored at −4 °C for further DNA extraction. All DNA samples were stored at the Evolutionary Botany Lab, Northwest University, Xi’an, China, extracted by a modified CTAB method. Samples named “Castanea mollissima3”, “Castanea seguinii1”, “Castanea henryi2”, and “Castanea pumila” were downloaded from the National Center for Biotechnology Information (NCBI), with GenBank accession numbers HQ336406, NC_033881, KY951992, and KM360048, respectively (Table 1). We deposited the samples of the complete chloroplast genome sequences to the NCBI GenBank (accessions MH998383, MH998384).

2.2. Illumina Sequencing, Assembly, and Annotation

Castanea cp genomes were sequenced using the Illumina Hiseq-PE150 sequencing platform (Novogene, Beijing, China). We used the program MITObim v1.7 to perform the reference-guided assemblies [38]. We used the complete chloroplast genome sequence of C. mollissma (GenBank number: HQ336406) as reference [28]. Annotations were performed using the online program Dual Organellar Genome Annotator (DOGMA) [39]. We adjusted the start and stop codons and boundaries between introns and exons using MAFFT v7.0.0 by comparison with homologous genes from other cp genomes [40]. Genes were identified using Geneious v8.0.2, which was also used to identify open reading frames (ORF) that were not previously annotated or identified [41]. The final circular Castanea cp genome map was drawn by Organellar Genome DRAW [42] (Figure 1).

2.3. Repeat Analysis

REPuter software was used to identify and visualize repeat structures [43]. Minimal repeat size was 30 bp, and the default identity of repeat structures was set to 90% similarity. Tandem Repeat Finder was used to locate and display tandem repeats in DNA sequences (>10 bp in length), with the alignment parameters “match, mismatch, and indels” set at 2, 7, and 7, respectively [44]. We used MISA to detect the microsatellites (SSR) in all 8 chloroplast genomes, including mono-(p1, one motif), di-(p2, two motifs), tri-(p3, three motifs), tetra-(p4, four motifs), penta-(p5, five motifs), hexa-(p6, six motifs) and polynucleotide (complex motifs) repeats [45]. MISA reported the type and location of each microsatellite and submitted the DNA sequence to Primer 3, a software that predicted primer sequence, position, melting temperature, and the expected PCR product size.

2.4. Hypervariable Hotspot Identification

We compared the four Castanea cp genomes to determine their average pairwise sequence divergence. Genomes were aligned using MAFFT v7, assuming collinearity [40]. Variable and parsimony-informative base sites were identified using MEGA 7.0 software [46]. The R package SPIDER version 1.5.0 was used to compare Castanea cp and to identify hypervariable cp regions using slideAnalyses, with C. mollissima as a reference [47]. We aligned all eight Castanea cp genomes to extract the continuous windows of a chosen size (800 bp and 200 bp) and perform pairwise distance (K2P) analyses of each window. The slideAnalyses function in SPIDER was used to analyze hypervariable regions, using the mean distance between each window across the hypervariable regions and the proportion of zero pairwise distance for each species in the matrix. Selective pressure non-synonymous (KA) and synonymous (KS) substitution rates (KA/KS) were computed with the codeml tool from PAML v4.0, using a YN00 model to test every gene sequence [48].

2.5. Analysis of DNA Barcodes

We characterized the hypervariable regions and the universal barcode regions rbcL, matK, and trnH-psbA using tree-building and K-mer statistics within the bbsik function in Barcoding R [49]. We built Maximum Likelihood (ML) trees for each hypervariable region and for region combinations using MEGA 7.0 [46].

2.6. Phylogenetic Analyses

Our phylogenetic analysis was based on five data sets: (1) the complete cp DNA sequences, (2) the protein coding sequences, (3) the LSC region, (4) the SSC region, and (5) the IR region. Four species (Quercus spinosa, Q. aliena, Trigonobalanus doichangensis, and Castanopsis echinocarpa) were used as outgroups. Trees were calculated using Maximum Likelihood (ML), Maximum Parsimony (MP), and Bayesian (BI) methods [50,51,52,53]. All of the Castanea cp genome sequences from the finalized dataset were aligned with MAFFT v7.0.0 [40]. The GTRAGMMA model was selected based on output from analysis of all five datasets using MODELTESTv3.7 software [54]. The Maximum Likelihood (ML) phylogenetic tree was produced using the GTR GAMMA model in RAxML v8.0 [55]. For all analyses, 10 independent ML searches were conducted, bootstrap support was estimated with 1000 bootstrap replicates, and bootstrap proportions were drawn on the tree with highest likelihood score from the 10 independent searches. Maximum Parsimony (MP) phylogenetic analyses were performed in PAUP4 using 1000 bootstrap replicates. BI trees were produced using a GTR GAMMA model in MrBayes v3.2.6, set to 1,000,000 generations and stopval = 0.01 with one cold and three incrementally heated Markov Chain Monte Carlo (MCMC) run simultaneously in two parallel runs sampling every 1000 generations [56,57]. The first 25% of the trees were discarded as burn-in. The remaining trees were used to generate the consensus tree. To further explore the phylogeny of the Castanea within the Fagales, we downloaded from NCBI the plastid genome sequence of 35 species in the Fagaceae, Betulaceae, Juglandaceae, and Myricaceae (Table S1), and constructed ML and BI trees along with their support rates.

3. Results

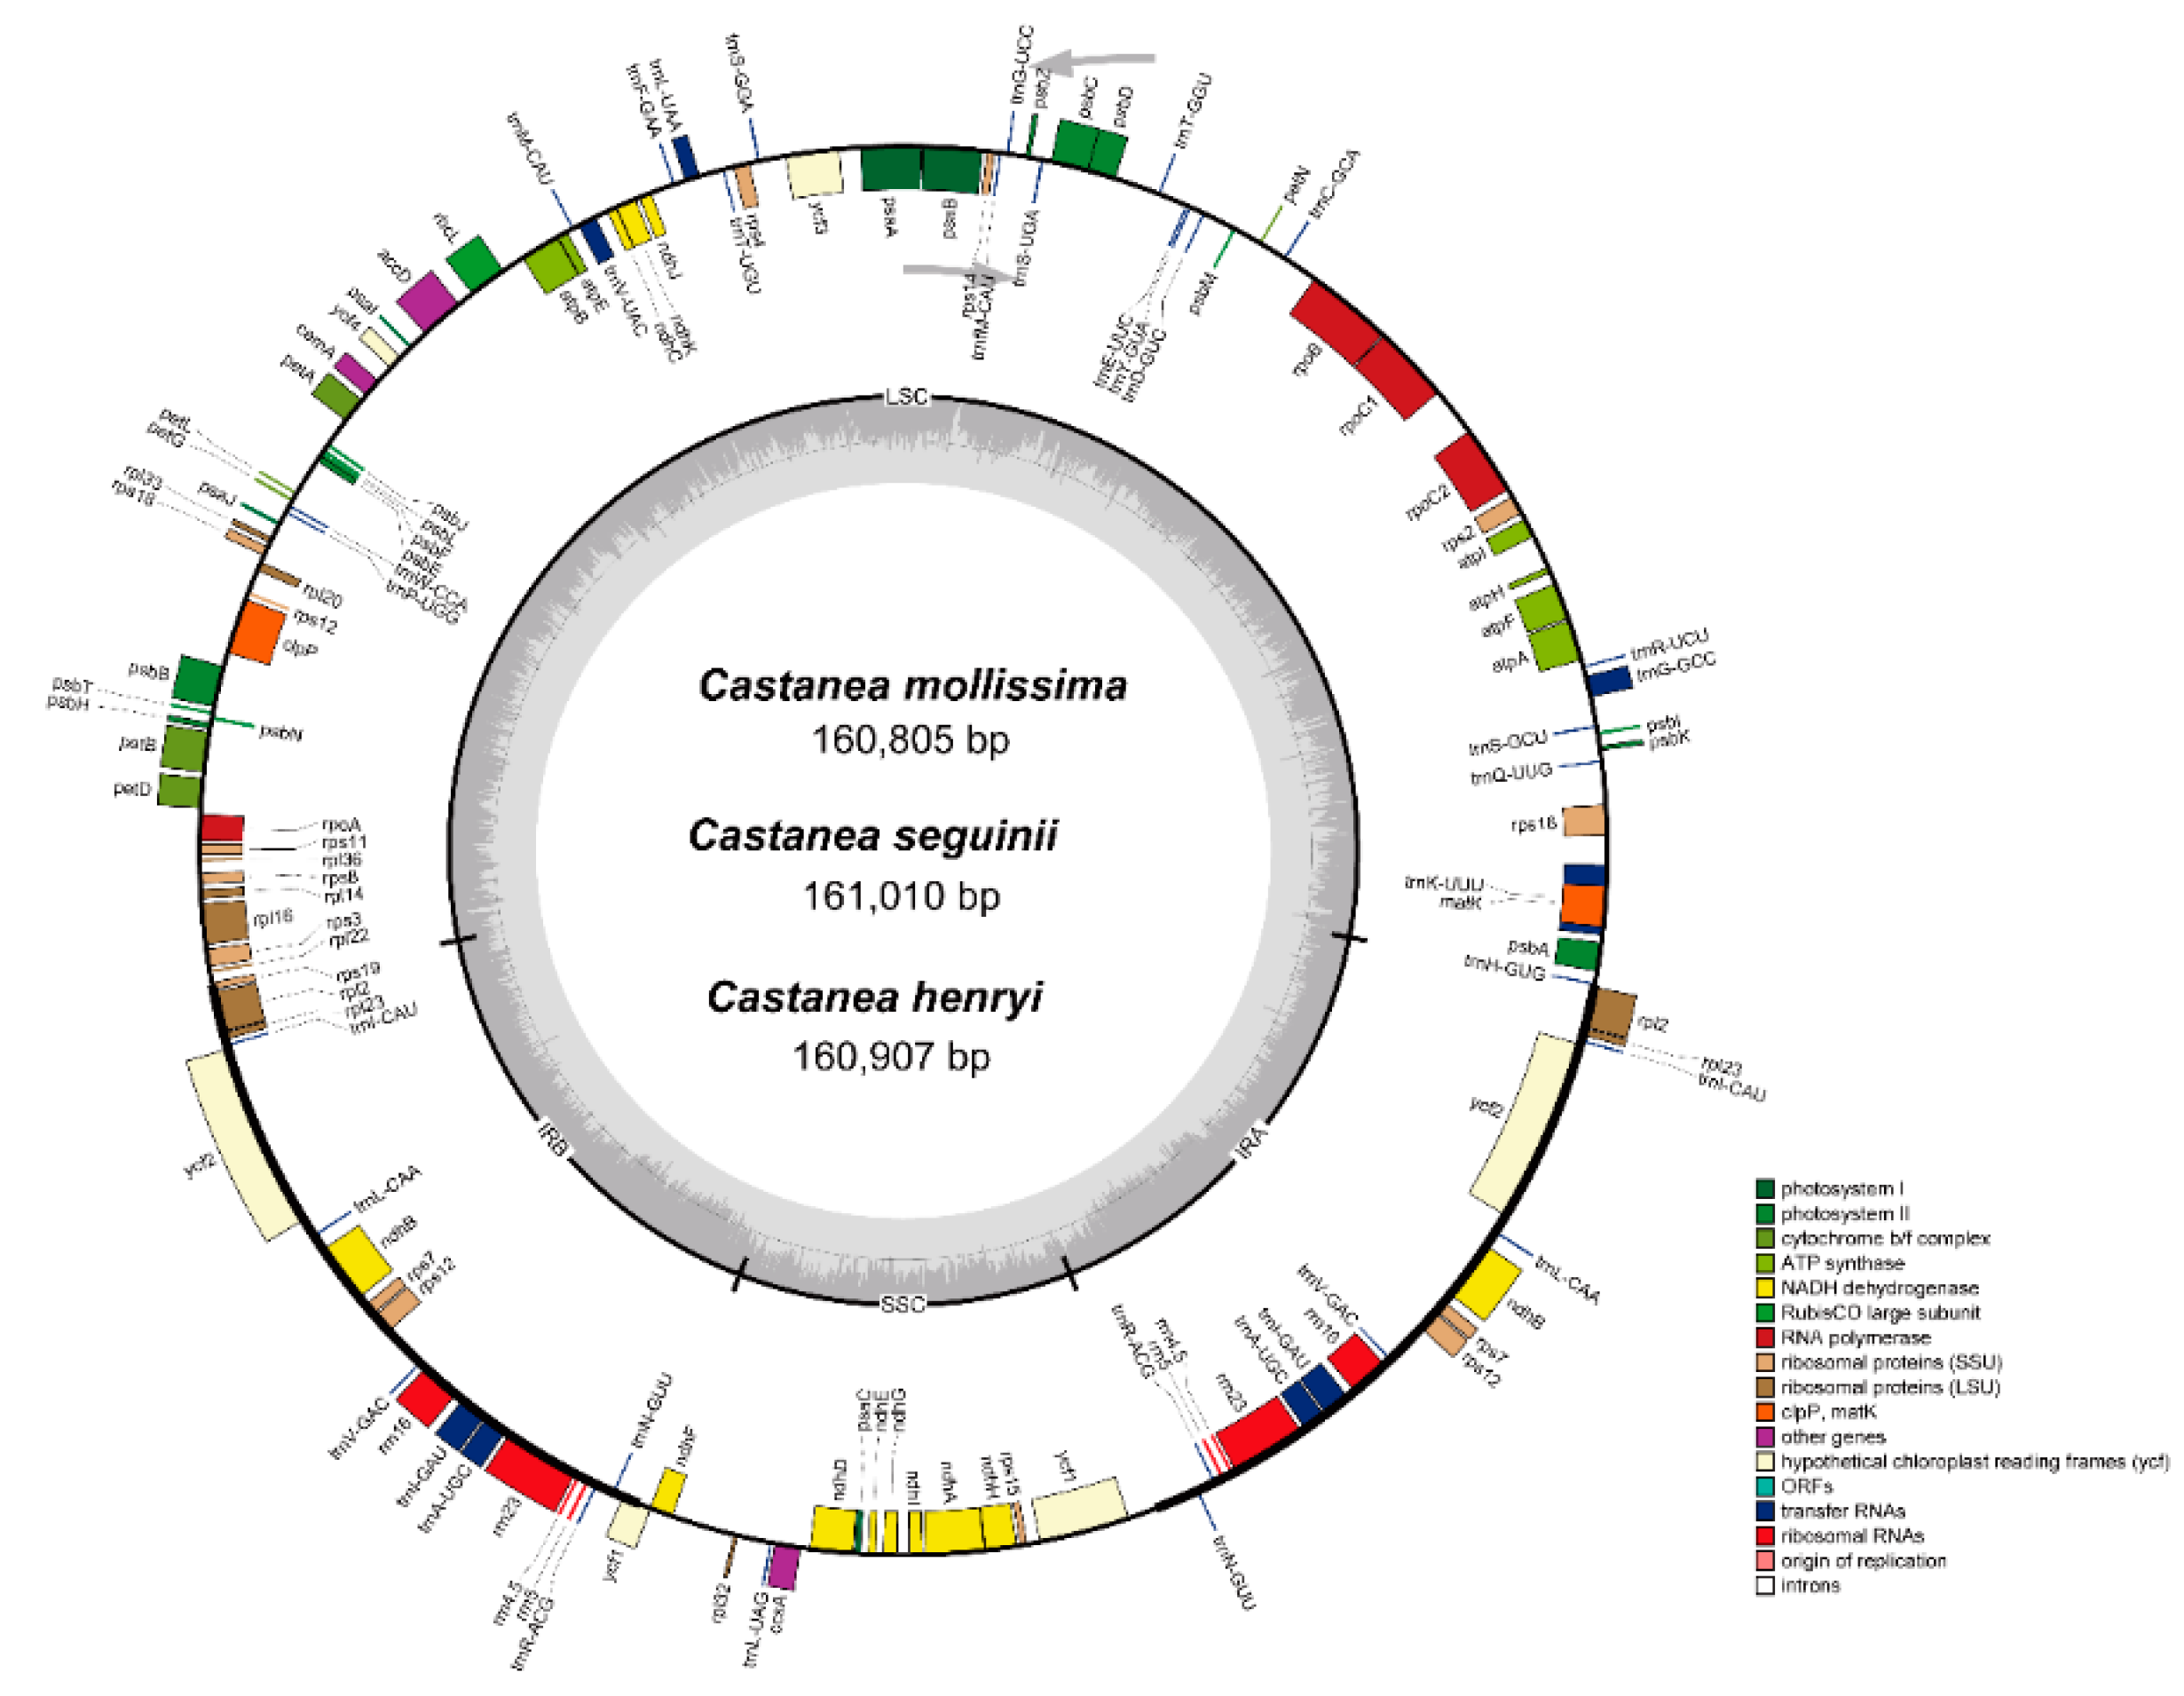
3.1. Characterization and Annotation of the Castanea cp Genomes

We obtained about 24 M raw reads for each genotype; coverage of each genome exceeded 150× (Table 1). After assembly and annotation, the cp genomes of Castanea showed a typical tetrad structure, consisting of a pair of inverted repeats (IRs) from 25,685 bp to 25,701 bp, a long single copy region (LSC) 90,440 bp to 90,560 bp, and a short single copy region (SSC) 18,970 bp to 19,049 bp. The chloroplast genomes of the five Castanea species ranged from 160,805 bp (C. mollissima 2) to 161,010 bp (C. seguinii2) (Figure 2), and the average GC content was 36.76%. All five species’ cp genomes contained 130 functional genes, including 37 genes encoding transfer RNA (tRNA) (seven genes in the IR region), and eight genes encoding ribosomal RNA (rRNA) (all located in IR region) (Table 1).
The protein-coding gene rpl22 was absent in all chestnut species in this study. The pseudogene ndhD was also found in C. mollissima 1 and C. mollissima2, and the pseudogene ndhK was found in C. henryi1 (Table 2).

3.2. Repeat and Simple Sequence Repeats Analyses

Castanea cp genomes contained numerous long repeats including forward repeats, complement repeats, reverse repeats, and palindromic repeats of at least 30 bp with a sequence identity ≥90% (Figure 3, Table S2). We observed 13 long repeats in one sample of C. mollissima and 14 long repeats in another, 16 forward repeats in one sample of C. henryi and 19 forward repeats in another, and 17 long repeats in C. pumila. In C. seguinii, reverse repeats were the most frequent. There was no difference among the species for the number of palindromic and reverse repeats (Figure 3). Each Castanea cp genome contained 7 to 13 tandem repeats (Figure 3, Table S3).
The cp genome of each Castanea species contained 108–120 SSRs at least 10 bp in length (Figure 3, Table S4). The number of SSRs of C. mollissima and C. henryi was similar. Most SSRs were located in noncoding parts of the LSC/SSC (about 95% of the total occurrences); SSRs located in coding regions were mainly in psbA, rpoC2, rpoB, ndhK (a pseudogene in C. henryi), atpB, accD, ndhD (a pseudogene in C. mollissima), ndhF, and ycf1 (a pseudogene in all Castanea evaluated).
The number and type of SSRs was similar for all Castanea species. For each species, mono-, di-, tri-, tetra-, penta-, hexa- and complex nucleotide SSRs were all detected (Figure 3). The mononucleotide, complex nucleotide, and dinucleotide SSRs accounted for about 90% of SSR loci. SSRs in Castanea cp genomes were especially rich in AT; nearly all mononucleotide repeats were A/T. The distribution of SSRs was also similar in all four species, approximately 70% of repeats were found in the intergenic region (IGS), 16% were in introns, and the fewest were found in protein coding genes (CDS). We identified 37 SSR loci that were identically located in all eight genotypes of four species of Castanea. Of these, 17 showed sufficient sequence identity in the flanking region to permit identification of common primer pairs for amplification (Table S5).

3.3. Selective Pressures in the Evolution of Castanea

We evaluated 77 protein-coding genes in the four Castanea species’ cp genomes for their synonymous and non-synonymous rates of all possible pairwise comparisons. We found three genes (matK, ndhD, and rpoC2,) under positive selection (KA/KS ratio >1) (Figure 4a). The KA/KS ratio for matK was 3.59. The KA/KS ratio for ndhD was 1.41 and for rpoC2 it was 1.18 (Figure 4a). We found that these genes were not under selection pressure in all species. For example, in the process of pairwise alignment, the ndhB gene in C. pumila was under selection based on the KA/KS >1 criterion. The ndhB gene did not show significant selection pressure in Chinese Castanea species’ cp genomes, but it has been positively selected in the American chestnut (C. dentata) (Table S6). The value KA/KS for matK and ndhD indicated no evidence of selection based on pairwise comparison of Castanea species’ cp genomes (Table S6).

3.4. Genome Sequence Divergence

Eight complete Castanea cp genomes were used to obtain a contrast matrix based on 161,889 bp of sequence. The alignment of the eight cp genomes revealed high sequence similarity across the Castanea cp genomes. We identified 213, 84, and 129 parsimony informative sites in the complete cp genomes, coding genes, and non-coding regions, respectively. As expected, the protein coding regions (CDS) were more conserved than the intergenic regions (IGS). Within the CDS region, the ten genes with the highest variability were psbI, petG, ycf1, ndhA, rps16, accD, petD, rpl19, and rpl2. Some IGS also showed high levels of variation, including rpl2-trnH-GUC, ndhJ- ndhK, accD-psaI, petA-psbJ, rps3-rpl22, ndhF-rpl32, psbZ-trnG-UCC, rpoB-trnC-GCA, atpF intron, trnS-GCU-trnG-GCC, psaJ-rpl33, ndhG- ndhI, and trnH-GUC-psbA (Figure 4b,c, Table S7).
Five loci (trnK-UUU-rps16, psbM-trnD-GUU, rbcL-accD, petA-psbJ, and rpl2) showed high interspecies distances (Figure 5a); the same five loci showed low levels of zero cells, indicating where it was rare for comparisons among the eight cp genomes to show no difference (Figure 5b).

3.5. Phylogenetic Analyses

The phylogenies of Castanea were examined based on five datasets (the whole cp genome, protein-coding genes, the LSC region, the SSC region, and the IR region) from the eight Castanea cp genomes and four published Fagaceae species (used as outgroups) (Figure 6; Figure S1). Evolutionary trees based on the above data were constructed using maximum likelihood (ML), maximum parsimony (MP), and Bayesian (BI) methods. All five datasets and methods produced trees that were highly consistent (Figure 6; Figure S1). The closer relationships of C. henryi and C. mollissima (versus C. seguinii or C. pumila) was clear.
The tree constructed to represent the whole Fagales was strongly supported (Figure 6) and similar in topology, irrespective of method (ML or Bayesian). Each family clustered into monophyletic clades. The Fagaceae formed a distinct clade from the Myricaceae, Betulaceae, and Juglandaceae. The Myricaceae and Juglandaceae formed a clade distinct from the Betulaceae. All of the analyzed families within Fagales had bootstrap values (BS) = 1 (Figure 6). The relationships among the samples based on the chloroplast datasets was the same as the system of classification proposed by APG IV [58].

3.6. Structural and Sequence Comparisons of cp Genomes in Castanea

The IR region of eight Castanea cp genomes was highly conserved, but we identified structure variation in the IR/SC boundary where rps19-rpl2-trnH and ycf1-ndhF were located. Rpl22 is non-functional in Castanea [28], but in some Fagaceae rpl22 is completely absent and in others it is functional. For example, of the four outgroups used in this study, the rpl22 gene was found in Quercus aliena, Quercus spinosa, and Castanopsis echinocarpa, but not in Trigonobalanus doichangensis.
In the C. henryi1 genome, ndhK pseudo-genized containing multiple stop codons in the protein coding region (Figure S2a). In C. mollissima1 and C. mollissima2, the gene region encoding ndhD was not interrupted with stop codons, but it does not encode a functional protein, so the ndhD gene has evolved into a pseudogene in C. mollissima (Figure S2b).

4. Discussion

4.1. Structural and Sequence Comparisons of cp Genomes in Castanea

We sequenced the cp genomes of four genotypes of Chinese Castanea species and compared them to three published reference sequences. Our goal was to begin to characterize genetic variation in cp genomes both within and among Castanea species. Our results are foundational for future studies of Castanea, including the molecular identification, evolution, and breeding of Chinese or World Castanea species. We also identified and characterized the size and locations of repeat sequences within the cp genomes of four Chinese Castanea species. The structure and location of repeats is associated with genome evolution [26,59] and as such has phylogenetic relevance [25,26]. Extensive information about the nature and location of sequence variants in Chestnut could open the door to ultra-barcoding, a method where detailed sequence data can be used to trace the lineage, source, or adaptive phenotypes of a sample [24].
Most angiosperm chloroplasts contain 74 protein-coding genes; an additional three are found in a few species [25,26,27,28]. The four Castanea cp genomes we sequenced revealed 84 predicted protein-coding genes (77 unigenes were predicted to be protein coding). The protein-coding gene rpl22 was absent in all chestnut species in this study, which is consistent with Jansen et al. (2005) [28].

4.2. Phylogenetic Analysis

Our phylogenetic analysis based on whole cp genome sequence data was in concordance with the current phylogeny of Castanea and of the Fagales in general, irrespective of the method (MP, ML, BI) (Figure 6) [25,26]. The strong genomic similarity of C. henryi and C. mollissima was confirmed. Based on morphology, C. seguinii and C. mollissima appear most closely related [6,7], but the genomic evidence is that the C. seguinii cp reflects an early diverging of Chinese Castanea species (Figure 6). The accepted phylogeny of Chinese Castanea also reflects their current geospatial distribution, and there is no evidence for natural hybrid zones [59].

4.3. DNA Barcode Development

DNA barcodes have been widely used in evolutionary and phylogenetical studies for both plants and animals [49]. We compared cp genomes of Castanea using slideAnalyses to calculate genetic distance across a moving 800 bp window [47]. This method identified five regions of the Castanea genome that might be useful for barcoding: trnK-UUU-rps16, psbM-trnD-GUU, rbcL-accD, petA-psbJ, and rpl2 (Figure 4 and Figure 5). We suggest the sequence of rbcL, matK, petA-psbJ as a barcode. The lengths of the three selected sequences are respectively 1428 bp, 1508 bp, and 1072 bp. There are 4, 14, and 75 mutation sites and 4, 10, and 68 informative sites within these loci. The barcode would be useful for distinguishing American chestnut (C. dentata) and Chinese chestnuts, and as such could provide a method to track the source of hybrids used in breeding. Simple sequence repeats (SSRs) were highly variable among and within Castanea species. As such, these have value for population genetics and other applications requiring high levels of polymorphism.

5. Conclusions

In this study, we sequenced and compared the complete chloroplast genomes of eight genotypes from four Castanea species. The length of the chloroplast genomes ranged from 160,805 bp to 161,010 bp. Comparative analysis revealed that rpl22 was absent in all analyzed species and the gene ndhK has been pseudo-genized in all Chinese chestnuts except C. pumlia. High levels of genetic variation at trnK-UUU-rps16, psbM-trnD-GUU, rbcL-accD, petA-psbJ, and rpl2 make these regions excellent candidates for barcode development within chestnut taxa.

Supplementary Materials

The following are available online at https://www.mdpi.com/article/10.3390/f12070861/s1. Figure S1. Phylogeny trees of eight Castanea individuals plus four taxa based on (a) protein-coding genes (CDS), (b) inverted repeats (IR) regions, (c) large single-copy (LSC) region, and (d) small single-copy (SSC) regions. Bootstrap values (%) are shown above branches. Figure S2. The genetic variation of the pseudogene ndhK and ndhD in the eight Castanea chloroplast genomes. (a) The pseudogene ndhK in Castanea henryi1 chloroplast genome. (b) Alignment of pseudogene ndhD in the eight Castanea chloroplast genomes. Table S1. List of chloroplast genome sequences included in the phylogenetic analyses. Table S2. Analysis of palindromic repeats and dispersed repeats in eight Castanea chloroplast genomes. Table S3. Analysis of tandem repeats in eight Castanea chloroplast genomes. Table S4. List of simple sequence repeats in eight Castanea chloroplast genomes. Table S5. Primer sequences for SSR loci. Table S6. KA/KS ratio for protein coding sequences for eight Castanea individuals. Table S7. Indel and single nucleotide polymorphisms (SNP) in the eight Castanea chloroplast genomes.

Author Contributions

Conceptualization, P.Z. and H.Z.; methodology, P.Z., H.Z. and X.G.; software, X.G., H.Z. and P.Z.; validation, P.Z., K.W., S.Z., and H.Z.; formal analysis, H.Z. and X.G.; investigation, H.Z. and P.Z.; resources, P.Z. and S.Z.; data curation, H.Z., X.G. and P.Z.; writing—original draft preparation, H.Z., X.G. and P.Z.; writing—review and editing, H.Z., S.Z., K.W. and P.Z.; supervision, P.Z. and S.Z.; project administration, P.Z.; funding acquisition, P.Z. All authors have read and agreed to the published version of the manuscript.

Funding

This work was supported by the National Natural Science Foundation of China (No. 32070372; No. 41471038), the Program for Excellent Young Academic Backbones funding by Northwest University, Natural Science Foundation of Shaanxi Province of China (2019JM-008), and Opening Foundation of Key Laboratory of Resource Biology and Biotechnology in Western China (Northwest University), Ministry of Education (ZSK2018009).

Data Availability Statement

The chloroplast genome sequences of Castanea species were submitted to the National Center for Biotechnology Information (NCBI), the accession numbers were: MH998384 and MH998383.

Acknowledgments

This work was supported in part by the United States Department of Agriculture, Forest Service. The authors wish to thank Yiheng Hu, Meng Dang, and Xiaojia Feng for sample collection and software support. Mention of a trademark, proprietary product, or vendor does not constitute a guarantee or warranty of the product by the U.S. Department of Agriculture and does not imply its approval to the exclusion of other products or vendors that also may be suitable.

Conflicts of Interest

The authors declare no conflict of interest.

References

  1. Dane, F.; Lang, P.; Huang, H.; Fu, Y. Intercontinental genetic divergence of Castanea species in eastern Asia and eastern North America. Heredity 2003, 91, 314–321. [Google Scholar] [CrossRef] [Green Version]
  2. Xing, Y.; Liu, Y.; Zhang, Q.; Nie, X. Hybrid de novo genome assembly of Chinese chestnut (Castanea mollissima). GigaScience 2019, 8, giz112. [Google Scholar] [CrossRef]
  3. Barakat, A.; DiLoreto, D.S.; Zhang, Y.; Smith, C.; Baier, K.; Powell, W.A.; Wheeler, N.; Sederoff, R.; Carlson, J.E. Comparison of the transcriptomes of American chestnut (Castanea dentata) and Chinese chestnut (Castanea mollissima) in response to the chestnut blight infection. BMC Plant Biol. 2009, 9, 51. [Google Scholar] [CrossRef] [PubMed] [Green Version]
  4. Huang, H. Review of current research of the world Castanea species and importance of germplasm conservation of China native Castanea species. J. Wuhan Bot. Res. 1998, 16, 171–176. [Google Scholar]
  5. Liu, G.; Fang, J. Spatial patterns of chestnut (Castanea millissima) and its species geographical distribution in China. Acta Ecol. Sin. 2001, 21, 164–170. [Google Scholar]
  6. Rutter, P.A.; Miller, G.; Payne, J.A. Chestnuts (Castanea). Genet. Resour. Temp. Fruit Nut. Crop. 1991, 290, 761–790. [Google Scholar] [CrossRef]
  7. Conedera, M.; Krebs, P.; Tinner, W.; Pradella, M.; Torriani, D. The cultivation of Castanea sativa (Mill.) in Europe, from its origin to its diffusion on a continental scale. Veg. Hist. Archaeobot. 2004, 13, 161–179. [Google Scholar] [CrossRef] [Green Version]
  8. Graves, A.H. Relative blight resistance in species and hybrids of Castanea. Phytopathology 1950, 40, 1125–1131. [Google Scholar]
  9. Moore, J.N.; Ballington, J.R. Genetic resources of temperate fruit and nut crops. Sci. Hortic. Amst. 1990, 20, 974. [Google Scholar]
  10. Jacobs, D.F.; Dalgleish, H.J.; Nelson, C.D. A conceptual framework for restoration of threatened plants: The effective model of American chestnut (Castanea dentata) reintroduction. New Phytol. 2013, 197, 111–140. [Google Scholar] [CrossRef] [Green Version]
  11. Huang, H.; Dane, F.; Norton, J.D. Allozyme diversity in Chinese, Seguin and American chestnut (Castanea spp.). Theor. Appl. Genet. 1994, 88, 981–985. [Google Scholar] [CrossRef] [PubMed]
  12. Casasoli, M.; Mattioni, C.; Cherubini, M.; Villani, F. A genetic linkage map of European chestnut (Castanea sativa Mill.) based on RAPD, ISSR and isozyme markers. Theo. Appl. Genet. 2001, 102, 1190–1199. [Google Scholar] [CrossRef]
  13. Wang, Y.; Wang, S.; Liu, Y.; Yuan, Q.; Sun, J.; Guo, L. Chloroplast genome variation and phylogenetic relationships of Atractylodes species. BMC Genom. 2021, 22, 103. [Google Scholar]
  14. Neuhaus, H.E.; Emes, M.J. Nonphotosynthetic metabolism in plastids. Annu. Rev. Plant Biol. 2000, 51, 111–140. [Google Scholar] [CrossRef] [PubMed]
  15. Wicke, S.; Schneeweiss, G.M.; Müller, K.F.; Quandt, D. The evolution of the plastid chromosome in land plants: Gene content, gene order, gene function. Plant Mol. Biol. 1996, 76, 273–297. [Google Scholar] [CrossRef] [PubMed] [Green Version]
  16. Dong, W.; Xu, C.; Cheng, T.; Lin, K.; Zhou, S. Sequencing angiosperm plastid genomes made easy: A complete set of universal primers and a case study on the phylogeny of Saxifragales. Genome Biol. Evol. 2013, 5, 989–997. [Google Scholar] [CrossRef] [Green Version]
  17. Palmer, J.D. Comparative organization of chloroplast genomes. Annu. Rev. Genet. 1985, 19, 325–354. [Google Scholar] [CrossRef]
  18. Ding, S.; Dong, X.; Yang, J.; Guo, C.; Cao, B.; Guo, Y.; Hu, G. Complete chloroplast genome of Clethra fargesii Franch, an original sympetalous plant from central China: Comparative analysis, adaptive evolution, and phylogenetic relationships. Forests 2021, 12, 441. [Google Scholar] [CrossRef]
  19. Zhang, Y.J.; Ma, P.F.; Li, D.Z. High-throughput sequencing of six bamboo chloroplast genomes: Phylogenetic implications for temperate woody bamboos (Poaceae: Bambusoideae). PLoS ONE 2011, 6, e20596. [Google Scholar] [CrossRef] [Green Version]
  20. Drew, B.T.; Ruhfel, B.R.; Smith, S.A.; Moore, M.J.; Briggs, B.G.; Gitzendanner, M.A.; Soltis, P.S.; Soltis, D.E. Another look at the root of the angiosperms reveals a familiar tale. Syst. Biol. 2014, 63, 368–382. [Google Scholar] [CrossRef] [Green Version]
  21. Souza, U.J.B.D.; Vitorino, L.C.; Bessa, L.A.; Silva, F.G. The complete plastid genome of Artocarpus camansi: A high degree of conservation of the plastome structure in the family Moraceae. Forests 2020, 11, 1179. [Google Scholar] [CrossRef]
  22. Alexander, L.; Woeste, K.E. Pyrosequencing of the northern red oak (Quercus rubra L.) chloroplast genome reveals high quality polymorphisms for population management. Tree Genet. Genomes 2014, 10, 803–812. [Google Scholar] [CrossRef]
  23. Zhang, Y.; Du, L.A.; Liu, J.; Chen, L.; Wu, W.; Hu, W.; Zhang, K.; Kim, S.-C.; Yang, T.J. The complete chloroplast genome sequences of five Epimedium species: Lights into phylogenetic and taxonomic analyses. Front. Plant Sci. 2016, 7, 306. [Google Scholar] [CrossRef] [Green Version]
  24. Kane, N.; Sveinsson, S.; Dempewolf, H.; Yang, J.Y.; Zhang, D.P.; Johannes, M.; Engels, M.; Cronk, Q. Ultra-barcoding in cacao (Theobroma spp.; Malvaceae) using whole chloroplast genomes and nuclear ribosomal DNA. Am. J. Bot. 2012, 99, 320–329. [Google Scholar] [CrossRef] [Green Version]
  25. Yang, J.B.; Tang, M.; Li, H.T.; Zhang, Z.R.; Li, D.Z. Complete chloroplast genome of the genus Cymbidium: Lights into the species identification, phylogenetic implications and population genetic analyses. BMC Evol. Biol. 2013, 13, 84. [Google Scholar] [CrossRef] [Green Version]
  26. Hu, Y.; Woeste, K.E.; Zhao, P. Completion of the chloroplast genomes of five Chinese Juglans and their contribution to chloroplast phylogeny. Front. Plant Sci. 2017, 7, 1955. [Google Scholar] [CrossRef] [Green Version]
  27. Yuan, J.; Zhu, Q.; Liu, B. Phylogenetic and biological significance of evolutionary elements from metazoan mitochondrial genomes. PLoS ONE 2014, 9, e84330. [Google Scholar] [CrossRef] [PubMed]
  28. Jansen, R.K.; Saski, C.; Lee, S.B.; Hansen, A.K.; Daniell, H. Complete plastid genome sequences of three Rosids (Castanea, Prunus, Theobroma): Evidence for at least two independent transfers of rpl22 to the nucleus. Mol. Biol. Evol. 2011, 28, 835–847. [Google Scholar] [CrossRef] [PubMed] [Green Version]
  29. LaBonte, N.R.; Zhao, P.; Woeste, K. Signatures of selection in the genomes of Chinese chestnut (Castanea mollissima Blume): The roots of nut tree domestication. Front. Plant Sci. 2018, 9, 810. [Google Scholar] [CrossRef] [PubMed] [Green Version]
  30. Yang, J.; Tang, X.; Tu, B.; Xie, P. RAPD analysis of three Chinese endemic Castanea species. J. Fruit Sci. 2004, 3, 275–277. [Google Scholar]
  31. Gupta, P.K.; Roy, J.K.; Prasad, M. Single nucleotide polymorphisms: A new paradigm for molecular marker technology and DNA polymorphism detection with emphasis on their use in plants. Curr. Sci. 2001, 80, 524–535. [Google Scholar]
  32. Drouin, G.; Daoud, H.; Xia, J. Relative rates of synonymous substitutions in the mitochondrial, chloroplast and nuclear genomes of seed plants. Mol. Phylogenet. Evol. 2008, 49, 827–831. [Google Scholar] [CrossRef]
  33. Goodwin, S.; McPherson, J.D.; McCombie, W.R. Coming of age: Ten years of next-generation sequencing technologies. Nat. Rev. Genet. 2016, 17, 333. [Google Scholar] [CrossRef] [PubMed]
  34. Straub, S.C.; Parks, M.; Weitemier, K.; Fishbein, M.; Cronn, R.C.; Liston, A. Navigating the tip of the genomic iceberg: Next-generation sequencing for plant systematics. Am. J. Bot. 2012, 99, 349–364. [Google Scholar] [CrossRef] [Green Version]
  35. Dodsworth, S. Genome skimming for next-generation biodiversity analysis. Trends Plant Sci. 2015, 20, 525–527. [Google Scholar] [CrossRef]
  36. Pakull, B.; Mader, M.; Kersten, B.; Ekué, M.R.M.; Dipelet, U.G.B.; Paulini, M.; Bouda, H.N.; Degen, B. Development of nuclear, chloroplast and mitochondrial SNP markers for Khaya sp. Conserv. Genet. Resour. 2016, 8, 283–297. [Google Scholar] [CrossRef]
  37. Dane, F.; Wang, Z.; Goertzen, L. Analysis of the complete chloroplast genome of Castanea pumila var. pumila, the Allegheny chinkapin. Tree Genet. Genomes 2015, 11, 14. [Google Scholar] [CrossRef]
  38. Hahn, C.; Bachmann, L.; Chevreux, B. Reconstructing mitochondrial genomes directly from genomic next-generation sequencing reads—A baiting and iterative mapping app. Nucleic Acids Res. 2013, 41, e129. [Google Scholar] [CrossRef] [Green Version]
  39. Wyman, S.K.; Jansen, R.K.; Boore, J.L. Automatic annotation of organellar genomes with DOGMA. Bioinformatics 2004, 20, 3252–3255. [Google Scholar] [CrossRef] [Green Version]
  40. Katoh, K.; Standley, D.M. MAFFT multiple sequence alignment software version 7: Improvements in performance and usability. Mol. Biol. Evol. 2013, 30, 772–780. [Google Scholar] [CrossRef] [Green Version]
  41. Kearse, M.; Moir, R.; Wilson, A.; Stones-Havas, S.; Cheung, M.; Sturrock, S.; Buxton, S.; Cooper, A.; Markowitz, S.; Duran, C.; et al. Geneious Basic: An integrated and extendable desktop software platform for the organization and analysis of sequence data. Bioinformatics 2012, 28, 1647–1649. [Google Scholar] [CrossRef]
  42. Lohse, M.; Drechsel, O.; Kahlau, S.; Bock, R. OrganellarGenomeDRAW—A suite of tools for generating physical maps of plastid and mitochondrial genomes and visualizing expression data sets. Nucleic Acids Res. 2013, 41, W575–W581. [Google Scholar] [CrossRef] [PubMed]
  43. Kurtz, S.; Choudhuri, J.V.; Ohlebusch, E.; Schleiermacher, C.; Stoye, J.; Giegerich, R. REPuter: The manifold applications of repeat analysis on a genomic scale. Nucleic Acids Res. 2001, 29, 4633–4642. [Google Scholar] [CrossRef] [Green Version]
  44. Benson, G. Tandem repeats finder: A program to analyze DNA sequences. Nucleic Acids Res. 1999, 27, 573–580. [Google Scholar] [CrossRef] [Green Version]
  45. Beier, S.; Thiel, T.; Munch, T.; Scholz, U.; Mascher, M. MISA-web: A web server for microsatellite prediction. Bioinformatics 2017, 33, 2583–2585. [Google Scholar] [CrossRef] [PubMed] [Green Version]
  46. Kumar, S.; Stecher, G.; Tamura, K. MEGA7: Molecular Evolutionary Genetics Analysis Version 7.0 for Bigger Datasets. Mol. Biol. Evol. 2016, 33, 1870–1874. [Google Scholar] [CrossRef] [PubMed] [Green Version]
  47. Brown, S.D.J.; Collins, R.A.; Boyer, S.; Lefort, M.C.; Malumbres-Olarte, J.; Vink, C.J.; Cruickshank, R.H. Spider: An R package for the analysis of species identity and evolution, with particular reference to DNA barcoding. Mol. Ecol. Resour. 2012, 12, 562–565. [Google Scholar] [CrossRef]
  48. Yang, Z. PAML4: Phylogenetic analysis by maximum likelihood. Mol. Biol. Evol. 2007, 24, 1586–1591. [Google Scholar] [CrossRef] [PubMed] [Green Version]
  49. Zhang, A.B.; Hao, M.D.; Yang, C.Q.; Shi, Z.Y.; Yu, D. BarcodingR: An integrated rpackage for species identification using DNA barcodes. Methods Ecol. Evol. 2017, 8, 627–634. [Google Scholar] [CrossRef] [Green Version]
  50. Cheng, L.; Huang, W.; Lan, Y.; Cao, Q.; Su, S.; Zhou, Z.; Wang, J.; Liu, J.; Hu, G. The complete chloroplast genome sequence of the wild chinese chestnut (Castanea mollissima). Conserv. Genet. Resour. 2018, 10, 291–294. [Google Scholar] [CrossRef]
  51. Zhu, C.; Shi, F.; Wang, M.; Zhao, Y.; Chen, Y.; Geng, G. The complete chloroplast genome of a variety of Castanea mollissima ‘Hongli’ (Fagaceae). Mitochondrial DNA B 2019, 4, 993–994. [Google Scholar] [CrossRef] [Green Version]
  52. Zulfiqar, S.; Gao, X.X.; Sun, Y.W.; Hu, G.J.; Zhao, P. The complete chloroplast genome sequence of Seguin chestnut (Castanea seguinii). Mitochondrial DNA B 2019, 4, 342–343. [Google Scholar] [CrossRef]
  53. Gao, X.X.; Yan, F.; Liu, M.; Zulfiqar, S.; Zhao, P. The complete chloroplast genome sequence of an endemic species Pearl chestnut (castanea henryi). Mitochondrial DNA B 2019, 4, 551–552. [Google Scholar] [CrossRef] [Green Version]
  54. Posada, D.; Crandall, K.A. Modeltest: Testing the model of DNA substitution. Bioinformatics 1991, 14, 817–818. [Google Scholar] [CrossRef] [PubMed] [Green Version]
  55. Stamatakis, A. RAxML version 8: A tool for phylogenetic analysis and post-analysis of large phylogenies. Bioinformatics 2014, 30, 1312–1313. [Google Scholar] [CrossRef] [PubMed]
  56. Huelsenbeck, J.P.; Ronquist, F. MRBAYES: Bayesian inference of phylogenetic trees. Bioinformatics 2001, 17, 754–755. [Google Scholar] [CrossRef] [PubMed] [Green Version]
  57. Ronquist, F.; Huelsenbeck, J.P. MrBayes 3: Bayesian phylogenetic inference under mixed models. Bioinformatics 2003, 19, 1572–1574. [Google Scholar] [CrossRef] [Green Version]
  58. Angiosperm Phylogeny Group (APG IV). An update of the Angiosperm Phylogeny Group classification for the orders and families of flowering plants: APG IV. Bot. J. Linn. Soc. 2016, 181, 1–20. [Google Scholar] [CrossRef] [Green Version]
  59. Ping, L.; Dane, F.; Kubisiak, T.L.; Huang, H. Molecular evidence for an Asian origin and a unique westward migration of species in the genus Castanea via Europe to North America. Mol. Phylogenet. Evol. 2007, 43, 49–59. [Google Scholar]
Figure 1. Gene map of the complete cp genome of Castanea. The grey arrows indicate the direction of transcription of the two DNA strands. A GC-content graph is depicted within the inner circle. The circle inside the GC content graph marks the 50% threshold. The maps were created using Organellar Genome DRAW [42].
Forests 12 00861 g001
Figure 2. Overview and comparison of the border regions of the cp genomes of C. mollissima, C. seguinii, C. henryi, and C. pumila. The black, angled arrows indicate the size in base pairs of the border genes, the numbers over the blue arrows indicate the size of LSC, IRb, IRa, and SSC, respectively. The gene names show the genomic location of the transitions between major structural elements.
Forests 12 00861 g002
Figure 3. Analysis of repeated sequences in four Castanea species’ cp genomes. (a) Long repeat sequences of at least 30 bp with a sequence identity ≥90%. (b) Tandem repeats of at least 10 bp in cpDNA. (c) Number of loci containing SSR repeats (simple sequence repeats) in Castanea individuals. (d) Distribution of SSR repeats in the intergenic regions (IGS), coding regions (CDS), and introns of each Castanea species. “p1”, “p2”, “p3”, “p4”, “p5”, “p6” and “c” refer to mononucleotide, dinucleotide, trinucleotide, tetranucleotide, pentanucleotide, hexanucleotide, and complex nucleotide repeats.
Forests 12 00861 g003
Figure 4. (a) The KA/KS ratio of 81 chloroplast genes shared by Castanea species. (b,c) Visualization of pairwise alignment of complete cp DNA sequences of each of seven genotypes with C. mollissima1 (reference genome). VISTA-based similarity plots portraying the sequence identity of the four Castanea species with the reference C. mollissima are shown. The annotation of protein-encoding genes is provided for C. mollissima on top (based on the C. mollissima Shaanxi data).
Forests 12 00861 g004
Figure 5. Identification of most divergent cp sequences among four Castanea species. (a) Mean distance between sequences from pairwise comparisons of all eight cp genomes based on 800 bp windows. (b) The proportion pairwise comparisons of eight Castanea cp genomes with zero pairwise distance over sliding 800 bp windows. In both (a) and (b) regions of maximum differentiation are indicated in red.
Forests 12 00861 g005
Figure 6. Phylogenetic trees (Maximum likelihood, Maximum Parsimony) based on whole-plastome sequences. (a) The phylogenetic tree based on 37 individuals using Bayesian (BI) and Maximum Likelihood (ML) methods. (b) Results of phylogenetic analysis of sequence data from the chloroplasts of eight Castanea individuals and four outgroups using Bayesian (BI), Maximum Likelihood (ML), and Maximum Parsimony (MP), methods. Bootstrap values (%) are shown above branches based on two and three methods.
Forests 12 00861 g006
Table 1. Summary statistics for eight Castanea cp genomes.
Genome FeatureCastanea mollissima1Castanea mollissima2Castanea mollissima3Castanea seguinii1Castanea seguinii2Castanea henryi1Castanea henryi2Castanea pumila
Size (bp)160,877160,805160,799160,869161,010160,907160,807160,603
Coding (bp)107,291112,516112,340112,299109,149112,525112,720110,191
Noncoding (bp)53,58648,28948,45948,57051,86148,38248,08750,412
LSC length (bp)90,44090,43590,43290,49790,56090,53190,39490,249
SSC length (bp)19,04919,00018,99718,97019,04818,99818,96318,976
IR length (bp)51,38851,37051,37051,40251,40251,37851,45051,378
Coding (bp)107,291101,832103,345103,249109,511101,843101,104102,650
Noncoding (bp)53,58658,97357,45457,62051,49959,06459,70357,953
Number of genes 130130130130130130130132
Protein-coding genes8282838383828384
tRNA genes3737373737373737
rRNA genes88888888
GC content (%)36.80%36.80%36.80%36.80%36.70%36.70%36.80%36.80%
Sequencing PlatformHiseq-PE150Hiseq-PE150The bridging shotgun/Hiseq 4000Hiseq 2500//
Raw reads24,367,94424,367,945//24,367,94724,367,946//
Raw Base(G)116.6//8.39//
NCBI Accession//HQ336406NC_033881MH998383MH998384KY951992KM360048
Table 2. Gene contents in eight Castanea individuals’ cp genomes.
Category of GenesGene GroupGene Name
Self-replicationRibosomal RNA genes23S16S5S4.5S
Transfer RNA genestrnK-UUUtrnI-GAUtrnI-GAUtrnA-UGCtrnG-GCC
trnL-UAAtrnS-UGAtrnL-UAGtrnY-GUAtrnC-GCA
trnL-CAAtrnH-GUGtrnD-GUCtrnfM-CAUtrnW-CCA
trnP-UGGtrnI-CAUtrnR-ACGtrnI-CAUtrnE-UUC
trnT-UGUtrnF-GAAtrnQ-UUGtrnR-UCUtrnT-GGU
trnM-CAUtrnV-GACtrnN-GUUtrnV-GACtrnG-UCC
trnV-UAC
Small subunit of ribosomerps12rps16rps2rps3rps4
rps7rps11rps8rps18rps15
rps14rps19
Large subunit of ribosomerpl16rpl2rpl14rpl20rpl23
rpl33rpl32rpl36
DNA-dependent RNA polymeraserpoC1rpoC2rpoArpoB
Genes for photosynthesisSubunits of NADH-dehydrogenasendhAndhBndhDndhHndhF
ndhKndhGndhIndhJndhC
ndhE
Subunits of photosystem IpsaApsaBpsaCpsaIpsaJ
ycf1ycf2ycf4ycf3
Subunits of photosystem IIpsbBpsbCpsbApsbDpsbE
psbHpsbZpsbKpsbNpsbJ
psbFpsbLpsbIpsbTpsbM
Subunits of cytochrome b/f complexpetBpetDpetApetGpetL
petN
Subunits of ATP synthaseatpAatpBatpFatpIatpE
atpH
Subunits of rubiscorbcL
Other genesMaturasematK
ProteaseclpP
Envelope membrane proteincemA
Subunit of Acetyl-CoA-carboxylaseaccD
C-type cytochrome synthesis geneccsA
Publisher’s Note: MDPI stays neutral with regard to jurisdictional claims in published maps and institutional affiliations.

